Embed Size (px)
Citation preview

2
Mission, Values and Vision ..................................................................................................................................... 3
Letter from the Commissioner .............................................................................................................................. 4
Commissioners ............................................................................................................................................................ 5
History and Organizational Structure ................................................................................................................ 6
Financial Institutions Board .................................................................................................................................. 7
Administrative Services Branch ........................................................................................................................... 8
Division of Depository Institutions ..................................................................................................................... 9
99th Annual Banking Report ................................................................................................................................. 9
Annual Consolidated Statement of Assets - State Banks and Thrifts .................................................. 10
Consolidated Condition and Income Data - State Banks and Thrifts .................................................. 12
Total Assets - State Banks and Thrifts ............................................................................................................ 13
Trust Assets - State-Chartered Independent Trust Companies ............................................................ 16
Trust Assets - State-Chartered Bank Trust Departments ........................................................................ 17
77th Annual Credit Union Report ..................................................................................................................... 18
Annual Consolidated Statement of Assets - State-Chartered Credit Unions .................................... 19
Selected Composite Operating Ratios– State Charted Credit Unions ................................................. 20
Report of Condition - State-Chartered Credit Unions ............................................................................... 22
Division of Nondepository Institutions .......................................................................................................... 23
3rd Annual Consumer Protection Report ...................................................................................................... 23
13th Annual Compliance Branch Report ...................................................................................................... 24
Annual Consolidated Statement of Assets - Consumer Loan Companies .......................................... 25
Consolidated Report of Condition - Consumer Loan Companies ......................................................... 26
Annual Consolidated Statement of Assets - Industrial Loan Companies ........................................... 27
Consolidated Report of Condition - Industrial Loan Companies .......................................................... 28
25th Annual Securities Report ........................................................................................................................... 29
Licensing & Registration Branch Report ........................................................................................................ 30
2011 Broker-Dealers ............................................................................................................................................. 30
2011 Investment Advisers ................................................................................................................................... 30
Compliance Branch Report.................................................................................................................................. 34
Enforcement Branch Report ............................................................................................................................... 35
Prosecution Assistance Unit Report ................................................................................................................ 35
Table of Contents

3
Vision
The Department will:
Be a leader in developing and implementing sound public policies
Be an effective, proactive, credible and respected regulatory agency
Be a leader in educating and protecting the investing, depositing and borrowing public
Encourage capital formation and economic development
Achieve a work environment that encourages career opportunities, professional development
and equitable compensation
Be responsive to emerging industry trends and issues, and implement appropriate strategies
Values
The Department of Financial Institutions (DFI) and its employees have a tradition of outstanding public service. Seven core values guide our employees to fulfill the Department’s mission and vision: Effective and Efficient Operation We will wisely use the resources entrusted to us by the Commonwealth to ensure maximum output is achieved for each dollar invested. Responsibility We accept the serious nature of the tasks (or duties) entrusted to us, and we are willing to be held accountable for the actions we choose. Professionalism We will provide quality services, which will be achieved through excellence, accountability, innovation and a highly skilled workforce. Integrity We will act honestly, fairly and impartially. Teamwork We will achieve organizational goals through open, respon-sive communication and cooperation with co-workers, other state government agencies and federal regulatory authorities. Respect We will be sensitive to the viewpoints and efforts of others, and we will strive to meet the needs of all of our stakeholders. Initiative We will identify potential issues that may impact the financial services industry, formulate appropriate solutions and proactively respond to change.
Mission, Values and Vision
“The Department of Financial Institutions’ mission is to serve
Kentucky residents by maintaining a stable financial industry, continuing effective
and efficient regulatory oversight, promoting consumer
confidence, and encouraging economic opportunities.”
MISSION STATEMENT

4
Dear Gov. Steven L. Beshear,
As commissioner of the Kentucky Department of Financial Institutions (DFI), I am pleased to present the 2011 Annual Report. The following pages contain statistical and historical information regarding the financial services industry in Kentucky.
Kentucky’s financial institutions continue to successfully deal with the economic turmoil that began in 2007. The economy is beginning to recover, and the unemployment rate continues to decline. The Dodd-Frank Act that was passed by Congress in 2010 is starting to be implemented, and increased federal regulations are creating new challenges for all of the industries that we regulate. The DFI continues to work closely with the industries we regulate to interpret, understand and implement the significant changes to the rules and regulations.
The Securities Division led a multi-state investigation into the practices of a securities firm which result-ed in approximately $11 million in restitution to Kentucky investors. We also worked with local and federal prosecutors on criminal cases involving violations of the Securities Act against companies and individuals and obtained numerous guilty verdicts and orders of restitution to investors. In addition, the Securities Division is prepared to assume regulatory oversight of all investment advisors (IA) with as-sets under management between $25 million and $100 million as mandated by the Dodd-Frank Act.
The Nondepository Division continues its proven track record of overseeing mortgage lending opera-tions in Kentucky. We also have participated in multi-state mortgage examinations, which helped dis-cover and correct underwriting and servicing problems.
The DFI, in conjunction with financial institutions in Kentucky, remains committed to finding solutions to economic challenges facing the Commonwealth. While profitability measures are below historical levels, the return on average assets for banks and credit unions in Kentucky remain stable. As economic conditions improve and the unemployment rate declines, asset quality has improved. Sound risk man-agement practices have positioned our state-chartered financial institutions to function as a catalyst for economic growth.
The DFI remains a leader in the financial regulatory process. Several of our senior managers serve in nation-al leadership roles, and we have built valuable relationships with the industries we regulate and our federal regulatory counterparts. These relationships have helped the DFI seek and implement alternative strategies to deal with problems. This annual report indicates that Kentucky’s financial services industry remains com-mitted to helping our communities and residents deal with economic uncertainty. The DFI has a dedicated staff, and we will fulfill our mission of maintaining a stable financial industry, providing effective and effi-cient regulatory oversight, promoting consumer confidence and encouraging economic opportunities.
Sincerely,
Charles A. Vice, Commissioner
Steven L. Beshear, Governor
Robert D. Vance, Secretary
Charles Vice, Commissioner
PUBLIC PROTECTION CABINET DEPARTMENT OF FINANCIAL INSTITUTIONS
5
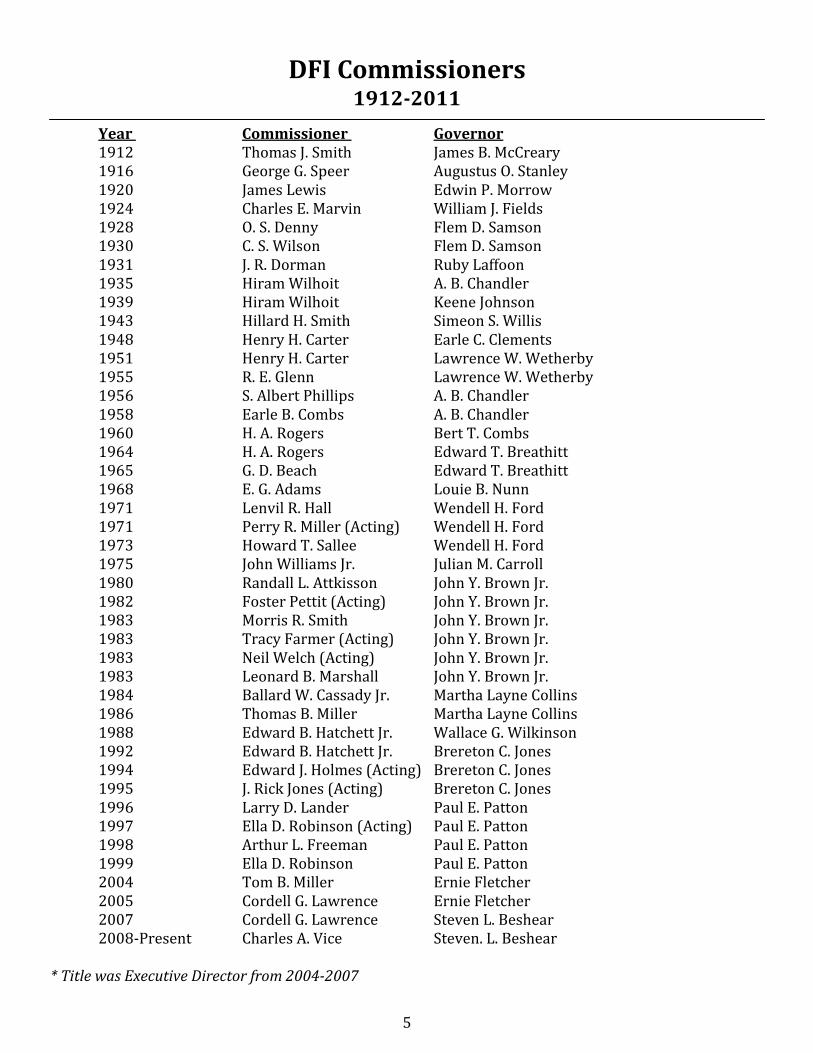
Year Commissioner Governor 1912 Thomas J. Smith James B. McCreary 1916 George G. Speer Augustus O. Stanley 1920 James Lewis Edwin P. Morrow 1924 Charles E. Marvin William J. Fields 1928 O. S. Denny Flem D. Samson 1930 C. S. Wilson Flem D. Samson 1931 J. R. Dorman Ruby Laffoon 1935 Hiram Wilhoit A. B. Chandler 1939 Hiram Wilhoit Keene Johnson 1943 Hillard H. Smith Simeon S. Willis 1948 Henry H. Carter Earle C. Clements 1951 Henry H. Carter Lawrence W. Wetherby 1955 R. E. Glenn Lawrence W. Wetherby 1956 S. Albert Phillips A. B. Chandler 1958 Earle B. Combs A. B. Chandler 1960 H. A. Rogers Bert T. Combs 1964 H. A. Rogers Edward T. Breathitt 1965 G. D. Beach Edward T. Breathitt 1968 E. G. Adams Louie B. Nunn 1971 Lenvil R. Hall Wendell H. Ford 1971 Perry R. Miller (Acting) Wendell H. Ford 1973 Howard T. Sallee Wendell H. Ford 1975 John Williams Jr. Julian M. Carroll 1980 Randall L. Attkisson John Y. Brown Jr. 1982 Foster Pettit (Acting) John Y. Brown Jr. 1983 Morris R. Smith John Y. Brown Jr. 1983 Tracy Farmer (Acting) John Y. Brown Jr. 1983 Neil Welch (Acting) John Y. Brown Jr. 1983 Leonard B. Marshall John Y. Brown Jr. 1984 Ballard W. Cassady Jr. Martha Layne Collins 1986 Thomas B. Miller Martha Layne Collins 1988 Edward B. Hatchett Jr. Wallace G. Wilkinson 1992 Edward B. Hatchett Jr. Brereton C. Jones 1994 Edward J. Holmes (Acting) Brereton C. Jones 1995 J. Rick Jones (Acting) Brereton C. Jones 1996 Larry D. Lander Paul E. Patton 1997 Ella D. Robinson (Acting) Paul E. Patton 1998 Arthur L. Freeman Paul E. Patton 1999 Ella D. Robinson Paul E. Patton 2004 Tom B. Miller Ernie Fletcher 2005 Cordell G. Lawrence Ernie Fletcher 2007 Cordell G. Lawrence Steven L. Beshear 2008-Present Charles A. Vice Steven. L. Beshear * Title was Executive Director from 2004-2007
DFI Commissioners 1912-2011
6
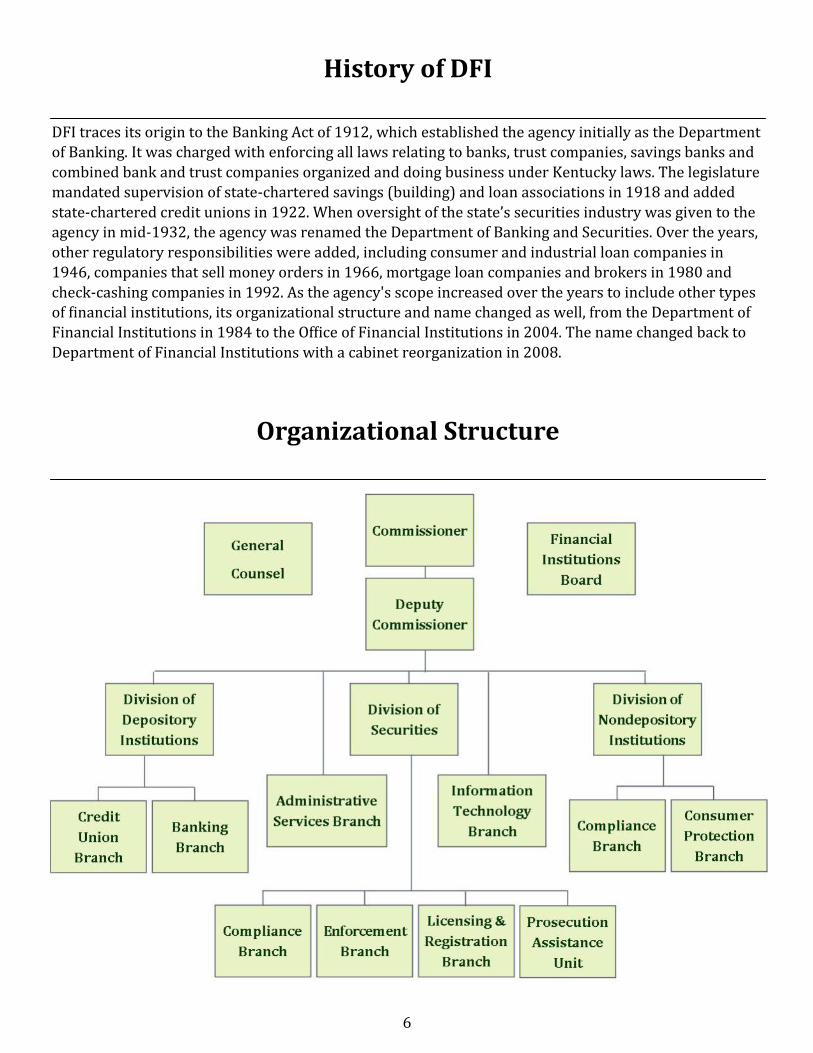
DFI traces its origin to the Banking Act of 1912, which established the agency initially as the Department of Banking. It was charged with enforcing all laws relating to banks, trust companies, savings banks and
combined bank and trust companies organized and doing business under Kentucky laws. The legislature mandated supervision of state-chartered savings (building) and loan associations in 1918 and added
state-chartered credit unions in 1922. When oversight of the state’s securities industry was given to the agency in mid-1932, the agency was renamed the Department of Banking and Securities. Over the years,
other regulatory responsibilities were added, including consumer and industrial loan companies in 1946, companies that sell money orders in 1966, mortgage loan companies and brokers in 1980 and
check-cashing companies in 1992. As the agency's scope increased over the years to include other types of financial institutions, its organizational structure and name changed as well, from the Department of Financial Institutions in 1984 to the Office of Financial Institutions in 2004. The name changed back to
Department of Financial Institutions with a cabinet reorganization in 2008.
History of DFI
Organizational Structure

7
The Financial Institutions Board is a statutory body that serves in an advisory capacity to the governor and the commissioner of the Department of Financial Institutions. The board consists of representatives
of all segments of Kentucky’s financial industry and the public at large and is chaired by the commissioner. The definition of the board’s duties can be found in KRS 286.1-013.
Financial Institutions Board
Chairman Charles A. Vice Commissioner Department of Financial Institutions Banking Industry Charles Beach III Beattyville, KY Appointed Dec. 10, 2007 Term Expires Oct. 10, 2011 William Frederick Brashear II Hyden, KY Appointed Jan. 9, 2009 Term Expires Oct. 10, 2012 Frank Ramsey Jr. Madisonville, KY Appointed Jan. 9, 2009 Term Expires Oct. 10, 2012
Katherine Reese Capps Pineville, KY Appointed Dec. 10, 2007 Term Expires Oct. 10, 2011 Mark A. Gooch Pikeville, KY Appointed Jan. 9, 2009 Term Expires Oct. 10, 2012 Credit Union Representative Valerie C. Brown Bowling Green, KY Appointed June 2, 2011 Term Expires Oct. 10, 2014 Consumer Finance Jerry D. Pyle Crofton, KY Appointed June 2, 2011 Term Expires Oct. 10, 2014
Public at Large William L. Tatum Jr. Lebanon, KY Appointed Nov. 23, 2009 Term Expires Oct. 10, 2013 David S. Beck Louisville, KY Appointed Jan. 9, 2009 Term Expires Oct. 10, 2012 Branden Gross Lexington, KY Appointed Nov. 23, 2009 Term Expires Oct. 10, 2013 Securities Industry Kevin P. Walsh Walton, KY Appointed Dec. 10, 2007 Term Expires Oct. 10, 2011
2011 DFI Board, left to right: Kevin Walsh, Charles Vice, Mark Gooch, Valerie Brown, Bill Tatum, W. Fred Brashear, Jerry Pyle, Charles Beach, David Beck.

8
Employees in the Administrative Services Branch provide administrative support to the department in the following areas:
Facilities management — Frankfort office and field offices in Eddyville, Bowling Green, Louisville and Frankfort
Fiscal management Operations and quality control Records management Staff development: coordinating employee training, continuing education and examiner certification programs Safety Officer Budgeting Revenue and expenditure analysis Personnel
With the 2011 expansion, DFI hired 14 new employees. DFI is successfully training those new employ-ees. Our emphasis continues to be on recruiting and retaining qualified employees to maintain uninter-rupted delivery of services to the industry and the public. Nine examiners left or retired in fiscal year 2011. A primary agency goal is to hire, train and maintain a highly informed and capable staff. One of the ways the department seeks to accomplish this goal is through staff development by identifying training needs, developing and delivering agency specific training, coordinating and/or sharing training and education resources with other state and federal agencies, and assuring equal access to continuing education and training opportunities for all employees. Through continued innovation and open communication, DFI believes its past accomplishments will carry forward into the future and enable this agency to deliver the highest possible quality of training and career development opportunities and employee support services. Also, DFI maintains a presence at career days and job fairs. As it has for many years, the department maintains a toll-free telephone number. Consumers and indus-try representatives wanting to speak with a member of the agency’s staff are encouraged to call 800-223-2579 with their questions and concerns. Information for consumers, regulated industries and the general public is available on the department’s website at http://kfi.ky.gov. Business hours are from 8 a.m. to 5 p.m. Eastern time at our office located at 1025 Capital Center Drive, Suite 200, Frankfort, KY 40601.
Administrative Services Branch

9
99th Annual Banking Report
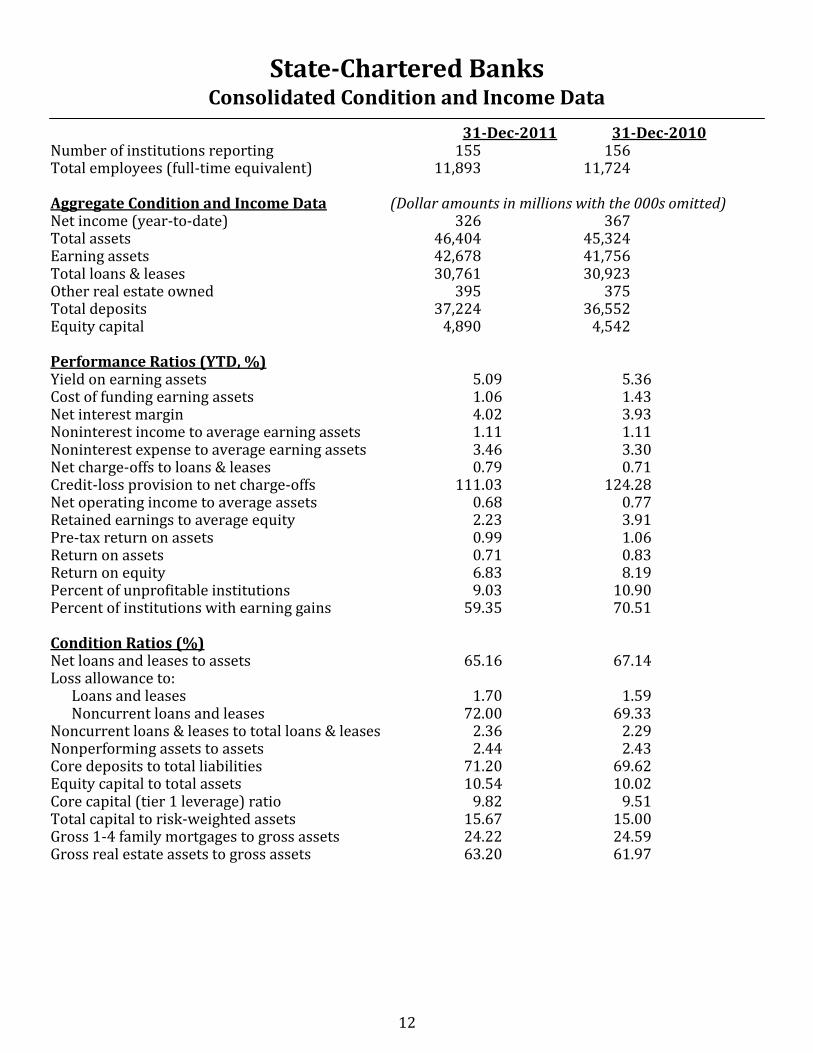
The Bank Branch supervises the activities of 155 Kentucky state-chartered banks, ranging in asset size from $22.1 million to $3.6 billion. The majority of Kentucky state-chartered banks remain in a relatively stable financial condition compared to our contiguous states and nationally. As the economic recovery continues to stall, state-chartered banks that possess large commercial real estate concentrations have lagged behind their state-chartered peers in performance. No state-chartered bank failed in Kentucky during 2011. Net income fell in 2011, as the statewide ratio of return on assets (ROA) declined from 0.83 percent in 2010 to 0.71 percent in 2011. The state-chartered ROA compares favorably to the national average of 0.65 percent for 2011. Although statewide ROA declined, the net interest margin improved slightly year over year, increasing from 3.93 percent to 4.02 percent. The average allowance for loan and lease losses was 1.70 percent in 2011 compared to 1.59 percent for 2010. Capital levels have improved slightly year over year as indicated by the tier 1 leverage capital position which equaled 9.82 percent in 2011 compared with 9.51 percent in 2010. Additionally, total risk-based capital for Kentucky state-chartered banks averaged 15.67 percent compared to 15.00 percent in 2010.
Bank Changes
During 2011 there was one bank merger. The United Bank of Pendleton County merged with Bank of Kentucky located in Crestview Hills, Ky.
Division of Depository Institutions Bank Branch

10
Year ............................................ Total Assets
Sept. 4, 1912 ........................ $110,096,102.83
Sept. 3, 1913 ............................ 112,556,338.09
Sept. 12, 1914 .......................... 110,516,100.67
Nov. 10, 1915 ......................... 110,068,034.26
Aug. 17, 1916 .......................... 120,217,111.75
Sept. 7, 1917 ........................... 152,490,422.93
Sept. 5, 1918 ........................... 175,361,452.29
Sept. 5, 1919 ........................... 213,365,256.47
Sept. 13, 1920 ......................... 227,231,768.46
June 30, 1921 ........................... 220,117,518.15
June 30, 1922 ........................... 222,284,937.92
June 30, 1923 ........................... 257,447,342.36
June 30, 1924 ........................... 260,394,024.52
June 30, 1925 ........................... 269,730,816.68
June 30, 1926 ........................... 278,619,057.34
June 30, 1927 ........................... 308,521,323.67
June 30, 1928 ........................... 341,300,174.09
June 30, 1929 ........................... 385,559,868.28
June 30, 1930 ........................... 364,849,233.33
June 30, 1931 ........................... 295,881,257.76
June 30, 1932 ........................... 248,031,078.12
June 30, 1933 ........................... 231,577,905.49
June 30, 1934 ........................... 239,624,124.68
June 30, 1935 ........................... 229,781,437.48
June 30, 1936 ........................... 250,997,016.66
June 30, 1937 ........................... 270,699,778.60
June 30, 1938 ............................ 252,251,968.59
June 30, 1939 ........................... 266,594,369.49
June 30, 1940 ........................... 273,977,674.22
June 30, 1941 ........................... 297,360,610.22
June 30, 1942 ........................... 340,903,872.17
June 30, 1943 ........................... 477,658,367.10
June 30, 1944 ........................... 578,775,786.77
June 30, 1945 ........................... 904,485,435.10
June 30, 1946 ........................... 941,787,755.13
June 30, 1947 ........................... 898,858,508.44
June 30, 1948 ........................... 932,808,480.54
June 30, 1949 ........................... 933,714,814.70
June 30, 1950 ........................... 953,843,874.72
June 30, 1951 ....................... 1,002,285,106.04
June 30, 1952 ....................... 1,081,217,820.20
Year ............................................ Total Assets
June 30, 1953 ....................... 1,125,336,205.82
June 30, 1954 ....................... 1,167,432,270.01
June 30, 1955 ....................... 1,211,811,536.25
June 30, 1956 ....................... 1,220,534,082.10
June 30, 1957 ....................... 1,294,391,352.88
June 30, 1958 ....................... 1,383,757,204.28
June 30, 1959 ....................... 1,402,074,237.64
June 30, 1960 ....................... 1,439,285,742.07
June 30, 1961 ....................... 1,416,812,042.56
June 30, 1962 ....................... 1,539,385,203.23
June 30, 1963 ....................... 1,682,807,021.85
June 30, 1964 ....................... 1,798,326,242.98
June 30, 1965 ....................... 1,932,620,428.05
June 30, 1966 ....................... 2,157,183,512.81
June 30, 1967 ....................... 2,490,156,359.19
June 30, 1968 ....................... 2,703,101,033.03
June 30, 1969 ....................... 3,067,136,736.70
June 30, 1970 ....................... 3,259,015,862.86
June 30, 1971 ....................... 3,793,329,845.00
June 30, 1972 ....................... 4,277,132,990.00
June 30, 1973 ....................... 4,973,878,479.44
June 30, 1974 ....................... 5,696,240,528.60
June 30, 1975 ....................... 6,300,190,296.19
June 30, 1976 ....................... 6,550,032,000.00
June 30, 1977 ....................... 7,431,081,000.00
June 30, 1978 ....................... 8,371,752,000.00
June 30, 1979 ....................... 9,507,372,000.00
June 30, 1980 .................... 10,700,084,000.00
June 30, 1981 .................... 11,968,250,000.00
June 30, 1982 .................... 12,878,728,000.00
June 30, 1983 .................... 13,724,157,000.00
June 30, 1984 .................... 15,171,523,000.00
June 30, 1985 .................... 16,448,822,000.00
June 30, 1986 .................... 17,869,731,000.00
June 30, 1987 .................... 19,709,513,000.00
June 30, 1988 .................... 20,984,582,000.00
Dec. 31, 1988 ..................... 22,103,771,000.00
Dec. 31, 1989 ..................... 23,570,033,000.00
Dec. 31, 1990 ..................... 25,058,852,000.00
Dec. 31, 1991 ..................... 24,145,642,000.00
Dec. 31, 1992 ..................... 23,932,903,000.00
State-Chartered Banks Annual Consolidated Statement of Assets
11
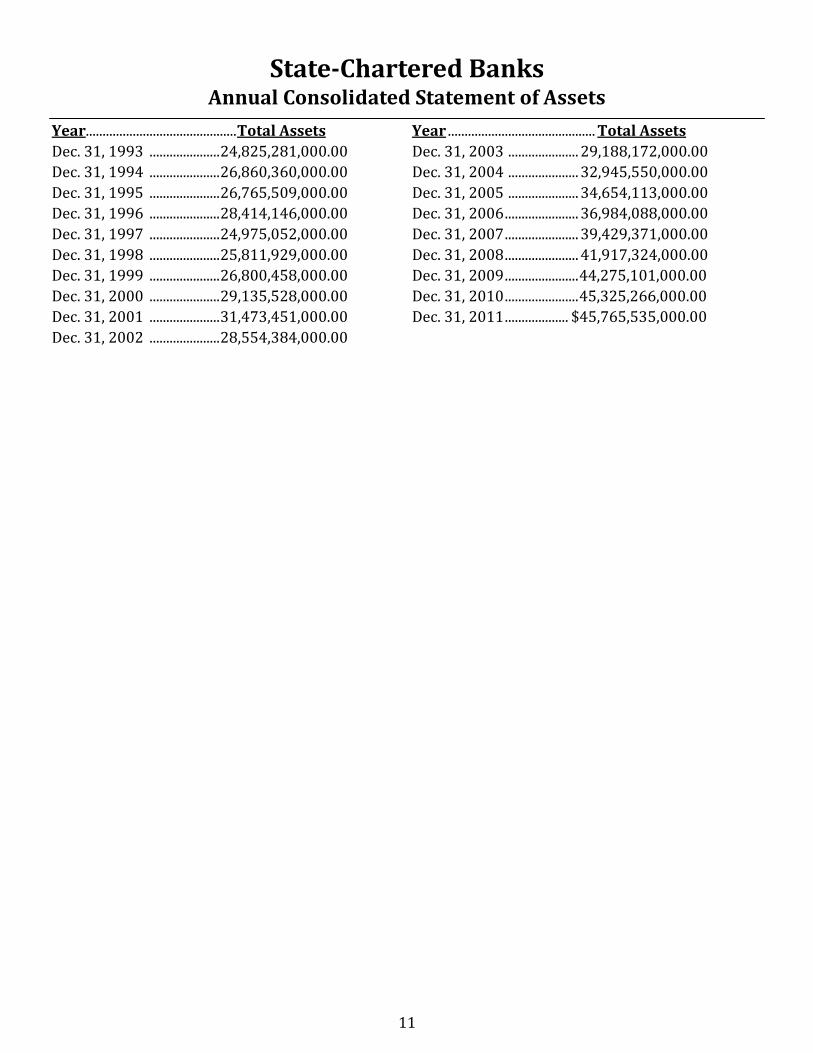
State-Chartered Banks Annual Consolidated Statement of Assets
Year............................................. Total Assets
Dec. 31, 1993 ..................... 24,825,281,000.00
Dec. 31, 1994 ..................... 26,860,360,000.00
Dec. 31, 1995 ..................... 26,765,509,000.00
Dec. 31, 1996 ..................... 28,414,146,000.00
Dec. 31, 1997 ..................... 24,975,052,000.00
Dec. 31, 1998 ..................... 25,811,929,000.00
Dec. 31, 1999 ..................... 26,800,458,000.00
Dec. 31, 2000 ..................... 29,135,528,000.00
Dec. 31, 2001 ..................... 31,473,451,000.00
Dec. 31, 2002 ..................... 28,554,384,000.00
Year ............................................ Total Assets
Dec. 31, 2003 ..................... 29,188,172,000.00
Dec. 31, 2004 ..................... 32,945,550,000.00
Dec. 31, 2005 ..................... 34,654,113,000.00
Dec. 31, 2006 ...................... 36,984,088,000.00
Dec. 31, 2007 ...................... 39,429,371,000.00
Dec. 31, 2008 ...................... 41,917,324,000.00
Dec. 31, 2009 ...................... 44,275,101,000.00
Dec. 31, 2010 ...................... 45,325,266,000.00
Dec. 31, 2011 ................... $45,765,535,000.00
12
31-Dec-2011 31-Dec-2010 Number of institutions reporting 155 156 Total employees (full-time equivalent) 11,893 11,724 Aggregate Condition and Income Data (Dollar amounts in millions with the 000s omitted) Net income (year-to-date) 326 367 Total assets 46,404 45,324 Earning assets 42,678 41,756 Total loans & leases 30,761 30,923 Other real estate owned 395 375 Total deposits 37,224 36,552 Equity capital 4,890 4,542 Performance Ratios (YTD, %) Yield on earning assets 5.09 5.36 Cost of funding earning assets 1.06 1.43 Net interest margin 4.02 3.93 Noninterest income to average earning assets 1.11 1.11 Noninterest expense to average earning assets 3.46 3.30 Net charge-offs to loans & leases 0.79 0.71 Credit-loss provision to net charge-offs 111.03 124.28 Net operating income to average assets 0.68 0.77 Retained earnings to average equity 2.23 3.91 Pre-tax return on assets 0.99 1.06 Return on assets 0.71 0.83 Return on equity 6.83 8.19 Percent of unprofitable institutions 9.03 10.90 Percent of institutions with earning gains 59.35 70.51
Condition Ratios (%) Net loans and leases to assets 65.16 67.14 Loss allowance to: Loans and leases 1.70 1.59 Noncurrent loans and leases 72.00 69.33 Noncurrent loans & leases to total loans & leases 2.36 2.29 Nonperforming assets to assets 2.44 2.43 Core deposits to total liabilities 71.20 69.62 Equity capital to total assets 10.54 10.02 Core capital (tier 1 leverage) ratio 9.82 9.51 Total capital to risk-weighted assets 15.67 15.00 Gross 1-4 family mortgages to gross assets 24.22 24.59 Gross real estate assets to gross assets 63.20 61.97
State-Chartered Banks Consolidated Condition and Income Data
13
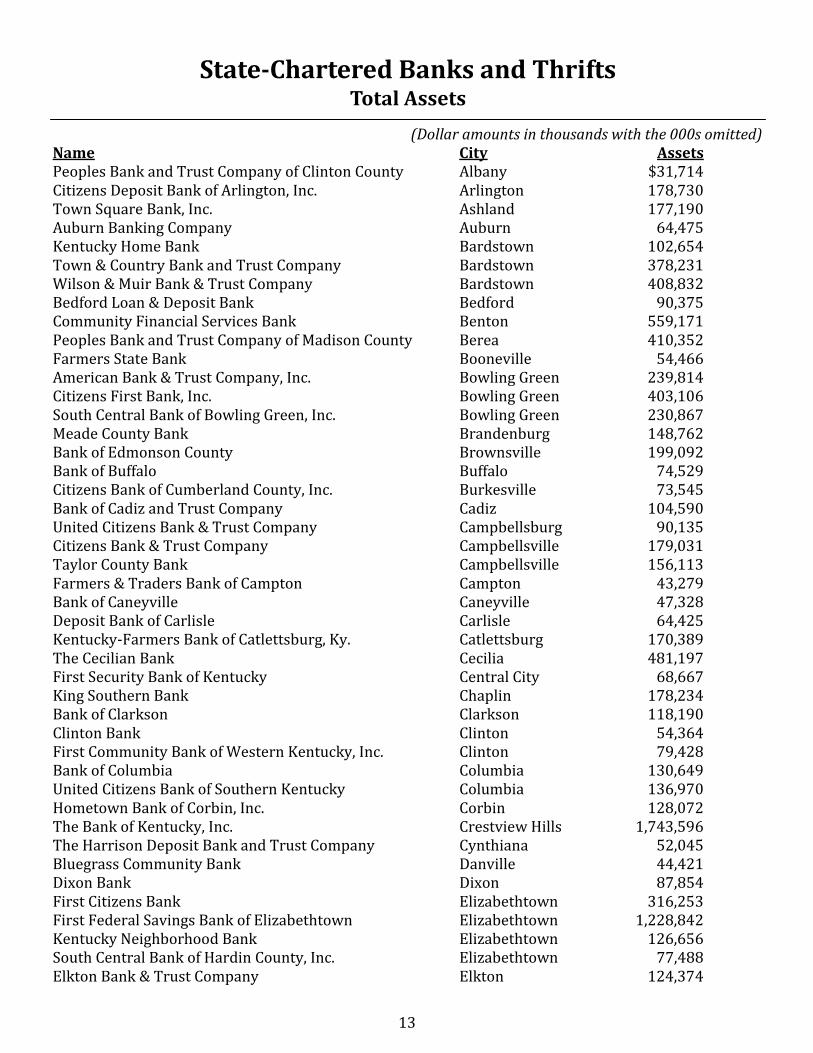
(Dollar amounts in thousands with the 000s omitted) Name City Assets Peoples Bank and Trust Company of Clinton County Albany $31,714 Citizens Deposit Bank of Arlington, Inc. Arlington 178,730 Town Square Bank, Inc. Ashland 177,190 Auburn Banking Company Auburn 64,475 Kentucky Home Bank Bardstown 102,654 Town & Country Bank and Trust Company Bardstown 378,231 Wilson & Muir Bank & Trust Company Bardstown 408,832 Bedford Loan & Deposit Bank Bedford 90,375 Community Financial Services Bank Benton 559,171 Peoples Bank and Trust Company of Madison County Berea 410,352 Farmers State Bank Booneville 54,466 American Bank & Trust Company, Inc. Bowling Green 239,814 Citizens First Bank, Inc. Bowling Green 403,106 South Central Bank of Bowling Green, Inc. Bowling Green 230,867 Meade County Bank Brandenburg 148,762 Bank of Edmonson County Brownsville 199,092 Bank of Buffalo Buffalo 74,529 Citizens Bank of Cumberland County, Inc. Burkesville 73,545 Bank of Cadiz and Trust Company Cadiz 104,590 United Citizens Bank & Trust Company Campbellsburg 90,135 Citizens Bank & Trust Company Campbellsville 179,031 Taylor County Bank Campbellsville 156,113 Farmers & Traders Bank of Campton Campton 43,279 Bank of Caneyville Caneyville 47,328 Deposit Bank of Carlisle Carlisle 64,425 Kentucky-Farmers Bank of Catlettsburg, Ky. Catlettsburg 170,389 The Cecilian Bank Cecilia 481,197 First Security Bank of Kentucky Central City 68,667 King Southern Bank Chaplin 178,234 Bank of Clarkson Clarkson 118,190 Clinton Bank Clinton 54,364 First Community Bank of Western Kentucky, Inc. Clinton 79,428 Bank of Columbia Columbia 130,649 United Citizens Bank of Southern Kentucky Columbia 136,970 Hometown Bank of Corbin, Inc. Corbin 128,072 The Bank of Kentucky, Inc. Crestview Hills 1,743,596 The Harrison Deposit Bank and Trust Company Cynthiana 52,045 Bluegrass Community Bank Danville 44,421 Dixon Bank Dixon 87,854 First Citizens Bank Elizabethtown 316,253 First Federal Savings Bank of Elizabethtown Elizabethtown 1,228,842 Kentucky Neighborhood Bank Elizabethtown 126,656 South Central Bank of Hardin County, Inc. Elizabethtown 77,488 Elkton Bank & Trust Company Elkton 124,374
State-Chartered Banks and Thrifts Total Assets

14
(Dollar amounts in thousands with the 000s omitted) Name City Assets Farmers Deposit Bank Eminence 59,841 Heritage Bank, Inc. Erlanger 397,136 Peoples Bank of Kentucky, Inc. Flemingsburg 191,634 First Security Trust Bank, Inc. Florence 116,568 Farmers Bank & Capital Trust Company Frankfort 720,976 The Bankers’ Bank of Kentucky, Inc. Frankfort 69,927 Franklin Bank & Trust Company Franklin 362,688 Fredonia Valley Bank Fredonia 74,009 Edmonton State Bank Glasgow 433,847 South Central Bank of Barren County, Inc. Glasgow 276,250 The Commercial Bank of Grayson Grayson 165,993 The Farmers Bank Hardinsburg 96,256 The Bank of Harlan Harlan 131,873 Citizens Bank Hartford 24,463 Commonwealth Community Bank, Inc. Hartford 157,474 Hancock Bank & Trust Company Hawesville 350,669 1st Trust Bank, Inc. Hazard 136,957 Peoples Bank & Trust Company of Hazard Hazard 287,115 Ohio Valley Financial Group Henderson 242,499 The Bank of Henderson, Inc. Henderson 75,295 The Citizens Bank Hickman 109,515 Bank of Hindman Hindman 172,078 Planters Bank, Inc. Hopkinsville 675,453 United Southern Bank Hopkinsville 252,185 Hyden Citizens Bank Hyden 128,270 Inez Deposit Bank Inez 166,168 First State Bank Irvington 157,703 Citizens Bank & Trust Company of Jackson Jackson 127,445 Bank of Jamestown Jamestown 165,489 The Kevil Bank Kevil 29,985 THE BANK - Oldham County, Inc. La Grange 142,585 Century Bank of Kentucky, Inc. Lawrenceburg 100,594 Peoples Bank Lebanon 46,781 Leitchfield Deposit Bank & Trust Company Leitchfield 107,817 Lewisburg Banking Company Lewisburg 100,476 American Founders Bank, Inc. Lexington 385,586 Bank of Lexington, Inc. Lexington 166,757 Bank of the Bluegrass and Trust Company Lexington 218,403 Central Bank & Trust Co. Lexington 1,908,559 Whitaker Bank Lexington 1,497,133 The Casey County Bank, Inc. Liberty 160,219 Louisa Community Bank Louisa 29,094 Peoples Security Bank Louisa 50,006 Central Bank of Jefferson County Louisville 177,306
State-Chartered Banks and Thrifts Total Assets
15
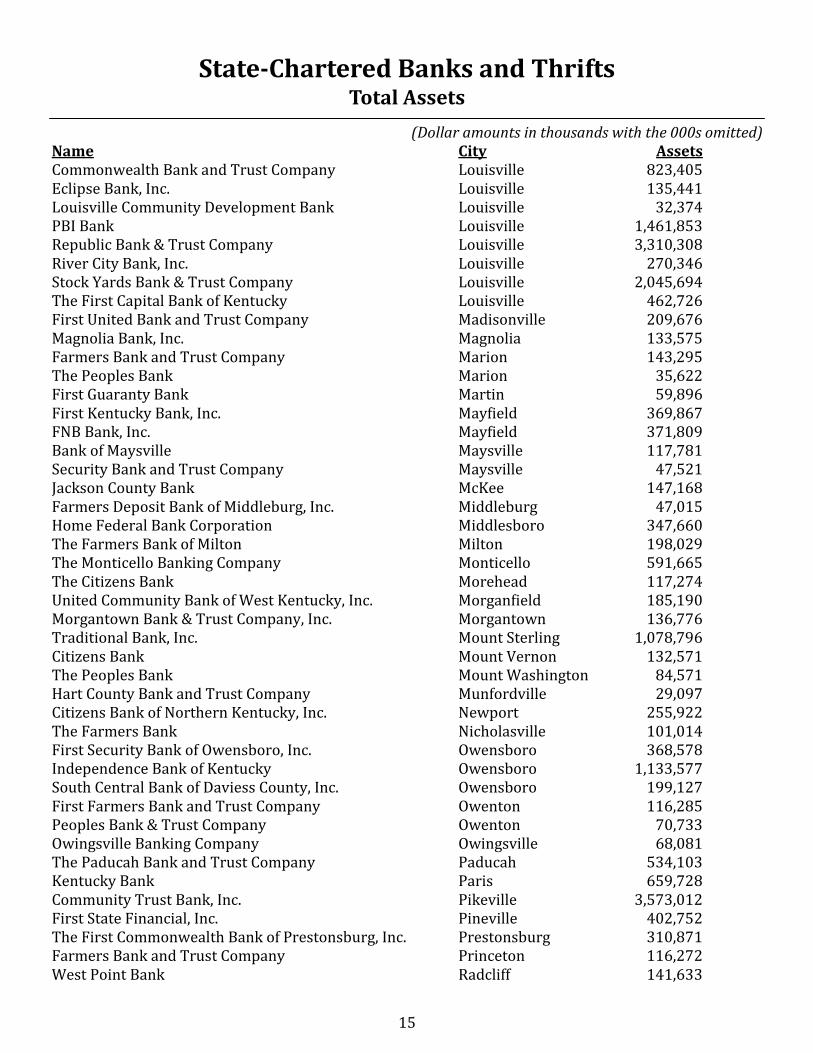
(Dollar amounts in thousands with the 000s omitted) Name City Assets Commonwealth Bank and Trust Company Louisville 823,405 Eclipse Bank, Inc. Louisville 135,441 Louisville Community Development Bank Louisville 32,374 PBI Bank Louisville 1,461,853 Republic Bank & Trust Company Louisville 3,310,308 River City Bank, Inc. Louisville 270,346 Stock Yards Bank & Trust Company Louisville 2,045,694 The First Capital Bank of Kentucky Louisville 462,726 First United Bank and Trust Company Madisonville 209,676 Magnolia Bank, Inc. Magnolia 133,575 Farmers Bank and Trust Company Marion 143,295 The Peoples Bank Marion 35,622 First Guaranty Bank Martin 59,896 First Kentucky Bank, Inc. Mayfield 369,867 FNB Bank, Inc. Mayfield 371,809 Bank of Maysville Maysville 117,781 Security Bank and Trust Company Maysville 47,521 Jackson County Bank McKee 147,168 Farmers Deposit Bank of Middleburg, Inc. Middleburg 47,015 Home Federal Bank Corporation Middlesboro 347,660 The Farmers Bank of Milton Milton 198,029 The Monticello Banking Company Monticello 591,665 The Citizens Bank Morehead 117,274 United Community Bank of West Kentucky, Inc. Morganfield 185,190 Morgantown Bank & Trust Company, Inc. Morgantown 136,776 Traditional Bank, Inc. Mount Sterling 1,078,796 Citizens Bank Mount Vernon 132,571 The Peoples Bank Mount Washington 84,571 Hart County Bank and Trust Company Munfordville 29,097 Citizens Bank of Northern Kentucky, Inc. Newport 255,922 The Farmers Bank Nicholasville 101,014 First Security Bank of Owensboro, Inc. Owensboro 368,578 Independence Bank of Kentucky Owensboro 1,133,577 South Central Bank of Daviess County, Inc. Owensboro 199,127 First Farmers Bank and Trust Company Owenton 116,285 Peoples Bank & Trust Company Owenton 70,733 Owingsville Banking Company Owingsville 68,081 The Paducah Bank and Trust Company Paducah 534,103 Kentucky Bank Paris 659,728 Community Trust Bank, Inc. Pikeville 3,573,012 First State Financial, Inc. Pineville 402,752 The First Commonwealth Bank of Prestonsburg, Inc. Prestonsburg 310,871 Farmers Bank and Trust Company Princeton 116,272 West Point Bank Radcliff 141,633
State-Chartered Banks and Thrifts Total Assets

16
(Dollar amounts in thousands with the 000s omitted) Name City Assets Citizens Guaranty Bank Richmond 130,502 Madison Bank Richmond 136,265 First & Peoples Bank Russell 195,440 The Sacramento Deposit Bank Sacramento 68,416 The Salt Lick Deposit Bank Salt Lick 71,797 Sebree Deposit Bank Sebree 22,091 Citizens Union Bank of Shelbyville Shelbyville 595,190 The Peoples Bank of Bullitt County Shepherdsville 214,877 Cumberland Security Bank, Inc. Somerset 157,914 Springfield State Bank Springfield 254,820 PBK Bank, Inc. Stanford 113,765 Peoples Exchange Bank Stanton 352,621 The Peoples Bank Taylorsville 110,016 South Central Bank of Monroe County Tompkinsville 113,966 Citizens Deposit Bank & Trust Vanceburg 212,945 First Community Bank Vanceburg 28,389 United Bank & Trust Versailles 582,171 Bank of the Mountains, Inc. West Liberty 63,360 Commercial Bank West Liberty 127,449 Bank of McCreary County Whitley City 134,880 Grant County Deposit Bank Williamstown 89,015 Alliance Banking Company Winchester 60,148 Total ………………..$45,765,535
State-Chartered Banks and Thrifts Total Assets
(Dollar amounts in thousands with the 000s omitted) Name City Trust Assets Community Trust and Investment Company Lexington $1,683,310 First Kentucky Trust Louisville 347,446 Hilliard Lyons Trust Company, LLC Louisville 3,038,723 The Glenview Trust Company Louisville 2,836,133 Total ………………………...$7,905,612 * Includes Managed and Non-Managed Trust Accounts
State-Chartered Independent Trust Companies
17
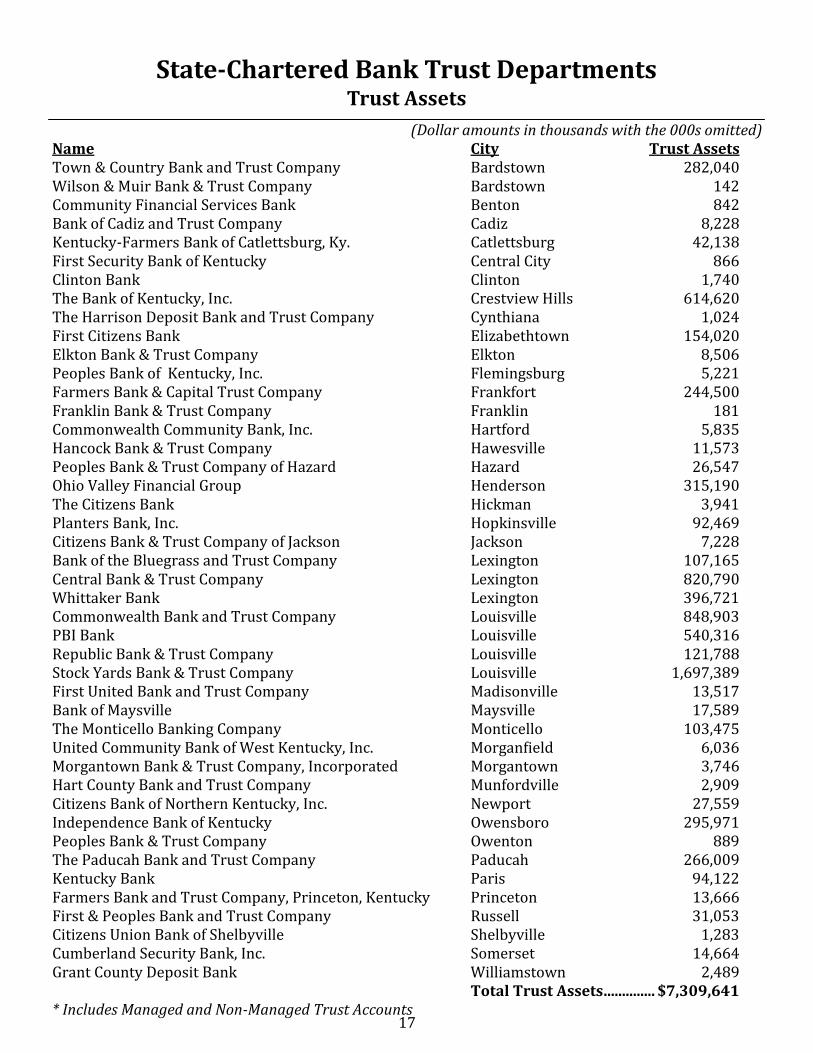
(Dollar amounts in thousands with the 000s omitted) Name City Trust Assets Town & Country Bank and Trust Company Bardstown 282,040 Wilson & Muir Bank & Trust Company Bardstown 142 Community Financial Services Bank Benton 842 Bank of Cadiz and Trust Company Cadiz 8,228 Kentucky-Farmers Bank of Catlettsburg, Ky. Catlettsburg 42,138 First Security Bank of Kentucky Central City 866 Clinton Bank Clinton 1,740 The Bank of Kentucky, Inc. Crestview Hills 614,620 The Harrison Deposit Bank and Trust Company Cynthiana 1,024 First Citizens Bank Elizabethtown 154,020 Elkton Bank & Trust Company Elkton 8,506 Peoples Bank of Kentucky, Inc. Flemingsburg 5,221 Farmers Bank & Capital Trust Company Frankfort 244,500 Franklin Bank & Trust Company Franklin 181 Commonwealth Community Bank, Inc. Hartford 5,835 Hancock Bank & Trust Company Hawesville 11,573 Peoples Bank & Trust Company of Hazard Hazard 26,547 Ohio Valley Financial Group Henderson 315,190 The Citizens Bank Hickman 3,941 Planters Bank, Inc. Hopkinsville 92,469 Citizens Bank & Trust Company of Jackson Jackson 7,228 Bank of the Bluegrass and Trust Company Lexington 107,165 Central Bank & Trust Company Lexington 820,790 Whittaker Bank Lexington 396,721 Commonwealth Bank and Trust Company Louisville 848,903 PBI Bank Louisville 540,316 Republic Bank & Trust Company Louisville 121,788 Stock Yards Bank & Trust Company Louisville 1,697,389 First United Bank and Trust Company Madisonville 13,517 Bank of Maysville Maysville 17,589 The Monticello Banking Company Monticello 103,475 United Community Bank of West Kentucky, Inc. Morganfield 6,036 Morgantown Bank & Trust Company, Incorporated Morgantown 3,746 Hart County Bank and Trust Company Munfordville 2,909 Citizens Bank of Northern Kentucky, Inc. Newport 27,559 Independence Bank of Kentucky Owensboro 295,971 Peoples Bank & Trust Company Owenton 889 The Paducah Bank and Trust Company Paducah 266,009 Kentucky Bank Paris 94,122 Farmers Bank and Trust Company, Princeton, Kentucky Princeton 13,666 First & Peoples Bank and Trust Company Russell 31,053 Citizens Union Bank of Shelbyville Shelbyville 1,283 Cumberland Security Bank, Inc. Somerset 14,664 Grant County Deposit Bank Williamstown 2,489 Total Trust Assets .............. $7,309,641 * Includes Managed and Non-Managed Trust Accounts
State-Chartered Bank Trust Departments Trust Assets

18
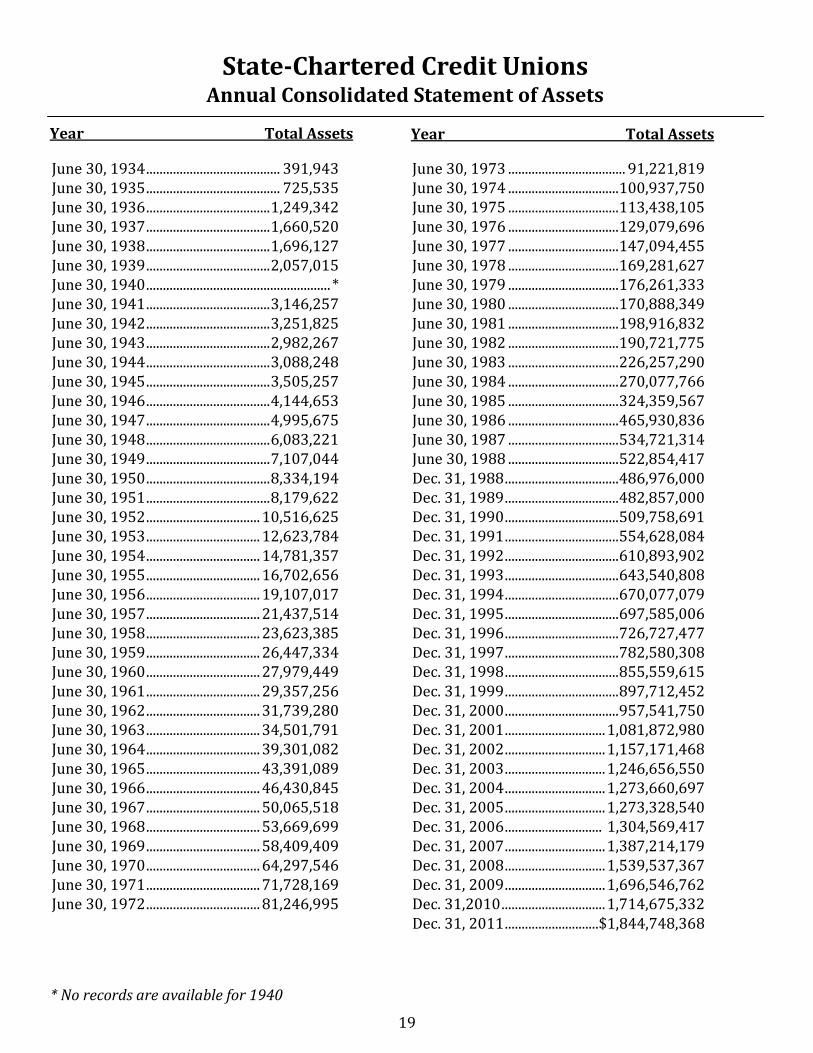
77th Annual Credit Union Report
Kentucky state-chartered credit unions remain safe and sound. The national economy continues its slow recovery and our nation’s credit unions are weathering the prolonged recession and the impact of the assessments required to stabilize the corporate credit union system losses. However, Kentucky state-chartered credit unions performed well in 2011. The Credit Union Branch supervises the activities of 25 Kentucky state-chartered credit unions, ranging in asset size from $670,888 to $897,005,001. The total assets under supervision by the Credit Union Branch are $1,844,748,368. Total asset growth was 7.59 percent, which is up significantly from the pre-vious year’s growth of 1.07 percent. The rise can be attributed to increased savings growth. Kentucky state-chartered credit unions remain financially strong. The net worth ratio and the return on average assets ratio also reflect favorable gains in 2011. The delinquent loans to total loans ratio and the net charge-offs to average loans ratio continue to decline year over year. The net long-term asset ratio continues to rise and is currently at 25.85 percent as credit unions seek more favorable returns through longer term mortgage loans and investments. This scenario could po-tentially expose credit unions to an increase in interest rate risk. Loan growth increased to 5.25 percent compared to 1.31 percent growth last year. Real estate loans account for 46.74 percent of total loans. Total fixed rate real estate loans held steady in 2011 at 31.35 percent.
Credit Union Changes
During 2011, one federal credit union switched to a state charter. Autotruck Federal Credit Union, locat-ed in Louisville, Ky., was officially presented with its state charter conversion on Dec. 22, 2011. It be-came Autotruck Financial Credit Union.
Division of Depository Institutions Credit Union Branch
Among those present at the
official charter conversion
were Autotruck President and
CEO Huston Reinle, second
from left, and Public Protection
Cabinet Secretary Bob Vance
holding the charter.
19
* No records are available for 1940
June 30, 1934 ........................................ 391,943 June 30, 1935 ........................................ 725,535 June 30, 1936 ..................................... 1,249,342 June 30, 1937 ..................................... 1,660,520 June 30, 1938 ..................................... 1,696,127 June 30, 1939 ..................................... 2,057,015 June 30, 1940 ....................................................... * June 30, 1941 ..................................... 3,146,257 June 30, 1942 ..................................... 3,251,825 June 30, 1943 ..................................... 2,982,267 June 30, 1944 ..................................... 3,088,248 June 30, 1945 ..................................... 3,505,257 June 30, 1946 ..................................... 4,144,653 June 30, 1947 ..................................... 4,995,675 June 30, 1948 ..................................... 6,083,221 June 30, 1949 ..................................... 7,107,044 June 30, 1950 ..................................... 8,334,194 June 30, 1951 ..................................... 8,179,622 June 30, 1952 .................................. 10,516,625 June 30, 1953 .................................. 12,623,784 June 30, 1954 .................................. 14,781,357 June 30, 1955 .................................. 16,702,656 June 30, 1956 .................................. 19,107,017 June 30, 1957 .................................. 21,437,514 June 30, 1958 .................................. 23,623,385 June 30, 1959 .................................. 26,447,334 June 30, 1960 .................................. 27,979,449 June 30, 1961 .................................. 29,357,256 June 30, 1962 .................................. 31,739,280 June 30, 1963 .................................. 34,501,791 June 30, 1964 .................................. 39,301,082 June 30, 1965 .................................. 43,391,089 June 30, 1966 .................................. 46,430,845 June 30, 1967 .................................. 50,065,518 June 30, 1968 .................................. 53,669,699 June 30, 1969 .................................. 58,409,409 June 30, 1970 .................................. 64,297,546 June 30, 1971 .................................. 71,728,169 June 30, 1972 .................................. 81,246,995
June 30, 1973 ................................... 91,221,819 June 30, 1974 ................................. 100,937,750 June 30, 1975 ................................. 113,438,105 June 30, 1976 ................................. 129,079,696 June 30, 1977 ................................. 147,094,455 June 30, 1978 ................................. 169,281,627 June 30, 1979 ................................. 176,261,333 June 30, 1980 ................................. 170,888,349 June 30, 1981 ................................. 198,916,832 June 30, 1982 ................................. 190,721,775 June 30, 1983 ................................. 226,257,290 June 30, 1984 ................................. 270,077,766 June 30, 1985 ................................. 324,359,567 June 30, 1986 ................................. 465,930,836 June 30, 1987 ................................. 534,721,314 June 30, 1988 ................................. 522,854,417 Dec. 31, 1988 .................................. 486,976,000 Dec. 31, 1989 .................................. 482,857,000 Dec. 31, 1990 .................................. 509,758,691 Dec. 31, 1991 .................................. 554,628,084 Dec. 31, 1992 .................................. 610,893,902 Dec. 31, 1993 .................................. 643,540,808 Dec. 31, 1994 .................................. 670,077,079 Dec. 31, 1995 .................................. 697,585,006 Dec. 31, 1996 .................................. 726,727,477 Dec. 31, 1997 .................................. 782,580,308 Dec. 31, 1998 .................................. 855,559,615 Dec. 31, 1999 .................................. 897,712,452 Dec. 31, 2000 .................................. 957,541,750 Dec. 31, 2001 .............................. 1,081,872,980 Dec. 31, 2002 .............................. 1,157,171,468 Dec. 31, 2003 .............................. 1,246,656,550 Dec. 31, 2004 .............................. 1,273,660,697 Dec. 31, 2005 .............................. 1,273,328,540 Dec. 31, 2006 ............................. 1,304,569,417 Dec. 31, 2007 .............................. 1,387,214,179 Dec. 31, 2008 .............................. 1,539,537,367 Dec. 31, 2009 .............................. 1,696,546,762 Dec. 31,2010 ............................... 1,714,675,332 Dec. 31, 2011 ............................ $1,844,748,368
Year Total Assets Year Total Assets
State-Chartered Credit Unions Annual Consolidated Statement of Assets
20
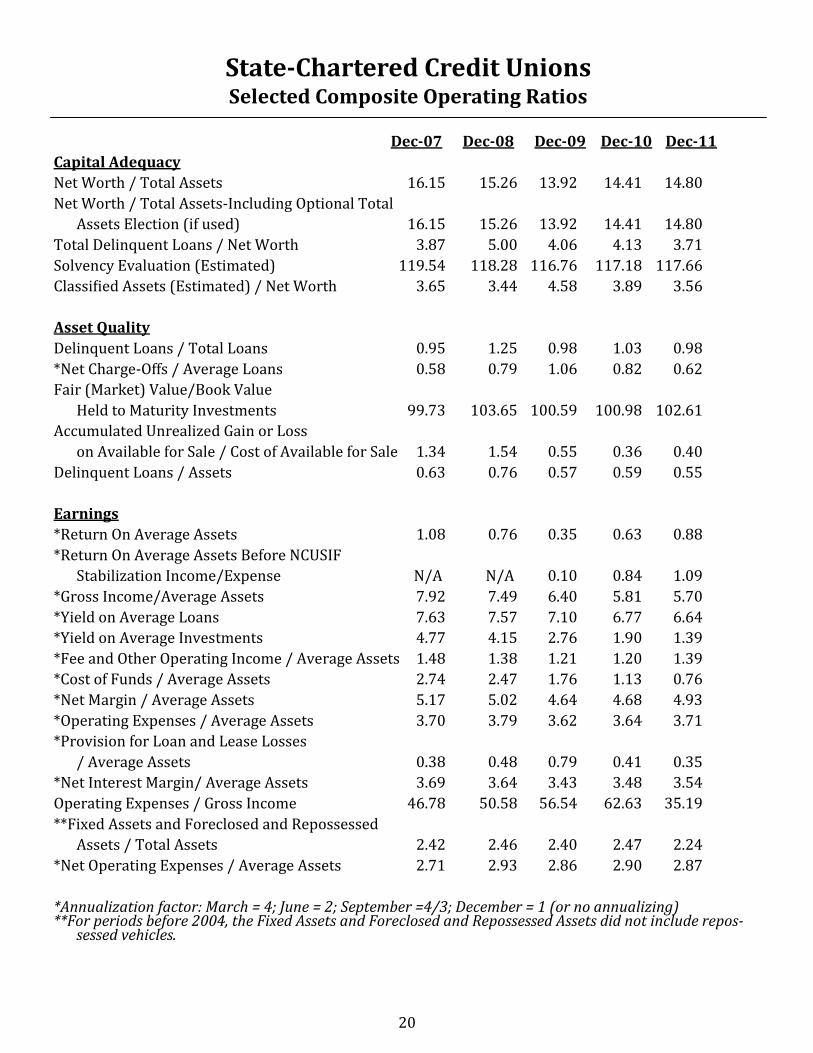
Dec-07 Dec-08 Dec-09 Dec-10 Dec-11
Capital Adequacy
Net Worth / Total Assets 16.15 15.26 13.92 14.41 14.80
Net Worth / Total Assets-Including Optional Total
Assets Election (if used) 16.15 15.26 13.92 14.41 14.80
Total Delinquent Loans / Net Worth 3.87 5.00 4.06 4.13 3.71
Solvency Evaluation (Estimated) 119.54 118.28 116.76 117.18 117.66
Classified Assets (Estimated) / Net Worth 3.65 3.44 4.58 3.89 3.56
Asset Quality
Delinquent Loans / Total Loans 0.95 1.25 0.98 1.03 0.98
*Net Charge-Offs / Average Loans 0.58 0.79 1.06 0.82 0.62
Fair (Market) Value/Book Value
Held to Maturity Investments 99.73 103.65 100.59 100.98 102.61
Accumulated Unrealized Gain or Loss
on Available for Sale / Cost of Available for Sale 1.34 1.54 0.55 0.36 0.40
Delinquent Loans / Assets 0.63 0.76 0.57 0.59 0.55
Earnings
*Return On Average Assets 1.08 0.76 0.35 0.63 0.88
*Return On Average Assets Before NCUSIF
Stabilization Income/Expense N/A N/A 0.10 0.84 1.09
*Gross Income/Average Assets 7.92 7.49 6.40 5.81 5.70
*Yield on Average Loans 7.63 7.57 7.10 6.77 6.64
*Yield on Average Investments 4.77 4.15 2.76 1.90 1.39
*Fee and Other Operating Income / Average Assets 1.48 1.38 1.21 1.20 1.39
*Cost of Funds / Average Assets 2.74 2.47 1.76 1.13 0.76
*Net Margin / Average Assets 5.17 5.02 4.64 4.68 4.93
*Operating Expenses / Average Assets 3.70 3.79 3.62 3.64 3.71
*Provision for Loan and Lease Losses
/ Average Assets 0.38 0.48 0.79 0.41 0.35
*Net Interest Margin/ Average Assets 3.69 3.64 3.43 3.48 3.54
Operating Expenses / Gross Income 46.78 50.58 56.54 62.63 35.19
**Fixed Assets and Foreclosed and Repossessed
Assets / Total Assets 2.42 2.46 2.40 2.47 2.24
*Net Operating Expenses / Average Assets 2.71 2.93 2.86 2.90 2.87
*Annualization factor: March = 4; June = 2; September =4/3; December = 1 (or no annualizing) **For periods before 2004, the Fixed Assets and Foreclosed and Repossessed Assets did not include repos-
sessed vehicles.
State-Chartered Credit Unions Selected Composite Operating Ratios
21
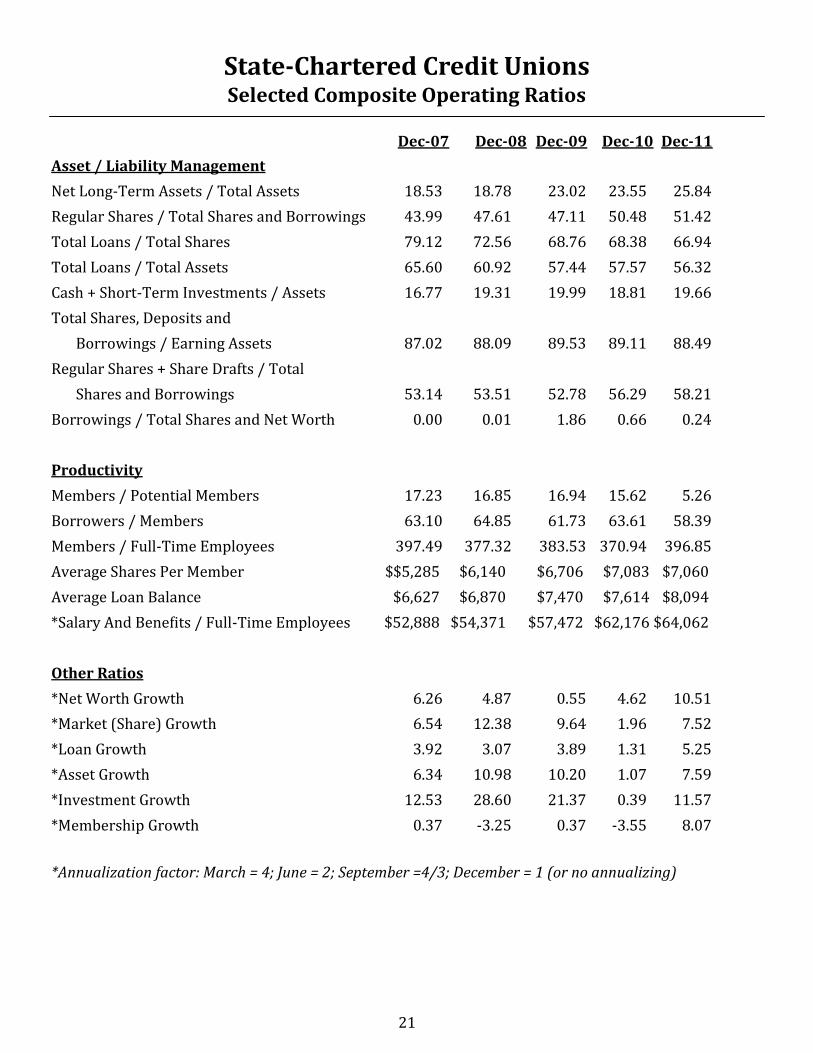
Dec-07 Dec-08 Dec-09 Dec-10 Dec-11
Asset / Liability Management
Net Long-Term Assets / Total Assets 18.53 18.78 23.02 23.55 25.84
Regular Shares / Total Shares and Borrowings 43.99 47.61 47.11 50.48 51.42
Total Loans / Total Shares 79.12 72.56 68.76 68.38 66.94
Total Loans / Total Assets 65.60 60.92 57.44 57.57 56.32
Cash + Short-Term Investments / Assets 16.77 19.31 19.99 18.81 19.66
Total Shares, Deposits and
Borrowings / Earning Assets 87.02 88.09 89.53 89.11 88.49
Regular Shares + Share Drafts / Total
Shares and Borrowings 53.14 53.51 52.78 56.29 58.21
Borrowings / Total Shares and Net Worth 0.00 0.01 1.86 0.66 0.24
Productivity
Members / Potential Members 17.23 16.85 16.94 15.62 5.26
Borrowers / Members 63.10 64.85 61.73 63.61 58.39
Members / Full-Time Employees 397.49 377.32 383.53 370.94 396.85
Average Shares Per Member $$5,285 $6,140 $6,706 $7,083 $7,060
Average Loan Balance $6,627 $6,870 $7,470 $7,614 $8,094
*Salary And Benefits / Full-Time Employees $52,888 $54,371 $57,472 $62,176 $64,062
Other Ratios
*Net Worth Growth 6.26 4.87 0.55 4.62 10.51
*Market (Share) Growth 6.54 12.38 9.64 1.96 7.52
*Loan Growth 3.92 3.07 3.89 1.31 5.25
*Asset Growth 6.34 10.98 10.20 1.07 7.59
*Investment Growth 12.53 28.60 21.37 0.39 11.57
*Membership Growth 0.37 -3.25 0.37 -3.55 8.07
*Annualization factor: March = 4; June = 2; September =4/3; December = 1 (or no annualizing)
State-Chartered Credit Unions Selected Composite Operating Ratios

22
Charter Name City Year Opened Total Assets
60883 Beacon Community Louisville 1947 45,554,182
61123 Louisville Gas and Electric Company Louisville 1934 30,526,361
61204 Blue Cross Blue Shield Louisville 1952 6,265,855
61316 Tarcana Louisville 1936 2,797,511
61437 Commonwealth Frankfort 1951 897,005,001
61693 Rural Cooperatives Louisville 1964 38,271,842
61738 Paducah City Employees Paducah 1961 2,902,637
61772 Louisville Metro Police Officers Louisville 1942 19,865,977
61792 Ashland Ashland 1942 171,559,560
62026 Members Choice Ashland 1932 152,541,967
62089 Kitco Employees Louisville 1944 2,410,689
62228 Greater Kentucky Credit Union Lexington 1953 62,697,423
62303 Letcher County Teachers Whitesburg 1964 1,127,938
62358 Kemba Louisville Louisville 1934 41,549,515
62370 Lexington Postal Lexington 1928 17,638,695
62389 Berea Berea 1923 1,352,929
62431 Kentucky Employees Frankfort 1938 59,215,419
62432 Whitesville Community Whitesville 1962 18,070,511
62433 Louisville Federal Louisville 1924 35,943,743
62482 Brown-Forman Employees Louisville 1936 9,989,038
62484 Service One Bowling Green 1963 107,487,523
62490 Muhlenberg Community Hospital Greenville 1961 670,888
62587 C&O United Edgewood 1928 15,082,482
63058 Metro Employees Lexington 1940 18,149,661
68617 Autotruck Financial Louisville 1965 86,071,021
TOTAL $1,844,748,368
State-Chartered Credit Unions Report of Condition
23
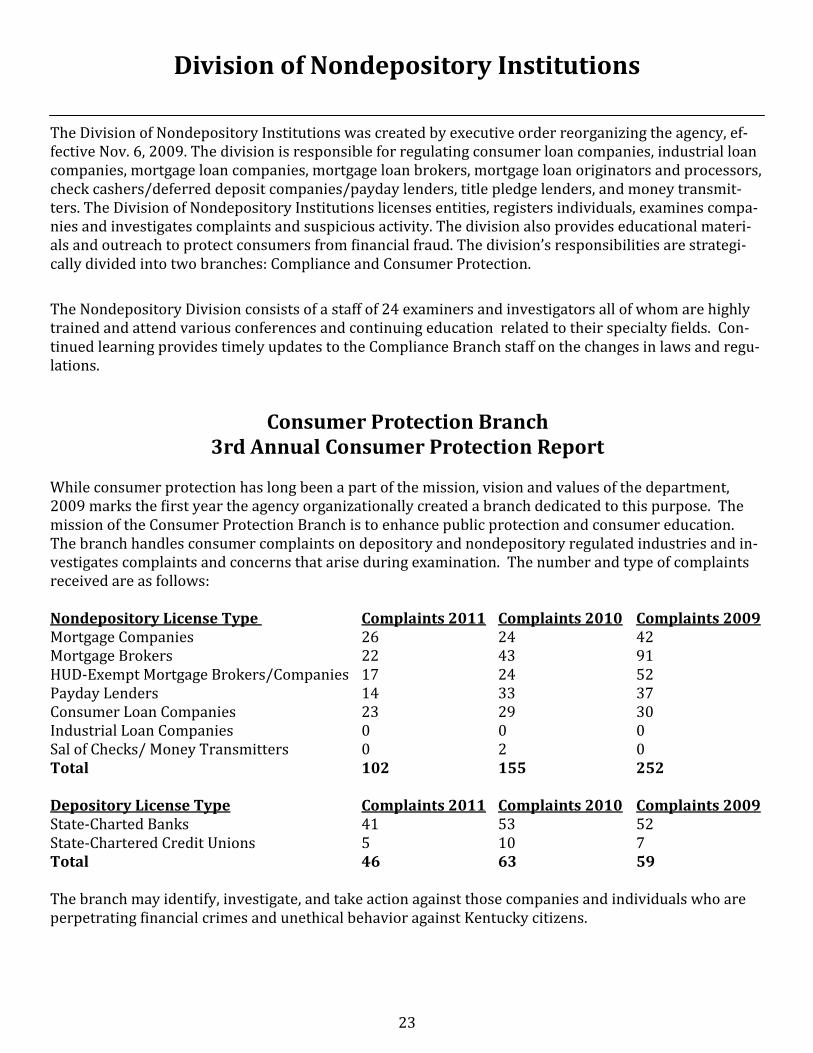
The Division of Nondepository Institutions was created by executive order reorganizing the agency, ef-fective Nov. 6, 2009. The division is responsible for regulating consumer loan companies, industrial loan companies, mortgage loan companies, mortgage loan brokers, mortgage loan originators and processors, check cashers/deferred deposit companies/payday lenders, title pledge lenders, and money transmit-ters. The Division of Nondepository Institutions licenses entities, registers individuals, examines compa-nies and investigates complaints and suspicious activity. The division also provides educational materi-als and outreach to protect consumers from financial fraud. The division’s responsibilities are strategi-cally divided into two branches: Compliance and Consumer Protection.
The Nondepository Division consists of a staff of 24 examiners and investigators all of whom are highly trained and attend various conferences and continuing education related to their specialty fields. Con-tinued learning provides timely updates to the Compliance Branch staff on the changes in laws and regu-lations.
Consumer Protection Branch 3rd Annual Consumer Protection Report
While consumer protection has long been a part of the mission, vision and values of the department, 2009 marks the first year the agency organizationally created a branch dedicated to this purpose. The mission of the Consumer Protection Branch is to enhance public protection and consumer education. The branch handles consumer complaints on depository and nondepository regulated industries and in-vestigates complaints and concerns that arise during examination. The number and type of complaints received are as follows: Nondepository License Type Complaints 2011 Complaints 2010 Complaints 2009 Mortgage Companies 26 24 42 Mortgage Brokers 22 43 91 HUD-Exempt Mortgage Brokers/Companies 17 24 52 Payday Lenders 14 33 37 Consumer Loan Companies 23 29 30 Industrial Loan Companies 0 0 0 Sal of Checks/ Money Transmitters 0 2 0 Total 102 155 252 Depository License Type Complaints 2011 Complaints 2010 Complaints 2009 State-Charted Banks 41 53 52 State-Chartered Credit Unions 5 10 7 Total 46 63 59 The branch may identify, investigate, and take action against those companies and individuals who are perpetrating financial crimes and unethical behavior against Kentucky citizens.
Division of Nondepository Institutions

24
Compliance Branch 13th Annual Compliance Report
The Compliance Branch licenses and regulates mortgage companies and brokers, mortgage loan origina-tors and processors, check cashers/deferred deposit companies/payday lenders, title pledge lenders, consumer and industrial loan companies, and money transmitters. As of Dec. 31, 2011, the branch super-vised 1,716 entity licensees and 2,573 individual registrants. The number and type of licenses/registrations regulated by the Compliance Branch are as follows: License Type Dec. 21, 2011 Dec. 31, 2010 Dec. 31, 2009 Mortgage Companies 575 432 394 Mortgage Brokers 141 184 227 Check Cashers 578 651 739 Consumer Loan Companies 338 329 325 Industrial Loan Companies 32 32 32 Money Transmitters 52 50 44 Total 1,716 1,678 1,761 Registration Type Dec. 31, 2011 Dec. 31, 2010 Dec. 31, 2009 Loan Originators/Processors 2,573 2,434 2,333 All mortgage entities and individuals must use the Nationwide Mortgage Licensing System (NMLS) for licens-ing and registration. Exempt companies do not have to use NMLS; however, the individuals working for ex-empt companies must use NMLS. The DFI is actively involved with the NMLS and helps oversee the testing requirements associated with NMLS registration. DFI also participates in multi-state mortgage examinations and investigations, which help discover and correct underwriting and servicing problems. The branch has implemented a real-time database for check cashers, providing additional enforcement tools for DFI. The statewide database is designed to track every loan and to ensure the loan complies with state law. The database began operating April 30, 2010, and improves transparency, monitoring and data collection by the state. In 2011, the Compliance Branch staff completed a total of 1,232 examinations. The branch assessed a total of $1,027,455 in fines. In accordance with Kentucky statute, check cashers, consumer loan and industrial loan companies are examined annually by the Compliance Branch. Mortgage companies, mortgage brokers and money transmitters are typically examined every 18 to 24 months, however, the frequency is not mandated by statute. The number and type of examinations performed by the Compliance Branch are as follows: Examination Type Dec. 31, 2011 Dec. 31, 2010 Dec. 31, 2009 Mortgage Companies 205 91 65 Mortgage Brokers 92 90 87 Check Cashers 584 661 726 Consumer Loan Companies 312 288 318 Industrial Loan Companies 27 27 32 Money Transmitters 12 17 14 Total 1,232 1,174 1,242
Division of Nondepository Institutions
25
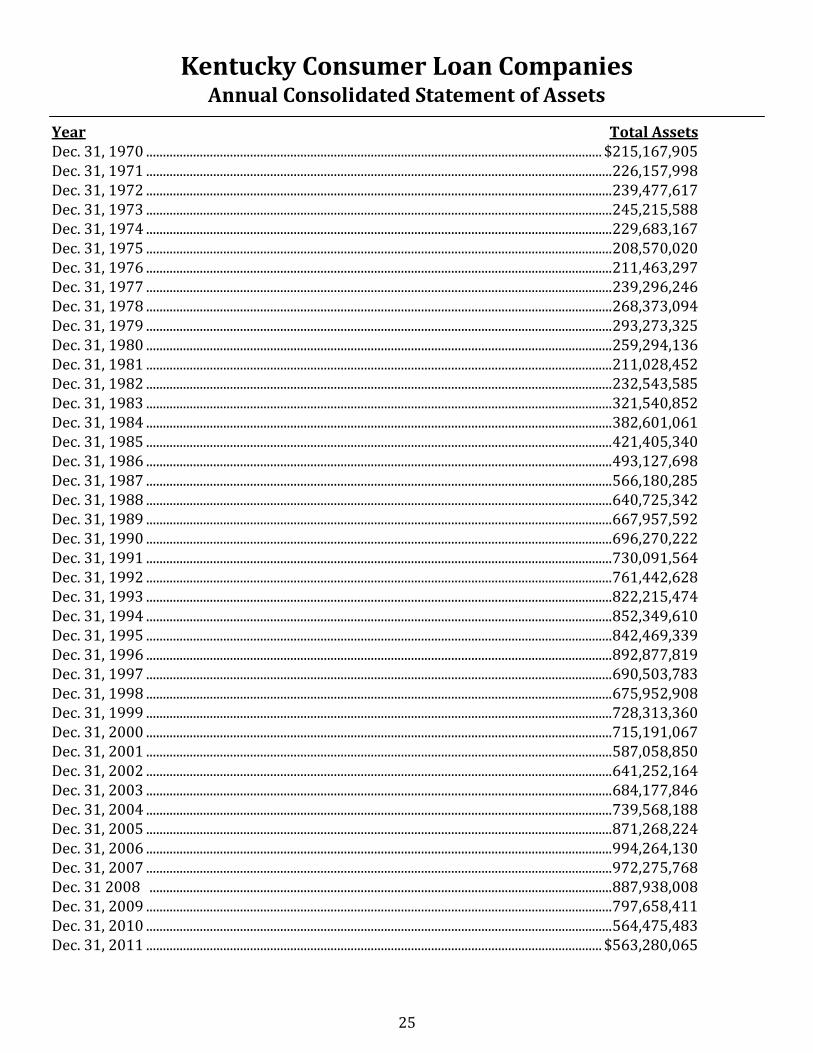
Year Total Assets Dec. 31, 1970 ........................................................................................................................................ $215,167,905 Dec. 31, 1971 ........................................................................................................................................... 226,157,998 Dec. 31, 1972 ........................................................................................................................................... 239,477,617 Dec. 31, 1973 ........................................................................................................................................... 245,215,588 Dec. 31, 1974 ........................................................................................................................................... 229,683,167 Dec. 31, 1975 ........................................................................................................................................... 208,570,020 Dec. 31, 1976 ........................................................................................................................................... 211,463,297 Dec. 31, 1977 ........................................................................................................................................... 239,296,246 Dec. 31, 1978 ........................................................................................................................................... 268,373,094 Dec. 31, 1979 ........................................................................................................................................... 293,273,325 Dec. 31, 1980 ........................................................................................................................................... 259,294,136 Dec. 31, 1981 ........................................................................................................................................... 211,028,452 Dec. 31, 1982 ........................................................................................................................................... 232,543,585 Dec. 31, 1983 ........................................................................................................................................... 321,540,852 Dec. 31, 1984 ........................................................................................................................................... 382,601,061 Dec. 31, 1985 ........................................................................................................................................... 421,405,340 Dec. 31, 1986 ........................................................................................................................................... 493,127,698 Dec. 31, 1987 ........................................................................................................................................... 566,180,285 Dec. 31, 1988 ........................................................................................................................................... 640,725,342 Dec. 31, 1989 ........................................................................................................................................... 667,957,592 Dec. 31, 1990 ........................................................................................................................................... 696,270,222 Dec. 31, 1991 ........................................................................................................................................... 730,091,564 Dec. 31, 1992 ........................................................................................................................................... 761,442,628 Dec. 31, 1993 ........................................................................................................................................... 822,215,474 Dec. 31, 1994 ........................................................................................................................................... 852,349,610 Dec. 31, 1995 ........................................................................................................................................... 842,469,339 Dec. 31, 1996 ........................................................................................................................................... 892,877,819 Dec. 31, 1997 ........................................................................................................................................... 690,503,783 Dec. 31, 1998 ........................................................................................................................................... 675,952,908 Dec. 31, 1999 ........................................................................................................................................... 728,313,360 Dec. 31, 2000 ........................................................................................................................................... 715,191,067 Dec. 31, 2001 ........................................................................................................................................... 587,058,850 Dec. 31, 2002 ........................................................................................................................................... 641,252,164 Dec. 31, 2003 ........................................................................................................................................... 684,177,846 Dec. 31, 2004 ........................................................................................................................................... 739,568,188 Dec. 31, 2005 ........................................................................................................................................... 871,268,224 Dec. 31, 2006 ........................................................................................................................................... 994,264,130 Dec. 31, 2007 ........................................................................................................................................... 972,275,768 Dec. 31 2008 .......................................................................................................................................... 887,938,008 Dec. 31, 2009 ........................................................................................................................................... 797,658,411 Dec. 31, 2010 ........................................................................................................................................... 564,475,483 Dec. 31, 2011 ........................................................................................................................................ $563,280,065
Kentucky Consumer Loan Companies Annual Consolidated Statement of Assets
26
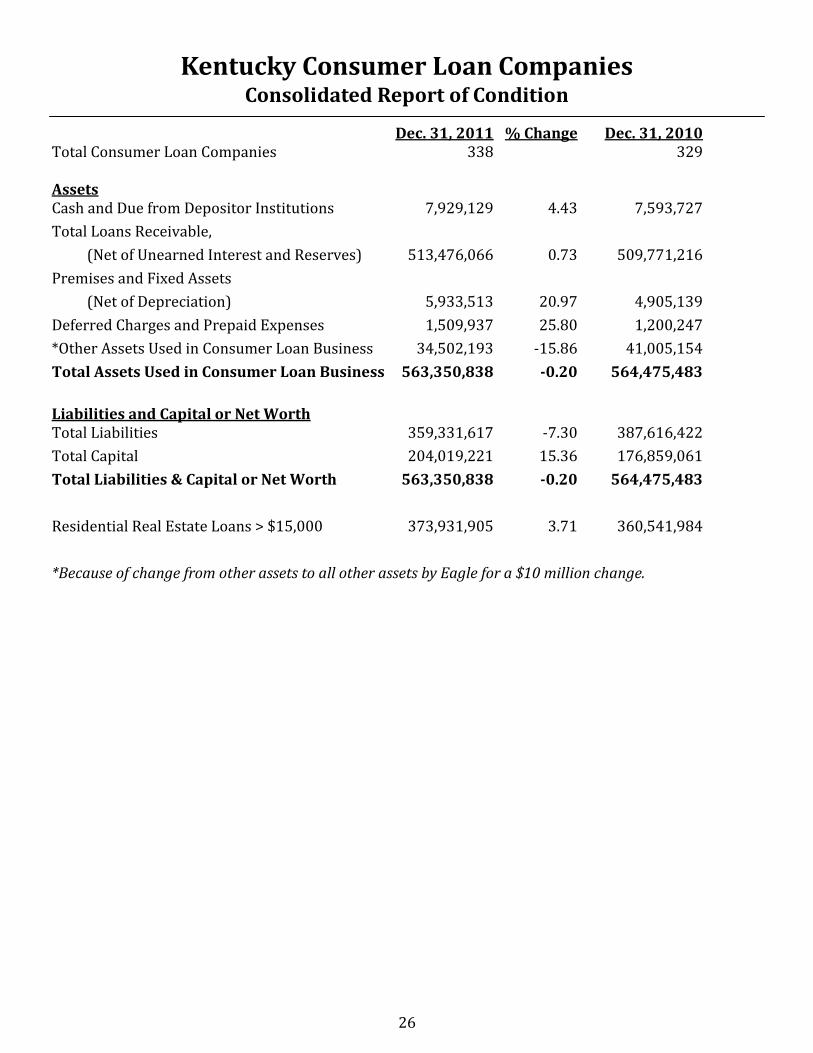
Dec. 31, 2011 % Change Dec. 31, 2010 Total Consumer Loan Companies 338 329 Assets Cash and Due from Depositor Institutions 7,929,129 4.43 7,593,727
Total Loans Receivable,
(Net of Unearned Interest and Reserves) 513,476,066 0.73 509,771,216
Premises and Fixed Assets
(Net of Depreciation) 5,933,513 20.97 4,905,139
Deferred Charges and Prepaid Expenses 1,509,937 25.80 1,200,247
*Other Assets Used in Consumer Loan Business 34,502,193 -15.86 41,005,154
Total Assets Used in Consumer Loan Business 563,350,838 -0.20 564,475,483
Liabilities and Capital or Net Worth Total Liabilities 359,331,617 -7.30 387,616,422
Total Capital 204,019,221 15.36 176,859,061
Total Liabilities & Capital or Net Worth 563,350,838 -0.20 564,475,483
Residential Real Estate Loans > $15,000 373,931,905 3.71 360,541,984
*Because of change from other assets to all other assets by Eagle for a $10 million change.
Kentucky Consumer Loan Companies Consolidated Report of Condition
27
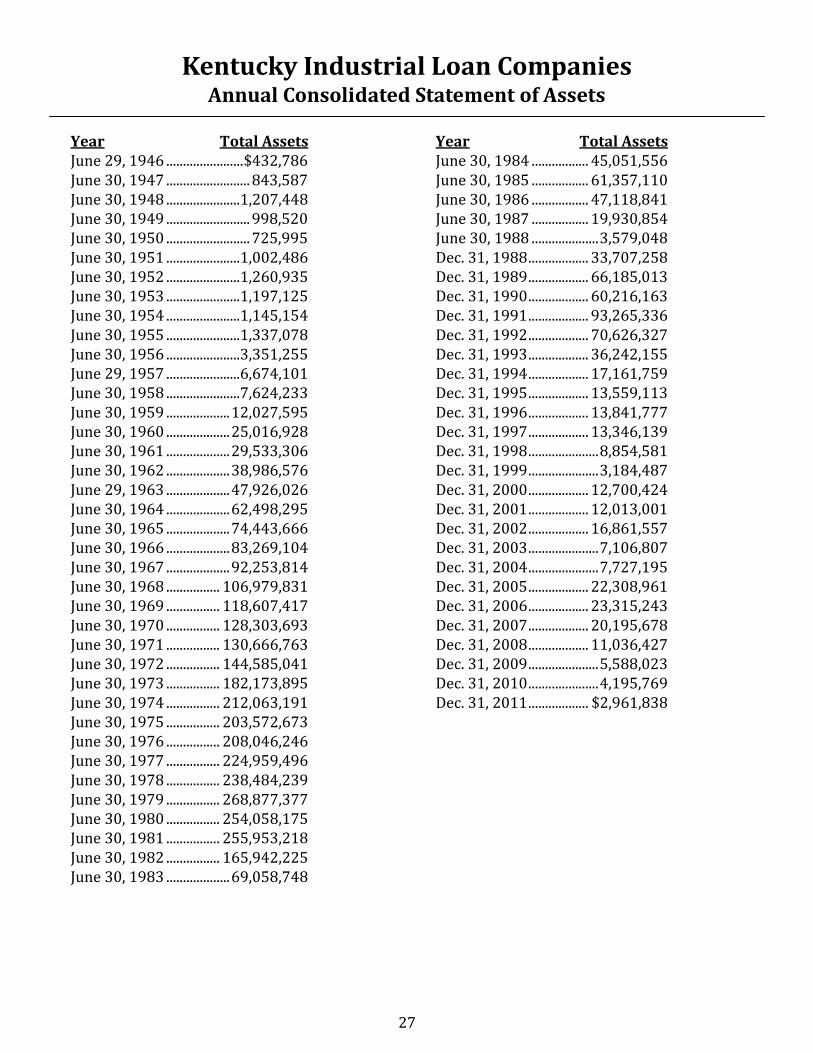
Year Total Assets June 29, 1946 ....................... $432,786 June 30, 1947 ......................... 843,587 June 30, 1948 ......................1,207,448 June 30, 1949 ......................... 998,520 June 30, 1950 ......................... 725,995 June 30, 1951 ......................1,002,486 June 30, 1952 ......................1,260,935 June 30, 1953 ......................1,197,125 June 30, 1954 ......................1,145,154 June 30, 1955 ......................1,337,078 June 30, 1956 ......................3,351,255 June 29, 1957 ......................6,674,101 June 30, 1958 ......................7,624,233 June 30, 1959 ................... 12,027,595 June 30, 1960 ................... 25,016,928 June 30, 1961 ................... 29,533,306 June 30, 1962 ................... 38,986,576 June 29, 1963 ................... 47,926,026 June 30, 1964 ................... 62,498,295 June 30, 1965 ................... 74,443,666 June 30, 1966 ................... 83,269,104 June 30, 1967 ................... 92,253,814 June 30, 1968 ................ 106,979,831 June 30, 1969 ................ 118,607,417 June 30, 1970 ................ 128,303,693 June 30, 1971 ................ 130,666,763 June 30, 1972 ................ 144,585,041 June 30, 1973 ................ 182,173,895 June 30, 1974 ................ 212,063,191 June 30, 1975 ................ 203,572,673 June 30, 1976 ................ 208,046,246 June 30, 1977 ................ 224,959,496 June 30, 1978 ................ 238,484,239 June 30, 1979 ................ 268,877,377 June 30, 1980 ................ 254,058,175 June 30, 1981 ................ 255,953,218 June 30, 1982 ................ 165,942,225 June 30, 1983 ................... 69,058,748
Year Total Assets June 30, 1984 ................. 45,051,556 June 30, 1985 ................. 61,357,110 June 30, 1986 ................. 47,118,841 June 30, 1987 ................. 19,930,854 June 30, 1988 .................... 3,579,048 Dec. 31, 1988 .................. 33,707,258 Dec. 31, 1989 .................. 66,185,013 Dec. 31, 1990 .................. 60,216,163 Dec. 31, 1991 .................. 93,265,336 Dec. 31, 1992 .................. 70,626,327 Dec. 31, 1993 .................. 36,242,155 Dec. 31, 1994 .................. 17,161,759 Dec. 31, 1995 .................. 13,559,113 Dec. 31, 1996 .................. 13,841,777 Dec. 31, 1997 .................. 13,346,139 Dec. 31, 1998 ..................... 8,854,581 Dec. 31, 1999 ..................... 3,184,487 Dec. 31, 2000 .................. 12,700,424 Dec. 31, 2001 .................. 12,013,001 Dec. 31, 2002 .................. 16,861,557 Dec. 31, 2003 ..................... 7,106,807 Dec. 31, 2004 ..................... 7,727,195 Dec. 31, 2005 .................. 22,308,961 Dec. 31, 2006 .................. 23,315,243 Dec. 31, 2007 .................. 20,195,678 Dec. 31, 2008 .................. 11,036,427 Dec. 31, 2009 ..................... 5,588,023 Dec. 31, 2010 ..................... 4,195,769 Dec. 31, 2011 .................. $2,961,838
Kentucky Industrial Loan Companies Annual Consolidated Statement of Assets
28
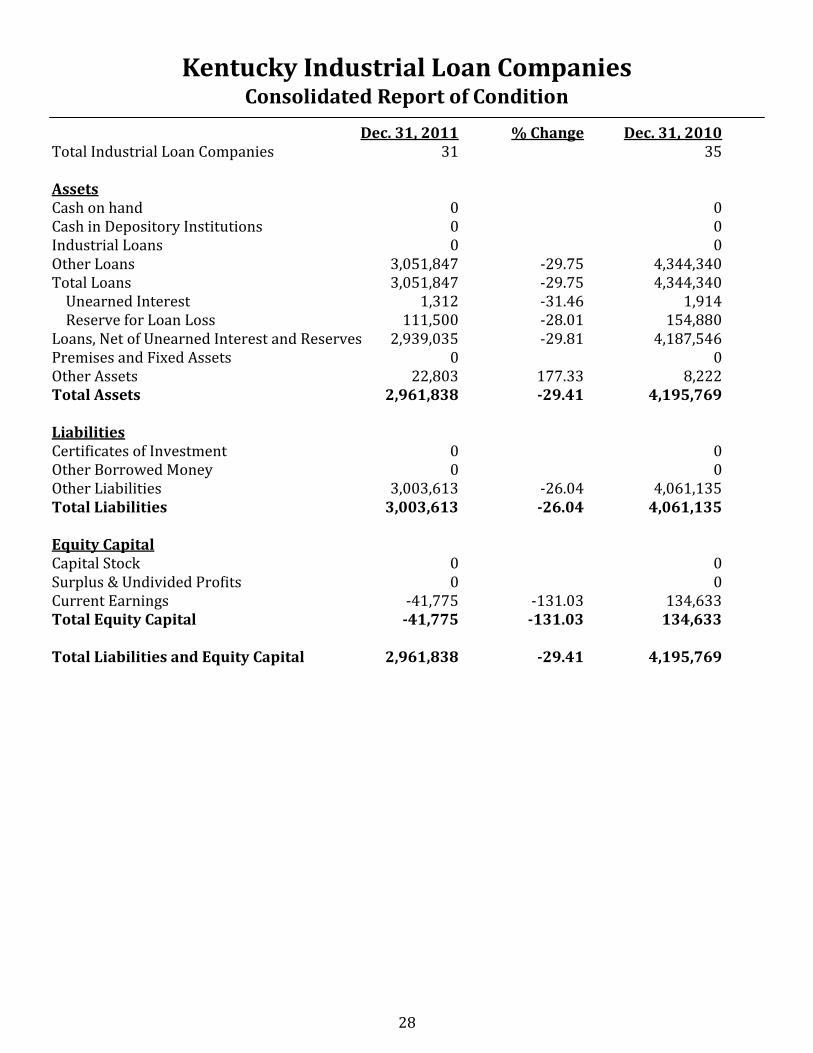
Dec. 31, 2011 % Change Dec. 31, 2010 Total Industrial Loan Companies 31 35 Assets Cash on hand 0 0 Cash in Depository Institutions 0 0 Industrial Loans 0 0 Other Loans 3,051,847 -29.75 4,344,340 Total Loans 3,051,847 -29.75 4,344,340 Unearned Interest 1,312 -31.46 1,914 Reserve for Loan Loss 111,500 -28.01 154,880 Loans, Net of Unearned Interest and Reserves 2,939,035 -29.81 4,187,546 Premises and Fixed Assets 0 0 Other Assets 22,803 177.33 8,222 Total Assets 2,961,838 -29.41 4,195,769 Liabilities Certificates of Investment 0 0 Other Borrowed Money 0 0 Other Liabilities 3,003,613 -26.04 4,061,135 Total Liabilities 3,003,613 -26.04 4,061,135 Equity Capital Capital Stock 0 0 Surplus & Undivided Profits 0 0 Current Earnings -41,775 -131.03 134,633 Total Equity Capital -41,775 -131.03 134,633 Total Liabilities and Equity Capital 2,961,838 -29.41 4,195,769
Kentucky Industrial Loan Companies Consolidated Report of Condition

29
25th Annual Securities Report The Dodd-Frank Consumer Protection and Wall Street Reform Act of 2010 promised to bring in a new era of financial regulation. A number of the Act’s enhanced protections, such as increasing state regula-tory authority over investment advisers, are in their final stages of taking root. State securities regula-tors successfully worked together in reviewing the applications of advisers required to register in four or more states in a coordinated manner as they switched from federal to state regulation. Our participa-tion in coordinated reviews and the outreach to investment advisers by conducting several Town Hall meetings throughout the state during the first quarter of 2011 showed our commitment to a smooth transition for the new class of state registrants. The lingering effects of the 2008 financial crisis have prompted additional measures to streamline the regulatory process in attempt to stimulate economic growth and job creation. There are several key is-sues that could significantly reshape the regulatory structure and responsibilities of state and federal securities regulators, i.e. self-regulation for investment advisers, expanding the fiduciary duty to broker- dealers when providing investment advice about securities to retail investors and enhancing the capital formation opportunities for small businesses. On June 21, 2011, state and federal regulators entered into consent orders with Morgan Keegan Compa-ny and Morgan Asset Management in connection with seven Morgan Keegan proprietary bond funds un-der investigation during the period from Jan. 1, 2007, to March 31, 2008. Kentucky was one of the lead states on the task force in this multi-state and federal enforcement action which resulted in $200 million in restitution to investors who held one or more of these Morgan Keegan funds whose risks and valua-tions were mischaracterized to investors during the period in question. Kentucky investors will receive approximately $11 million in restitution as a result of the enforcement action. The mission of the Division of Securities is to 1) protect investors through the active implementation and application of Kentucky’s securities laws in order to prevent investment fraud and related illegal conduct, and by taking remedial action, when possible, to mitigate the harm done to the investor, 2) edu-cate the investing public about investment matters and making informed investment decisions, and 3) provide investor protection without undue burden on the capital formation process. To fulfill its investor protection mission, the Division of Securities performs a variety of functions in-tended to help ensure that securities transactions are effected in compliance with the Kentucky Securi-ties Act, and that investors have the necessary material information with which to make informed in-vestment decisions and select securities professionals with whom to entrust their money. The Securities Division supports the DFI staff in performing educational outreach to high school students and commu-nity groups about savings and investing, participates in financial literacy forums across the common-wealth, and distributes informational brochures on financial matters through public libraries, county cooperative extension agencies and other public venues.
Division of Securities

30
Name City Alexander Investments Services Company Louisville Churchill Financial LLC Louisville Cypress Alts Louisville Dupree & Company Lexington First Kentucky Securities Corporation Frankfort Investment Bank Services Inc. Louisville J.J.B. Hilliard, W.L. Lyons LLC Louisville Jefferson National Securities Corporation Louisville Lexington Investment Company Inc. Lexington Nancy Barron & Associates Inc. Lexington Private Client Services LLC Louisville Winebrenner Capital Partners LLC Louisville Roosevelt Equity Corporation Louisville
2011 Broker-Dealers Headquartered in Kentucky
Licensing & Registration Branch Report Employees in the Licensing & Registration Branch process applications for the registration of broker-dealers, investment advisers and their licensed employees. The licensing staff can deny the applications of firms and individuals who do not meet the requirements of the Kentucky securities laws. The licens-ing staff also responds to inquiries from the public concerning investment adviser or broker licensing status and disciplinary history.
Division of Securities
Name City Altus Wealth management LLC Fort Mitchell Archer Financial Planning LLC Louisville ARL Advisers LLC Louisville Bluegrass Capital Advisors LLC Louisville Bluestone Advisors LLC Lexington Boardman Wealth Planning Inc. Lexington Scearce Services Inc. Lexington Capital Investment Management Inc. Leitchfield Cashel Financial Advisers LLC Louisville Christina Vittitow O’Bryan CFP Owensboro Churchill Financial LLC Louisville
2011 Investment Advisers Headquartered in Kentucky
31
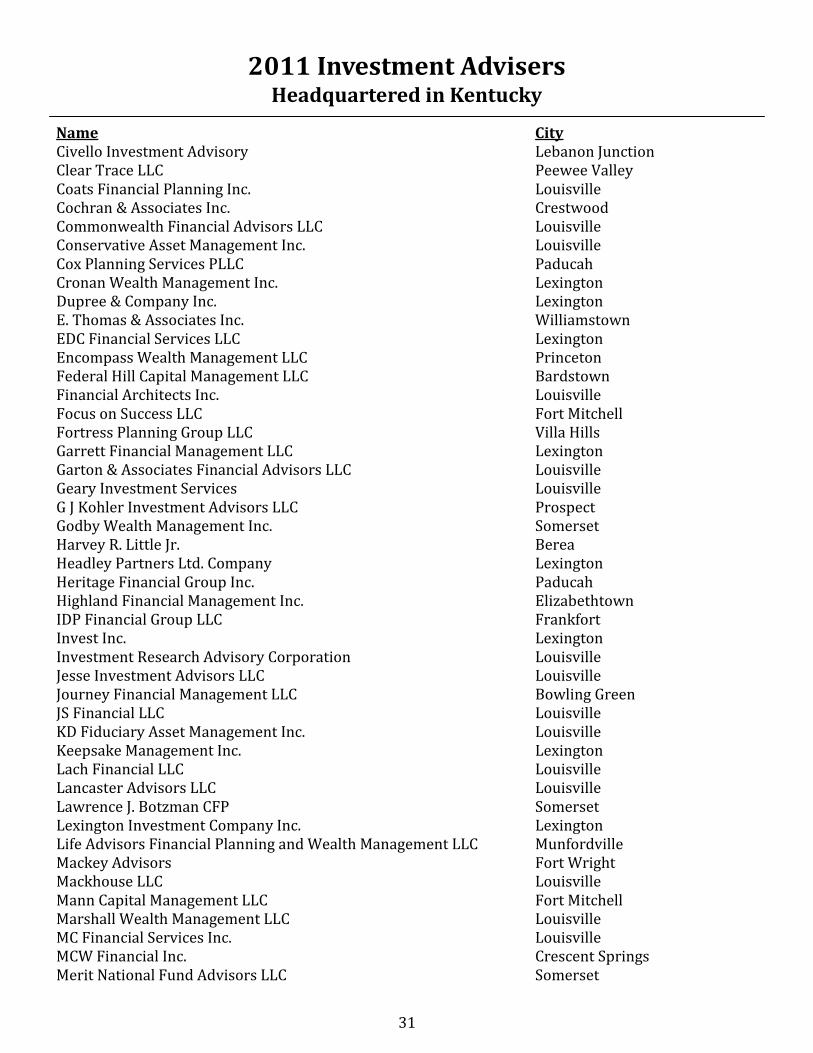
Name City Civello Investment Advisory Lebanon Junction Clear Trace LLC Peewee Valley Coats Financial Planning Inc. Louisville Cochran & Associates Inc. Crestwood Commonwealth Financial Advisors LLC Louisville Conservative Asset Management Inc. Louisville Cox Planning Services PLLC Paducah Cronan Wealth Management Inc. Lexington Dupree & Company Inc. Lexington E. Thomas & Associates Inc. Williamstown EDC Financial Services LLC Lexington Encompass Wealth Management LLC Princeton Federal Hill Capital Management LLC Bardstown Financial Architects Inc. Louisville Focus on Success LLC Fort Mitchell Fortress Planning Group LLC Villa Hills Garrett Financial Management LLC Lexington Garton & Associates Financial Advisors LLC Louisville Geary Investment Services Louisville G J Kohler Investment Advisors LLC Prospect Godby Wealth Management Inc. Somerset Harvey R. Little Jr. Berea Headley Partners Ltd. Company Lexington Heritage Financial Group Inc. Paducah Highland Financial Management Inc. Elizabethtown IDP Financial Group LLC Frankfort Invest Inc. Lexington Investment Research Advisory Corporation Louisville Jesse Investment Advisors LLC Louisville Journey Financial Management LLC Bowling Green JS Financial LLC Louisville KD Fiduciary Asset Management Inc. Louisville Keepsake Management Inc. Lexington Lach Financial LLC Louisville Lancaster Advisors LLC Louisville Lawrence J. Botzman CFP Somerset Lexington Investment Company Inc. Lexington Life Advisors Financial Planning and Wealth Management LLC Munfordville Mackey Advisors Fort Wright Mackhouse LLC Louisville Mann Capital Management LLC Fort Mitchell Marshall Wealth Management LLC Louisville MC Financial Services Inc. Louisville MCW Financial Inc. Crescent Springs Merit National Fund Advisors LLC Somerset
2011 Investment Advisers Headquartered in Kentucky
32
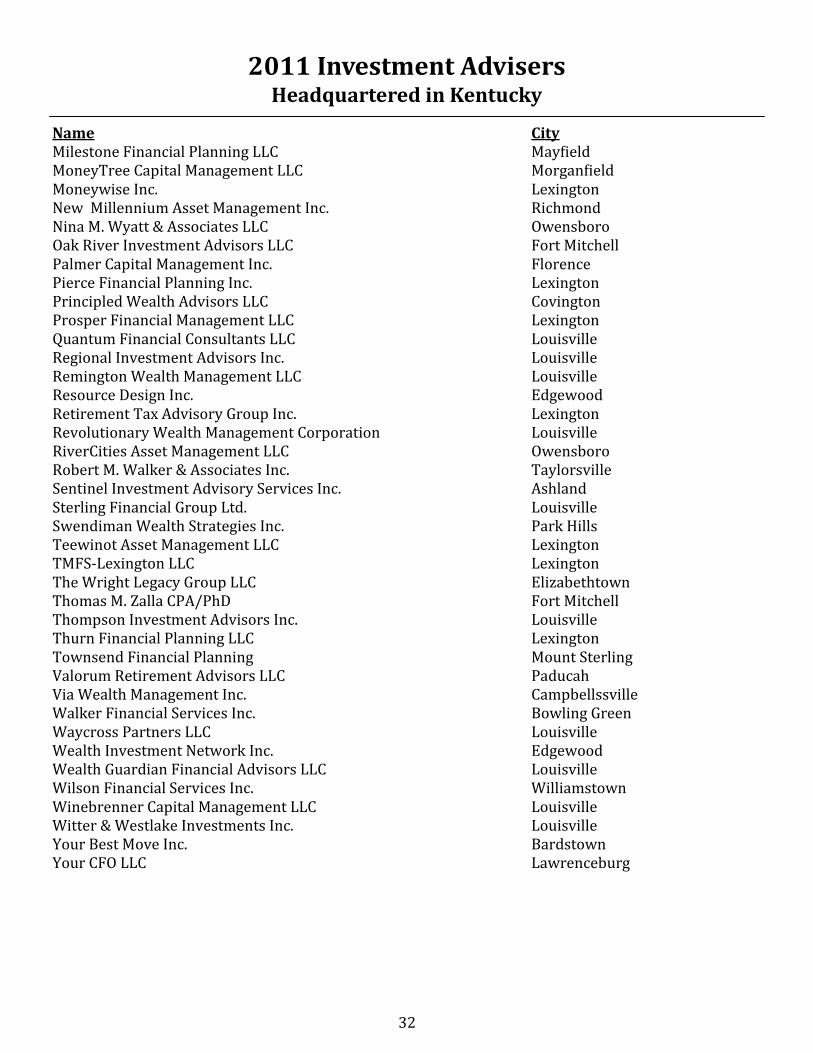
Name City Milestone Financial Planning LLC Mayfield MoneyTree Capital Management LLC Morganfield Moneywise Inc. Lexington New Millennium Asset Management Inc. Richmond Nina M. Wyatt & Associates LLC Owensboro Oak River Investment Advisors LLC Fort Mitchell Palmer Capital Management Inc. Florence Pierce Financial Planning Inc. Lexington Principled Wealth Advisors LLC Covington Prosper Financial Management LLC Lexington Quantum Financial Consultants LLC Louisville Regional Investment Advisors Inc. Louisville Remington Wealth Management LLC Louisville Resource Design Inc. Edgewood Retirement Tax Advisory Group Inc. Lexington Revolutionary Wealth Management Corporation Louisville RiverCities Asset Management LLC Owensboro Robert M. Walker & Associates Inc. Taylorsville Sentinel Investment Advisory Services Inc. Ashland Sterling Financial Group Ltd. Louisville Swendiman Wealth Strategies Inc. Park Hills Teewinot Asset Management LLC Lexington TMFS-Lexington LLC Lexington The Wright Legacy Group LLC Elizabethtown Thomas M. Zalla CPA/PhD Fort Mitchell Thompson Investment Advisors Inc. Louisville Thurn Financial Planning LLC Lexington Townsend Financial Planning Mount Sterling Valorum Retirement Advisors LLC Paducah Via Wealth Management Inc. Campbellssville Walker Financial Services Inc. Bowling Green Waycross Partners LLC Louisville Wealth Investment Network Inc. Edgewood Wealth Guardian Financial Advisors LLC Louisville Wilson Financial Services Inc. Williamstown Winebrenner Capital Management LLC Louisville Witter & Westlake Investments Inc. Louisville Your Best Move Inc. Bardstown Your CFO LLC Lawrenceburg
2011 Investment Advisers Headquartered in Kentucky
33
Licensing & Registration Branch Report
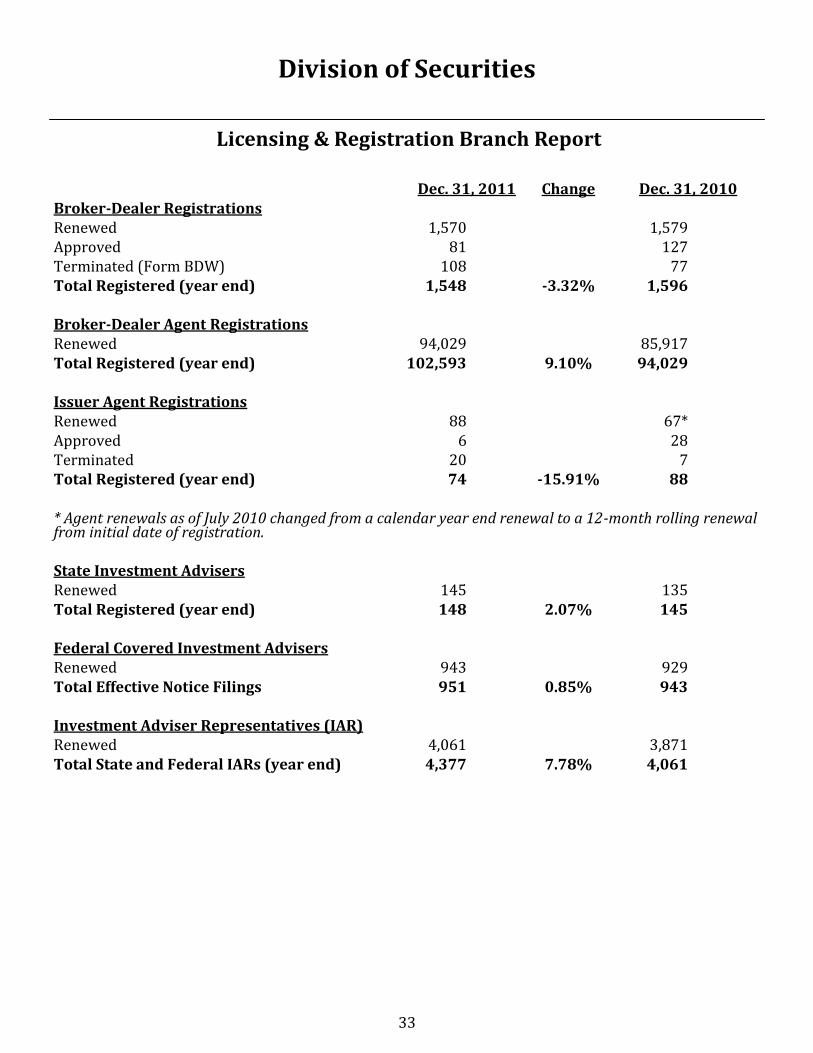
Dec. 31, 2011 Change Dec. 31, 2010 Broker-Dealer Registrations Renewed 1,570 1,579 Approved 81 127 Terminated (Form BDW) 108 77 Total Registered (year end) 1,548 -3.32% 1,596 Broker-Dealer Agent Registrations Renewed 94,029 85,917 Total Registered (year end) 102,593 9.10% 94,029 Issuer Agent Registrations Renewed 88 67* Approved 6 28 Terminated 20 7 Total Registered (year end) 74 -15.91% 88 * Agent renewals as of July 2010 changed from a calendar year end renewal to a 12-month rolling renewal from initial date of registration. State Investment Advisers Renewed 145 135 Total Registered (year end) 148 2.07% 145 Federal Covered Investment Advisers Renewed 943 929 Total Effective Notice Filings 951 0.85% 943 Investment Adviser Representatives (IAR) Renewed 4,061 3,871 Total State and Federal IARs (year end) 4,377 7.78% 4,061
Division of Securities
34
Licensing & Registration Branch Report
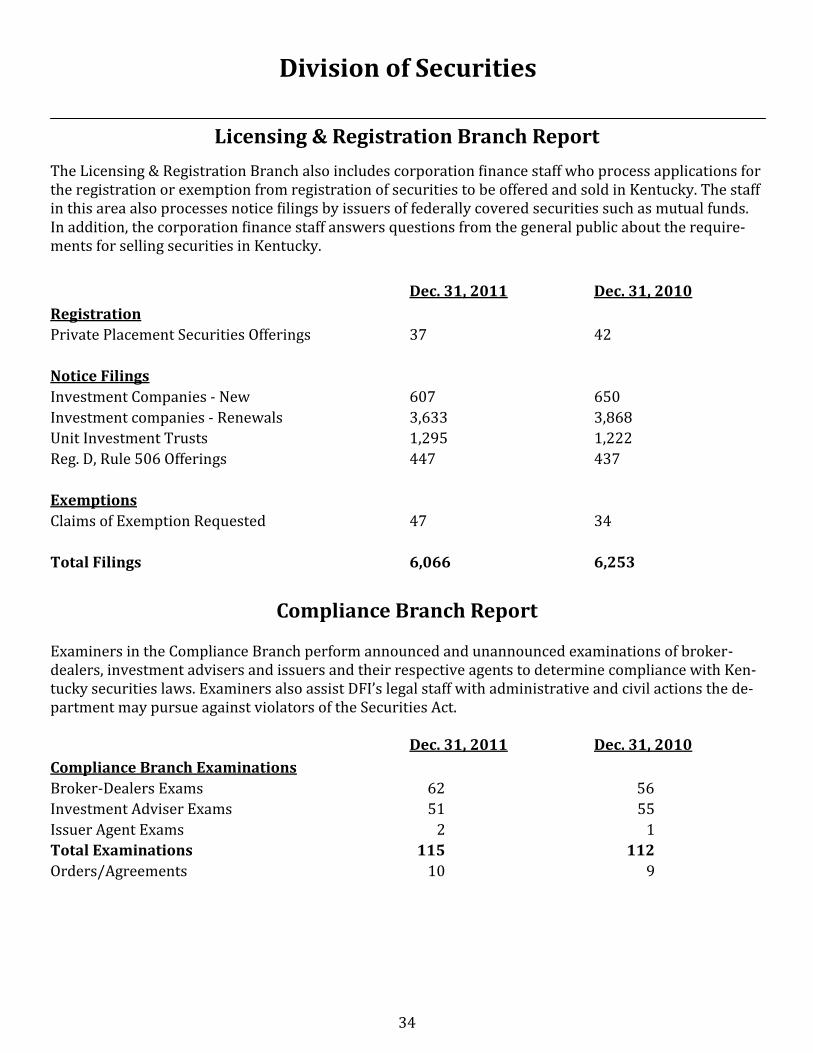
The Licensing & Registration Branch also includes corporation finance staff who process applications for the registration or exemption from registration of securities to be offered and sold in Kentucky. The staff in this area also processes notice filings by issuers of federally covered securities such as mutual funds. In addition, the corporation finance staff answers questions from the general public about the require-ments for selling securities in Kentucky.
Dec. 31, 2011 Dec. 31, 2010
Registration
Private Placement Securities Offerings 37 42
Notice Filings
Investment Companies - New 607 650
Investment companies - Renewals 3,633 3,868
Unit Investment Trusts 1,295 1,222
Reg. D, Rule 506 Offerings 447 437
Exemptions
Claims of Exemption Requested 47 34
Total Filings 6,066 6,253
Compliance Branch Report Examiners in the Compliance Branch perform announced and unannounced examinations of broker-dealers, investment advisers and issuers and their respective agents to determine compliance with Ken-tucky securities laws. Examiners also assist DFI’s legal staff with administrative and civil actions the de-partment may pursue against violators of the Securities Act. Dec. 31, 2011 Dec. 31, 2010
Compliance Branch Examinations
Broker-Dealers Exams 62 56
Investment Adviser Exams 51 55
Issuer Agent Exams 2 1
Total Examinations 115 112
Orders/Agreements 10 9
Division of Securities
35
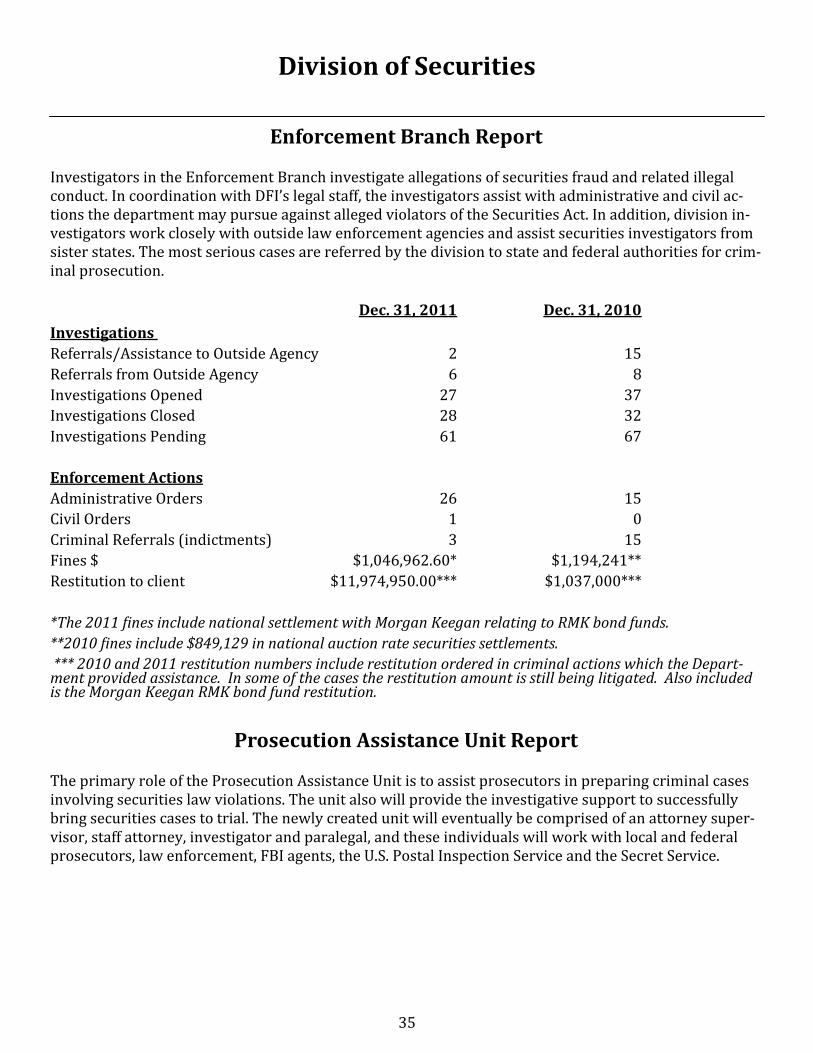
Enforcement Branch Report Investigators in the Enforcement Branch investigate allegations of securities fraud and related illegal conduct. In coordination with DFI’s legal staff, the investigators assist with administrative and civil ac-tions the department may pursue against alleged violators of the Securities Act. In addition, division in-vestigators work closely with outside law enforcement agencies and assist securities investigators from sister states. The most serious cases are referred by the division to state and federal authorities for crim-inal prosecution.
Dec. 31, 2011 Dec. 31, 2010
Investigations
Referrals/Assistance to Outside Agency 2 15
Referrals from Outside Agency 6 8
Investigations Opened 27 37
Investigations Closed 28 32
Investigations Pending 61 67
Enforcement Actions
Administrative Orders 26 15
Civil Orders 1 0
Criminal Referrals (indictments) 3 15
Fines $ $1,046,962.60* $1,194,241**
Restitution to client $11,974,950.00*** $1,037,000***
*The 2011 fines include national settlement with Morgan Keegan relating to RMK bond funds.
**2010 fines include $849,129 in national auction rate securities settlements.
*** 2010 and 2011 restitution numbers include restitution ordered in criminal actions which the Depart-ment provided assistance. In some of the cases the restitution amount is still being litigated. Also included is the Morgan Keegan RMK bond fund restitution.
Prosecution Assistance Unit Report The primary role of the Prosecution Assistance Unit is to assist prosecutors in preparing criminal cases involving securities law violations. The unit also will provide the investigative support to successfully bring securities cases to trial. The newly created unit will eventually be comprised of an attorney super-visor, staff attorney, investigator and paralegal, and these individuals will work with local and federal prosecutors, law enforcement, FBI agents, the U.S. Postal Inspection Service and the Secret Service.
Division of Securities