Embed Size (px)
Citation preview

1
Table of Contents
Abstract .................................................................................................................. 4
Acknowledgement ................................................................................................. 5
Abbreviations ......................................................................................................... 7
List of tables .......................................................................................................... 8
List of figures ......................................................................................................... 9
Introduction.......................................................................................................... 10
Objectives of Study ............................................................................................. 10
Chapter 1: Review of the literature ...................................................................... 11
1.1. Wastewater from food processing factory ................................................ 11
1.2. Constructed wetlands ................................................................................ 12
1.2.1. General information ........................................................................... 12
1.2.2. Classify and design ............................................................................ 13
1.2.3. Microorganisms ................................................................................. 17
1.2.4. Plants.................................................................................................. 18
1.3. Pretreatment system .................................................................................. 20
1.4. Wastewater treatment by constructed wetlands ....................................... 21
1.4.1. Microorganisms role .......................................................................... 21
1.4.2. Plant role ............................................................................................ 22
1.4.3. Removing of organic materials.......................................................... 23
1.4.4. Nitrogen removal ............................................................................... 25
1.4.5. Phosphorus removal .......................................................................... 26
1.4.5. Pathogen removal .............................................................................. 27

2
1.4.6. Acidity - Alkalinity ............................................................................ 27
Chapter 2: Materials and method ......................................................................... 28
2.1. Chemicals and equipment ......................................................................... 28
2.2. Equipment design ..................................................................................... 28
2.2.1. Aeration tank design .......................................................................... 28
2.2.2. CW design ......................................................................................... 29
2.3. Experiment design .................................................................................... 30
2.3.1. Batch experiments ............................................................................. 30
2.3.2. Flow rate optimization of the pretreatment system ........................... 30
2.3.3. Plant selection .................................................................................... 31
2.4. Procedures and analysis method ............................................................... 32
2.4.1. Determination of COD ...................................................................... 32
2.4.2. Determination of ammonium by colorimetric method with Nessler
indicator ............................................................................................................. 33
2.4.3. Determination of NO2- concentration in water by colorimetric method
with Griss reagent ............................................................................................. 36
2.4.4. Determination of NO3- concentration ................................................ 37
2.4.5. Determination of phosphorus by mean of optical measurement with
reagents Amonimolipdat-vanadate ................................................................... 39
Chapter 3. Results and discussions ...................................................................... 42
3.1. Batch treatment ......................................................................................... 42
3.1.1. Anaerobic process .............................................................................. 42
3.1.2. Aerobic process ................................................................................. 43
3.2. Continuous treatment – retention time optimization ................................ 45

3
3.3. Plant selection ........................................................................................... 47
3.4. Constructed wetland ................................................................................. 49
Conclusion ........................................................................................................... 53
Referents .............................................................................................................. 55

4
Abstract
Wastewater from squid processing has high content of organic pollutants, but
low fat oil and grease content (FOG). Wastewater of the company was found to
have a COD of 800-2500mg/L depending on the time of the day. Ammonium,
phosphate content were much higher the limit of TCVN 5945-2005 (type B).
Anaerobic treatment in a batch reactor required long retention time. After 9 days,
COD value reduced from 2546 to 1973 mg/L that didn’t meet requirement of
constructed wetland (CW) input. Aerobic treatment in batch reactor quickly reduced
COD value to 200-400mg/L in less than a day. In an activated sludge continuous
reactor, COD value reduced more than 80% in 12.7 hours, longer retention time
didn’t help to lower COD content. Ammonium, nitrate, nitrite contents in all set
retention times were acceptable for CW.
Two species of Limnophila and Cyperus genera have potential of using in
constructed wetland (CW). Results showed that they met the conditions of high
organic matter and salt content of wastewater. Both systems using these plants were
equivalent in reducing COD value and phosphorous, achieved percentage 60%,
68%, respectively. The species of Limnophila genus advantaged in treating
ammonium, nitrite, nitrate ions, achieved 66.3%, 76.4%, 65.0%, respectively.
Biomass of the selected plants could take into account as food for animal and
materials of handicraft.
Constructed wetland (CW) was cultivated Cyperus Malaccensis Lam..
Hydraulic loading rate was controlled approximately 135mm/day. Percentage of
nutrition conversion of ammonium, nitrite, nitrate, total phosphorous was stable
according to the time. The system had high effect in removing ammonium, nitrite,
nitrate, phosphorous, 80.3±15.8%, 93.2±7.2%, 72.8±25.0%, 73.1±26.6%,
respectively. Output concentrations met requirements of the Vietnamese standard
QCVN 11:2008. COD value was reduced from 300-400mg/L to 91.6±9.9 mg/L.
The presence of anammox strain could cause reducing concentration of nitrite
remarkably.

5
Acknowledgement
I would like to thank the government of German, German Acadeic Exchange
Service (Deutscher Akademischer Austausch Dienst, DAAD), the University of
Technology Dresden, Germany and Hanoi University of Science, Vietnam National
University (HUS, VNU) for scholarship of the Master’s program. My sincere thanks
also due to the Prime Minister’s Office, Ministry of Science and Technology
(MOST) of Lao P.D.R for the kind permission offered me to study.
I would like to express the profound gratitude and the great appreciation to my
advisor Dr. Hoang Van Ha for his excellent guidance, excellent encouragement and
valuable suggestions throughout this study. Special appreciation is extended to Prof.
Bui Duy Cam, Prof. Bernd Bilitewski, Prof. Nguyen Thi Diem Trang and
committee members for their valuable recommendation and dedicated the valuable
time to evaluate my work and my study here during I was being a HUS, VNU
student.
The experiments have been conducted at the Laboratory of Biotechnology and
Food Chemistry, Faculty of Chemistry, HUS. I gratefully thanks are extended to the
staff members for offering lots of the good laboratory instruments, especially Prof.
Trinh Le Hung and Ms. Vu Thi Bich Ngoc.
Gratefully acknowledgement is extended to Hanoi University of Science, VNU
for providing the scholarship and giving me opportunity to pursue the study in here.
Thanks are due to all friends, the Waste Management and Contaminated Site
Treatment program staff members and colleagues in HUS for their full cooperation
during the experiment and for encouragement.
During studying in HUS, I felt very lucky, it gives me the opportunity to have
lots of good friends, good memory, so I would like to say thanks and pleasure to
meet all of you, even though we came from different country, but we can make
friend together. I hope and wish that we would be working together and meet each
other again in future.

6
Finally, I would like to express deep appreciation to my lovely family, my
beloved family and relatives for their love, kind support, and encouragement for the
success of this study.
This thesis is dedicated for you.

7
Abbreviations
ABS: Absorptance
ADP: Adenosine Di phosphate
AMP: Adenosine Mono Phosphate
ATP: Adenosine Tri Phosphate
CW: Constructed Wetland
DAAD: Deutscher Akademischer Austausch Dienst (German Academic Exchange
Service)
COD: Chemical Oxygen Demand
FWS: Free Water Surface
HLR: Hydraulic loading rate
HUS: Hanoi University of Science
SF: Subsurface Flow
TSS: Total Suspended Solids
TCVN: Vietnamese standard
QCVN: Vietnamese guide
VNU: Vietnam National University, Hanoi

8
List of tables
Table 1-1. Pollution Remove Mechanisms in constructed wetlands (Cooper et
al…1997) ………..………………………………………………….……………….. 24
Table 2-1. Flow rate and corresponding retention time and continuous operation
conditions ..……….……………………….…………………….……………………31
Table 2-2. Data of standard curve NH4+ ..…………………………………………35
Table 2-3. Data of NO2- standard curve ...................................................................37
Table 2-4. Results of standard NO3- ……….……………...………………………38
Table 2-5. Results of standard PO43- ……….……………......……………………..40
Table 3-1. Anaerobic treatment from May 13th, 2011 to May 17th, 2011 and May
19th, 2011 to May 28th 2011………...………………………………………………...42

9
List of figures
Figure 1-1. Basic types of Constructed Wetlands ……………………….………..13
Figure 1-2. Schematic cross-section of a horizontal flow constructed wetland
……………………………………………………………..…………………………..15
Figure 1-3. Schematic cross-section of a vertical flow constructed wetland….…..16
Figure 1-4. Emergent plants: (a) Bulrush, (b) Cattail, (c) Reeds Submerged…...19
Figure 1-5. Nitrogen transformation in wetland system……………..…………….26
Figure 1-6. Phosphorus cycling in a FWS wetland ….…………………………….27
Figure 2-1. Laboratory wastewater treatment systems ……………..…………….29
Figure 2-2. Constructed wetland design ………………………………….………...29
Figure 2-3. Two species of Limnophila (b) and Cyperus (a) genera ………………31
Figure 2-4. Standard curve of NH4+ ………………………………………………...35
Figure 2-5. Standard curve of NO2+ ………………………………………………...37
Figure 2-6. Standard curve of NO3- ………………………………………………...39
Figure 2-7. Standard curve of PO43- ………………………………………………..41
Figure 3-1. COD value changing in aeration tanks ………………………………..43
Figure 3-2: Changing trend of ammonia (a), nitrite (b), nitrat (c), and
phosphorous equivalent (d) content. …………………………………………..……44
Figure 3-3. Effect of retention time on the COD value of effluent ………………..45
Figure 3-4. Effect of retention time on ammonium (a), nitrate (b), nitrite (c),
phosphate (d) removal. ……………………..………………………………………..46
Figure 3-5. Percentage of COD reduction in Limnophila basin and Cyperus
basin…………….……………………………………………………………………..47
Figure 3-6. Amoni, nitrit, nitrat treatment of Cyperus (sedge) and Limnophila
genera. ……………..…………………………………………………………………48
Figure 3-7. Phosphorous treatment of Cyperus (sedge) and Limnophila genera. 48
Figure 3-8: Percentages of COD (a), ammonium (c), nitrite (e), nitrate (g),
phosphate equivalent reduction; Column graphs b, d, f, h, i show average contents
of these parameters according to 4 levels; the straight line scatter showed removal
effect according to 4 levels. ………………………………………………………….51

10
Introduction
Currently, although Vietnam authorities and organizations have tried much in
implementing the policies and legislations on the environmental protection, the
situation of polluted environment is still a very worrying issue.
With rapid speed of industrialization and urbanization, the population growth
has increasingly caused severe pressure on water resources in the territories. Water
source in many urban areas, industrial zones and trade villages has been
increasingly polluted. In big cities, hundreds of industrial production cause of the
polluting of the water source as there is no waste treatment equipment or plant.
Water pollution caused by industrial production is very serious.
With abundant marine resources, seafood industry plays an important role in the
economy of Vietnam. But seafood processing factories are also the major sources of
pollutant to surrounding environment especially to water and soil if the wastewater
is not treated properly. Conventional wastewater treatment system with aero-tank,
sedimentation, disinfection in almost seafood processing plants in south of Vietnam
gives unstable output with BOD, COD, nitrogen-total many times higher than
allowed values of Vietnamese Standards (Department of Natural resources and
environment of Hochiminh City).
Therefore, with given reasons, using constructed wetlands for treatment of
wastewater in seafood processing is realistic and necessary at the moment situation
of Vietnam.
Objectives of Study
- Using constructed wetland to treat seafood processing wastewater,
- Optimization pretreatment system for constructed wetland
- Selecting suitable vegetation for local environment to plant in constructed
wetland.

11
Chapter 1: Review of the literature
The most common treatment process consists of chemical physical treatment
step, and biological treatment step depending on the composition of the wastewater.
Biological wastewater treatment process is more commonly used because of its high
efficiency in organic matter removal. Constructed wetland system relies on the
biodiversity process due to the plant and microorganisms.
1.1. Wastewater from food processing factory
Seafood processing wastewater contains highly concentrated pollutants,
including suspended solids, organics and nutrients. These may deteriorate the
quality of the aquatic environments into which they are discharged
(Sirianuntapiboon and Nimnu, 1999). To avoid this impact, treatment of seafood
processing wastewater before discharge has been proposed. A candidate method of
treatment is constructed wetland. Wetlands have significant merits of low capital
and operating costs compare with conventional system as activated sludge, aerated
lagoon system and so on (Hammer et al., 1993; Cronk, 1996; Kadlec and Knight,
1996; Hill and Sobesy, 1998; Humenik et al., 1999; Neralla et al., 2000; Szogy et
al., 2000). And the growth of non-food crops in a closed hydroponic system, using
wastewater as nutrient solution, could solve in an ecologically acceptable way the
wastewater problem and in the meantime produce biofuels, or other products useful
for industry (Mavrogianopoulos et al., 2002). Constructed wetlands have been
widely used in treating different types of contaminant found in domestic sewage,
storm water, various industrial wastewaters, agricultural runoff, acid mine drainage
and landfill leachate (Green and Martin, 1996; Vrhovsek et al., 1996; Higgins et al.,
1993; Karathanasis and Thompson, 1995; Bernard and Lauve, 1995). Natural
treatment systems have been shown to have a significant capacity for both
wastewater treatment and resource recovery (Hofmann, 1996; Ciria et al., 2005;
Reed et al., 1988). The wetland system was usually applied as the tertiary treatment
due to the high solids content and organic matter concentration of the raw
wastewater (Kadlec and Knight, 1996).

12
1.2. Constructed wetlands
1.2.1. General information
Constructed wetlands are engineered systems that have been designed and
constructed to utilize the natural processes involving wetland vegetation, soils, and
their associated microbial assemblages to assist in treating wastewater (Vymazal, J.,
2006). Constructed wetland technology is more widespread in industrialized
countries due to more stringent discharge standards, finance availability, change in
tendency to use on-site technologies instead of centralized systems, and the existing
pool of experience and knowledge based on science and practical works (Korkusuz
et. al., 2005).
Constructed wetlands are becoming increasingly common features emerging in
landscapes across the globe. Although similar in appearance to natural wetland
systems (especially marsh ecosystems), they are usually created in areas that would
not naturally support such systems to facilitate contaminant or pollution removal
from wastewater or runoff (Hammer, 1992; and Mitsch and Gosselink, 2000).
According to Lim et. al,. (2003), the constructed wetlands have higher tendency o
remove pollutants such as organic matters, suspended solids, heavy metal and other
pollutants simultaneously. Some of the studies show that the ability of wetland
systems to effectively reduce total suspended solid, biochemical oxygen demand
(Watson et al., 1990 and Rousseau, 2005) and fecal coliform (Nokes et. al., 1999
and Nerall et. al., 2000) are well established. Nitrogen (ammonia and total nitrogen)
and phosphorus are processed with relatively low efficiency by most wetland
systems (Steer et al., 2005). The constructed wetlands systems can have different
flow formats, media and types of emergent vegetation planted. Constructed
wetlands are classified into two types in general, namely free water surface systems
(FWS) and subsurface flow systems (SF).

13
1.2.2. Classify and design
Constructed wetlands could be classified according to the various parameters but
two most important criteria are water flow regime (surface and sub-surface) and the
type of macrophytic growth. Different hybrid or combined systems in order to
exploit the specific advantages of the different systems.
Figure 1-1. Basic types of Constructed Wetlands
Constructed wetlands with surface flow (= free water surface, FWS) consist of
basins or channels, with soil or another suitable medium to support the rooted
vegetation (if present) and water at a low flow velocity, and presence of the plant
stalks and litter regulate water flow and, especially in long, narrow channels, ensure
plug-flow conditions (Reed et al., 1988). One of their primary design purposes is to
contact wastewater with reactive biological surfaces (Kadlec and Knight, 1996).
The FWS CWs can be classified according to the type of macrophytes.
Subsurface flow constructed wetlands (SSF CWs) have two typical types:
horizontal flow subsurface flow (HF-SSF) CWs; vertical flow subsurface flow (VF-
SSF) CWs, besides two types a combination call hybrid systems with horizontal and
vertical flow.

14
Horizontal flow (HF)
Figure 1-2 shows schematic cross section of a horizontal flow constructed
wetland. It is called HF wetland because the wastewater is fed in at the inlet and
flow slowly through the porous substrate under the surface of the bed in a more or
less horizontal path until it reaches the outlet zone. During this passage the
wastewater will come into contact with a network of aerobic, anoxic and anaerobic
zones. The aerobic zones will be around the roots and rhizomes of the wetland
vegetation that leak oxygen into the substrate. During the passage of wastewater
through the rhizosphere, the wastewater is cleaned by microbiological degradation
and by physical and chemical processes (Cooper et al. 1996). HF wetland can
effectively remove the organic pollutants (TSS, BOD5 and COD) from the
wastewater. Due to the limited oxygen transfer inside the wetland, the removal of
nutrients (especially nitrogen) is limited; however, HF wetlands remove the nitrates
in the wastewater.

15
Figure 1-2. Schematic cross-section of a horizontal flow constructed wetland (Morel & Diener 2006)
Vertical flow (VF)
VF constructed wetland comprises a flat bed of sand/gravel topped with
sand/gravel and vegetation (Figure 1-3). Wastewater is fed from the top and then
gradually percolates down through the bed and is collected by a drainage network at
the base.
VF wetlands are fed intermittently in a large batch flooding the surface. The
liquid gradually drains down through the bed and is collected by a drainage network
at the base. The bed drains completely free and it allows air to refill the bed. The
next dose of liquid traps this air and this together with aeration caused by the rapid
dosing onto the bed leads to good oxygen transfer and hence the ability to nitrify.
The oxygen diffusion from the air created by the intermittent dosing system
contributes much more to the filtration bed oxygenation as compared to oxygen
transfer through plant. Platzer (1998) showed that the intermittent dosing system
has a potential oxygen transfer of 23 to 64 g O2.m-2.d-1 whereas Brix (1997)
showed that the oxygen transfer through plant (common reed species) has a
potential oxygen transfer of 2 g O2.m-2. d-1 to the root zone, which mainly is
utilized by the roots and rhizomes themselves. The latest generation of constructed

16
wetlands has been developed as vertical flow system with intermittent loading. The
reason for growing interest in using vertical flow systems are:
- They have much greater oxygen transfer capacity resulting in good
nitrification;
- They are considerably smaller than HF system,
- They can efficiently remove BOD5, COD and pathogens.
Figure 1-3. Schematic cross-section of a vertical flow constructed wetland (Morel & Diener 2006).
Treatment principles for different types of CWs
Constructed wetlands are usually designed for removal of the following
pollutants in wastewater:
- suspended solids;
- organic matter (measured as BOD and COD);
- nutrients (nitrogen and phosphorus).
Treatment processes occur in about eight compartments:
- Sediment /gravel bed
- Root zone/pore water

17
- Litter/detritus
- Water
- Air
- Plants
- Roots
- Bacteria growing in biofilms
The treatment in the CWs is the result of complex interactions between all these
compartments. Due to these compartments a mosaic of sites with different redox
conditions (anaerobic, aerobic and anoxic) exists in constructed wetlands, which
triggers diverse degradation and removal processes.
The general prerequisites for being able to use constructed wetlands for
wastewater treatment are:
- Availability of enough space because it is a “low-rate system” with a high
space requirement,
- Organic loading not too high (expressed as gBOD/m2/day),
- Hydraulic loading not too high; detention time long enough,
- Sufficient incident light to allow photosynthesis,
- Temperature not too low (CWs still work in cold climates, but designs need
to be adjusted (Jenssen et al., 2008)),
- Trained maintenance staff or committed users are available who carry out the
(simple) maintenance tasks,
- Wastewater not too toxic for bacteria and plants,
- Adequate quantities of nutrients to support growth.
1.2.3. Microorganisms
Microorganisms play an important role in the removal of pollutants in
constructed wetlands (CWs, Tietz et al., 2008; Ahn et al., 2007; Krasnits et al.,
2009). Many microorganisms play different roles in mediating mineralization or in
the transformation of pollutants, such as degradation of organic matter (i.e., organic

18
carbon compounds, proteins, organic phosphorus and sulfur compounds), nitrogen
transformations (including ammonification, nitrification and denitrification), sulfate
oxidation and reduction (Ahn et al., 2007; Calheiros et al., 2009; Faulwetter et al.,
2009). The substratum provides the support and attachment surface for
microorganisms able to anaerobically (and/or anoxically if nitrate is present) reduce
the organic pollutants into CO2, CH3, H2S, etc. Phosphorus is adsorbed and can be
implanted in the plant growth of the CW. The substratum also acts as a simple filter
for the retention of influent suspended solids and generated microbial solids, which
are then themselves degraded and stabilized over an extended period within the bed.
Therefore, pollutant removal and microbial communities in CWs are closely tied
to the cycling of carbon, nitrogen, phosphorus and sulfur.
1.2.4. Plants
Wetland plants are prolific plants growing in water bodies. The wetland plants
intercepts overland water flow and remove some or most of its sediment and
nutrients, and reduce the volume of runoff (Lim et al., 2002). Bacteria that attach to
the surface of wetland plants plays important role in removing pollutants in
wastewater (Cronk and Fennessy, 2001). 3 types of wetland plants, which are
emergent plants, submerged plants and floating plants.
Emergent plants type where, shoots distinctly above the water surface and are
attached to the soil by their roots such as cattail and bulrush as shown in Figure 1-4.
These plants tend to have a higher potential in wastewater treatment, because can
serve as a microbial habitat and filtering medium. They are typical plants using in
SSF-CWs.

19
Figure 1-4. Emergent plants: (a) Bulrush, (b) Cattail, (c) Reeds Submerged
Establishing vegetation is probably the least familiar aspect of wetland
construction. Vegetation can be introduced to a wetland by transplanting roots,
rhizomes, tubers, seedlings, or mature plants; by broadcasting seeds obtained
commercially or from other sites; by importing substrate and its seed bank from
nearby wetlands; or by relying completely on the seed bank of the original site.
Many of the wetlands are planted with clumps or sections of rhizomes dug from
natural wetlands. Propagation from seed and planting of the established plantlets is
gaining popularity.
Two main techniques for planting rhizomes are:
- Planting clumps
- Planting cuttings
Clumps of rhizome mat can be excavated from an existing stand of reeds whilst
minimizing damage to the existing wetland and the rhizomes clump obtained. For
the small scale wetland, it can be dug out with a spade but for large-scale projects
the use of an excavator is required. When transporting or storing, clumps should not
be stacked. In this way the aerial stems are not damaged. The spacing of planting
depends on the size of the clumps obtained. Planting 1 m2 clumps, at 10 m spacing

20
or smaller clumps 1 or 2 m2 should achieve full cover within one year depending
upon mortality (Cooper et. al., 1996).
Rhizome cuttings can be collected from the existing wetlands or from
commercial nurseries. Sections of undamaged rhizome approximately 100 mm long
with at least one internode, bearing either a lateral or terminal bud, should be used
for planting. Rhizomes should be planted with one end about a half below the
surface of the medium and other end exposed to the atmosphere at spacing of about
4 rhizomes per m2.
1.3. Pretreatment system
Before the wastewater can be treated in CWs, suspended solids and larger
particles as well as some organic matter need to be removed. This can be achieved
by:
- Pre-treatment (screens)
- Primary treatment by septic tanks, settling tanks, Imhoff tanks or anaerobic
baffled reactors (ABRs).
Adequate pre-treatment is extremely important to avoid clogging of subsurface
flow CWs (clogging reduces the treatment efficiency drastically be reducing the
free pore spaces due to accumulation of solids).
Aeration tank
The aeration tank in the wastewater treatment plant provides aerobic biological
treatment. Microbes utilize the organic matter in the wastewater as a food/energy
source, producing additional biomass, carbon dioxide and water. The process does
not include biomass collection and recycling. Biomass accumulation occurs as a
result of only a portion (i.e. 37%) of the tank’s contents being removed each cycle,
and therefore a certain level of suspended growth biological treatment develops
(Marsh, 2007).

21
The aeration tank is operated as a continuous mix reactor. The air for the
diffusion system is supplied by a compressor, which results in elevated dissolved
oxygen (DO) levels in the tank.
1.4. Wastewater treatment by constructed wetlands
1.4.1. Microorganisms role
Biological treatment using the aerobic method is based on aerobic microbial
activity in wastewater. The result of treatment is the contaminated organic matter
which is mineralized into inorganic, simple gases such as CO2 and water.
The treatment process consists of three stages, indicated by the reaction:
• Oxidation of organic matter:
• General construction of the cell:
• Self-oxidation of cell material (biodegradable):
In the process of aerobic biological treatment, if the wastewater contains NH4+,
it may occur nitrification as follows:
Wastewater containing phosphorus will occur phosphorus absorption process of
microbial cells under molecules as AMP, ADP, ATP.

22
It is well known that the ability of CWs to purify wastewater is mainly achieved
by microbes and plants, e.g., microbes remove pollutants from wastewater through
decomposition of organic matter, transformation of inorganic compounds (such as
ammonification, nitrification and denitrification) and uptake of nitrogen and other
nutrients, whereas plants remove pollutants mainly through uptake of nutrients (Ahn
et al., 2007; Tietz et al., 2008; Wang et al., 2010), but the frequently asked question
whether plants have effects on the structure and activity of microbial communities
in CW systems for wastewater treatment is debatable. Some studies reported that
plants have a major effect on the size, structure and function of microbial
communities in CW systems for wastewater treatment (Collins et al., 2004;
Caravaca et al., 2005; Osem et al., 2007; Calheiros et al., 2009; Kantawanichkul
et al., 2009), while others have demonstrated that plants appear to have little or
no effect on the performance of CW for pollutant removal, the community structure
or the abundance of one or several particular functional groups of microbial
organisms such as the ammonia-oxidizing bacteria (Gorra et al., 2007),
methanogens and methanotrophs (DeJournett et al., 2007), or the bacterial
community (Ahn et al., 2007; Baptista et al., 2008; Tietz et al.,2007).
Although the magnitude of effects of plants on microbial communities in CWs is
difficult to demonstrate due to inherent variations between studies or monitoring
practices (Baptista et al., 2008), the diversity–ecosystem function relationship
theory in ecology provides a theoretical framework to evaluate whether plants have
a strong influence on microbial communities in CW systems. Some previous studies
on terrestrial ecosystems have showed that plant functional group composition of a
given community tends to have a greater impact on soil microbial communities than
plant species richness (Spehn et al., 2000; Johnson et al., 2003; Milcu et al., 2006).
1.4.2. Plant role
Plants absorb nitrogen from the soil as both NH4+ and NO3
- ions, but because
nitrification is so pervasive in agricultural soils, most of the nitrogen is taken up as

23
nitrate. Nitrate moves freely toward plant roots as they absorb water. Once inside
the plant NO3- is reduced to an -NH2 form and is assimilated to produce more
complex compounds. Because plants require very large quantities of nitrogen, an
extensive root system is essential to allowing unrestricted uptake. Plants with roots
restricted by compaction may show signs of nitrogen deficiency even when
adequate nitrogen is present in the soil.
Most plants take nitrogen from the soil continuously throughout their lives and
nitrogen demand usually increases as plant size increases. A plant supplied with
adequate nitrogen grows rapidly and produces large amounts of succulent, green
foliage. Providing adequate nitrogen allows an annual crop, such as corn, to grow to
full maturity, rather than delaying it. A nitrogen-deficient plant is generally small
and develops slowly because it lacks the nitrogen necessary to manufacture
adequate structural and genetic materials. It is usually pale green or yellowish,
because it lacks adequate chlorophyll. Older leaves often become necrotic and die
as the plant moves nitrogen from less important older tissues to more important
younger ones.
On the other hand, some plants may grow so rapidly when supplied with
excessive nitrogen that they develop protoplasm faster than they can build sufficient
supporting material in cell walls (Don Eckert).
1.4.3. Removing of organic materials
Wetland systems have the capability to remove organic priority compounds in
wastewater primarily by mechanisms including volatilization, adsorption, microbial
degradation, and plant uptake. Bacterial degradation of organic priority pollutants
under both aerobic and anaerobic conditions has been shown to be feasible but
adsorption of the pollutants onto the biofilms must precede the acclimation and
biodegradation processes. Organic priority pollutants can also be removed by
physical adsorption onto settleable solids followed by sedimentation. This often
occurs in the initial portion of the bed. Removal by plant uptake has been reported

24
but the significance of the pathway is relatively unknown and may be dependent on
plant species and pollutant characteristics.
There is concern about the fate of many trace organic compounds in the
environment. These include pesticides, fertilizers, process chemicals, and others that
fall under the category of priority pollutants. The fate of these compounds in
wetlands is dependent on the properties of the compound, the characteristics of the
wetland, the species of plants, and other environmental factors. The most important
separation and transformation mechanisms involved include volatilization,
sedimentation/interception, biodegradation, adsorption, and uptake. These
mechanisms have been discussed previously. Recalcitrant organics that have been
separated may accumulate in the wetland sediments. Some may be taken up by
plants and be returned to the system upon plant decomposition. Biodegradation of
some organic compounds may result in completely mineralized end products, or the
process may produce end products that may be more toxic than the parent
compound. At this time, there is insufficient data available on full-scale wetland
systems to evaluate how effective they are in the long-term removal and destruction
of most priority pollutants. Based on pretreatment performance, oxidation or
facultative lagoons remove a high percentage of volatile and semi-volatile organic
compounds (Hannah et al., 1986), resulting in low influent concentrations to the
FWS system that follows, while primary sedimentation is less effective and results
in higher influent concentrations of both to subsequent VSB systems.
Table 1-1. Pollution Remove Mechanisms in constructed wetlands (Cooper et al…1997)
Wastewater constituents
Removal mechanism
Suspendied solides
- Sedimentation - Filtration
Soluble organics - Aerobic microbial degradation - Anaerobic microbial degradation
Phosphorous Matrix soption Plant uptake

25
Nitrogen Ammonification followed by microbial nitification Denification Plant uptake Matrix absorption Ammonia volatilization (mostly in SF system)
Metal Absorption and cation exange Complexation Precipitation Plant uptake Microbial Oxidation/ reduction
Pathogens Sedimentation- Filtration- Natural die-off- Predation- UV irrdiation (SF system) Excetion of antibiotic from roots of macrophytes
1.4.4. Nitrogen removal
In wetlands systems, nitrogen transformations take place in the oxidized and
reduced layers of soil, the root-soil interface and the submerged portions of the
emergent plants. Removal of nitrogen in wetlands is achieved through three main
mechanisms, which are nitrification/denitrification, volatilization of ammonia and
uptake by plants.
Organic Nitrogen is mineralized to NH4+ in both oxidized and reduced soil
layers. The oxidized layer and the submerged portions of plants are important sites
for nitrification in which NH4+ is converted to NO2
- by Nitrosomonas and
eventually to NO3- by Nitrobacter bacteria. At higher pH, some NH4
+ exists in the
form of NH3 and is lost to the atmosphere by the volatilization process. Figure 1-5
depicts the processes of nitrogen removal in the flooded soil environment. Nitrate in
the reduced zone is depleted through denitrification, leaching and some plant uptake
(Eng, 2002). Submerged plant provided more organic material of high quality to
support heterotrophic organisms. It is also possible that the surfaces of submerged
plant offered more suitable surfaces for bacterial growth and thereby increased the
bacterial population (Bastviken et al., 2005).

26
Figure 1-5. Nitrogen transformation in wetland system (Lim, 1998)
As far as the root-soil interface is concerned, oxygen from the atmosphere
diffuses into the rhizosphere through the leaves, stems, rhizomes and roots of the
wetlands plants and creates anoxic layer similar to that existed at the soil-water
interface (refer Figure 1-5) (Maehlum, 1999; Johnson et al., 1999). Nitrification
takes place in the aerobic rhizosphere where NH4+ is oxidized to NO3
-. The NO3-
not taken up by plants diffuses into the anoxic zone where it is reduced to N2 and
N2O by the denitrification process. Ammonium in the rhizosphere is replenished by
NH4+ in the anoxic zone by diffusion.
1.4.5. Phosphorus removal
The phosphorus removal mechanisms in wetland systems include vegetation
uptake (Fraser et al., 2004; Huett et al., 2005), microbial assimilation, adsorption
onto soil and organic matter, and precipitation with Ca2+, Mg2+, Fe3+ and Mn2+.
Adsorption and precipitation reactions are the major removal pathways when the
hydraulic retention time is longer and finer-textured soils are being used, since this
allows greater opportunity for phosphorus sorption and soil reactions to occur.
Adsorption and precipitation reactions merely trap the phosphorus in the wetland

27
soil. Once the storage capacity has been exceeded, the soil / sediment have to be
dredged for ultimate disposal. The mechanisms for phosphorus removal in
constructed wetlands are adsorption, complication and precipitation, storage, plant
uptake and biotic assimilation (Watson et al., 1989).
Figure 1-6. Phosphorus cycling in a FWS wetland (adapted from Twinch and Ashton, 1983)
1.4.5. Pathogen removal
Pathogens are removed in wetland during the passage of wastewater through the
system mainly by sedimentation, filtration and adsorption by biomass. Once these
organisms are entrapped within the system, their numbers decrease rapidly, mainly
by the processes of natural die-off and predation (Cooper et. al, 1996)
1.4.6. Acidity - Alkalinity
pH affects the chemical nature of water and the creatures in the constructed
wetlands reactions in the biological processes that occur in a limited range of pH,
such as treatment by microorganisms will occur. In the pH range of 4.0 to 9.5 and
the reaction is nitric filter applications. The creature is in the range pH 6.5 to 7.5. It
does best in a pH of 7.2 or more, and so on.

28
Chapter 2: Materials and method
2.1. Chemicals and equipment
�Chemical:
Grade of all chemicals using in experiments was pure analysis, including:
- Potassium dichromate (K2Cr2O7)
- Sulfuric acid (H2SO4 98%)
- Silver sulfate (Ag2SO4)
- Salt Mohr
- Mercury (II) sulfate (HgSO4 )
- Ferroin indicator
- KNaC4H4O4.4H2O, NaOH
- HgI2, KI, KOH
- Sulfanilic acid(C6H7NO3S)
- α-naphtylamine (C10H7NH2)
� Equipment:
- Cone Can, spheres, electric stove, burette, pipette...
- Spectrophotometer, pH meter,
- Pilot treatment system: pretreatment system, CW.
2.2. Equipment design
2.2.1. Aeration tank design
Aeration was designed in form of parallelepiped have volume of 190L (Figure
2-1). There are three inlets at bottom for air, wastewater feeding, and recycling
sludge.
The lab scale pilot as in the figure 2-1 had total capacity of 250L, wastewater
was stored in the tank 1 then pulped through a sieve, solid part stored in the tank 3,
liquid was stored in the tank 2, and here input concentration was control. Then
wastewater went into the reactor tank 4 with manual pre-setted flow rate then

29
wastewater went pass settling tank. A part or all of sludge in the settling tank was
recycling. The effluent of the system was analysis to ensure that it met the
requirement of the influent of CW.
Figure 2-1. Laboratory wastewater treatment systems
2.2.2. CW design
Design of the CW pilot was based on CW manual (UN-HABITAT, 2008 and
Suwasa Kantawanichkul,
2009). The CW was VF-
SSF CW type, cultivated
Cyperus Malaccensis Lam..
Dimension of the CW
was height x width x depth
= 1.5 m x 0.75 m x 1 m,
had volume of 1.125m3.
Material layers: bottom
layer (4) was 10 cm thickness, used gravel with 3 cm diameter, middle layer (3) was
10cm thickness, and used smaller gravel with 1cm diameter, top layer was 60 cm
thickness, used sand. The CW had capacity of 250L of water.
The CW had one inlet and 4 outlets. The outlets had different depth to take
wastewater sample: level 1 was 20cm depth, level 2 was 40cm depth, level 3 was
60cm depth, and level 4 was 80cm depth.
Figure 2-2. Constructed wetland design

30
2.3. Experiment design
2.3.1. Batch experiments
The real samples, wastewater, were taken from Quang Ninh Seafood Process
and Export Plant No. 2. To evaluate effect of anaerobic and aerobic treatment to the
samples two batch experiments were carried out in a 20L reactor without and with
strong air supply. Concentrations of ammonia, nitrite, nitrate, phosphate, and pH
value were monitored every day from May 13th 2011 to May 28th 2011.
Results of batch treatment were used to select using the continuous aeration tank
(4).
2.3.2. Flow rate optimization of the pretreatment system
The pre-treatment system had the volume of 250L, and operated continuously, it
needed a large volume of wastewater. Thus, artificial wastewater was made of squid
rubbish with supplement substances to create a similar environment of wastewater
from squid processing plant had provided for the systems. Continuous biological
treatment had conducted by pumping the wastewater into the system. The process
used settling tank to collect biomass for returning to the aeration tank and
discharging when exceeding the demand. Settling tank is not only for deposition but
also as an anaerobic tank, thus it also contributes to NO3- on de-nitrate reaction. The
system was operated at pre-setted retention time according to the table 2.

31
Table 2-1. Flow rate and corresponding retention time and continuous operation
conditions
Flow rate (L/h) 3 6 9 12 15
Retention time whole system (h) 83.3 41.7 27.8 20.8 16.7
Retention time of aeration tank (h) 63.3 31.7 21.1 15.8 12.7
Retention time of settling tank (h) 20.0 10.0 6.7 5.0 4.0
2.3.3. Plant selection
Several plants was considering in our research as elephant grass, reed, friendship
bamboo (Dracaena sanderiana Hort.) two plants had advantage character are
showed in figure 2-3.
(a) (b)
Figure 2-3. Two species of Limnophila (b) and Cyperus (a) genera
Biomass of two plants are useable, Cyperus genus can feed animal, Limnophila genus
(sedge) is used as material of weave craft. Plants were grown in 30 cm depth basins with
sand layer was 15cm depth and 1000cm2 area. At bottom of each bucket was water
collecting system, wastewater was controlled 5-10cm above the sand surface. The volume
of the bucket was 30L. Plants had a similar density in each basin. The growth of plants was
monitored in two periods: adative period and stable period.

32
The adaptive period: at beginning plants were grown in wastewater medium then
kept water level in basin by adding supply water. This period was about 30 days
length, finished when COD value went down 80% and there were buds of new
plants. The stable period: wastewater was delivered semi-continous. Wastewater
samples of top and botom of basins were tooken at the same time for determination
of ammonium, nitrite, nitrate, phosphate concentration, COD, pH value.
2.3.4. CWs operation
Wastewater run out the pre-treatment system was fed CW at the hydraulic
loading rate: 135mm/day (135 L.m-2.day-1). Samples were taken on surface and at
four levels (figure 2-2) from June 25th, 2011 to September 24th, 2011.
2.4. Procedures and analysis method
Effect of treatment process was evaluated from concentrations of anions NO2-,
NO3- and PO4
3- , and COD, pH value of samples before and after treatment.
Determination methods of pH, COD, NO2-, NO3
- and PO43- were based on
Vietnamese standards TCVN 6492: 1999, TCVN 6491 : 1999, TCVN 6178:1996,
TCVN 6180:1996, TCVN 6180:1996, respectively.
2.4.1. Determination of COD
Reagent preparation
Using K2Cr2O7 solution as strong oxidizing agents to oxidize organic
compounds in acidic medium of H2SO4 and using crystals Ag2SO4 to catalyze the
reaction according to the equation:
Organic matter + K2Cr2O7 + 2H+ → CO2 + H2O + 2Cr3+ 2K+
The remaining amount of K2Cr2O7 is titrated with Mohr salt solution
[Fe(NH4)2(SO4)2] using Ferroin indicator.
Cl- is regularly presented in the water causing the error of analysis.
Cr2O72- + 6 Cl- + 14H+ → 3Cl2 +2Cr3+ + 7H2O
So, Hg2SO4 solution is used to remove the effect of Cl-.

33
( )10008
. 211 ××−
m
morh
V
NVNV
Procedure
Pour Vm = 5 mL of sample into a reflux flask, add V1 = 5 mL of mixture
solution of 0.25 N HgSO4 and K2Cr2O7, adding 10 ml mixture solution of H2SO4
and Ag2SO4 contents of 11 grams/liter Ag2SO4 in concentrated H2SO4 solution,
adding 2 to 3 boiling stones. The mixture in the flash was well mixed. Apply heat to
the flask and reflux for 2 hours. Allow the flask to cool and wash down the
condenser with about 25 mL of distilled water. Add 1-2 drops of indicator Ferroin,
and mixing and titrate the excess K2Cr2O7 with 0.1 N Mohr salt to the end point.
Calculation
The COD value is determined by the formula:
COD =
In which: Vm: volume of sample (ml).
V1: K2Cr2O7 solution volume (ml)
Vmohr: Mohr salt (ml).
N1: Equivalent concentration of K2Cr2O7 (N)
N2: The equivalent salt concentration Morh (N).
8: gram-equivalent of oxygen
1000: Conversion factor from liters to ml.
2.4.2. Determination of ammonium by colorimetric method with Nessler
indicator
Reagent preparation
Principle of the method is in alkaline medium, NH4+ reacts with K2HgI4 to form
yellow-brown precipitate (NH2Hg2I3):
NH4+ + OH- → NH3 + H2O
2K2HgI4 + NH3 + KOH → NH2HgI3 + 5KI + H2O

34
Depending on the concentration of NH4+ in solution, the complex is from yellow
to red brown and stable for about 1 hour.
Factors hinder the determination of ammonia by this method are water hardness,
iron, sulphide, chlorine, turbidity of the water. Complexion III is used to overcome
the hard water. The iron ion, sulfite, and the turbidity are eliminated by adding the
zinc salt (add 1mL of 10% ZnSO4.7H2O to 100 mL water sample). Obstacle of
chlorine at levels of 0.01 mg/l is eliminated by adding sodium thiosulfate or sodium
arsenate.
Procedure
- Solution A: Dissolve 0.2965 g of dried NH4Cl (dry at 105oC for 2 hours) with
distilled water in a 1L flask. Obtained solution has concentration of NH4+ 100 mg/L.
- Solution B: From Solution A we dilute into 10 times to obtain the solution of
NH4+ concentration of 10 mg/L.
Seignette and Nessler solution
- Seignette solution: Dissolve 50 g of potassium sodium tartrate in 10% NaOH
solution.
- Nessler solution:
+ Mix 4.55 grams of HgI2 with 3.49 grams of KI then dissolve with about 30 ml
of distilled water. We obtained solution 1.
+ Mix 11.2 g of KOH with about 30 ml of distilled water (mix separately). We
obtain solution 2. Let the solution1 and solution 2 until they are cool; pour both
these two solutions into 100 ml volumetric flask. Store the solution into a dark vial.
The new solution can be used after 3 to 5 days.
Dilute sample by distilled water so that its concentration is in the linear range.
Take 5 ml sample into clean and dry test tube, add 0.2 ml of Seignette and 0.3 ml of
Nessler, shake well then let stand for 10 minutes and measured absorbance at a

35
wavelength of 420 nm. Calculate the concentration of ammonium in the sample
according to equation of standard curve.
Standard curve
Table 2-2. Data of standard curve NH4+
Solution B
(mL)
Distilled water (mL)
Seignette (mL)
Nessler (mL)
[NH4+ ]
(M) ABS
1 0.0 5.0 0.2 0.3 0 0.00
2 0.2 4.8 0.2 0.3 0.04 0.036 3 0.4 4.6 0.2 0.3 0.08 0.097 4 0.6 4.4 0.2 0.3 0.12 0.157 5 0.8 4.2 0.2 0.3 0.16 0.20
6 1.0 4.0 0.2 0.3 0.20 0.253
7 1.2 3.8 0.2 0.3 0.24 0.306
8 1.4 3.6 0.2 0.3 0.28 0.352 9 1.6 3.4 0.2 0.3 0.32 0.406
10 1.8 3.2 0.2 0.3 0.36 0.455
11 2.0 3.0 0.2 0.3 0.40 0.5
Figure 2-4. Standard curve of NH4+

36
2.4.3. Determination of NO2- concentration in water by colorimetric
method with Griss reagent
Reagent preparation
The general principle is that in acetic acid medium, NO2- ion reacts with acid
sulfanilic and α-naphtylamine e form a red compound
C6H4(NH2)SO2 – OH + HNO2 → C6H4(N=NOH)SO2 – OH
C6H4(N=NOH)SO2– OH +C10H7NH2→C6H4(N=N–C10H6NH2)SO2–OH
Color intensity is proportional to the content of NO2 in water. Absorbance was
measured at 520 mm wavelength.
Procedure
- Sulfanilic acid solution: Dissolve 0.5 g of sulfanilic acid in 150 ml of 12%
CH3COOH. Keep the obtained solution in dark vial.
- α – naphtylamine e solution: Weigh 0.1 g α - naphtylamine e for a glass
containing about 240 ml of distilled water; boil on electric stove until the volume to
about 200 ml. Then move 200 ml solution above into a dark vial containing 150 ml
of CH3COOH acid 12%.
- To get 150 ml of 12 % CH3COOH solution: mix 18.4 ml of CH3 COOH
(99.5%) with 131.6 ml of distilled water.
Standard curve
- Solution A: Dissolve 0.1497 g of pure NaNO2 (dry at 105oC for 2 hours) into
1L flask; diluted to 1 liter, we obtained a 0.1 mg/ml solution of NO2-.
- Solution B: Dilute 100 times solution A with distilled water, obtain a 0.001
mg/ml solution of NO2-, using within the day.
- Analysis of samples: Take 5 ml sample into a clean and dry test tube, measure
the absorbance (ABS) at the wavelength of 520 nm.

37
- Set up the standard curve: Take into clean, dry test tubes the volumes of
solution standard B, distilled water and the reagents are as follows:
Table 2-3. Data of NO2- standard curve
Solution B (ml)
Distilled water (ml)
Sulfanilic (ml)
α-naphtylamine (ml)
[NO2- ]
(M) ABS
1 0.0 5.0 1 1 0.00 0.00 2 0.2 4.8 1 1 0.04 0.028 3 0.4 4.6 1 1 0.08 0.053 4 0.5 4.5 1 1 0.10 0.066 5 0.8 4.2 1 1 0.16 0.099 6 1.0 4.0 1 1 0.20 0.126 7 1.5 3.5 1 1 0.30 0.183 8 2.0 3.0 1 1 0.40 0.25 9 2.5 2.5 1 1 0.50 0.311 10 3.5 1.5 1 1 0.70 0.431 11 5.0 0.0 1 1 1.00 0.601
Figure 2-5. Standard curve of NO2+
2.4.4. Determination of NO3- concentration
NO3- ion reacts with phenoldisulfonic form acidic nitro phenoldisulfonic, this acid
give yellow color in the presence of NH3. Color intensity is proportional to the content
of NO3- in solution. Formed compounds absorb light at a wavelength of 410 nm.

38
Reagent
Take 50 ml liquefied phenol into 500 ml flask, and then adds 100 ml of H2SO4
98%. Shake well then heat the mixture in 1 hour 30 minutes until the liquid turns
brown.
Procedure
- Solution A: Dissolve 0.1631 g KNO3 (dry at 105oC in 2 hours) in 1L flask.
Obtained solution is NO3- concentration of 0.1 mg/ml.
- Solution B: From the standard solution A, we dilute 10 times then obtain the
0.01 mg NO3- solution.
Dilute the sample with distilled water so that sample concentration is in the
linear range. Take 5 ml samples into the heat-resistant glass, dry on the electric
stove covered with asbestos until the samples dry completely, and let for the glass
cool then pour 70 to 10 ml of distilled water, add 0.5 ml phenoldisulfonic, add 5 ml
solid NH3, shake and transfer the entire solution in the glass into 25 ml volumetric
flask. Let stand for 10 minutes then measure the absorbance at a wavelength 410
nm.
Standard curve
Take the 10 mg/L NO3-solutions and distilled water into a glass and then dry on
the electric stove covered with asbestos, adding more reagents and the solution of
NH3 as in the following table:
Table 2-4. Results of standard NO3-
Solution B
(ml) Distilled water(ml)
Phenol disulfonic
(ml)
Ammonium (ml)
[NO3-] (M)
ABS
1 0.0 5.0 0.5 5.0 0.0 0.00 2 0.2 4.8 0.5 5.0 0.04 0.029 3 0.5 4.5 0.5 5.0 0.1 0.041 4 1.0 4.0 0.5 5.0 0.2 0.057 5 1.5 3.5 0.5 5.0 0.3 0.069

39
6 2.0 3.0 0.5 5.0 0.4 0.082 7 3.0 2.0 0.5 5.0 0.6 0.112 8 4.0 1.0 0.5 5.0 0.8 0.137 9 5.0 0.0 0.5 5.0 1.0 0.169
Figure 2-6. Standard curve of NO3-
2.4.5. Determination of phosphorus by mean of optical measurement
with reagents Ammonium molybdate-vanadate
In the acidic medium, ammonium molybdate reacts with octophosphate solution
form acid acid molypdophosphoric. In the presence of vanadate, yellow
vanadomolybdophosphoric acid is formed. Color intensity shows the concentration
of phosphate presents in solution with minimum detectable concentration was 10-4
g/L. The hindered factors caused by the presence of silicon dioxide (SiO2) and
arsenate when samples are heated.
The impact of negative factors is due to the presence of the ion: AsO3-, F-, Br2+,
SO32-, S2O8
2-, or excess amount of molybdate. The blue color of the solution may be
formed due to the presence of iron but does not affect the analysis. The ions do not
affect the analysis when the concentration exceeds 100 (mg/L) include: Al3+, Fe2+,
Mg2+, Ca2+, Ba2+, Sr2+, Na+, K+, the sodium nitrate, nitrite, sulfate, tetra borate...

40
Reagent preparation
- Solution A: Weight exactly 25 g (NH4)2MoO4 to the beaker. Then use distilled
water to dilute into 300 ml.
- Solution B: Weigh exactly 1.25 g ammonium vanadate NH4VO3 to the beaker.
Add 300 ml of distilled water, boiled on the electric stove covered with asbestos
until it melt, cooling, and then put more 330 ml of concentrated hydrochloric acid,
shake, let it is cool to the room temperature and then pour this solution and solution
A into an 1L flask, let it is cool to room temperature then dilute to 1000mL.
- Prepare standard solution PO43-: Dissolve 0.1211 g NaH2PO4.H2O (dried at
105oC in 2 hours) in 1L flask. Dilute to 1000mL we obtain 0.1 mg/ml PO43-
solution.
Standard curve
Add 17.5 ml of sample in 25 ml volumetric flask. Add 5 ml of vanadate
molybdate reagent and dilute to the mark. Shake well and let it’s stand for 10
minutes and measure the absorbance at the wavelength of 470 nm.
Pour the 0.1 mg/ml solution of PO43- and reagents into the 25 ml flask as
follows:
Table 2-5. Results of standard PO43-
Standard
Solution(ml) Vanadate molybdate
(ml) Water (ml) [PO4
3-] (M) ABS
1 0.0 5.0 20 0.00 0.00 2 0.7 5.0 19.3 0.04 0.022 3 1.4 5.0 18.6 0.08 0.042 4 2.1 5.0 17.9 0.12 0.062 5 2.8 5.0 17.2 0.16 0.081 6 3.5 5.0 16.5 0.20 0.100 7 4.2 5.0 15.8 0.24 0.119 8 5.6 5.0 14.4 0.32 0.162 9 7.0 5.0 13.0 0.40 0.194 10 8.4 5.0 11.6 0.48 0.230 11 10.5 5.0 09.5 0.60 0.285

41
Figure 2-7. Standard curve of PO43-

42
Chapter 3. Results and discussions
3.1. Batch treatment
3.1.1. Anaerobic process
Anaerobic treatment process was carried in two periods: the 1st run from May
13. 2011 to May 17. 2011 and the 2nd run from May 19. 2011 to May 28. 2011. The
result was showed in the table 3-1.
Table 3-1. Anaerobic treatment from May 13th, 2011 to May 17th, 2011 and May 19th, 2011 to May 28th 2011.
Time (days)
COD (mg/L)
NH4+
(mg/L) NO2
- (mg/L)
NO3-
(mg/L) PO4
3- (mg/L)
pH Note
1st run
0 1209 57.97 0.37 2.34 30.51 7 Initial
4 2727 60.08 0.32 0.07 15.86 7-8
2nd run
0 2546 62.70 0.08 0.35 18.00 7 Initial
9 1973 279.95 0.34 0.14 25.87 7-8
From table 3-1, the original wastewater samples had low content of nitrite and
nitrate. Ammonium concentration was much higher than industrial wastewater
standard (TCVN 5945:2005 type B). The initial COD value of the second run was
two times higher than that of the second run, but phosphate content was much
lower. Squid processing wastewater normally contains small amount of FOG, but
COD value is similar to other fish processing water in the range of 400-2000 mg/L
(Carawan, 1979).
Nitrite and nitrate content was small change by anaerobic treatment, however
phosphate content significantly reduce in the first run. After 5 days of treatment
CDO value and ammonia content were increased by activity of anaerobic bacteria
cause hydrolysis and mineralization organic. After 9 days of anaerobic treatment the
COD value reduced insignificant. However, the ammonia concentration was much

43
higher than the initial concentration. Ammonia came from the digestion of nitrogen
content compounds as amino acid, and can reach 300mg/L (Carawan, 1979).
3.1.2. Aerobic process
Because anaerobic process requires long retention time, causes bad smell, so
we was continue to investigate aerobic process. Aerobic treatment process (using
aeration tank) was carried out from May 30. 2011 to June 25. 2011, with 5 runs
Changing in COD value
Figure 3-1 shows the trend of reducing COD according to the time. The
COD value decreased quickly, some experiments achieved the COD limit of the
influent for CW (400mg/L) in the first day. All are achieved requirement after three
days. Active sludge increased and was stable at ratio 210ml/L.
Figure 3-1. COD value changing in aeration tanks

44
(a) (b)
(c) (d)
Figure 3-2: Changing trend of ammonia (a), nitrite (b), nitrat (c), and phosphorous equivalent (d) content.
Ammonia content was clearly lower initial concentration (figure 3-2a), other
course the first 2 days the NO2- and NO3
- concentration went up that means
nitrosomonas, and nitrobacter were exist and kept a key role in the conversion. The
results of investigation showed that the aerobic treatment was more feasible than the
anaerobic treatment. The aerobic treatment shortened retention time and reduced
COD value to the requirement value.

45
3.2. Continuous treatment – retention time optimization
The pretreatment system was operated at retention times of 3, 6, 9, 12, 15 hours.
In an activated sludge continuous reactor, COD value reduced more than 80% in
12.7 hours (figure 3-3), longer retention time didn’t help to lower COD content. The
COD value lies in the range of 70-80% (Figure 3-2), and no significant differences,
which indicates that approximate 20% is more difficult to disintegrate. They could
be needed very long retention time in CW. Activated sludge concentration standing
for 30 minutes was in the range of 100-150ml/L, during the operation, equipment
does not meet quality requirements because of small size tank. From these two
reasons, the retention time in the reactor and the system could be shorten in full size
system.
Figure 3-3. Effect of retention time on the COD value of effluent.

46
(a) (b)
(c) (d)
Figure 3-4. Effect of retention time on ammonium (a), nitrate (b), nitrite (c), phosphate (d) removal.
Ammonia concentration significantly reduced when the retention time was
increased (Figure 3-4a), when the retention time was longer 15 hours, ammonium
concentration dropped below the limit of TCVN 5945-2005 on industrial waste
water- type B (10 mg/L). At the retention time in the reactor of 63.3h, ammonium
concentration decreased to 99.8%, and there was no significant change after waste
water went out of the settling tank (5). The trend of changing of nitrite and nitrate
concentration showed in figure 3-4bc, the wide desperation of markers means that
the concentration increased but wasn’t linear to retention time. Nitrite concentration
increased when the retention time was less than 20 hours and decreased with longer

47
retention time, whereas nitrate concentration increased when the retention time
increased (Figure 3-4b) and had high value when retention time set at 20 hours to 40
hours. Phosphate content in the artificial samples was lower than 8 mg/L, so, the
equivalent concentration of phosphorus was below the TCVN 5945-2005 standard
(5mg/L). Figure 3-4d showed that after the different retention times, phosphate
concentrations fell below 5 mg/L (equivalent to 1.6 mg P/L).
While at these concentrations of ammonia, nitrate, nitrite, phosphorous don’t
affect to the proper working of CWs, COD value need to be considered. When the
retention time was 12.7 hours the COD value of effluence was acceptable for CW.
3.3. Plant selection
Two plants were grown in the same conditions. Figure 3-5 showed that in a
cycle of 6 days the COD value reduced about 80% after 4 days. At beginning days
(1, 2, 3), organic compounds were only mineralized apart, that limits using of
plants, micro-organism and leading to COD value lowered insignificantly.
Figure 3-5. Percentage of COD reduction in Limnophila basin and Cyperus basin.
After 4 days, when organics were hydrolized and inorganized, micro-organism
and plants easily used for development. The COD value lowered significant,
reached to 85%. The ability in COD treatment of two genera were similar.
However, percentages of ammonia, nitrite và nitrate removal of sedge were higher
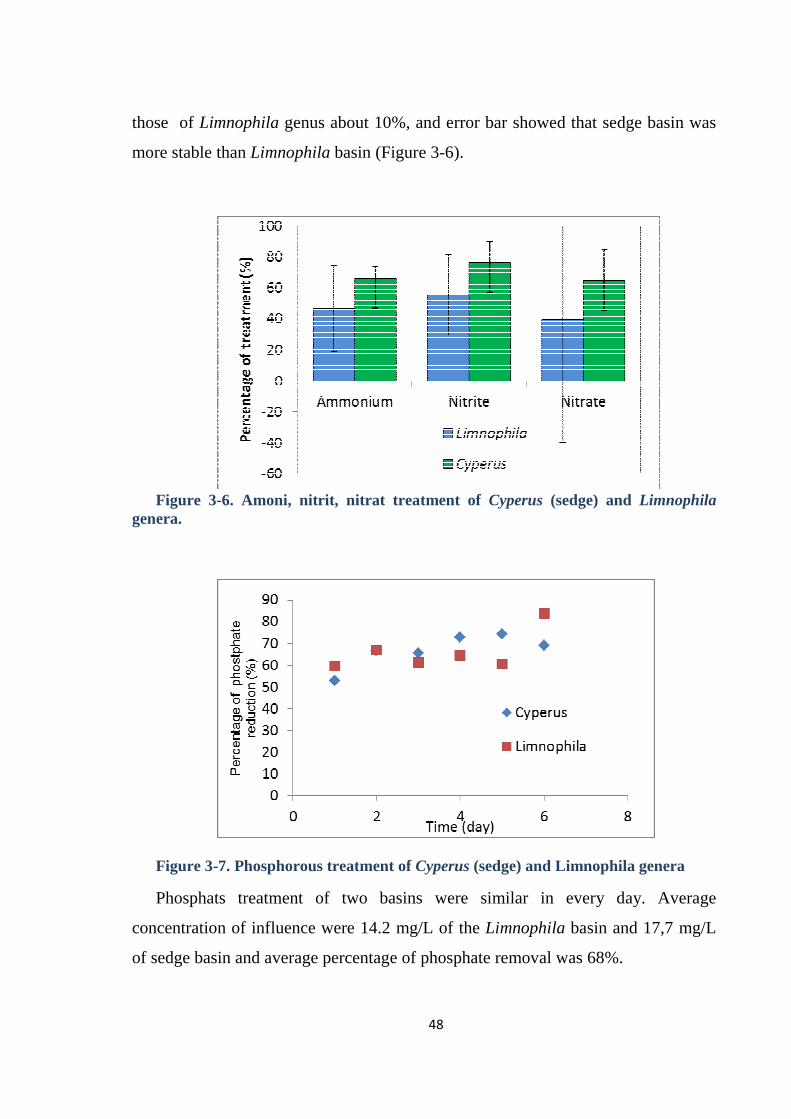
48
those of Limnophila genus about 10%, and error bar showed that sedge basin was
more stable than Limnophila basin (Figure 3-6).
Figure 3-6. Amoni, nitrit, nitrat treatment of Cyperus (sedge) and Limnophila
genera.
Figure 3-7. Phosphorous treatment of Cyperus (sedge) and Limnophila genera
Phosphats treatment of two basins were similar in every day. Average
concentration of influence were 14.2 mg/L of the Limnophila basin and 17,7 mg/L
of sedge basin and average percentage of phosphate removal was 68%.

49
Sedge had the advantage of Limnophila in ammonium, nitrite, nitrate treatment
and was suitable for growing in CW of local area.
3.4. Constructed wetland
Sedge was chosen to grow in the CW pilot. Wastewater from the pretreatment
system was fed to the CW with the hydrolytic retention time 135L.m-2.day-1. The
initial COD value was under 400mg/L, this was the harder digestion part of
organics. Reduction of 70% COD was obtained, and the concentration decreased
gradually from level 1 to lever 4. That was the same way as ammonium
concentration (figure 3-8abcd). It means that plants and bacterial were good
cooperation in the CW (figure 3-8abcd).
COD removal effect of the SVF-CW in the experiments was close to the report
of Vymazal, 2005; Kadlec et al., 2000. In this study, for the HLR of 3 cm.day-1, the
maximum removal efficiency in terms of COD was 67% for an average inflow of
1966mgO2 L-1 (590 kgha-1 d-1). Concerning the HLR of 6cmd-1, the maximum
removal efficiency in terms of COD was 73% for an average inflow of
2093mgO2 L-1 (1256 kgha-1 d-1). In another study, carried out with effluent of the
manufacture of finished shoe upper leather from multisource wet blue with a typical
COD inflow of 1160mg L-1, reductions of 85%, 82% and 70% COD were obtained,
for CWs planted with two subspecies of Glyceria maxima and Phragmites,
respectively, in a five day root–zone system. Both species proved to be extremely
robust and survived shock dosing, long periods of drying out, total immersion and
cold (Daniels, 1998).

50
(a) (b)
(c) (d)
(e) (f)

51
(g) (h)
(i)
Figure 3-8: Percentages of COD (a), ammonium (c), nitrite (e), nitrate (g), phosphate equivalent reduction; Column graphs b, d, f, h, i show average contents of these parameters according to 4 levels; the straight line scatter showed removal effect according to 4 levels.
NO2- is the product of aerobic treatment process when oxygen is provided
insufficiently for the demand. This easily happens because aerobic processing
requires much energy for aeration. NO2- is not useful even harmful for the
development of plants but NO2- in the experiment declined dramatically, reaching
90% at effluent of CW (Figure 3-8f, level 4). This maybe have two reasons: the first
was the oxygen carried by roots oxidized nitrite to nitrate then NO3- was absorbed
by the plants, the second was anammox bacteria which had ability to transform 50%
NH4+ and 50% NO2
- into nitrogen releasing from the filtering area with other gases
was the product of nutritious metabolism process in general.

52
The more permanent removal of N in constructed wetlands is dependent on the
N cycle. As part of the cycle, the various forms of N are converted into gaseous
components that are expelled into the atmosphere as nitrogen gas (N2) or nitrous
oxide (N2O). Key processes in the N cycle include ammonification, nitrification,
and denitrification. Nitrification denitrification reactions are the dominant removal
mechanisms in constructed wetlands (Benham and Mote 1999). Nitrification is the
biological formation of nitrite-N (NO2--N) or NO3
--N (Alexander 1977) from NH4+.
Nitrification occurs in aerobic regions of the water column, soil-water interface, and
root zone (Reddy and D’Angelo 1997). Dissolved oxygen levels < 1-2 mg/L in
water substantially reduces nitrification (Hammer and Knight 1994; Lee et al.
1999). Denitrification is the biological process of reducing NO3--N or NO2
--N, into
N2, N2O, or nitric oxide (NO) (Kadlec and Knight 1996). Denitrification is
significant mechanism inequality degradation, reducing NH3 concentrations drives
the design process for many wetland treatment systems (Kadlec and Knight 1996).
Thus, unsuitable conditions for nitrification can seriously limit the treatment
potential of these systems. The use of supplemental aeration may enhance
nitrification activity, due to the addition of dissolved oxygen into the wastewater
which would induce a more aerobic environment for this reaction. Cottingham et al.
(1999) found that aerating laboratory scale subsurface flow constructed wetlands
promoted increased rates of nitrification. Surface flows, or free water surface
constructed wetlands, however, are used for treating livestock wastewater in Nova
Scotia due to their ability to handle relatively high solids content. Subsurface flow
wetlands are generally not recommended for agricultural wastewater treatment with
substantial solids content (NRCS 1991).
Percentage of treatment varies in a wide range from 30% to close 100%. Nitrate
concentration seems to be instable that because of much changing the initial nitrate
content and affected by many factors. In constructed wetlands, after NO3- is formed
under aerobic conditions; it diffuses down into the anaerobic portion of the soil,
where it is denitrified (Patrick and Reddy 1976; Nichols 1983). Since ammonium

53
was being nitrified to NO3- within the system, NO3
- increased at level 2 as a result.
The accumulation of NO3- at level 2 indicates that after NH3 was nitrified,
subsequent denitrification was limited (figure 3-8gh).
At level 4, nitrate and nitrite contents were low, possible factors that could
promote denitrification include enough residence time for denitrification to remove
NO3--N, lack of DO, available carbon (C) within the system. Denitrification activity
is reduced if available C supplies are low (Gersberg et al. 1983; Hammer and
Knight 1994; Wood et al. 1999) and proceeds only when the oxygen supply is
inadequate for microbial demand (Hammer and Knight 1994). However, limited
denitrification activity has been observed in the presence of DO (Phipps and
Crumpton 1994).
Phosphor at the top layer was absorbed strongly by the roots and microorganism,
thus they declined significantly, reaching over 45%. At subsequent layer, due to not
ingrained roots, only microorganism use them, PO43- declines much less, just
reaching over 20%. Beside that PO43- could be participated with other cations.
Conclusion
Seafood processing wastewater treatment using the anaerobic method required
long retention time, which didn’t meet the requirement of reducing COD down to
200-300mg/L even after 9 days.
The results of aerobic treatment in the continuous aeration tank using activated
sludge indicated the possibility of applying for pre-treatment of wastewater
containing high COD. When the retention time was 12.7 hours the COD value of
effluence was acceptable for CW.
Sedge had the advantage of Limnophila in ammonium, nitrite, nitrate treatment
and was suitable for growing in CW of local area.
Sedge should be grown in CWs because of the reduction of ammonium, nitrite,
nitrate, total phosphorous was stable. The system had high effect in removing

54
ammonium, nitrite, nitrate, phosphorous, 80.3±15.8%, 93.2±7.2%, 72.8±25.0%,
73.1±26.6%, respectively which meet Vietnamese Guide QCVN 11:2008. COD
value was reduced from 300-400mg/L to 91.6±9.9 mg/L.

55
Referents
Ahn, C., Gillevet, P.M., Sikaroodi, M., 2007. Molecular characterization of
microbial communities in treatment microcosm wetlands as influenced by
macrophytes and phosphorus loading. Ecol. Indicat. 7, 852–863.
Baptista, J.D.C., Davenport, R.J., Donnelly, T., Curtis, T.P., 2008. The microbial
diversity of laboratory-scale wetlands appears to be randomly assembled. Water
Res. 42, 3182–3190.
Bernard, J.M., Lauve, T.E., 1995. A comparison of growth and nutrient uptake
in Phalaris arundinaceae L. growing in a wetland and a constructed bed receiving
landfill leachate. Wetlands 15, 176–182.
Calheiros, C.S.C., Duque, A.F., Moura, A., Henriques, I.S., Correia, A., Rangel,
A.O.S.S., Castro, P.M.L., 2009. Changes in the bacterial community structure in
two-stage constructed wetlands with different plants for industrial wastewater
treatment. Bioresour. Technol. 100, 3228–3235.
Caravaca, F., Alguacil, M.M., Torres, P., Roldan, A., 2005. Plant type mediates
rhizospheric microbial activities and soil aggregation in a semiarid Mediterranean
salt marsh. Geoderma 124, 375–382.
Chong-Bang Zhang, Wen-Li Liu, Jiang Wang, Tong Chen, Qing-Qing Yuan,
Cheng-Cai Huang,Ying Ge, Scott X. Chang, Jie Chang,2011. Plant functional group
richness-affected microbial community structure and function in a full-scale
constructed wetland.
Collins, B., McArthur, J.V., Sharitz, R.R., 2004. Plant effects on microbial
assemblages and remediation of acidic coal pile runoff in mesocosm treatment
wetlands. Ecol. Eng. 23, 107–115.
Cooper, P.E. and Boon, A.G. (1987). The use of Phragmites for wastewater
treatment by the root zone method. Aquatic plants for wastewater treatment and
resource recovery. Orlando, Florida: Magnolia.

56
Cronk, J.K. and Fennessy, M.S. (2001). “Wetland Plants : Biology and
Ecology”. Lewis Publishers, United States of America.
DeJournett, T.D., Arnold, W.A., LaPara, T.M., 2007. The characterization and
quantification of methanotrophic bacterial populations in constructed wetland
sediments using PCR targeting 16S rRNA gene fragments. Appl. Soil Ecol. 35,
648–659.
Don Eckert. Efficient Fertilizer Use –Nitrogen.
Faulwetter, J.L., Gagnon, V., Sundberg, C., Chazarenc, F., Burr, M.D., Brisson,
J., Camper, A.K., Stein, O.R., 2009. Microbial processes influencing performance
of treatment wetlands: a review. Ecol. Eng. 35, 987–1004.
Green, M.B., Martin, J.R., 1996. Constructed reed beds clean up storm
overflows on small wastewater treatment works. Water Environ. Res. 68, 1054–
1060.
Hammer, D.A., 1992. Designing constructed wetlands systems to treat
agricultural nonpoint source pollution. Ecol. Eng. 1, 49–82.
Hammer, D.A., Pullin, B.P., McCaskey, T.A., Eason, J., Payne, V.E.W., 1993.
Treating livestock wastewaters with constructed wetlands. In: Moshiri, G.A. (Ed.),
Constructed Wetlands for Water Quality Management. Lewis Publishers, Ann
Arbor, MI.
Hill, V.R., Sobesy, M.D., 1998. Microbial indicator reductions in alternative
treatment systems for swine wastewater. Water Sci.Technol. 38 (12), 119–122.
Hilton, B. L. 1993. Performance evaluation of a closed ecological life support
system (CELSS) employing constructed wetlands. pp 117-125 in Constructed
Wetlands for Water Quality Improvement, G. A. Moshiri (ed.). CRC Press, Boca
Raton, FL.

57
Hofmann, K., 1996. The role of plants in subsurface flow constructed wetlands.
In: Etnier, C., Gusterstam, B. (Eds.), Ecological Engineering for Wastewater
Treatment. Lewis Publishers, Boca Raton, FL, pp. 83–196.
Humenik, F.J., Szogy, A.A., Hunt, P.G., Broome, S., Rice, M., 1999.
Wastewater utilization: a place for manage wetlands – review. Asian–Australian J.
Anim. Sci. 12 (14), 629–632.
Johnson, D., Booth, R.E., Whiteley, A.S., Bailey, M.J., Read, D.J., Grime, J.P.,
Leake, J.R., 2003. Plant community composition affects the biomass, activity and
diversity of microorganisms in limestone grassland soil. Eur. J. Soil Sci. 54, 671–
677.
Kadlec, R.H., Knight, R.L., 1996. Treatment Wetland. CRC Press, FL, USA.
Kantawanichkul, S., Kladpraserta, S., Brix, H., 2009. Treatment of high-strength
wastewater in tropical vertical flow constructed wetlands planted with Typha
angustifolia and Cyperus involucratus. Ecol. Eng. 35, 238–247.
Karathanasis, A.D., Thompson, Y.L., 1995. Mineralogy of iron precipitates in
constructed acid mine drainage wetland. Soil Sci. Soc. Am. J. 59, 1773–1779.
Krasnits, E., Friedler, E., Sabbah, I., Beliavski, M., Tarre, S., Green, M., 2009.
Spatial distribution of major microbial groups in a well established constructed
wetland treating municipal wastewater. Ecol. Eng. 35, 1085–1089.
Lim, W.H., Tay, T.H. and Kho, B.L. (2002). “Plants Used in the Putrajaya
Wetland System and Problems Associated with Their Establishment and
Maintenance”. In : Editors : Mansor, M., Eng, L.P. and Shutes, R.B.E. “Constructed
Wetlands : Design, Management and Education”. Universiti Sains Malaysia
Publisher, Malaysia.
Marsh, B. Spink, D (2007). Technical Specifications: Seair 40-foot Wastewater
Treatment Plant. Revision 4

58
Mavrogianopoulos, G., Volgi, V., Kyritsis, S., 2002. Use of wastewater as a
nutrient solution in a closed gravel hydroponic culture of giant reed (Arundo
donax). Bioresour. Technol. 82, 103–107.
Milcu, A., Partsch, S., Langel, R., Scheu, S., 2006. The response of decomposers
(earthworms, springtails and microorganisms) to variations in species and
functional group diversity of plants. Oikos 112, 513–524.
Neralla, S., Wever, R.W., Lesikar, B.J., Persyn, R., 2000. Improvement of
domestic wastewater quality by cubsurface flow constructed wetlands. Bioresour.
Technol. 75, 19–25.
Osem, Y., Chen, Y., Levinsonc, D., Hadar, Y., 2007. The effects of plant roots
on microbial community structure in aerated wastewater-treatment reactors. Ecol.
Eng. 29, 133–142.
Prapa Sohsalam, Andrew Joseph Englande, Suntud Sirianuntapiboon 2007.
Seafood wastewater treatment in constructed wetland.
Reed, S.C., Middlebrooks, E.J., Crite, R.W., 1988. Natural Systems for Waste
Management and Treatment. McGraw-Hill,New York.
Sirianuntapiboon, S., Nimnu, N., 1999. Management of water consumption and
wastewater of seafood processing industries in Thailand. Suranaree J. Sci. Technol.
6 (3), 158–167.
Spehn, E.M., Joshi, J., Schmid, B., Alphei, J., Korner, C., 2000. Plant diversity
effects on soil heterotrophic activity in experimental grassland ecosystems. Plant
Soil 224, 217–230.
Suwasa Kantawanichkula, Supreeya Kladprasert, Hans Brix, Treatment of high-
strength wastewater in tropical vertical flow constructed wetlands planted with
Typha angustifolia and Cyperus involucratus, ecological engineering 35 (2009)
238–247.

59
Szogy, A.A., Hunt, P.G., Humenik, F.J., 2000. Treatment of swine wastewater
using saturated-soil-culture soybean and flooded rice system. Trans. ASAE 43 (2),
327–335.
T.S. Jamieson, G.W. Stratton, R. Gordon and A. Madani The use of aeration to
enhance ammonia nitrogen removal in constructed wetlands.
Tietz, A., Kirschner, A., Langergraber, G., Slrytr, K., Haber, R., 2007.
Characterisation of microbial biocoenosis in vertical subsurface flow constructed
wetlands. Sci. Total Environ. 380, 163–172.
Tietz, A., Langergraber, G., Watzinger, A., Haberl, R., Kirschner, A.K.T., 2008.
Bacterial carbon utilization in vertical constructed wetlands. Water Res. 42, 1622–
1634.
UN-HABITAT, 2008. Constructed Wetlands Manual. UN-HABITAT Water for
Asian, Cities Programme Nepal, Kathmandu.
Vietnam economic time 2007
Vrhovsek, D., Kukanja, V., Bulc, T., 1996. Constructed wetland (CW) for
industrial wastewater. Water Res. 30, 2287–2292.
Vymazal, J., Brix, H., Cooper, P.F., Green, M.B., Haberl, R., 1998. Constructed
Wetland for Wastewater Treatment in Europe. Backhuys Publishers, Leiden, The
Netherlands, pp. 17–66.
Wang, L., Gan, H., Wang, F., Sun, X.M., Zhu, Q.L., 2010. Characteristic
analysis of plants for the removal of nutrients from a constructed wetland using
reclaimed water. Clean - Soil Air Water 38, 35–43.

![Actros 2546 LSActros 2546 LS - PromathActros 2546 LSActros 2546 LS [*] Item opcional. | Os dados apresentados em pesos consideram a versão de série do veículo e podem mudar de acordo](https://img.dokumen.tips/doc/110x75/6075d5f1ed77754f1f1f978b/actros-2546-lsactros-2546-ls-promath-actros-2546-lsactros-2546-ls-item-opcional.jpg)

![Actros 2546 LSActros 2546 LS - promath.com.br€¦ · Actros 2546 LSActros 2546 LS [*] Item opcional. | Os dados apresentados em pesos consideram a versão de série do veículo e](https://img.dokumen.tips/doc/110x75/5b94a70909d3f2bd1e8dc0be/actros-2546-lsactros-2546-ls-actros-2546-lsactros-2546-ls-item-opcional.jpg)