Embed Size (px)
Citation preview

Exhibit Book
Finance Committee Meeting 6/24/2020
Table of Contents: BudgetWatch - Page 2
Annual Pension Fund Report - Page 23
Master Page # 1 of 35 - Finance Committee Meeting 6/24/2020________________________________________________________________________________
BudgetWatch June 2020 Flash Report
This BudgetWatch reflects operating results through May and subsidies received in June. The extraordinary circumstances adversely affecting MTA’s finances due to the COVID-19 pandemic are momentous and will continue into the foreseeable future. Receipts from the Coronavirus Aid, Relief, and Economic Security (CARES) Act, which covers operating losses, are included in Agency financials with Other Operating Revenue. Overall Latest Condition (reporting on operations for May and subsidies through June): Preliminary results for both the month and year-to-date were significantly worse than budget. Steps taken to prevent the spread and transmission of COVID-19, including Governor Cuomo’s PAUSE Executive Order and other actions, resulted in utilization of MTA services and toll facilities at historically low levels. Passenger and toll revenues were $571 million (78%) unfavorable for the month, increasing the unfavorable YTD variance to $1,396 million through the end of May. Operating expenses were favorable for the month and year-to-date, and generally reflect the impact of management decisions to operate on an essential service schedule, which also yielded savings from lower consumption of electric power and fuel, and adjustments to maintenance plans and lower material usage given the pandemic. Lower paratransit costs, energy rates, procured services, and reduced non-essential spending in general also contributed favorably to results. Overtime spending through May was lower largely due to fewer-than-expected weather-related emergencies and, as noted, changes made to maintenance and service plans. Debt service was favorable and timing-related. Subsidies for June were unfavorable by $368 million, increasing the shortfall in collections to $709 million YTD. The Mansion and Internet Sales Taxes, which fund the Capital Lockbox but are available through 2021 to offset operating revenue shortfalls due to the pandemic, were $34 million unfavorable for the month and $116 million unfavorable year-to-date. Passenger and Toll Revenues
ActualAdoptedBudget Diff % Diff Actual
AdoptedBudget Diff % Diff
NYCT: Subway $846.9 $1,493.8 ($646.9) -43.3% $45.5 $307.1 ($261.6) -85.2% Bus 206.6 398.4 (191.8) -48.1% 0.9 80.3 (79.4) -98.9% Other 38.4 42.8 (4.4) -10.3% 6.6 8.6 (2.0) -23.4%NYCT $1,091.9 $1,935.0 ($843.1) -43.6% $53.0 $396.0 ($343.0) -86.6%MTA Bus 49.6 93.7 (44.1) -47.1% 0.6 19.2 (18.6) -96.9%LIRR 168.8 306.7 (137.9) -45.0% 4.2 66.1 (61.9) -93.6%MNR 163.6 303.6 (140.1) -46.1% 3.4 66.0 (62.6) -94.9%Sub-total $1,473.8 $2,639.0 ($1,165.2) -44.2% $61.2 $547.3 ($486.1) -88.8%
B&T 604.9 835.7 (230.9) -27.6% 100.1 185.4 (85.3) -46.0%
Total $2,078.7 $3,474.8 ($1,396.1) -40.2% $161.3 $732.7 ($571.4) -78.0%
YTD May 2020 ($ in millions) Month of May 2020 ($ in millions)
Passenger and toll revenue were significantly below budget across the Agencies for the month and year-to-date, reflecting the ongoing impact of Governor Cuomo's NY PAUSE Executive Order, effective March 24th, and other actions, which severely limit non-essential activities throughout the State to prevent the spread and transmission of COVID-19. CARES Act Receipts The MTA received $2.096 billion in funding from the Coronavirus Aid, Relief, and Economic Security (CARES) Act in May, which covers operating losses incurred through the end of April. The MTA expects to receive, in total, $4.0 billion from the CARES Act in 2020, which is expected to cover operating losses through June and into early July.
Master Page # 2 of 35 - Finance Committee Meeting 6/24/2020________________________________________________________________________________

Total Operating Expenses before Non-Cash Liability Adjustments
ActualAdoptedBudget Diff % Diff Actual
AdoptedBudget Diff % Diff
NYCT $3,610.3 $3,612.7 $2.3 0.1% $702.4 $737.1 $34.7 4.7%MTA Bus 330.6 344.2 13.6 4.0% 67.9 68.0 0.1 0.1%LIRR 590.0 721.9 131.9 18.3% 95.8 142.3 46.5 32.7%MNR 526.2 556.4 30.2 5.4% 97.7 107.2 9.5 8.9%B&T 175.2 206.9 31.7 15.3% 32.7 41.3 8.6 20.8%MTA HQ 288.4 382.7 94.4 24.7% 75.9 70.0 (5.9) -8.4%Total $5,520.7 $5,824.8 $304.1 5.2% $1,072.4 $1,165.9 $93.5 8.0%
YTD May 2020 ($ in millions) Month of May 2020 ($ in millions)
Preliminary expenses for May were favorable by $93.5 million, or 8.0%, and primarily reflect savings from reduced service under the Essential Service Plan, as well as revisions to planned maintenance work and related materials, and other timing-related changes, across the agencies. Additional contributing factors include vacancy savings, and lower electric power and fuel (which have been trending favorably) due to lower rates and reduced usage. The significant favorable variance at the LIRR mainly reflects fleet modifications and reduced Reliability Centered Maintenance activity, and right-of-way material needs. Also contributing were higher vacancy and overtime savings, lower consumption of electricity from the reduced service schedule, and a higher credit in reimbursable overhead from the favorable timing of capital project activity. At NYCT, the variance primarily reflects savings from reduced trips for Paratransit Service, as well as lower material usage due to less maintenance activity and timing, lower overtime costs due to a reversal of Capital Track costs previously charged to the operating budget, and lower prices and usage of electricity and fuel due to service changes. At MNR, timing differences include lower rolling stock material usage and revised maintenance work and infrastructure repairs, as well as lower overtime, electricity and fuel usage required for operating service, and the transfer of 2019 ferry expenses to reimbursable in recognition of a Federal Transit Administration grant. This was partially offset by a catch-up adjustment for a higher than budgeted Actuarially Defined Contribution (ADC) for pension expense, and slight overspending in a variety of other categories. B&T was favorable mainly because of revised major maintenance and painting projects, lower toll collection processing fees and overtime costs, and vacancy savings. Higher spending at MTA HQ was mainly due to a combination of timing delays in inter-agency billings and lower chargeable work to agencies. MTA Bus spending was on budget. YTD expenses were favorable by $304.1 million, or 5.2%. The LIRR, B&T and MNR were favorable primarily due to the same reasons noted for the month. Also contributing to overall YTD results were savings culminating from the strict adherence to non-essential spending guidelines across agencies. At MTA HQ, additional impacts from timing include revised assumptions for a myriad of procured services, including MTA Transformation, centralized EAM activities, engineering, and IT-related expenses, as well as the Verrazzano-Narrows Bridge Toll Program, and the Cross Bay Bridge subsidy. MTA Bus results include favorable timing of interagency billings, the rescheduling of security, bus technology and radio equipment projects, and adjusted maintenance needs. At NYCT, the small variance reflects the net impact of reduced trips for Paratransit services, savings from operating on a reduced service level, lower usage of and favorable rates for electricity and fuel, overtime, MetroCard transaction fees, and timing, partially offset by a pension budget misallocation (to be corrected in the July Plan), higher costs due to timing of prescription drug rebates, a decrease in the overhead credit due to a major reduction in capital project support requirements - directly as a result of the pandemic - and the timing of non-revenue service vehicle purchases. Overtime
ActualAdopted Budget Diff % Diff Actual
Adopted Budget Diff % Diff
NYCT $192.7 $214.2 $21.5 10.0% $33.1 $42.2 $9.1 21.6%MTA Bus 28.7 27.5 (1.2) -4.5% 5.9 5.2 (0.7) -14.4%LIRR 44.2 58.6 14.3 24.5% 4.1 11.1 7.1 63.5%MNR 34.2 40.6 6.4 15.8% 5.4 7.8 2.3 29.8%B&T 7.9 11.1 3.2 29.1% 0.4 2.1 1.6 79.5%MTA HQ 10.8 6.3 (4.5) -72.7% 2.0 1.3 (0.8) -58.4%Total $318.4 $358.1 $39.7 11.1% $51.0 $69.6 $18.6 26.8%
YTD May 2020 ($ in millions) Month of May 2020 ($ in millions)
Master Page # 3 of 35 - Finance Committee Meeting 6/24/2020________________________________________________________________________________

Overtime costs for the month were favorable by $18.6 million, or 26.8%, and reflect savings mainly from scaled-down programmatic/routine maintenance work and services (scheduled/unscheduled) at NYCT and the Commuter Railroads. Additionally, costs were lower due to the partial reversal of capital project work that was temporarily charged to the NYCT operating budget, as well as lower vacancy/absentee coverage requirements at the LIRR and MNR. MTA-wide COVID-related overtime costs totaled $16.5 million for the month and was completely offset by savings generated from the factors noted above. YTD Overtime expenses were $39.7 million, or 11.1%, favorable, and largely reflect residual savings from fewer-than-budgeted weather-related events, and the impact of the Essential Service Plan on scheduled service overtime, partially offset by costs from pandemic-related cleaning and other actions. Also contributing to the favorable outcome at NYCT was the impact of revised maintenance work and correcting Capital Track charges that were previously expensed to the operating budget. Both the LIRR and MNR were both favorable primarily due to the same reasons noted for the month, as well as lower weather-related requirements. Higher MTA PD coverage for enhanced security and vacancy/absentee coverage resulted in higher costs at MTA HQ. COVID-related overtime costs reached $33.9 million through May and were offset by savings as noted. Debt Service Debt Service for May was $176.1 million, which was $17.9 million (9.2%) favorable, primarily due to timing differences caused by the reversal of a prior month’s prefunding of interest, and was partially offset by the timing (non-receipt) of scheduled May 2020 BAB subsidies. Year-to-Date Debt Service was $1,160.6 million, which was $10.8 million (0.9%) favorable, primarily due to lower than budgeted variable rates and debt service related to the timing and structures of financing activities. This was partially offset by the timing (non-receipt) of the scheduled May 2020 BAB subsidies. State Dedicated Taxes and Fees
ActualAdopted Budget Diff % Diff Actual
Adopted Budget Diff % Diff
MMTOA $0.0 $417.1 ($417.1) -100.0% $0.0 $211.0 (211.0) -100.0%PBT 268.4 313.0 (44.6) -14.2% 18.5 50.6 (32.1) -63.4%PMT 1 772.7 831.0 (58.3) -7.0% 112.0 123.1 (11.1) -9.1%MTA Aid 2 125.2 159.1 (33.9) -21.3% 53.2 79.5 (26.3) -33.1%FHV 3 160.7 225.8 (65.1) -28.8% 2.9 37.6 (34.7) -92.3%Total $1,327.0 $1,945.9 ($619.0) -31.8% $186.6 $501.9 ($315.4) -62.8%
YTD June 2020 ($ in millions) Month of June 2020 ($ in millions)
123 Remittances of subsidies that are appropriated in the State Budget have not been received, pending review and approval by the State. As a result, MMTOA payments for May and June, totaling $417.1 million, were not transferred to the MTA. Other MTA subsidies from the State were unfavorable for June and year-to-date, reflecting the economic slowdown due to the COVID-19 pandemic. Petroleum Business Tax (PBT) receipts for June were $32.1 million (63.4%) unfavorable, and year-to-date collections were unfavorable by $44.6 million (14.2%). Payroll Mobility Tax (PMT) receipts for June were $11.1 million (9.1%) unfavorable, and year-to-date collections were unfavorable by $58.3 million (7.0%). MTA Aid receipts, which are transferred quarterly, were $26.3 million (33.1%) unfavorable for the second quarter and $33.9 (21.3%) unfavorable year-to-date. For-Hire-Vehicle Surcharge (FHV) receipts for June were unfavorable by $34.7 million (92.3%) and year-to-date collections were unfavorable by $65.1 million (28.8%).
1 PMT replacement funds, that are expected to total $244.3 million for the year, are excluded from the results reported in this table.
2 MTA Aid includes the License Fee, Vehicle Registration Fee, Taxi Fee and Automobile Rental Fee.
3 For-Hire Vehicle Surcharge.
Master Page # 4 of 35 - Finance Committee Meeting 6/24/2020________________________________________________________________________________

Real Estate Transaction Taxes
ActualAdopted Budget Diff % Diff Actual
Adopted Budget Diff % Diff
MRT $225.8 $228.5 ($2.7) -1.2% $27.0 $38.1 ($11.1) -29.2%NYC Urban Tax 231.7 319.2 (87.6) -27.4% 11.3 53.2 (41.9) -78.8%Total $457.4 $547.7 ($90.3) -16.5% $38.3 $91.3 ($53.0) -58.1%
YTD June 2020 ($ in millions) Month of June 2020 ($ in millions)
Total real estate transaction taxes for June, which reflect transaction activity during the month of May, were $53.0 million (58.1%) unfavorable to Budget, with the YTD variance unfavorable variance by $90.3 million (16.5%). When compared with last year through June, real estate taxes were $120.8 million (20.9%) lower; the Urban Tax was off last year’s level by $133.9 million, or 36.6%, while MRT is running ahead of last year by $13.1 million, or 6.2%. Regional Mortgage Recording Tax4 receipts for June were $11.1 million, or 29.2%, unfavorable; MRT-1 was unfavorable by $9.7 million, and MRT-2 receipts were unfavorable by $1.4 million. YTD MRT receipts were unfavorable by $2.7 million (1.2%), with MRT-1 receipts $5.0 million unfavorable and MRT-2 receipts $2.3 million favorable. New York City Urban Tax5 receipts for June were $41.9 million, or 78.8%, unfavorable, and YTD Urban Tax receipts were $90.3 million (16.5%) unfavorable. For June, the Real Property Transfer Tax (RPTT) portion of the Urban Tax was unfavorable by $30.9 million, or 88.5%, while the MRT portion of the Urban Tax was $11.1 million or 60.4% unfavorable. YTD, RPTT receipts were $72.2 million (34.5%) unfavorable, while the MRT portion of the Urban Tax was $15.3 million (13.9%) unfavorable. Capital Lockbox Funding Sources
ActualAdopted Budget Diff % Diff Actual
Adopted Budget Diff % Diff
Mansion Tax 6 $108.0 $186.7 ($78.8) -42.2% $9.7 $31.1 ($21.4) -68.8%Internet Sales Tax 7 85.0 122.5 (37.5) -30.6% 14.2 26.7 (12.5) -46.9%Total $193.0 $309.3 ($116.3) -37.6% $23.9 $57.8 ($33.9) -58.7%
YTD June 2020 ($ in millions) Month of June 2020 ($ in millions)
67 The 2020-2021 New York State Enacted Budget amended Public Authorities Law 553-j, to allow the MTA to use monies in the Central Business District Tolling Lockbox Fund for two years (2020 and 2021) to offset decreases in revenue or increases in operating costs due “in whole or in part” to the State emergency disaster caused by COVID-19. The MTA will repay the lockbox if it receives sufficient funds from the federal government or from insurance due to COVID-19, but only after first re-paying any COVID-19 related public or private borrowings, draws on lines of credit, issuances of revenue anticipation notes, internal loans or OPEB Trust.
4 Mortgage Recording Taxes consist of two separate taxes on mortgages recorded in the twelve-county region: MRT-1 is a tax on all mortgages, while MRT-2 is also imposed on residential real estate structures containing up to six dwelling units.
5 New York City Urban Taxes are imposed on commercial property and apartment building transactions within New York City. The MRT component is imposed on mortgages exceeding $500,000, and the Real Property Transfer Tax component is imposed on transfers exceeding $500,000.
6 The Real Property Transfer Tax Surcharge (the “Mansion Tax”) is an increase in the transfer tax on the sale of residential properties valued at $25 million or more in New York City.
7 Internet Marketplace Sales Tax receipts are captured through the elimination of the tax loophole that previously exempted third-party internet marketplace providers from collecting and remitting New York sales taxes on transactions conducted on their sites.
Master Page # 5 of 35 - Finance Committee Meeting 6/24/2020________________________________________________________________________________
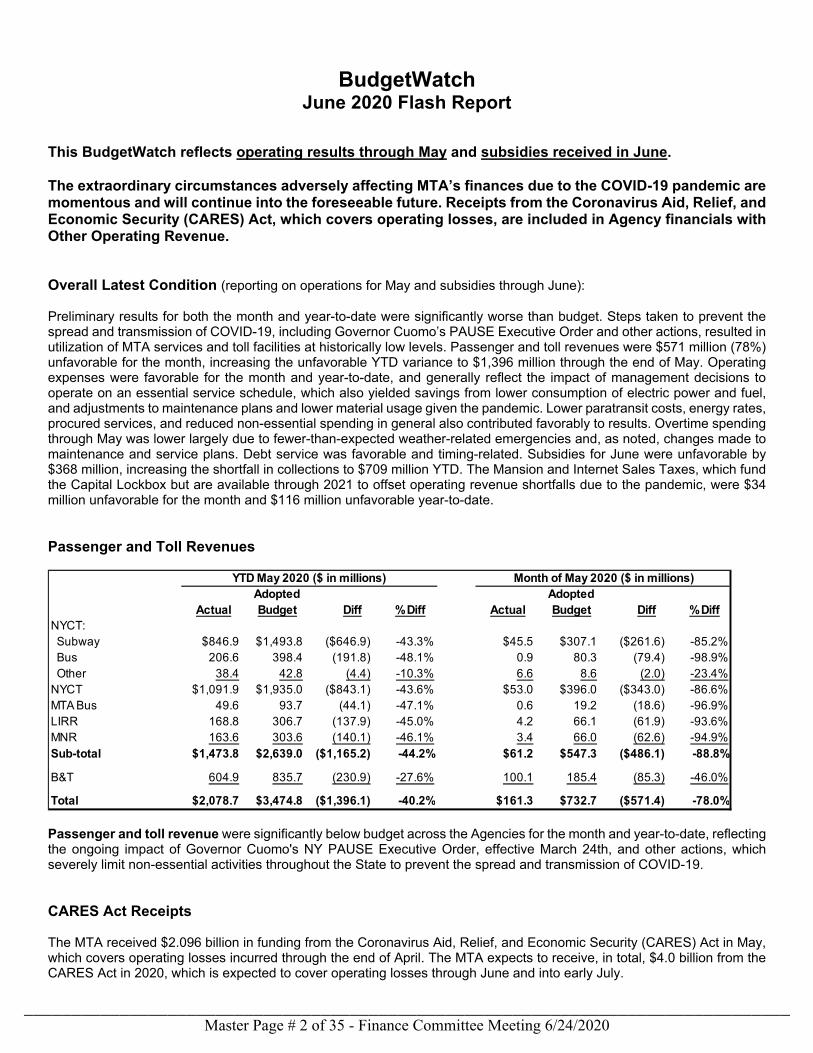
Real Estate Transaction Taxes Receipts ($ in millions)Adopted Budget vs. Actual Receipts
2020 Adopted Budget 2020 Jan-20 Feb-20 Mar-20 Apr-20 May-20 Jun-20 Jul-20 Aug-20 Sep-20 Oct-20 Nov-20 Dec-20 YTD JunMRT-1 $322.3 $26.9 $26.9 $26.9 $26.9 $26.9 $26.9 $26.9 $26.9 $26.9 $26.9 $26.9 $26.9 $161.2MRT-2 134.6 11.2 11.2 11.2 11.2 11.2 11.2 11.2 11.2 11.2 11.2 11.2 11.2 67.3Total MRT $457.0 $38.1 $38.1 $38.1 $38.1 $38.1 $38.1 $38.1 $38.1 $38.1 $38.1 $38.1 $38.1 $228.5
RPTT $418.7 $34.9 $34.9 $34.9 $34.9 $34.9 $34.9 $34.9 $34.9 $34.9 $34.9 $34.9 $34.9 $209.3MRT 219.8 18.3 18.3 18.3 18.3 18.3 18.3 18.3 18.3 18.3 18.3 18.3 18.3 109.9Total Urban Tax - NYCT 90% share $638.5 $53.2 $53.2 $53.2 $53.2 $53.2 $53.2 $53.2 $53.2 $53.2 $53.2 $53.2 $53.2 $319.2
Total Real Estate Taxes $1,095.4 $91.3 $91.3 $91.3 $91.3 $91.3 $91.3 $91.3 $91.3 $91.3 $91.3 $91.3 $91.3 $547.7
2020 Monthly Actuals Jan-20 Feb-20 Mar-20 Apr-20 May-20 Jun-20 Jul-20 Aug-20 Sep-20 Oct-20 Nov-20 Dec-20 YTD JunMRT-1 $36.5 $33.7 $26.5 $25.8 $16.6 $17.2 $156.2MRT-2 12.7 13.3 12.1 12.2 9.5 9.8 69.6Total MRT $49.2 $47.0 $38.6 $37.9 $26.1 $27.0 $225.8
RPTT $36.3 $32.1 $22.2 $35.8 $6.6 $4.0 $137.1MRT 24.2 26.2 14.6 15.3 7.0 7.3 94.6Total Urban Tax - NYCT 90% share $60.5 $58.3 $36.9 $51.1 $13.6 $11.3 $231.7
Total Real Estate Taxes $109.7 $105.2 $75.5 $89.0 $39.7 $38.3 $457.4
Variances Jan-20 Feb-20 Mar-20 Apr-20 May-20 Jun-20 Jul-20 Aug-20 Sep-20 Oct-20 Nov-20 Dec-20 YTD JunMRT-1 $9.6 $6.8 ($0.3) ($1.1) ($10.3) ($9.7) ($5.0)MRT-2 1.5 2.1 0.8 0.9 (1.7) (1.4) 2.3Total MRT $11.1 $8.9 $0.5 ($0.2) ($12.0) ($11.1) ($2.7)
RPTT $1.4 ($2.8) ($12.7) $0.9 ($28.3) ($30.9) ($72.2)MRT 5.9 7.9 (3.7) (3.0) (11.3) (11.1) (15.3)Total Urban Tax - NYCT 90% share $7.3 $5.0 ($16.3) ($2.1) ($39.6) ($41.9) ($87.6)
Total Real Estate Taxes $18.5 $13.9 ($15.8) ($2.2) ($51.6) ($53.0) ($90.3)
MRT-1 35.9% 25.3% -1.3% -4.1% -38.3% -36.1% -3.1%MRT-2 13.5% 18.7% 7.5% 8.4% -15.2% -12.5% 3.4%Total MRT 29.3% 23.4% 1.3% -0.4% -31.5% -29.2% -1.2%
RPTT 4.1% -8.1% -36.3% 2.6% -81.0% -88.5% -34.5%MRT 32.0% 42.9% -20.0% -16.3% -61.9% -60.4% -13.9%Total Urban Tax - NYCT 90% share 13.7% 9.5% -30.7% -3.9% -74.4% -78.8% -27.4%
Total Real Estate Taxes 20.2% 15.3% -17.3% -2.5% -56.5% -58.1% -16.5%
Master Page # 6 of 35 - Finance Committee Meeting 6/24/2020________________________________________________________________________________

Real Estate Transaction Taxes Receipts ($ in millions)2020 Receipts vs. 2019 Receipts
2019 Monthly Actuals 2019 Act Jan-19 Feb-19 Mar-19 Apr-19 May-19 Jun-19 Jul-19 Aug-19 Sep-19 Oct-19 Nov-19 Dec-19 YTD JunMRT-1 $328.3 $32.8 $31.5 $19.2 $20.7 $26.8 $22.8 $34.7 $28.8 $28.0 $29.3 $30.1 $23.8 $153.7MRT-2 133.4 10.6 10.6 8.5 9.0 10.1 10.1 11.0 13.3 14.0 12.1 13.0 11.1 58.9Total MRT $461.7 $43.4 $42.1 $27.7 $29.7 $36.8 $32.9 $45.7 $42.1 $41.9 $41.4 $43.1 $34.9 $212.7
RPTT $425.9 $54.7 $71.4 $28.0 $20.4 $24.3 $40.5 $44.2 $29.6 $17.5 $29.7 $30.9 $34.8 $239.3MRT 242.5 32.9 30.7 12.3 14.0 21.1 15.3 24.7 17.1 16.8 21.0 20.9 15.7 126.3Total Urban Tax - NYCT 90% share $668.5 $87.6 $102.1 $40.3 $34.3 $45.4 $55.8 $68.9 $46.7 $34.3 $50.7 $51.9 $50.5 $365.6
Total Real Estate Taxes $1,130.2 $131.0 $144.2 $68.0 $64.1 $82.3 $88.7 $114.5 $88.8 $76.2 $92.1 $95.0 $85.3 $578.2
2020 Monthly Actuals Jan-20 Feb-20 Mar-20 Apr-20 May-20 Jun-20 Jul-20 Aug-20 Sep-20 Oct-20 Nov-20 Dec-20 YTD JunMRT-1 $36.5 $33.7 $26.5 $25.8 $16.6 $17.2 $156.2MRT-2 12.7 13.3 12.1 12.2 9.5 9.8 69.6Total MRT $49.2 $47.0 $38.6 $37.9 $26.1 $27.0 $225.8
RPTT $36.3 $32.1 $22.2 $35.8 $6.6 $4.0 $137.1MRT 24.2 26.2 14.6 15.3 7.0 7.3 94.6Total Urban Tax - NYCT 90% share $60.5 $58.3 $36.9 $51.1 $13.6 $11.3 $231.7
Total Real Estate Taxes $109.7 $105.2 $75.5 $89.0 $39.7 $38.3 $457.4
Variances Jan Feb Mar Apr May Jun Jul Aug Sep Oct Nov Dec YTD JunMRT-1 $3.7 $2.1 $7.3 $5.1 ($10.2) ($5.6) $2.4MRT-2 2.1 2.7 3.5 3.1 (0.5) (0.3) 10.7Total MRT $5.9 $4.9 $10.9 $8.2 ($10.8) ($6.0) $13.1
RPTT ($18.3) ($39.3) ($5.7) $15.4 ($17.7) ($36.5) ($102.2)MRT (8.8) (4.6) 2.3 1.4 (14.1) (8.0) (31.7)Total Urban Tax - NYCT 90% share ($27.1) ($43.9) ($3.4) $16.8 ($31.8) ($44.5) ($133.9)
Total Real Estate Taxes ($21.2) ($39.0) $7.5 $25.0 ($42.6) ($50.5) ($120.8)
MRT-1 11.3% 6.8% 38.2% 24.5% -38.2% -24.7% 1.6%MRT-2 20.2% 25.8% 41.4% 34.7% -5.4% -3.3% 18.1%Total MRT 13.5% 11.6% 39.2% 27.6% -29.2% -18.1% 6.2%
RPTT -33.5% -55.1% -20.5% 75.6% -72.7% -90.1% -42.7%MRT -26.6% -14.8% 18.8% 9.9% -66.9% -52.4% -25.1%Total Urban Tax - NYCT 90% share -30.9% -43.0% -8.5% 48.9% -70.0% -79.8% -36.6%
Total Real Estate Taxes -16.2% -27.0% 11.0% 39.0% -51.7% -56.9% -20.9%
Master Page # 7 of 35 - Finance Committee Meeting 6/24/2020________________________________________________________________________________

1
All agencies – Non-Reimbursable Overtime Variance
Source: Adopted (restated) budget. GL actuals for actual overtime spending.
May 2020 and YTD budget vs. variance
$M
YTD variance by division
$M
B&T lower expenses due to rescheduled and deferred
maintenance in response to COVID-19.
LIRR lower expenses due to mild winter weather and
lower maintenance requirements as a result of the implementation of the Essential Service Plan caused by
COVID-19.
MNR lower expenses in MoW due to fewer-than-
expected weather-related events and re-prioritization of personnel to COVID-19-related cleaning.
NYCT fewer weather-related events and the
implementation of the Essential Service Plan in response to COVID-19.
• For the month, costs were less than budget by $19M, or 27% due to the
implementation of the Essential Service Plan in response to COVID-19 at NYCT, the LIRR, and MNR and the reversal of Capital Track costs at NYCT.
• The favorable YTD variance mainly reflects fewer weather-related events, and the impact of the pandemic on MTA service and maintenance assumptions at
NYCT, the LIRR, MNR, and B&T, partially offset by higher Enhanced Security and Quality of Life costs at MTAHQ, as well as COVID-related cleaning,
including sanitizing, and maintenance work on fleet at MTA Bus.
Overview
$67 $70
$346 $359
May ’20
$84
-$40
(-11%)
$18
(26%)
May ’19
-$19
(-27%)
$72
(21%)
YTD
May ’19
YTD
May ’20
$51
$418
$319
-39%
-24%
Budget
Favorable
Unfavorable
$4.5
$1.2
-$3.2
-$14.3
-$6.4
-$21.5
MNR
B&T
YTD
May ’20
LIRR
MTA Bus
MTA HQ
NYCT
Annual budget: $852M
MTA HQ higher expenses mostly due to coverage for
Enhanced Security, Quality of Life, and COVID-19.
MTA Bus higher expenses due to COVID-19-related
cleaning and maintenance work on aging fleet.
Master Page # 8 of 35 - Finance Committee Meeting 6/24/2020________________________________________________________________________________

2
All agencies – Reimbursable Overtime Variance
Source: Adopted (restated) budget. GL actuals for actual overtime spending.
May 2020 and YTD budget vs. variance
$M
YTD variance by division
$M
LIRR higher expenses for the Concrete Tie Program,
3rd Track Expansion, Jamaica Capacity Improvements, the Annual Track Program, and Flagging requirements.
MTAHQ higher expenses due to higher coverage
requirements and the use of the Transit Security Grant Program at the MTA PD.
NYCT lower mainly due to reduced capital program
support as a result of COVID-19.
• For the month, costs exceeded the budget by $3M or 19%, due mainly to
higher Concrete Tie Program costs at the LIRR.• YTD overtime costs were $3M or 3% below budget.
• The main driver of the YTD favorable variance was due to revised capital project activity and support caused by the pandemic at NYCT. This was
partially offset by higher requirements for concrete ties, 3rd Track Expansion, Jamaica Capacity Improvements and the Annual Track Program at the LIRR,
and higher coverage requirements for the MTA PD at MTAHQ.
Overview
$16 $17
$77$88
May
’20
$6
(41%)
$22
May
’19
YTD
May ’19
$49
(63%)
-$3
(-3%)YTD
May ’20
$21
$126
$85
$3
(19%)
-8%
-32%
Favorable
Unfavorable
Budget
$1.4
$7.6
-$11.6
YTD
May ’20
MTA HQ
LIRR
NYCT
Annual budget: $215M
Master Page # 9 of 35 - Finance Committee Meeting 6/24/2020________________________________________________________________________________

3
All agencies – Total Overtime Variance
Source: Adopted (restated) budget. GL actuals for actual overtime spending.
May 2020 and YTD budget vs. variance
$M
YTD variance by division
$M
• For the month and YTD overtime was below budget by $15M, or 18% and $43M or
10%, respectively. • The major drivers of the favorable non-reimbursable YTD variance were fewer
weather-related events and the impact of the pandemic on MTA service and maintenance assumptions across the NYCT, the LIRR, MNR, and B&T, partially offset
by higher Enhanced Security and Quality of Life costs at MTAHQ, as well as COVID-related cleaning, including sanitizing, and maintenance work on fleet at MTA Bus.
• The main driver of the favorable reimbursable YTD variance was due to revised capital project activity and capital support as a result of the pandemic. This was
partially offset by higher expenses for concrete ties, 3rd Track Expansion, Jamaica Capacity Improvements and the Annual Track Program at the LIRR, and higher
coverage requirements for MTA PD at MTAHQ.YTD variance by division
$M
Overview
$83 $87
$423 $447
$404
May
’19
YTD
May ’19
May
’20
$24
(29%)
-$15
(-18%)
$121
(29%)
-$43
(-10%)
YTD
May ’20
$107$72
$544
-33%
-26%
Budget
Favorable
Unfavorable
$6.0$1.2
-$3.5
-$6.7
-$6.8
-$33.1
YTD May ’20
LIRR
MTA HQ
B&T
MNR
MTA Bus
NYCT
Annual budget: $1,067M
Master Page # 10 of 35 - Finance Committee Meeting 6/24/2020________________________________________________________________________________

BUDGETWATCH Regional Economy Report New York City Employment Sectors with Year-over-Year Employment Gains None Sectors with Year-over-Year Employment Losses ∙ Construction, Mining, Natural Resources ∙ Education & Health Services ∙ Financial Activities ∙ Government ∙ Information ∙ Leisure & Hospitality ∙ Manufacturing ∙ Other Service ∙ Professional & Business Service ∙Trade ∙ Transportation, Utilities New York City Employment (in thousands) Apr-20 versus
Prelim RevisedApr-20 Mar-20 Apr-19 Net Pct Net Pct
Total Employment 3,756.9 4,597.6 4,648.7 (840.7) -18.3% (891.8) -19.2%Goods Producing 123.7 221.6 228.9 (97.9) -44.2% (105.2) -46.0%
Construction, Mining, Nat Res 78.1 154.0 161.3 (75.9) -49.3% (83.2) -51.6%Manufacturing 45.6 67.6 67.6 (22.0) -32.5% (22.0) -32.5%
Service Providing 3,633.2 4,376.0 4,419.8 (742.8) -17.0% (786.6) -17.8%Transportation, Utilities 108.0 145.8 145.7 (37.8) -25.9% (37.7) -25.9%Trade 359.1 467.5 481.8 (108.4) -23.2% (122.7) -25.5%Information 204.8 210.7 210.2 (5.9) -2.8% (5.4) -2.6%Financial Activities 454.7 462.0 477.5 (7.3) -1.6% (22.8) -4.8%Professional & Business Svcs 688.6 801.3 789.2 (112.7) -14.1% (100.6) -12.7%Education & Health Svcs 968.0 1,082.5 1,068.3 (114.5) -10.6% (100.3) -9.4%Leisure & Hospitality 131.3 415.4 466.8 (284.1) -68.4% (335.5) -71.9%Other Services 140.0 194.9 194.8 (54.9) -28.2% (54.8) -28.1%Government 578.7 595.9 585.5 (17.2) -2.9% (6.8) -1.2%
Mar-20 Apr-19
Preliminary April 2020 employment in New York City shows the initial impact of the COVID-19 pandemic on employment levels, with a loss of 891,800 jobs (19.2%) when compared to last April’s employment level. April marks the second consecutive month in which employment has declined over its level from one year earlier, after 119 consecutive months of increases ended with declines in March 2020. Decreases were significant across all sectors, but hardest hit were Leisure & Hospitality, down 335,500 jobs (71.9%), and Trade, down 122,700 jobs (25.5%). Employment in New York City’s service-providing sectors decreased by 786,600 jobs (17.8%) over the April 2019 level; in February, year-over-year growth totaled 78,200 jobs (1.8%). Private-sector service-providing employment in New York City decreased by 779,800 jobs (20.3%), the second consecutive month of year-to-year decline after 120 consecutive months of increases ended last month.
Master Page # 11 of 35 - Finance Committee Meeting 6/24/2020________________________________________________________________________________

BUDGETWATCH Regional Economy Report
-5.0%
-2.5%
0.0%
2.5%
5.0%
New York City Employment12-month Percent Change
Total
Service Providing
Private Sector Service Providing
3,700
3,800
3,900
4,000
4,100
4,200
4,300
4,400
4,500
4,600
4,700
4,800
New York City Employment(in thousands)
2017
2018
2019
2020
Master Page # 12 of 35 - Finance Committee Meeting 6/24/2020________________________________________________________________________________

BUDGETWATCH Regional Economy Report In April 2020, seasonally adjusted New York City employment of 3.76 million was lower than in April 2019 by 893,500 jobs (19.22%); April seasonally adjusted employment was 861,800 jobs fewer than last month, an 18.66% decline.
3,6503,7503,8503,9504,0504,1504,2504,3504,4504,5504,6504,7504,850
Seasonally Adjusted New York City Employment(in thousands)
Ridership and Employment In December 2008, the twelve-month moving average for employment began to decline after increasing in 56 of the previous 59 months. For sixteen consecutive months – though March 2010 – the twelve-month moving average fell, and employment levels declined by 3%. Beginning with April 2010, the twelve-month employment average increased with no interruption for 119 consecutive months through February 2020. Considering the more recent period since January 2011, the twelve-month average for employment increased by 24.1% through February 2020, while the 12-month average MTA-wide ridership fell by 0.7%. Over the past two months, however, the impact of the COVID-19 pandemic has altered the trajectories of both, with employment standing at 22.1% of the January 2011 level, while MTA-wide ridership is 12.7% below its January 2011 level.
85
90
95
100
105
110
115
120
125
130
MTA-Wide Ridershipvs. New York City Employment
Ridership
Employment
Master Page # 13 of 35 - Finance Committee Meeting 6/24/2020________________________________________________________________________________

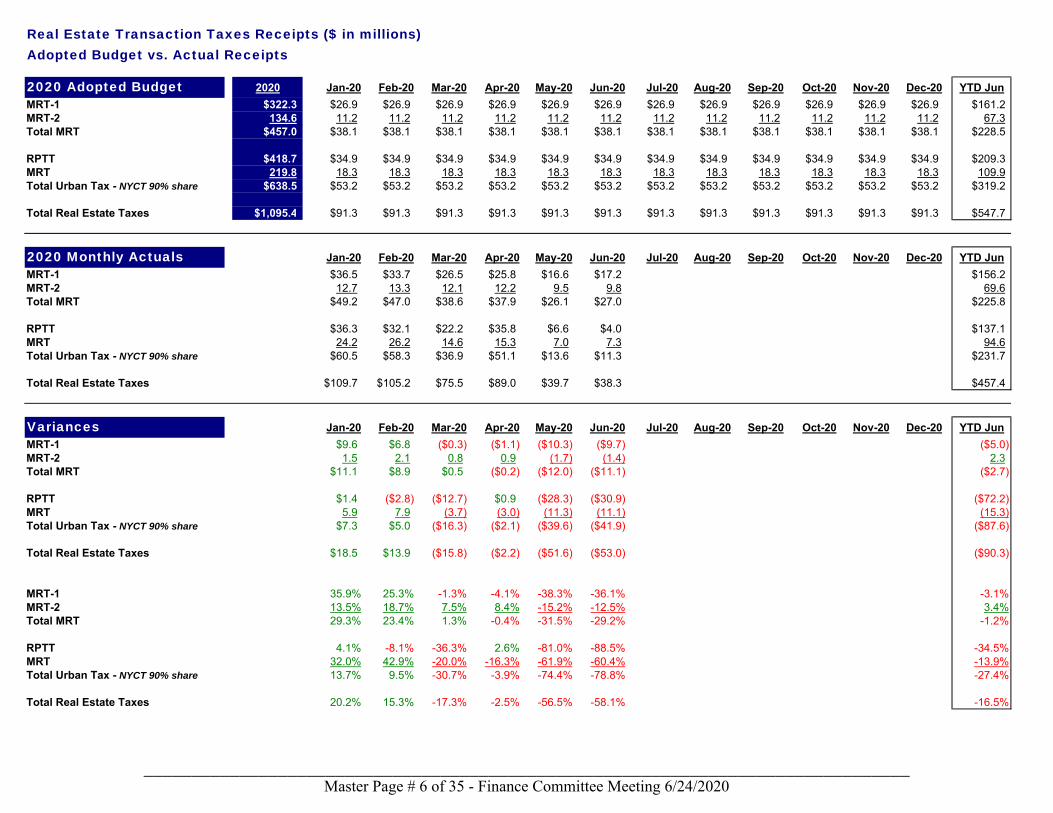
BUDGETWATCH Regional Economy Report The following ridership trend graphs depict 12-month averages; for example, the January 2014 data point is the average of February 2013 to January 2014, and the February 2014 data point is the average of March 2013 to February 2014, providing a visual representation of trends over time. Further, data have been standardized to 1.0, allowing for an easier comparison of trends on a single graph.
0.80
0.85
0.90
0.95
1.00
1.05
1.10
12 Month Average Ridership - Subway
Weekday Saturday Sunday
0.80
0.85
0.90
0.95
1.00
1.05
1.10
12 Month Average Weekday Ridership by Time of Day - Subway
12 AM ‐ 6 AM 6 AM ‐ 9 AM 9 AM ‐ 4 PM 4 PM ‐ 7 PM 7 PM ‐ 12 AM
Master Page # 14 of 35 - Finance Committee Meeting 6/24/2020________________________________________________________________________________

BUDGETWATCH Regional Economy Report
0.70
0.75
0.80
0.85
0.90
0.95
1.00
1.05
12 Month Average Ridership - NYCT Bus
Weekday Saturday Sunday
0.60
0.70
0.80
0.90
1.00
1.10
1.20
12 Month Average Ridership by Time of Day - NYCT Bus
12 AM ‐ 6 AM 6 AM ‐ 9 AM 9 AM ‐ 4 PM 4 PM ‐ 7 PM 7 PM ‐ 12 AM
Master Page # 15 of 35 - Finance Committee Meeting 6/24/2020________________________________________________________________________________
BUDGETWATCH Regional Economy Report
0.80
0.85
0.90
0.95
1.00
1.05
1.10
12 Month Average Ridership - MTA Bus
Weekday Saturday Sunday
0.80
0.90
1.00
1.10
1.20
1.30
12 Month Average Ridership by Time of Day - MTA Bus
12 AM ‐ 6 AM 6 AM ‐ 9 AM 9 AM ‐ 4 PM 4 PM ‐ 7 PM 7 PM ‐ 12 AM
Master Page # 16 of 35 - Finance Committee Meeting 6/24/2020________________________________________________________________________________

BUDGETWATCH Regional Economy Report
0.90
0.95
1.00
1.05
1.10
1.15
12 Month Average Ridership - Long Island Rail Road
Weekday Saturday Sunday
0.90
0.95
1.00
1.05
1.10
1.15
12 Month Average Ridership - Metro-North Railroad
Weekday Saturday Sunday
Master Page # 17 of 35 - Finance Committee Meeting 6/24/2020________________________________________________________________________________

BUDGETWATCH Regional Economy Report
0.40
0.60
0.80
1.00
1.20
1.40
12 Month Average Ridership - Staten Island Railway
Weekday Saturday Sunday
Master Page # 18 of 35 - Finance Committee Meeting 6/24/2020________________________________________________________________________________

BUDGETWATCH Regional Economy Report Consumer Price Index Goods Reporting Month-over-Month Price Increases ∙ Electricity ∙ Food ∙ Medical Care ∙ Transportation Goods Reporting Month-over-Month Price Declines ∙ Apparel ∙ Gasoline May-20 versus
May-20 Apr-20 May-19 Net Pct Net PctRegional CPI-U 282.09 280.62 278.07 1.47 0.5% 4.02 1.4%
Medical Care Component 531.94 531.36 505.46 0.58 0.1% 26.48 5.2%Electricity Component 176.67 173.66 172.36 3.01 1.7% 4.32 2.5%Gasoline (all grades) Component 169.94 178.55 236.98 (8.61) -4.8% (67.04) -28.3%
National CPI-U 256.39 256.39 256.09 0.00 0.0% 0.30 0.1%
Apr-20 May-19
50.00
60.00
70.00
80.00
90.00
100.00
110.00
120.00
130.00
Regional Inflation Trend:CPI‐U, Gasoline Component, Electricity Component
CPI‐U NY
Gasoline (All Types)
Electr icity
Master Page # 19 of 35 - Finance Committee Meeting 6/24/2020________________________________________________________________________________

BUDGETWATCH Regional Economy Report Fuel Prices Fuel - Spot Prices Latest Price: May-20 versusNY Harbor, except Crude Oil (WTI) 6/1/20 May-20 Apr-20 May-19 Apr-20 May-19Crude Oil ($/bbl) 35.49 28.56 16.55 60.83 72.6% -53.0%Conventional Regular Gasoline ($/gal) 1.00 0.88 0.59 1.92 47.7% -54.3%Low Sulfur No.2 Diesel Fuel ($/gal) 0.96 0.89 0.88 2.03 0.8% -56.3%No.2 Heating Oil ($/gal) 0.97 0.84 0.85 2.01 -1.1% -58.0%
10.0
30.0
50.0
70.0
90.0
110.0
130.0
Change in Spot Fuel Prices(January 2011=100.0)
Crude Oil (WTI)
No.2 Diesel Low Sulfur (NY Harbor)
Master Page # 20 of 35 - Finance Committee Meeting 6/24/2020________________________________________________________________________________
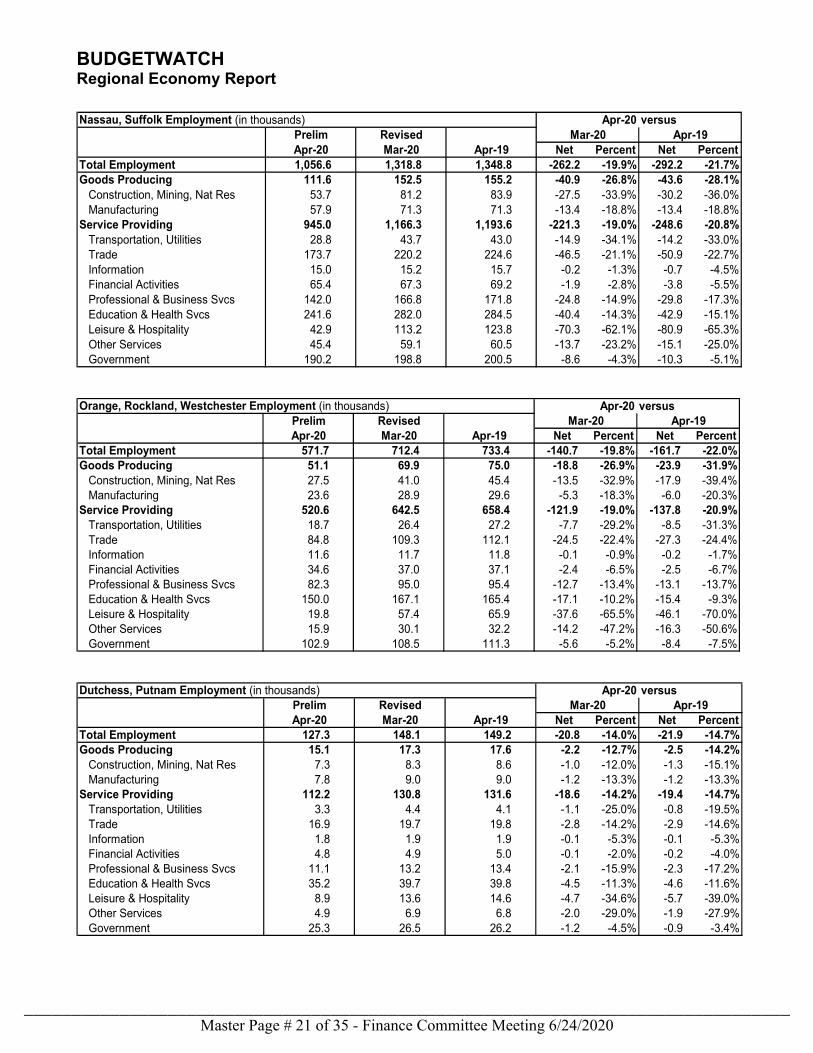
BUDGETWATCH Regional Economy Report Nassau, Suffolk Employment (in thousands) Apr-20 versus
Prelim RevisedApr-20 Mar-20 Apr-19 Net Percent Net Percent
Total Employment 1,056.6 1,318.8 1,348.8 -262.2 -19.9% -292.2 -21.7%Goods Producing 111.6 152.5 155.2 -40.9 -26.8% -43.6 -28.1%
Construction, Mining, Nat Res 53.7 81.2 83.9 -27.5 -33.9% -30.2 -36.0%Manufacturing 57.9 71.3 71.3 -13.4 -18.8% -13.4 -18.8%
Service Providing 945.0 1,166.3 1,193.6 -221.3 -19.0% -248.6 -20.8%Transportation, Utilities 28.8 43.7 43.0 -14.9 -34.1% -14.2 -33.0%Trade 173.7 220.2 224.6 -46.5 -21.1% -50.9 -22.7%Information 15.0 15.2 15.7 -0.2 -1.3% -0.7 -4.5%Financial Activities 65.4 67.3 69.2 -1.9 -2.8% -3.8 -5.5%Professional & Business Svcs 142.0 166.8 171.8 -24.8 -14.9% -29.8 -17.3%Education & Health Svcs 241.6 282.0 284.5 -40.4 -14.3% -42.9 -15.1%Leisure & Hospitality 42.9 113.2 123.8 -70.3 -62.1% -80.9 -65.3%Other Services 45.4 59.1 60.5 -13.7 -23.2% -15.1 -25.0%Government 190.2 198.8 200.5 -8.6 -4.3% -10.3 -5.1%
Mar-20 Apr-19
Orange, Rockland, Westchester Employment (in thousands) Apr-20 versus
Prelim RevisedApr-20 Mar-20 Apr-19 Net Percent Net Percent
Total Employment 571.7 712.4 733.4 -140.7 -19.8% -161.7 -22.0%Goods Producing 51.1 69.9 75.0 -18.8 -26.9% -23.9 -31.9%
Construction, Mining, Nat Res 27.5 41.0 45.4 -13.5 -32.9% -17.9 -39.4%Manufacturing 23.6 28.9 29.6 -5.3 -18.3% -6.0 -20.3%
Service Providing 520.6 642.5 658.4 -121.9 -19.0% -137.8 -20.9%Transportation, Utilities 18.7 26.4 27.2 -7.7 -29.2% -8.5 -31.3%Trade 84.8 109.3 112.1 -24.5 -22.4% -27.3 -24.4%Information 11.6 11.7 11.8 -0.1 -0.9% -0.2 -1.7%Financial Activities 34.6 37.0 37.1 -2.4 -6.5% -2.5 -6.7%Professional & Business Svcs 82.3 95.0 95.4 -12.7 -13.4% -13.1 -13.7%Education & Health Svcs 150.0 167.1 165.4 -17.1 -10.2% -15.4 -9.3%Leisure & Hospitality 19.8 57.4 65.9 -37.6 -65.5% -46.1 -70.0%Other Services 15.9 30.1 32.2 -14.2 -47.2% -16.3 -50.6%Government 102.9 108.5 111.3 -5.6 -5.2% -8.4 -7.5%
Mar-20 Apr-19
Dutchess, Putnam Employment (in thousands) Apr-20 versus
Prelim RevisedApr-20 Mar-20 Apr-19 Net Percent Net Percent
Total Employment 127.3 148.1 149.2 -20.8 -14.0% -21.9 -14.7%Goods Producing 15.1 17.3 17.6 -2.2 -12.7% -2.5 -14.2%
Construction, Mining, Nat Res 7.3 8.3 8.6 -1.0 -12.0% -1.3 -15.1%Manufacturing 7.8 9.0 9.0 -1.2 -13.3% -1.2 -13.3%
Service Providing 112.2 130.8 131.6 -18.6 -14.2% -19.4 -14.7%Transportation, Utilities 3.3 4.4 4.1 -1.1 -25.0% -0.8 -19.5%Trade 16.9 19.7 19.8 -2.8 -14.2% -2.9 -14.6%Information 1.8 1.9 1.9 -0.1 -5.3% -0.1 -5.3%Financial Activities 4.8 4.9 5.0 -0.1 -2.0% -0.2 -4.0%Professional & Business Svcs 11.1 13.2 13.4 -2.1 -15.9% -2.3 -17.2%Education & Health Svcs 35.2 39.7 39.8 -4.5 -11.3% -4.6 -11.6%Leisure & Hospitality 8.9 13.6 14.6 -4.7 -34.6% -5.7 -39.0%Other Services 4.9 6.9 6.8 -2.0 -29.0% -1.9 -27.9%Government 25.3 26.5 26.2 -1.2 -4.5% -0.9 -3.4%
Mar-20 Apr-19
Master Page # 21 of 35 - Finance Committee Meeting 6/24/2020________________________________________________________________________________
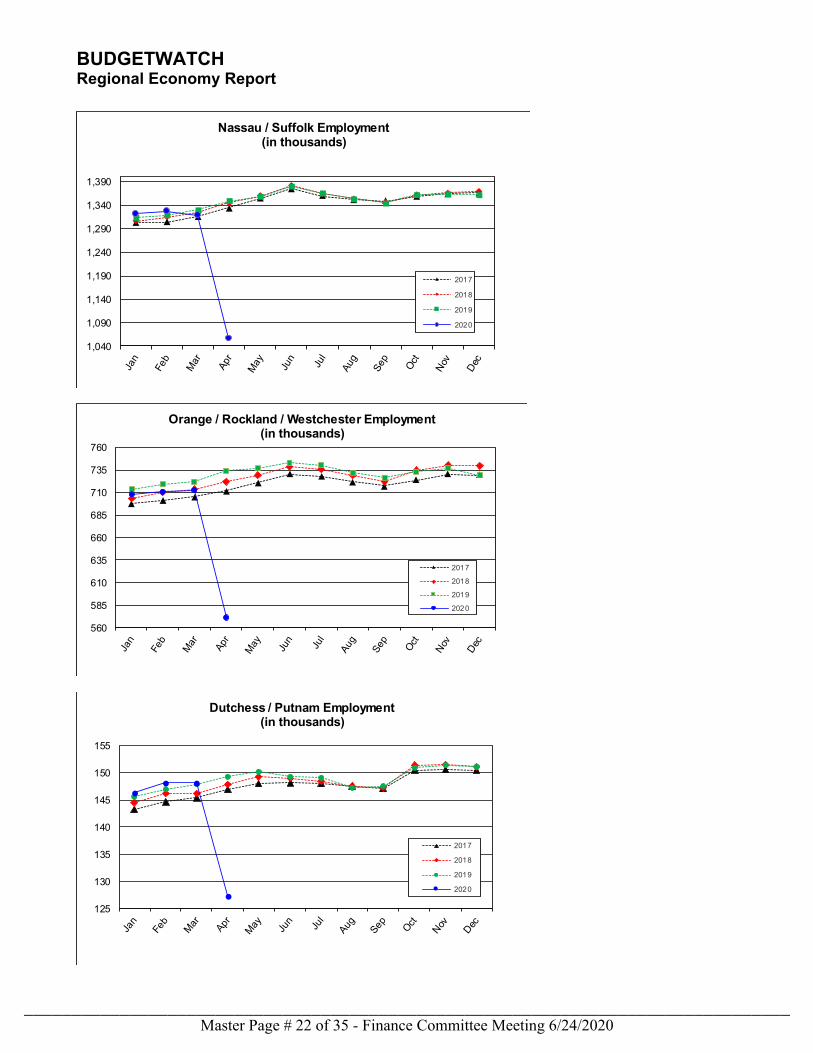
BUDGETWATCH Regional Economy Report
1,040
1,090
1,140
1,190
1,240
1,290
1,340
1,390
Nassau / Suffolk Employment(in thousands)
2017
2018
2019
2020
560
585
610
635
660
685
710
735
760
Orange / Rockland / Westchester Employment (in thousands)
2017
2018
2019
2020
125
130
135
140
145
150
155
Dutchess / Putnam Employment (in thousands)
2017
2018
2019
2020
Master Page # 22 of 35 - Finance Committee Meeting 6/24/2020________________________________________________________________________________
Annual Review of MTA SponsoredPension & Retirement Funds
As of December 31, 2019
Master Page # 23 of 35 - Finance Committee Meeting 6/24/2020________________________________________________________________________________
TABLE OF CONTENTS
2
PageExecutive Summary 3Overview – MTA Sponsored and Multi-Employer Plans 4Market Overview 5Return Assumptions & Funding Level 6-7MWBE Participation 8Appendix 9
Master Page # 24 of 35 - Finance Committee Meeting 6/24/2020________________________________________________________________________________
3
Executive Summary
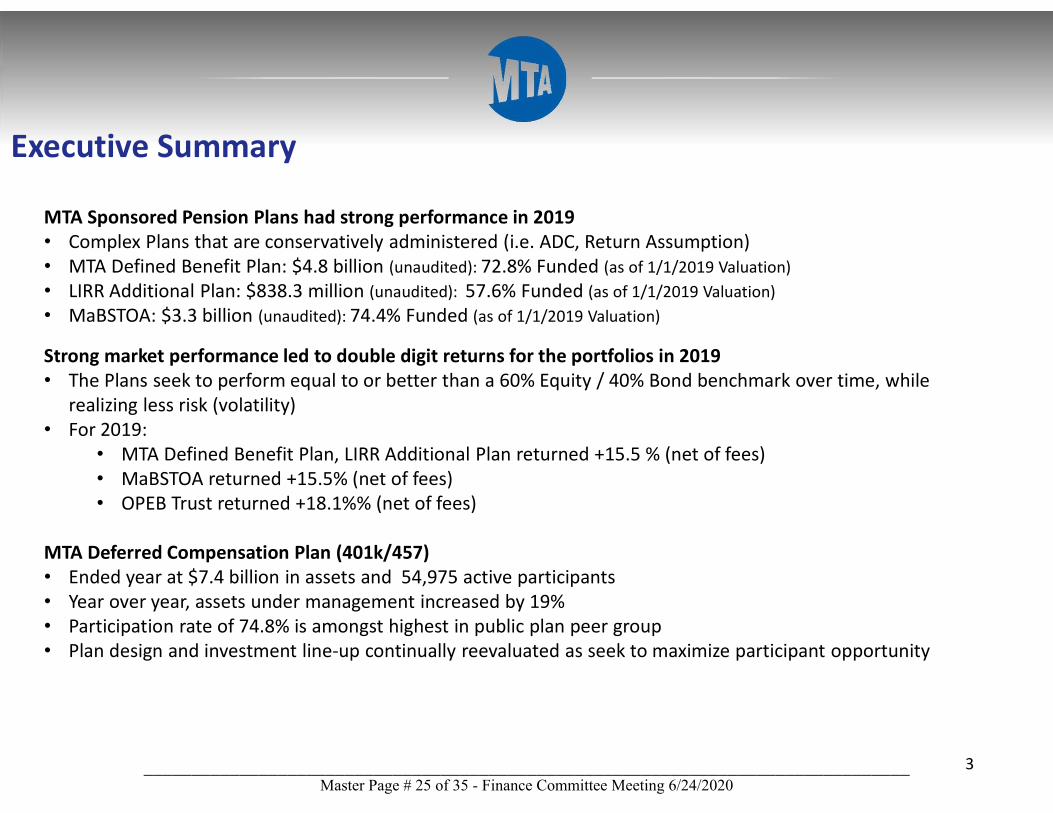
MTA Sponsored Pension Plans had strong performance in 2019• Complex Plans that are conservatively administered (i.e. ADC, Return Assumption)• MTA Defined Benefit Plan: $4.8 billion (unaudited): 72.8% Funded (as of 1/1/2019 Valuation)• LIRR Additional Plan: $838.3 million (unaudited): 57.6% Funded (as of 1/1/2019 Valuation)• MaBSTOA: $3.3 billion (unaudited): 74.4% Funded (as of 1/1/2019 Valuation)
Strong market performance led to double digit returns for the portfolios in 2019• The Plans seek to perform equal to or better than a 60% Equity / 40% Bond benchmark over time, while
realizing less risk (volatility)• For 2019:
• MTA Defined Benefit Plan, LIRR Additional Plan returned +15.5 % (net of fees)• MaBSTOA returned +15.5% (net of fees)• OPEB Trust returned +18.1%% (net of fees)
MTA Deferred Compensation Plan (401k/457)• Ended year at $7.4 billion in assets and 54,975 active participants• Year over year, assets under management increased by 19%• Participation rate of 74.8% is amongst highest in public plan peer group• Plan design and investment line-up continually reevaluated as seek to maximize participant opportunity
Master Page # 25 of 35 - Finance Committee Meeting 6/24/2020________________________________________________________________________________
4
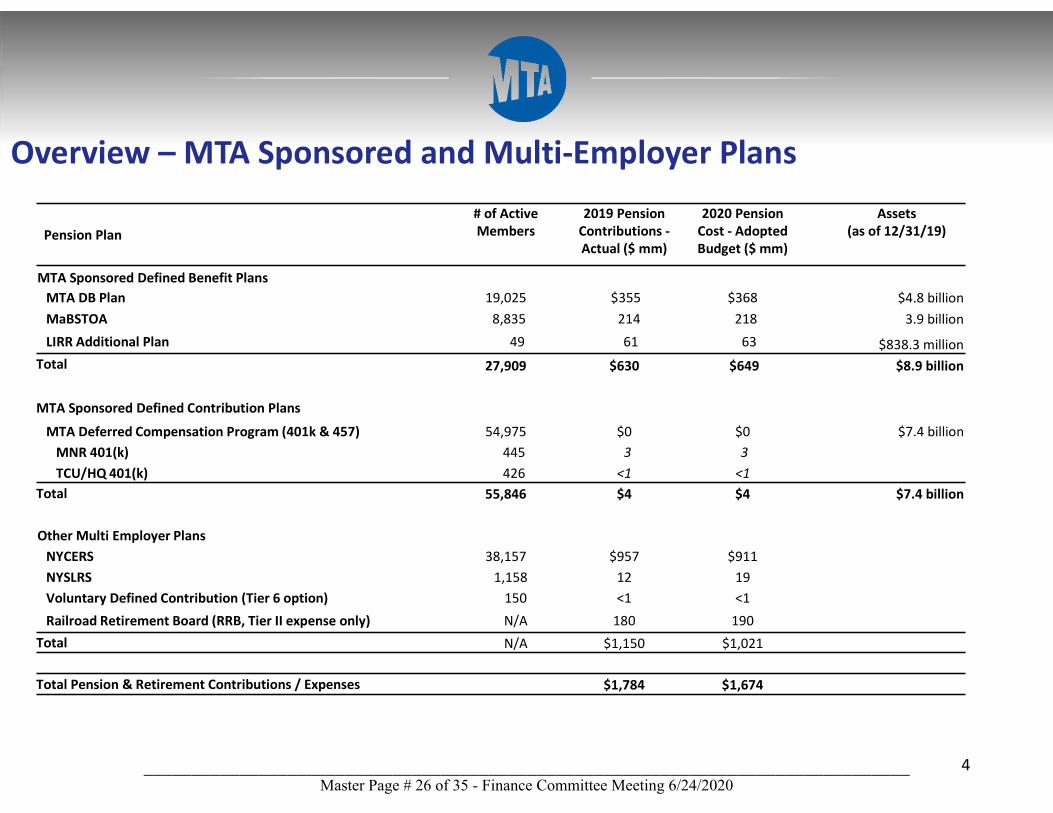
Overview – MTA Sponsored and Multi-Employer Plans
Pension Plan# of Active Members
2019 Pension Contributions -Actual ($ mm)
2020 Pension Cost - Adopted Budget ($ mm)
Assets (as of 12/31/19)
MTA Sponsored Defined Benefit PlansMTA DB Plan 19,025 $355 $368 $4.8 billion MaBSTOA 8,835 214 218 3.9 billion
LIRR Additional Plan 49 61 63 $838.3 millionTotal 27,909 $630 $649 $8.9 billion
MTA Sponsored Defined Contribution Plans
MTA Deferred Compensation Program (401k & 457) 54,975 $0 $0 $7.4 billionMNR 401(k) 445 3 3TCU/HQ 401(k) 426 <1 <1
Total 55,846 $4 $4 $7.4 billion
Other Multi Employer PlansNYCERS 38,157 $957 $911NYSLRS 1,158 12 19Voluntary Defined Contribution (Tier 6 option) 150 <1 <1
Railroad Retirement Board (RRB, Tier II expense only) N/A 180 190Total N/A $1,150 $1,021
Total Pension & Retirement Contributions / Expenses $1,784 $1,674
Master Page # 26 of 35 - Finance Committee Meeting 6/24/2020________________________________________________________________________________
5
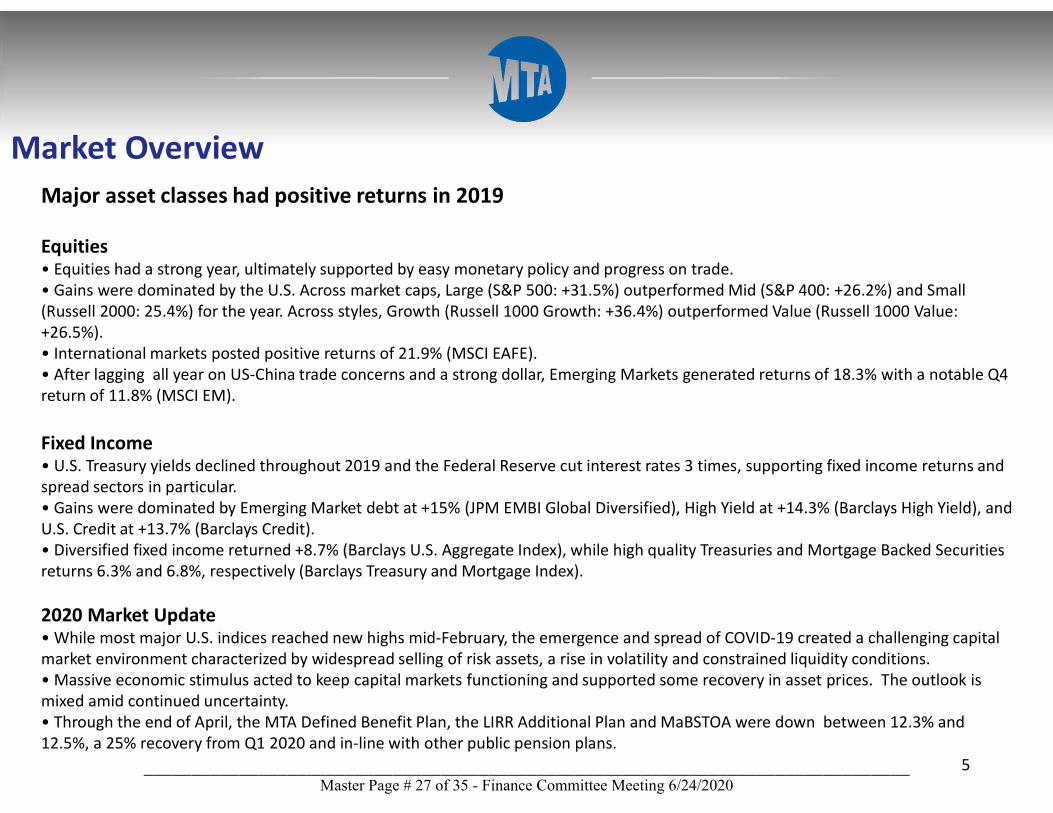
Market OverviewMajor asset classes had positive returns in 2019
Equities• Equities had a strong year, ultimately supported by easy monetary policy and progress on trade.• Gains were dominated by the U.S. Across market caps, Large (S&P 500: +31.5%) outperformed Mid (S&P 400: +26.2%) and Small (Russell 2000: 25.4%) for the year. Across styles, Growth (Russell 1000 Growth: +36.4%) outperformed Value (Russell 1000 Value: +26.5%).• International markets posted positive returns of 21.9% (MSCI EAFE).• After lagging all year on US-China trade concerns and a strong dollar, Emerging Markets generated returns of 18.3% with a notable Q4 return of 11.8% (MSCI EM).
Fixed Income• U.S. Treasury yields declined throughout 2019 and the Federal Reserve cut interest rates 3 times, supporting fixed income returns and spread sectors in particular. • Gains were dominated by Emerging Market debt at +15% (JPM EMBI Global Diversified), High Yield at +14.3% (Barclays High Yield), and U.S. Credit at +13.7% (Barclays Credit). • Diversified fixed income returned +8.7% (Barclays U.S. Aggregate Index), while high quality Treasuries and Mortgage Backed Securities returns 6.3% and 6.8%, respectively (Barclays Treasury and Mortgage Index).
2020 Market Update• While most major U.S. indices reached new highs mid-February, the emergence and spread of COVID-19 created a challenging capital market environment characterized by widespread selling of risk assets, a rise in volatility and constrained liquidity conditions.• Massive economic stimulus acted to keep capital markets functioning and supported some recovery in asset prices. The outlook is mixed amid continued uncertainty.• Through the end of April, the MTA Defined Benefit Plan, the LIRR Additional Plan and MaBSTOA were down between 12.3% and 12.5%, a 25% recovery from Q1 2020 and in-line with other public pension plans.
Master Page # 27 of 35 - Finance Committee Meeting 6/24/2020________________________________________________________________________________
6
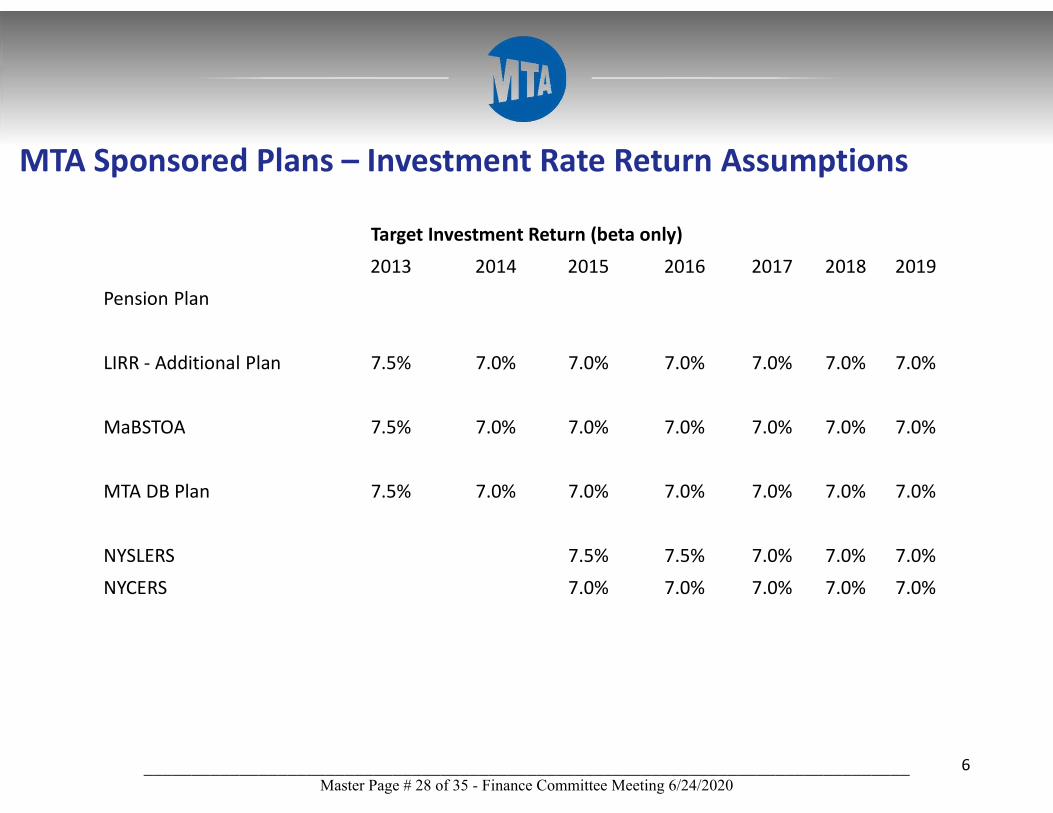
MTA Sponsored Plans – Investment Rate Return Assumptions
Target Investment Return (beta only)
2013 2014 2015 2016 2017 2018 2019
Pension Plan
LIRR - Additional Plan 7.5% 7.0% 7.0% 7.0% 7.0% 7.0% 7.0%
MaBSTOA 7.5% 7.0% 7.0% 7.0% 7.0% 7.0% 7.0%
MTA DB Plan 7.5% 7.0% 7.0% 7.0% 7.0% 7.0% 7.0%
NYSLERS 7.5% 7.5% 7.0% 7.0% 7.0%
NYCERS 7.0% 7.0% 7.0% 7.0% 7.0%
Master Page # 28 of 35 - Finance Committee Meeting 6/24/2020________________________________________________________________________________

7
MTA Sponsored Plans – Funding Status
1/1/2011 1/1/2012 1/1/2013 1/1/2014 1/1/2015 1/1/2016 1/1/2017 1/1/2018 1/1/2019LIRR Additional Plan 28.2 24.8 24.8 30.9 48.8 46.0 50.8 64.7 57.6MaBSTOA 60.6 55.7 60.1 65.2 69.3 67.3 72.1 79.4 74.4MTA DB 72.7 65.8 68.9 71.6 72.5 68.6 71.1 78.2 72.8
28.2%
57.6% 60.6%
74.4%
72.7% 72.8%
0%
20%
40%
60%
80%
100%
1/1/2011 1/1/2012 1/1/2013 1/1/2014 1/1/2015 1/1/2016 1/1/2017 1/1/2018 1/1/2019
Fu
nd
ed
Rat
io
Date of Valuation
LIRR Additional Plan MaBSTOA MTA DB
Master Page # 29 of 35 - Finance Committee Meeting 6/24/2020________________________________________________________________________________

8
MTA Sponsored Plans – MWBE Participation
As of December 31, 2019
Non-MWBE Managed Assets,
$7,108,194,843 : 83%
MWBE Managed Assets, $1,454,724,328 : 17%
Combined Plans - Total Assets
Non-MWBE Managed Assets (Public),
$4,114,549,261 : 75%
MWBE Managed Assets (Public),
$1,354,789,516 : 25%
Combined Plans - Public assets
Non-MWBE Managed Assets
(Private), $2,993,645,582 :
97%
MWBE Managed Assets
(Alternatives), 99,934,812: 3%
Combined Plans - Private assets
0.00%
10.00%
20.00%
30.00%
40.00%
50.00%
60.00%
% of US Equity % of Non-USEquity
% of FixedIncome
% of PrivateEquity
% of Real Estate
MWBE Managed Assets by Asset Class
Master Page # 30 of 35 - Finance Committee Meeting 6/24/2020________________________________________________________________________________

9
Appendix
Master Page # 31 of 35 - Finance Committee Meeting 6/24/2020________________________________________________________________________________

MTA Defined Benefit Pension PlanLIRR Plan for Additional PlanPension Board of Managers
MEMBER DESIGNEE MTA TITLE
Chairman of the MTA Margaret Connor Chair of Pension Board of Managers
Sr. Dir. of Human Resources and Retirement Programs
MTA Labor Relations Richard Cairns Deputy Dir. Labor Counsel, HQMTA Chief Financial Officer David Keller Acting Director of Mgmt & BudgetMetro North James McGovern Controller, MNRLong Island Railroad Michael Reilly Controller, LIRRSIRTOA VacantMTA Bus Roy Grey-Stewart Director of Finance, MTA BusLong Island Bus Patrick McCoy Director, MTA FinanceTWU Representative Peter Rosconi
MTA Chief Investment Officer Valerie Bannon
Investment Advisor NEPC, LLC
Actuary Milliman, USA
Trustee J P Morgan Chase
10Master Page # 32 of 35 - Finance Committee Meeting 6/24/2020
________________________________________________________________________________

MaBSTOA (Manhattan and Bronx Surface Transit Operating Authority) Pension Plan
Investment Committee
MEMBER DESIGNEE MTA TITLE
Chairman of Employer's (MaBSTOA) Board Margaret Connor Sr. Dir. of Human Resources and Retirement Programs
MTA Chief Financial Officer Joseph Cornwall Asst Comptroller, Ben PlansPresident of Transit Authority William Vazoulas Controller, NYCTTWU Local 100 (2 representatives) James Whalen
Richard Davis
MTA Chief Investment Officer Valerie Bannon
Investment Advisor NEPC, LLC
Actuary Milliman, USA
Trustee J P Morgan Chase
11Master Page # 33 of 35 - Finance Committee Meeting 6/24/2020
________________________________________________________________________________
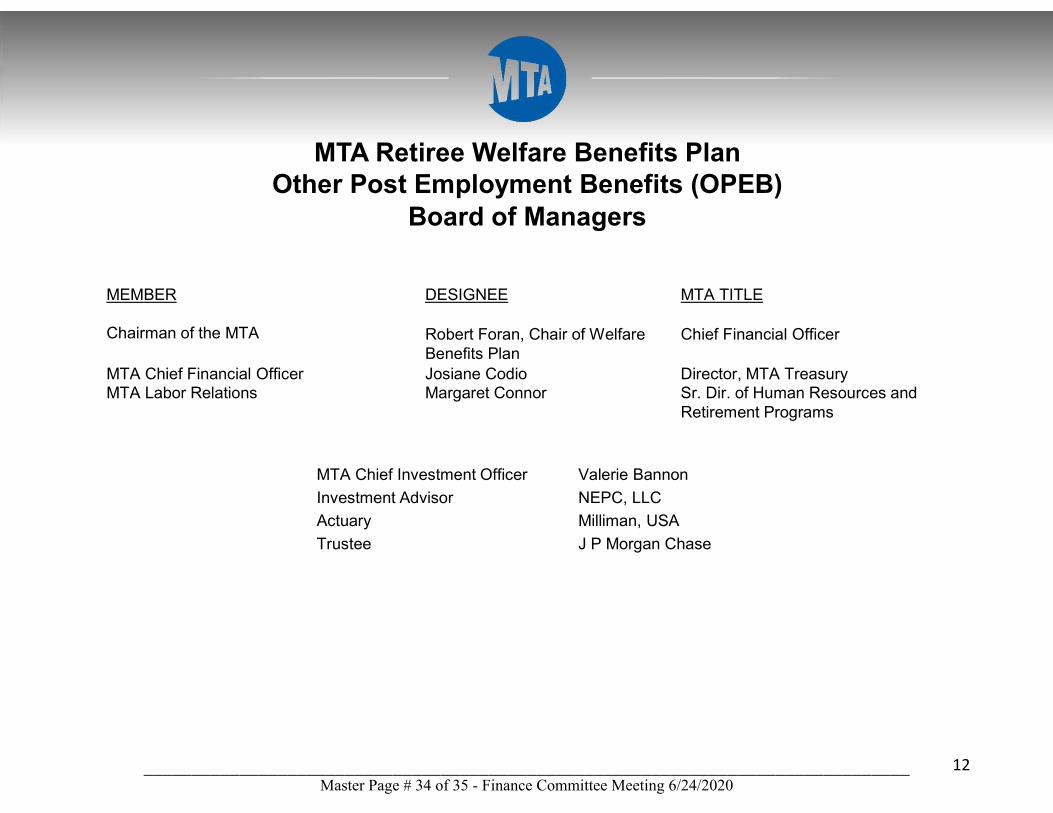
MTA Retiree Welfare Benefits PlanOther Post Employment Benefits (OPEB)
Board of Managers
MEMBER DESIGNEE MTA TITLE
Chairman of the MTA Robert Foran, Chair of Welfare Benefits Plan
Chief Financial Officer
MTA Chief Financial Officer Josiane Codio Director, MTA TreasuryMTA Labor Relations Margaret Connor Sr. Dir. of Human Resources and
Retirement Programs
MTA Chief Investment Officer Valerie Bannon
Investment Advisor NEPC, LLC
Actuary Milliman, USA
Trustee J P Morgan Chase
12Master Page # 34 of 35 - Finance Committee Meeting 6/24/2020
________________________________________________________________________________
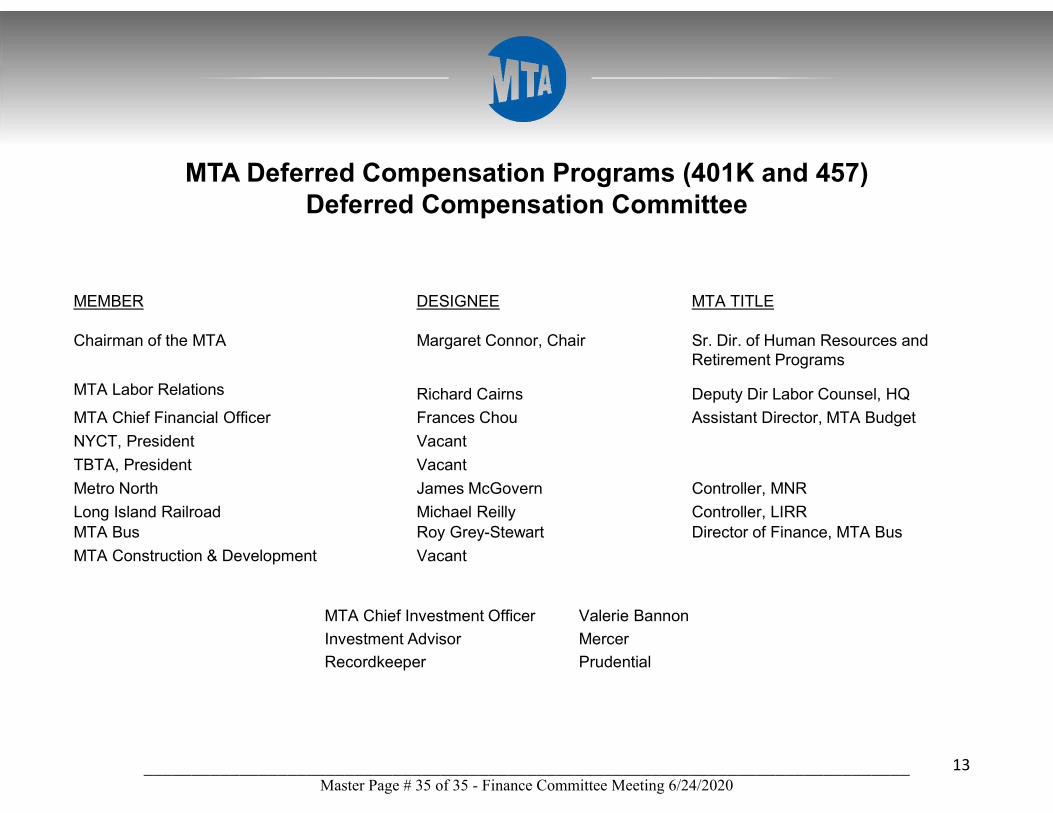
MTA Chief Investment Officer Valerie Bannon
Investment Advisor Mercer
Recordkeeper Prudential
13
MTA Deferred Compensation Programs (401K and 457)Deferred Compensation Committee
MEMBER DESIGNEE MTA TITLE
Chairman of the MTA Margaret Connor, Chair Sr. Dir. of Human Resources and Retirement Programs
MTA Labor Relations Richard Cairns Deputy Dir Labor Counsel, HQ
MTA Chief Financial Officer Frances Chou Assistant Director, MTA Budget
NYCT, President Vacant
TBTA, President Vacant
Metro North James McGovern Controller, MNR
Long Island Railroad Michael Reilly Controller, LIRRMTA Bus Roy Grey-Stewart Director of Finance, MTA Bus
MTA Construction & Development Vacant
Master Page # 35 of 35 - Finance Committee Meeting 6/24/2020________________________________________________________________________________