Embed Size (px)
Citation preview

T2.1 Chapter Outline
Prepared by: Thomas J. CottrellModified by: Carlos Vecino HEC-Montreal
Chapter 2Financial Statements, Taxes, and Cash Flow
Chapter Organization
2.1 The Balance Sheet
2.2 The Income Statement
2.3 Cash Flow
2.4 Taxes
2.5 Capital Cost Allowance
2.6 Summary and Conclusions
copyright © 2002 McGraw-Hill Ryerson,Ltd.

FINANCIAL ANALYSIS AND FORECASTING (HEC-MONTREAL) Fundamentals of Corporate Finance 2002 McGraw-Hill Ryerson, Ltd Slide 2
T2.2 The Balance Sheet (Figure 2.1)

FINANCIAL ANALYSIS AND FORECASTING (HEC-MONTREAL) Fundamentals of Corporate Finance 2002 McGraw-Hill Ryerson, Ltd Slide 3
T2.2 The Balance Sheet
Components Assets (Current & Long-Term) Liabilities (Current & Long-Term) Owners Equity
Key concepts Liquidity Net Working Capital
• Current Assets minus Current Liabilities Debt vs. Equity Market vs. Book Value
FINANCIAL ANALYSIS AND FORECASTING (HEC-MONTREAL) Fundamentals of Corporate Finance 2002 McGraw-Hill Ryerson, Ltd Slide 4
T2.3 Income Statement
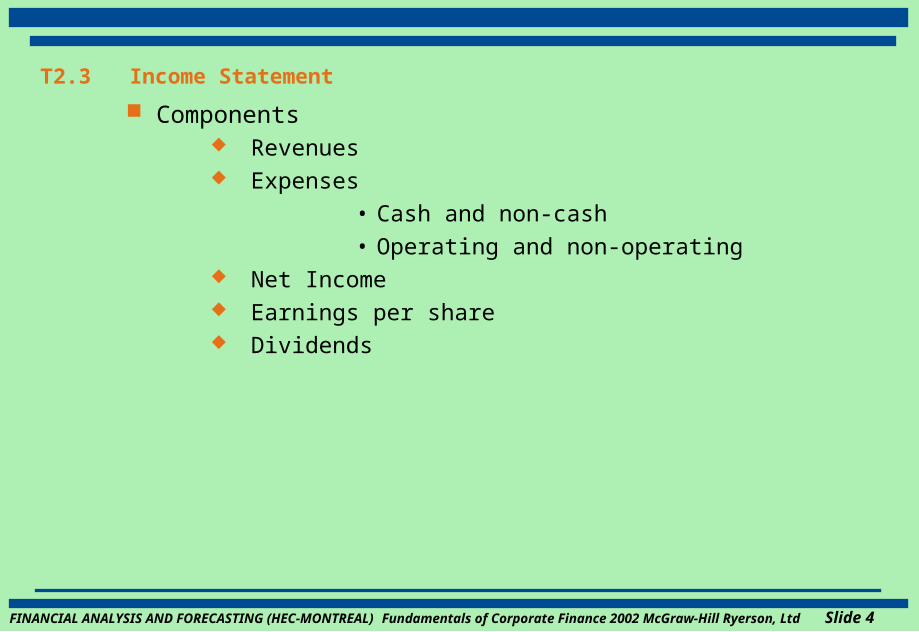
Components Revenues Expenses
• Cash and non-cash
• Operating and non-operating Net Income Earnings per share Dividends

FINANCIAL ANALYSIS AND FORECASTING (HEC-MONTREAL) Fundamentals of Corporate Finance 2002 McGraw-Hill Ryerson, Ltd Slide 5
T2.4 Cash Flow
Cash flows are essential to valuation
Accounting methods give an estimate of the economic value of transactions
In Finance, the main concern is the timing of cash flows.
Since the income statement includes non-cash items, we will have to adjust it to get information on cash flows
Balance sheet activity plays an important role in the determination of the cash balance (e.g.)
Collections on accounts receivable
Borrowing on accounts payable
Work with reported financial statements to find cash flow.

FINANCIAL ANALYSIS AND FORECASTING (HEC-MONTREAL) Fundamentals of Corporate Finance 2002 McGraw-Hill Ryerson, Ltd Slide 6
T2.4 GAAP versus Cash Flow Time Line
Revenue
recognized
and
matched
expenses
Sale of goods
on credit
Time
Pay Payroll Pay Collect
for checks utilities accounts
raw goodsissued receivable
Cash flowCash flowCash flow Cash flow

FINANCIAL ANALYSIS AND FORECASTING (HEC-MONTREAL) Fundamentals of Corporate Finance 2002 McGraw-Hill Ryerson, Ltd Slide 7
T2.5 Cash Flow Example
Balance Sheet
Beg End Beg End
Cash $100 $150 A/P $100 $150
A/R 200 250 N/P 200 200
Inv 300 300 C/L 300 350
C/A $600 $700 LTD $400 $420
NFA 400 500 C/S 50 60
R/E 250 370
$300 $430
Total $1000 $1200 Total $1000 $1200

FINANCIAL ANALYSIS AND FORECASTING (HEC-MONTREAL) Fundamentals of Corporate Finance 2002 McGraw-Hill Ryerson, Ltd Slide 8
T2.5 Cash Flow Example (continued)
Income Statement
Sales $2000
Costs 1400
Depreciation100
EBIT 500
Interest 100
Taxable Income 400
Taxes 200
Net Income$200
Dividends$_____
Addition to R/E _____

FINANCIAL ANALYSIS AND FORECASTING (HEC-MONTREAL) Fundamentals of Corporate Finance 2002 McGraw-Hill Ryerson, Ltd Slide 9
T2.5 Cash Flow Example (continued)
Income Statement
Sales $2000
Costs 1400
Depreciation100
EBIT 500
Interest 100
Taxable Income 400
Taxes 200
Net Income$200
Dividends 80
Addition to R/E $120

FINANCIAL ANALYSIS AND FORECASTING (HEC-MONTREAL) Fundamentals of Corporate Finance 2002 McGraw-Hill Ryerson, Ltd Slide 10
T2.5 Cash Flow Example (concluded)A. Cash flow from assets
1. Operating cash flow = EBIT + _____________ – Taxes= $500 + 100
– 200= $_____
2. Change in NWC = ___________ – ___________= $350 –
$_____= $_____
3. Net capital spending = $_____ + Dep – _____= $500 + 100
– 400= $_____
4. Cash flow from assets = OCF – chg. NWC – Cap. sp.= $400 – 50
– 200= $150
B. Cash flow to creditors and stockholders
1. Cash flow to creditors = Int. paid – _________________= $100 – 20= $80
2. Cash flow to stockholders = Div. paid – ________________= $80 – 10= $70
Check: $___ from assets = $___ to Bondholders + $___ to Stockholders

FINANCIAL ANALYSIS AND FORECASTING (HEC-MONTREAL) Fundamentals of Corporate Finance 2002 McGraw-Hill Ryerson, Ltd Slide 11
T2.5 Cash Flow Example (concluded)A. Cash flow from assets
1. Operating cash flow = EBIT + Depreciation – Taxes= $500 + 100 – 200= $400
2. Change in NWC = Ending NWC – Beginning NWC= $350 – 300= $50
3. Net capital spending = Ending NFA + Dep – Beginning NFA= $500 + 100 – 400= $200
4. Cash flow from assets = OCF – chg. NWC – Cap. sp.= $400 – 50 – 200= $150
B. Cash flow to creditors and stockholders
1. Cash flow to creditors = Int. paid – Net new Borrowing= $100 – 20= $80
2. Cash flow to stockholders = Div. paid – Net new Equity= $80 – 10= $70
Check: $150 from assets = $80 to bondholders + $70 to stockholders

FINANCIAL ANALYSIS AND FORECASTING (HEC-MONTREAL) Fundamentals of Corporate Finance 2002 McGraw-Hill Ryerson, Ltd Slide 12
T2.6 Cash Flow Summary
I. The cash flow identityCash flow from assets = Cash flow to creditors (bondholders)
+ Cash flow to stockholders (owners)
This is based upon the balance sheet identity: Assets = Liabilities + Equity
The equivalent cash flow statement is: cash flow to creditors
Cash flow from assets = +
cash flow to stockholders

FINANCIAL ANALYSIS AND FORECASTING (HEC-MONTREAL) Fundamentals of Corporate Finance 2002 McGraw-Hill Ryerson, Ltd Slide 13
T2.6 Cash Flow Summary (cont’d)
II. Cash flow from assetsCash flow from assets = Operating cash flow
– Net capital spending – Additions to net working capital (NWC)
where Operating cash flow = Earnings before interest and taxes (EBIT)
+ Depreciation – Taxes Net capital spending = Ending net fixed assets –
Beginning net fixed assets+ Depreciation
Change in NWC = Ending NWC – Beginning NWC
III. Cash flow to creditorsCash flow to creditors = Interest paid – Net new borrowing
IV. Cash flow to stockholdersCash flow to stockholders = Dividends paid – Net new equity raised
FINANCIAL ANALYSIS AND FORECASTING (HEC-MONTREAL) Fundamentals of Corporate Finance 2002 McGraw-Hill Ryerson, Ltd Slide 14
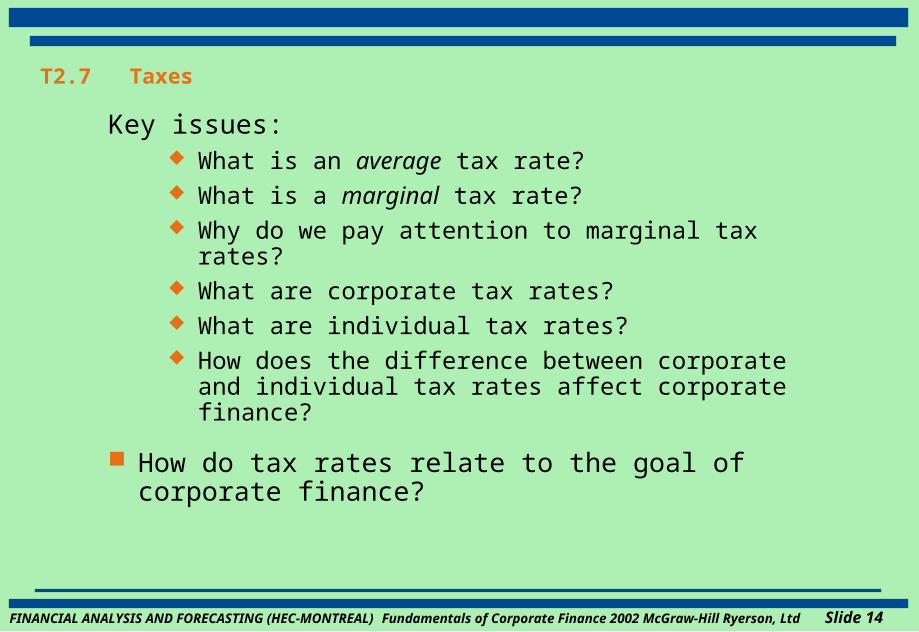
T2.7 Taxes
Key issues: What is an average tax rate? What is a marginal tax rate? Why do we pay attention to marginal tax rates? What are corporate tax rates? What are individual tax rates? How does the difference between corporate and individual
tax rates affect corporate finance?
How do tax rates relate to the goal of corporate finance?

FINANCIAL ANALYSIS AND FORECASTING (HEC-MONTREAL) Fundamentals of Corporate Finance 2002 McGraw-Hill Ryerson, Ltd Slide 15
T2.7 Individual Tax Rates Federal Tax Rates:Taxable Income 2003 Marginal Rate 0 – 32,183 16% 32,183 – 64,368
22% 64,368 – 104,648 26% 104,648 and above
29% OntarioTaxable Income Rate on Excess$ 0 - $32,435 6.05% 30,005 – 64,871 9.15% 64,872 and above 11.16%
Basic personal credit: $465Quebec
Taxable Income 2002 Adjusted Rate$0 – 26,700 16.00%$26,701 – 53,405 20.00%Above $53,405 24.00%
Basic personal credit: $1,688http://www.ccra-adrc.gc.ca/tax/individuals/faq/2003_rate-e.htmlhttp://www.cfib.ca/research/comments/tax_bites_pit.pdf

FINANCIAL ANALYSIS AND FORECASTING (HEC-MONTREAL) Fundamentals of Corporate Finance 2002 McGraw-Hill Ryerson, Ltd Slide 16
Quebec Individual Tax Rates
FEDERAL
Taxable Income Tax Rate on Excess
$ 1 $ -- 17%
32,000 5,440 24
64,000 13,120 29
ONTARIO
Taxable Income Rate on Excess
$ 0 - 30,004 6.37%
30,005 - 60,000 9.62%
>60,000 11.16%
http://www.investquebec.com/en/que/doc/pdf/fisc_quebec/Taxation2003.pdf

FINANCIAL ANALYSIS AND FORECASTING (HEC-MONTREAL) Fundamentals of Corporate Finance 2002 McGraw-Hill Ryerson, Ltd Slide 17
T2.7 Marginal versus Average Tax Rates
FINANCIAL ANALYSIS AND FORECASTING (HEC-MONTREAL) Fundamentals of Corporate Finance 2002 McGraw-Hill Ryerson, Ltd Slide 18
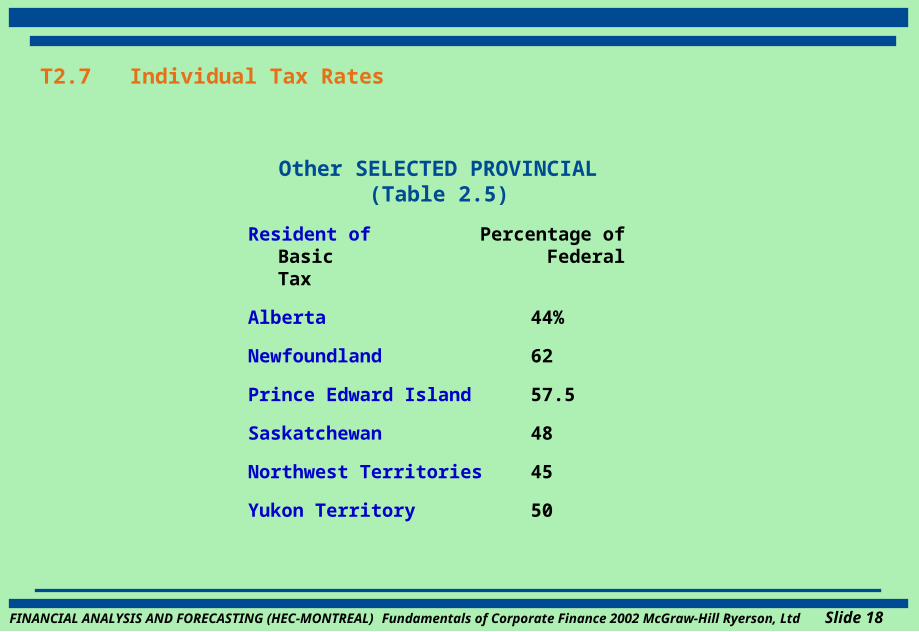
T2.7 Individual Tax Rates
Other SELECTED PROVINCIAL(Table 2.5)
Resident of Percentage of Basic Federal Tax
Alberta 44%
Newfoundland 62
Prince Edward Island 57.5
Saskatchewan 48
Northwest Territories 45
Yukon Territory 50
FINANCIAL ANALYSIS AND FORECASTING (HEC-MONTREAL) Fundamentals of Corporate Finance 2002 McGraw-Hill Ryerson, Ltd Slide 19
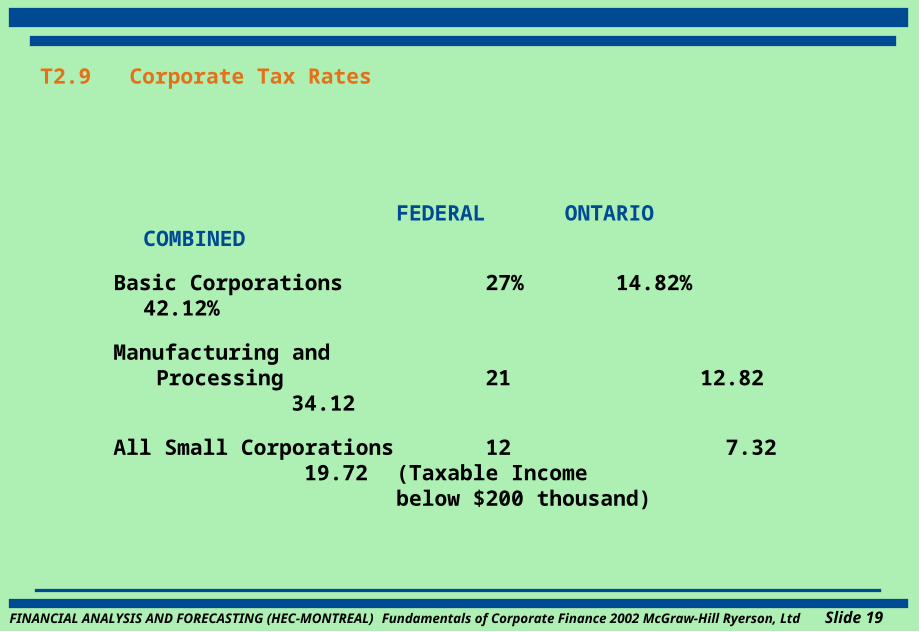
T2.9 Corporate Tax Rates
FEDERAL ONTARIOCOMBINED
Basic Corporations 27% 14.82% 42.12%
Manufacturing and Processing 21 12.82 34.12
All Small Corporations 12 7.32 19.72(Taxable Income below $200 thousand)

FINANCIAL ANALYSIS AND FORECASTING (HEC-MONTREAL) Fundamentals of Corporate Finance 2002 McGraw-Hill Ryerson, Ltd Slide 20

FINANCIAL ANALYSIS AND FORECASTING (HEC-MONTREAL) Fundamentals of Corporate Finance 2002 McGraw-Hill Ryerson, Ltd Slide 21

FINANCIAL ANALYSIS AND FORECASTING (HEC-MONTREAL) Fundamentals of Corporate Finance 2002 McGraw-Hill Ryerson, Ltd Slide 22
T 2.10 Capital Cost Allowance - Depreciation for tax purposes
Class Rate Assets
1 4% Buildings acquired after 1987
8 20% Furniture, photocopiers
10 30% Vans, trucks, tractors and computer equipment
13 Straight-line Leasehold improvements
16 40% Taxicabs and rental cars
22 50% Pollution control equipment
43 30% Manufacturing equipment

FINANCIAL ANALYSIS AND FORECASTING (HEC-MONTREAL) Fundamentals of Corporate Finance 2002 McGraw-Hill Ryerson, Ltd Slide 23
T2.11 CCA Example
Depreciation on $22,000 Photocopier (CCA Class 8)
Year UCC t CCA UCC t+1
1 11,000 2,200 $8,800
2 19,800 3,960 15,840
3 15,840 3,168 12,672
4 12,672 2,534 10,138
5 10,138 2,028 8,110
6 8,110 1,622 6,488

FINANCIAL ANALYSIS AND FORECASTING (HEC-MONTREAL) Fundamentals of Corporate Finance 2002 McGraw-Hill Ryerson, Ltd Slide 24
T2.12 Hermetic, Inc. Balance Sheet
as of December 31($ in thousands)
Assets 2000 2001
Current assets
Cash $ 45 $ 50
Accounts receivable 260 310
Inventory 320 385
Total $ 625$ 745
Fixed assets
Net plant and equipment 985 1100
Total assets $1610 $1845

FINANCIAL ANALYSIS AND FORECASTING (HEC-MONTREAL) Fundamentals of Corporate Finance 2002 McGraw-Hill Ryerson, Ltd Slide 25
T2.12 Hermetic, Inc. Balance Sheet (concluded)
Liabilities and equity 2000 2001
Current liabilities
Accounts payable $ 210 $ 260
Notes payable 110 175
Total $ 320$ 435
Long-term debt 205 225
Stockholders’ equityCommon stock and
paid-in surplus 290 290
Retained earnings 795 895
Total $1085 $1185
Total liabilities and equity $1610 $1845

FINANCIAL ANALYSIS AND FORECASTING (HEC-MONTREAL) Fundamentals of Corporate Finance 2002 McGraw-Hill Ryerson, Ltd Slide 26
T2.13 Hermetic, Inc. Income Statement
2001 ($ in thousands)
Net sales $710.00
Cost of goods sold 480.00
Depreciation 30.00
Earnings before interest and taxes $200.00
Interest 20.00
Taxable income 180.00
Taxes 53.45
Net income $126.55
Dividends 26.55
Addition to retained earnings $100.00

FINANCIAL ANALYSIS AND FORECASTING (HEC-MONTREAL) Fundamentals of Corporate Finance 2002 McGraw-Hill Ryerson, Ltd Slide 27
T2.14 Hermetic, Inc. Cash Flow from Assets
Cash flow from assets: Operating cash flow:
EBIT $ 200.00
+ Depreciation + 30.00
– Taxes – 53.45
$ 176.55 Change in net working capital:
Ending net working capital $ 310.00
– Beginning net working capital – 305.00
$ 5.00 Net capital spending:
Ending net fixed assets $ 1,100.00
– Beginning net fixed assets – 985.00
+ Depreciation + 30.00
$ 145.00
Cash flow from assets:
$ 26.55
FINANCIAL ANALYSIS AND FORECASTING (HEC-MONTREAL) Fundamentals of Corporate Finance 2002 McGraw-Hill Ryerson, Ltd Slide 28
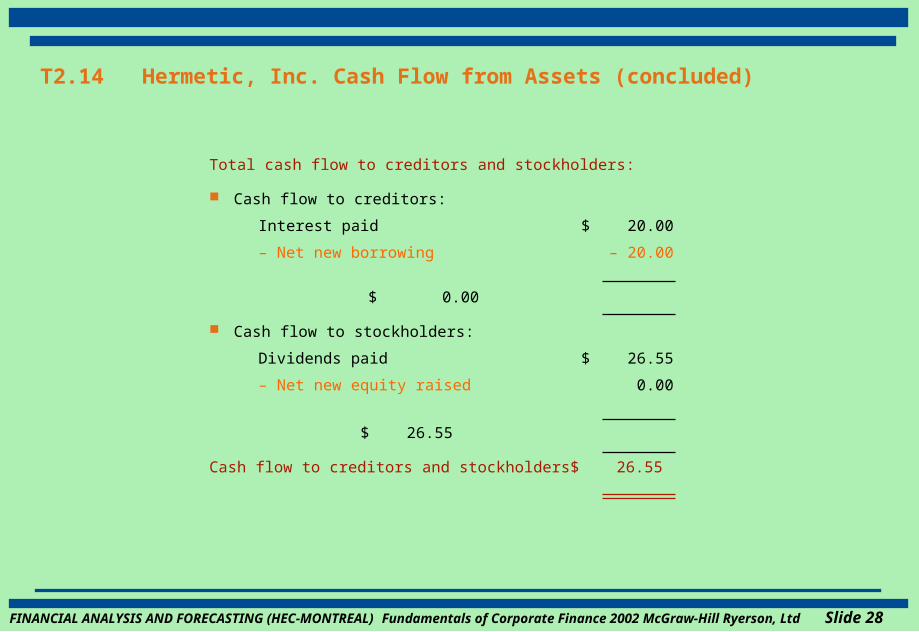
T2.14 Hermetic, Inc. Cash Flow from Assets (concluded)
Total cash flow to creditors and stockholders:
Cash flow to creditors:
Interest paid $ 20.00
– Net new borrowing – 20.00
$ 0.00
Cash flow to stockholders:
Dividends paid $ 26.55
– Net new equity raised 0.00
$ 26.55
Cash flow to creditors and stockholders $ 26.55

FINANCIAL ANALYSIS AND FORECASTING (HEC-MONTREAL) Fundamentals of Corporate Finance 2002 McGraw-Hill Ryerson, Ltd Slide 29
T2.16 Solution to Problem 2.12
The December 31, 1999 balance sheet Pearl Jelly, Inc. showed long-term debt of $2 million, and the December 31, 2000 balance sheet showed long-term debt of $2.9 million. The 2000 income statement showed interest expense of $700,000. What was cash flow to creditors during 1999?
Cash flow to creditors = Interest paid – Net new borrowing
Interest paid = $700,000
Net new borrowing = $_______ – 2 million = $_______
Cash flow to creditors = $700,000 – (_______)
= _______

FINANCIAL ANALYSIS AND FORECASTING (HEC-MONTREAL) Fundamentals of Corporate Finance 2002 McGraw-Hill Ryerson, Ltd Slide 30
T2.16 Solution to Problem 2.12
The December 31, 1999 balance sheet Pearl Jelly, Inc. showed long-term debt of $2 million, and the December 31, 2000 balance sheet showed long-term debt of $2.9 million. The 2000 income statement showed interest expense of $700,000. What was cash flow to creditors during 1999?
Cash flow to creditors = Interest paid – Net new borrowing
Interest paid = $700,000
Net new borrowing = $2.9 million – 2 million = $900K
Cash flow to creditors = $700,000 – 900,000
= –$200,000
FINANCIAL ANALYSIS AND FORECASTING (HEC-MONTREAL) Fundamentals of Corporate Finance 2002 McGraw-Hill Ryerson, Ltd Slide 31
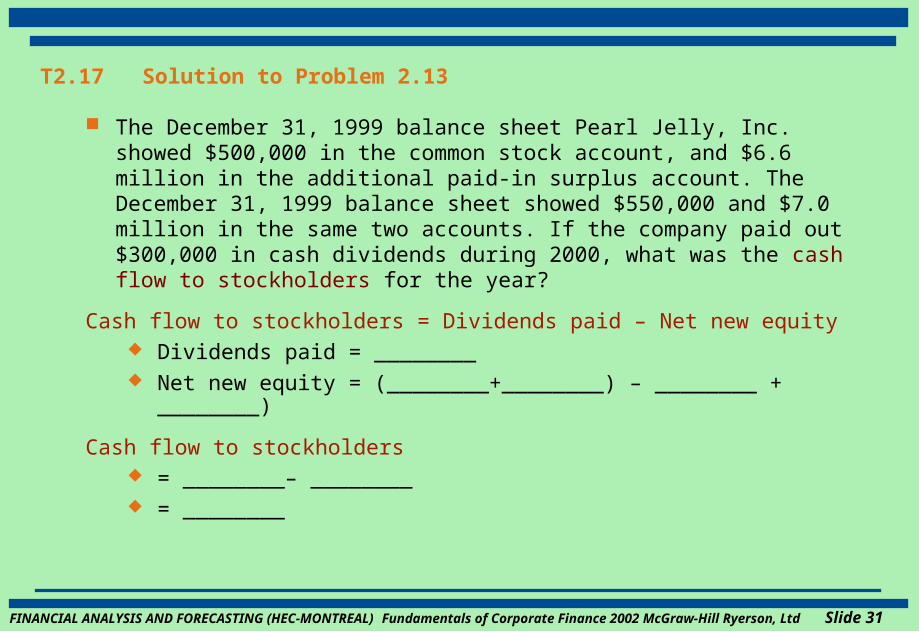
T2.17 Solution to Problem 2.13
The December 31, 1999 balance sheet Pearl Jelly, Inc. showed $500,000 in the common stock account, and $6.6 million in the additional paid-in surplus account. The December 31, 1999 balance sheet showed $550,000 and $7.0 million in the same two accounts. If the company paid out $300,000 in cash dividends during 2000, what was the cash flow to stockholders for the year?
Cash flow to stockholders = Dividends paid – Net new equity Dividends paid = ________ Net new equity = (________+________) – ________ + ________)
Cash flow to stockholders = ________– ________ = ________
FINANCIAL ANALYSIS AND FORECASTING (HEC-MONTREAL) Fundamentals of Corporate Finance 2002 McGraw-Hill Ryerson, Ltd Slide 32
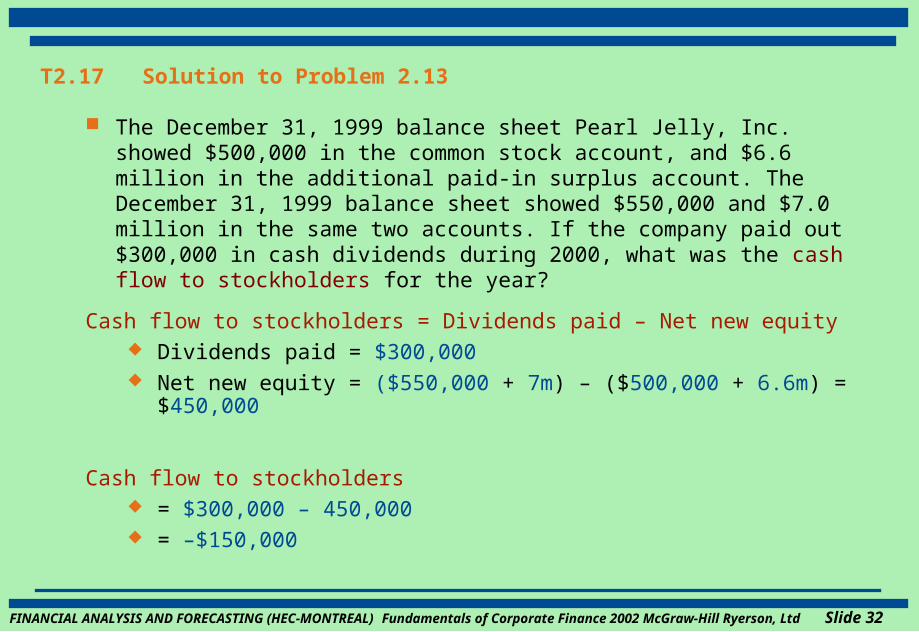
T2.17 Solution to Problem 2.13
The December 31, 1999 balance sheet Pearl Jelly, Inc. showed $500,000 in the common stock account, and $6.6 million in the additional paid-in surplus account. The December 31, 1999 balance sheet showed $550,000 and $7.0 million in the same two accounts. If the company paid out $300,000 in cash dividends during 2000, what was the cash flow to stockholders for the year?
Cash flow to stockholders = Dividends paid – Net new equity Dividends paid = $300,000 Net new equity = ($550,000 + 7m) – ($500,000 + 6.6m) = $450,000
Cash flow to stockholders = $300,000 – 450,000 = –$150,000

FINANCIAL ANALYSIS AND FORECASTING (HEC-MONTREAL) Fundamentals of Corporate Finance 2002 McGraw-Hill Ryerson, Ltd Slide 33
T2.18 Solution to Problem 2.14
Given the information for Pearl Jelly, Inc. in problems 12 and 13, suppose you also know that the firm’s net capital spending during 2000 was $500,000, and that the firm reduced its net working capital investment by $135,000. What was the firm’s 2000 operating cash flow, or OCF?
Cash flow from assets (CFA) =
Cash flow to creditors + Cash flow to stockholders
Cash flow to creditors = – $200,000
Cash flow to stockholders = –$150,000
So, Cash flow from assets = –$200K + (–)150,000K = –$350K.
And,
CFA = OCF - chg. in NWC – capital spending
Solving for OCF: OCF = CFA + chg. in NWC + capital spending OCF = _______ + _______+ _______ OCF = $ _______

FINANCIAL ANALYSIS AND FORECASTING (HEC-MONTREAL) Fundamentals of Corporate Finance 2002 McGraw-Hill Ryerson, Ltd Slide 34
T2.18 Solution to Problem 2.14
Given the information for Pearl Jelly, Inc. in problems 12 and 13, suppose you also know that the firm’s net capital spending during 2000 was $500,000, and that the firm reduced its net working capital investment by $135,000. What was the firm’s 2000 operating cash flow, or OCF?
Cash flow from assets (CFA) =
Cash flow to creditors + Cash flow to stockholders
Cash flow to creditors = – $200,000
Cash flow to stockholders = –$150,000
So, cash flow from assets = –$200K + (–)150,000K = –$350K.
And,
CFA = OCF – Chg. in NWC – Capital spending
Solving for OCF: OCF = CFA + Chg. in NWC + Capital spending OCF = –$350K + (– 135,000) + 500,000 OCF = $15,000


![T2.1 [Computer Component- Input Output Device]](https://img.dokumen.tips/doc/110x75/577cde301a28ab9e78ae937d/t21-computer-component-input-output-device.jpg)