Embed Size (px)
Citation preview

t-tests and F -tests in regression
Johan A. Elkink
University College Dublin
5 April 2012
Johan A. Elkink (UCD) t and F -tests 5 April 2012 1 / 25

Outline
1 Simple linear regression
Model
Variance and R2
2 Inference
t-test
F -test
3 Exercises
Johan A. Elkink (UCD) t and F -tests 5 April 2012 2 / 25

Simple linear regression
Outline
1 Simple linear regression
Model
Variance and R2
2 Inference
t-test
F -test
3 Exercises
Johan A. Elkink (UCD) t and F -tests 5 April 2012 3 / 25

Simple linear regression Model
Outline
1 Simple linear regression
Model
Variance and R2
2 Inference
t-test
F -test
3 Exercises
Johan A. Elkink (UCD) t and F -tests 5 April 2012 4 / 25

Simple linear regression Model
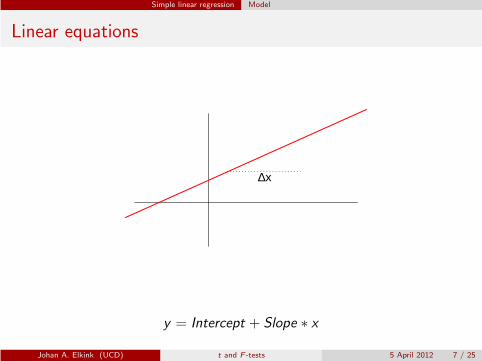
Linear equations
y = Intercept + Slope ∗ x
Johan A. Elkink (UCD) t and F -tests 5 April 2012 5 / 25

Simple linear regression Model
Linear equations
Intercept
y = Intercept + Slope ∗ x
Johan A. Elkink (UCD) t and F -tests 5 April 2012 6 / 25
Simple linear regression Model
Linear equations
∆x
y = Intercept + Slope ∗ x
Johan A. Elkink (UCD) t and F -tests 5 April 2012 7 / 25

Simple linear regression Model
Linear equations
Slope ∆x
∆x
y = Intercept + Slope ∗ x
Johan A. Elkink (UCD) t and F -tests 5 April 2012 8 / 25

Simple linear regression Model
Simple regression model
0 2 4 6
02
46
810
x
y
Johan A. Elkink (UCD) t and F -tests 5 April 2012 9 / 25

Simple linear regression Model
Simple regression model
0 2 4 6
02
46
810
x
y
y = Intercept + Slope ∗ x
Johan A. Elkink (UCD) t and F -tests 5 April 2012 10 / 25

Simple linear regression Model
Simple regression model
0 2 4 6
02
46
810
x
y
y = β0 + β1x
Johan A. Elkink (UCD) t and F -tests 5 April 2012 10 / 25

Simple linear regression Model
Simple regression model
0 2 4 6
02
46
810
x
y
yi = β0 + β1xi + εi
Johan A. Elkink (UCD) t and F -tests 5 April 2012 10 / 25

Simple linear regression Model
Notation
yi Value on the dependent variable for case i
xi Value on the independent variable for case i
x Mean value on the independent variable for case i
εi The error for case i : εi = yi − yiβk True coefficient for variable k
βk Estimated coefficient for variable k
yi Predicted value on the dependent variable for case i
Johan A. Elkink (UCD) t and F -tests 5 April 2012 11 / 25

Simple linear regression Model
Ordinary Least Squares
“Quickly put, the regression line is chosen to minimize the RSS; it hasslope β1, intercept β0, and goes through the point (x , y). Furthermore,the estimate for σ2 is σ2 = RSS/(n − 2)” (Verzani 2005: 280).
Johan A. Elkink (UCD) t and F -tests 5 April 2012 12 / 25

Simple linear regression Variance and R2
Outline
1 Simple linear regression
Model
Variance and R2
2 Inference
t-test
F -test
3 Exercises
Johan A. Elkink (UCD) t and F -tests 5 April 2012 13 / 25

Simple linear regression Variance and R2
Breakdown of variance
Total Sum of Squares (TSS):∑
N
i=1(yi − y)2
Explained Sum of Squares (ESS):∑
N
i=1(yi − y)2
Residual Sum of Squares (RSS):∑
N
i=1(yi − yi )2 =
∑N
i=1 ε2i
TSS = ESS + RSS
Johan A. Elkink (UCD) t and F -tests 5 April 2012 14 / 25

Simple linear regression Variance and R2
Breakdown of variance
Total Sum of Squares (TSS):∑
N
i=1(yi − y)2
Explained Sum of Squares (ESS):∑
N
i=1(yi − y)2
Residual Sum of Squares (RSS):∑
N
i=1(yi − yi )2 =
∑N
i=1 ε2i
TSS = ESS + RSS
Sometimes the second is called “regression sum of squares” (RSS) and the third
“errors sum of squares” (ESS), which might in fact be more accurate, since ε
really represents errors, not residuals, in this specification. Beware the confusion!
Johan A. Elkink (UCD) t and F -tests 5 April 2012 14 / 25

Simple linear regression Variance and R2
R2
How much of the variance did we explain?
Johan A. Elkink (UCD) t and F -tests 5 April 2012 15 / 25

Simple linear regression Variance and R2
R2
How much of the variance did we explain?
R2 = 1−RSS
TSS= 1−
∑N
i=1(yi − yi )2
∑N
i=1(yi − y)2=
∑N
i=1(yi − y)2∑
N
i=1(yi − y)2
Can be interpreted as the proportion of total variance explained by the
model.
For this interpretation, the model must include an intercept. Generally,one should not attach too much value to having a high R2 - it is usuallymore important to understand whether x affects y and by how much,rather than to understand how much of y has not yet been explained.
For simple linear regression (i.e. one independent variable), R2 is the sameas the correlation coefficient, Pearson’s r , squared.
Johan A. Elkink (UCD) t and F -tests 5 April 2012 15 / 25

Inference
Outline
1 Simple linear regression
Model
Variance and R2
2 Inference
t-test
F -test
3 Exercises
Johan A. Elkink (UCD) t and F -tests 5 April 2012 16 / 25

Inference t-test
Outline
1 Simple linear regression
Model
Variance and R2
2 Inference
t-test
F -test
3 Exercises
Johan A. Elkink (UCD) t and F -tests 5 April 2012 17 / 25

Inference t-test
Inference from regression
In linear regression, the sampling distribution of the coefficient estimatesform a normal distribution, which is approximated by a t distribution dueto approximating σ by s.
Johan A. Elkink (UCD) t and F -tests 5 April 2012 18 / 25

Inference t-test
Inference from regression
In linear regression, the sampling distribution of the coefficient estimatesform a normal distribution, which is approximated by a t distribution dueto approximating σ by s.
Thus we can calculate a confidence interval for each estimated coefficient.
Johan A. Elkink (UCD) t and F -tests 5 April 2012 18 / 25
Inference t-test
Inference from regression
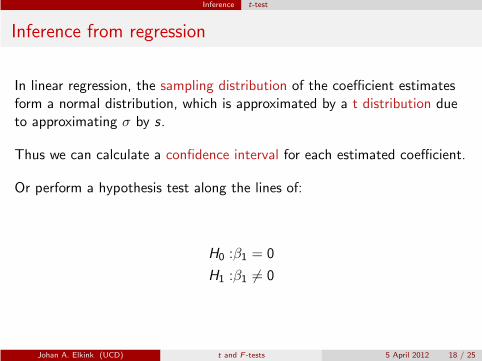
In linear regression, the sampling distribution of the coefficient estimatesform a normal distribution, which is approximated by a t distribution dueto approximating σ by s.
Thus we can calculate a confidence interval for each estimated coefficient.
Or perform a hypothesis test along the lines of:
H0 :β1 = 0
H1 :β1 6= 0
Johan A. Elkink (UCD) t and F -tests 5 April 2012 18 / 25
Inference t-test
Inference from regression
To calculate the confidence interval, we need to calculate the standarderror of the coefficient.
Johan A. Elkink (UCD) t and F -tests 5 April 2012 19 / 25

Inference t-test
Inference from regression
To calculate the confidence interval, we need to calculate the standarderror of the coefficient.
Rule of thumb to get the 95% confidence interval:
β − 2SE < β < β + 2SE
Johan A. Elkink (UCD) t and F -tests 5 April 2012 19 / 25

Inference t-test
Inference from regression
To calculate the confidence interval, we need to calculate the standarderror of the coefficient.
Rule of thumb to get the 95% confidence interval:
β − 2SE < β < β + 2SE
Thus if β is positive, we are 95% certain it is different from zero whenβ − 2SE > 0.
Johan A. Elkink (UCD) t and F -tests 5 April 2012 19 / 25

Inference t-test
Inference from regression
To calculate the confidence interval, we need to calculate the standarderror of the coefficient.
Rule of thumb to get the 95% confidence interval:
β − 2SE < β < β + 2SE
Thus if β is positive, we are 95% certain it is different from zero whenβ − 2SE > 0. (Or when the t value is greater than 2 or less than −2.)
Johan A. Elkink (UCD) t and F -tests 5 April 2012 19 / 25

Inference F -test
Outline
1 Simple linear regression
Model
Variance and R2
2 Inference
t-test
F -test
3 Exercises
Johan A. Elkink (UCD) t and F -tests 5 April 2012 20 / 25

Inference F -test
Breakdown of variance
Total Sum of Squares (TSS):∑
N
i=1(yi − y)2
Explained Sum of Squares (ESS):∑
N
i=1(yi − y)2
Residual Sum of Squares (RSS):∑
N
i=1(yi − yi )2 =
∑N
i=1 ε2i
TSS = ESS + RSS
Johan A. Elkink (UCD) t and F -tests 5 April 2012 21 / 25

Inference F -test
F-test
In simple linear regression, we can do an F-test:
H0 :β1 = 0
H1 :β1 6= 0
Johan A. Elkink (UCD) t and F -tests 5 April 2012 22 / 25

Inference F -test
F-test
In simple linear regression, we can do an F-test:
H0 :β1 = 0
H1 :β1 6= 0
F =ESS/1
RSS/(n − 2)=
ESS
σ2∼ F1,n−2
with 1 and n − 2 degrees of freedom.
Johan A. Elkink (UCD) t and F -tests 5 April 2012 22 / 25

Inference F -test
F-test
In simple linear regression, we can do an F-test:
H0 :β1 = 0
H1 :β1 6= 0
F =ESS/1
RSS/(n − 2)=
ESS
σ2∼ F1,n−2
with 1 and n − 2 degrees of freedom.
For multiple regression, this would generalize to:
F =ESS/(k − 1)
RSS/(n − k)∼ Fk−1,n−k
Johan A. Elkink (UCD) t and F -tests 5 April 2012 22 / 25

Exercises
Outline
1 Simple linear regression
Model
Variance and R2
2 Inference
t-test
F -test
3 Exercises
Johan A. Elkink (UCD) t and F -tests 5 April 2012 23 / 25

Exercises
Exercise
Open oecd 1960.sav.
Repeat for both industry (IND) and services (AGR):
1 Regress percentage in sector on income per capita.
2 Interpret the regression results.
3 Evaluate the model fit.
4 Interpret the t- and F -tests.
Johan A. Elkink (UCD) t and F -tests 5 April 2012 24 / 25

Exercises
Exercise
Open bes class data.sav and investigate:
whether left-right self-placement (lr) and explains trust in politics(trustpol)
whether left-right self-placement influences attitude towards EUmembership (eumember)
Johan A. Elkink (UCD) t and F -tests 5 April 2012 25 / 25