Embed Size (px)
Citation preview

pubs.acs.org/crystalPublished on Web 11/03/2009r 2009 American Chemical Society
DOI: 10.1021/cg9005423
2009, Vol. 95145–5154
Systematic Structural Determinants of the Effects of Tetraphosphonates
on Gypsum Crystallization
Emel Akyol,† Mualla €Oner,*,† Eleni Barouda,‡ and Konstantinos D. Demadis*,‡
†Department of Chemical Engineering, Yildiz Technical University, Davutpasa, Istanbul, 34210,Turkey, and ‡Crystal Engineering, Growth and Design Laboratory, Department of Chemistry,University of Crete, P.O. Box 2208, Voutes Campus, Heraklion, Crete, GR-71003, Greece
Received May 20, 2009; Revised Manuscript Received October 20, 2009
ABSTRACT: In this study, the effect of phosphonate additives on the crystallization of calcium sulfate dihydrate(CaSO4 3 2H2O, gypsum) has been investigated in aqueous solutions. Ethylenediamine-tetrakis(methylenephosphonic acid)(EDTMP), hexamethylenediamine-tetrakis(methylenephosphonic acid) (HDTMP), octamethylenediamine-tetrakis-(methylenephosphonic acid) (ODTMP), and dodecamethylenediamine-tetrakis(methylenephosphonic acid) (DDTMP) havebeen used as additives. It was found that they are very effective retardants for the crystallization of calcium sulfate dihydrate.The inhibition efficiency is directly proportional to the number ofmethylene groups in the organic chain that connects the amino-bis(methylenephosphonate) moieties. The degree of inhibition of crystallization was measured as an increase in induction timeand reduction in crystallization rate. Particle size and crystal morphology were determined with a particle-sizer and scanningelectron microscopy. According to experimental results, phosphonate additives tested in this study are very effective retardantsfor the formation of calcium sulfate dihydrate scale. The crystal structure of [Ca(EDTMP)(H2O)2] 3H2O is also reported. This is aone-dimensional coordination polymer in which EDTMP acts as both a bidentate chelate and a bridge for Ca2þ centers.
Introduction
The crystallization of CaSO4 3 2H2O (gypsum) has beenwidely studied due to its importance in many technologies,such as desalination,1 water treatment,2 geothermal and oil-field drilling,3 and phosphoric acid production.4 The forma-tion of tenaciously adhering calcium sulfate scale in a numberof processes from water desalination to heat exchangers andprocesses involving heating of water is a persistent problem.Scaling reduces heat transfer effectiveness over time, leadingto unacceptable heat transfer rates. Methods of preventingscale formation are therefore desirable.5-10
Several scale mitigation strategies have been proposed.11 Awidely used approach for controlling the scale deposition isthe addition of scale inhibitors to the feedwater. Scale inhibi-tors are “small” organic molecules or anionic polymers.2b,12
The retardation mechanisms of precipitation in the presenceof impurities are very complicated, but the most widelyaccepted view for the retardation of precipitation is thatimpurities adsorb on the growth sites of forming nuclei, thuspreventing their further growth.13 A number of additives havebeen found to be efficient inhibitors in preventing or reducingthe rate of precipitation of calcium sulfate from supersatu-rated solutions.14 Recently, there has been an increasinginterest in the application of phosphonates as crystallizationinhibitors, since these are highly efficient in preventing thenucleation and crystallization of many sparingly solubleinorganic salts.2,15 They can also augment in influencing theadherence of inorganic crystals onto critical system surfaces.16
From a practical point of view, the use of phosphonates incontrolling scale formation has certain advantages becauseof their excellent inhibitory efficiency, but also due to theirhigh stability even at relatively high temperature17 and harshconditions.18
This work focuses on the investigation of a family ofadditives containing four phosphonic acid groups and map-ping of their relative effectiveness in inhibiting the crystalgrowth of calcium sulfate dihydrate. These tetraphosphonatesshare a common structural feature, that each phosphonategroup is attached to an N atom via a methylene moiety(N-CH2-PO3H2). Therefore, each side of the phosphonateadditive has two methylenephosphonate groups connected toan N atom. Finally, the two N atoms are connected by anumber ofmethylene groups (2, 4, 6, 8, and 12), depending onthe additive. The structures of the tetraphosphonates areshown in Scheme 1.
Experimental Section
Crystal growth experiments were carried out in a water-jacketedPyrex glass of 1 L capacity at 30 ( 0.1 �C. Supersaturated solutionsfor crystal growth experimentswereprepared by slowmixingof equalvolumes (0.12 M) of calcium chloride dihydrate (CaCl2 3 2H2O,Merck) and sodium sulfate (Na2SO4, Sigma-Aldrich) solutions.The additives EDTMP,HDTMP,ODTMP, andDDTMPwere usedto retard the growth rate of gypsum. Scheme 1 shows their schematicchemical structures. These phosphonates were synthesized accordingto literature procedures.19
The freshly prepared additive solutions were added to the reactionmedium together with the sulfate solution. [Ca2þ], pH, and tempera-ture of the reaction solutions were monitored by personal computerduring crystallization. The experimental procedure has been reportedpreviously in detail.20,21 The effect of additives on the precipitationrate of calcium sulfate was evaluated by recording the decrease in[Ca2þ] as a function of time. The precipitation process, and theconcurrent decrease in calcium activity as a function of time, weremonitored and quantified by means of a Radiometer Impulsomat(PHM290) using the Ca-ISE electrode (Radiometer, ISE-K-CA).
The course of the some selected experiments was also followed byremoving homogeneous aliquots at various times and quickly filteredthroughMillipore filters of 0.22μmpore size. The aqueous phasewasanalyzed for calcium by atomic absorption spectroscopy (Perkin-Elmer AAnalyst 200).The measurement was consistent with thecomputer monitored activities.
*Corresponding authors. E-mail: (M.O.) [email protected]; (K.D.D.)[email protected].

5146 Crystal Growth & Design, Vol. 9, No. 12, 2009 Akyol et al.
CaSO4 crystal morphologies and sizes were investigated by usingSEM (JEOL-FEG-SEM) and particle sizer (Fritsch Standart F500).The effect of additives can be quantified as the ratio of the rate ofcrystallization of the pure solution (R0, mg/L min) to the rate ofcrystallization in the presence of additive (Ri, mg/L min) at the sameconcentration and temperature. The rates reported were the initialrapid growth rate calculated from slope of the calcium ion potential-time plots for each experiment. The time between the generation of asupersaturated state and the first observed change in calcium ionicactivity was defined as the induction period (tind). The time periodswere determined from at least three separate experiments and onlythe average values were reported. The reproducibility of this techni-que was ∼4-5%.
Synthesis of [Ca(EDTMP)(H2O)2] 3H2O (Ca-EDTMP). EDTMPacid (1.50 mmol, 0.71 g) was suspended in ∼40.0 mL of in-housedeionized water. Using a 1.0 M NH4OH stock solution, the pH wasadjusted to ∼4.0 and the solid was dissolved. To that clear andcolorless solution a quantity of the hydrated calcium chloride (1.50mmol, 0.40 g, molar ratio 1:1) was gradually added as a solid underconstant stirring. The pH dropped, but was readjusted with a 1.0 Mstock solution of NH4OH to ∼4.0. The homogeneous solution wasleft at quiescent conditions. After several days, single crystals ofCa-EDTMP appeared. Crystal growth was allowed to proceed for
2weeks. The productwas collected by filtration and air-dried. Typicalyields are ∼50%. Complete spectroscopic and thermal characteriza-tion of this material can be found in the Supporting Information.
Crystallography. X-ray diffraction data were collected on aSMART 1K CCD diffractometer at 298(2) K with Mo KR (λ =0.71073 A). Crystal and refinement data are presented in Table 1.Copies of crystallographic data for the structure may be obtainedfree of charge fromCCDC by quoting the reference number 605561for [Ca(EDTMP)(H2O)2] 3H2O.
Results and Discussion
The aim of this studywas quantification and comparison ofthe systematic effects of various additives containing phos-phonic acid groups on calcium sulfate crystallization. Fourtetraphosphonates have been investigated under identicalgrowth conditions. These tetraphosphonates contain two -N(CH2PO3H2)2 moieties, but the polymethylene linker thatconnects the N atoms has systematically variable length((-CH2)x-, x = 2, 6, 8, 12). The measurement of nucleationrate is not trivial. An acceptedmethod to evaluate the effect of
Scheme 1. Additives Used in This Work and Their Schematic Structures

Article Crystal Growth & Design, Vol. 9, No. 12, 2009 5147
additives on nucleation is to measure their abilities to affectthe induction time (tind). This is defined as the time betweenthe generation of a supersaturated state and the first observedchange in calcium concentration. The ability of additivesto act as inhibitors was evaluated by tind and R0/Ri ratios.Higher tind andR0/Ri values indicatemore effective inhibition.Table 2 summarizes the additives used in this study and theeffect of additives on crystallization.
As shown in Table 2, all additives lead to temporaryinhibition of calcium sulfate growth from its supersaturatedsolution. The induction period is much more sensitive tochanges in tetraphosphonates concentration. Although the
rate of crystallization is marginally affected at additive con-centrations of below 9.0� 10-7 mol/L, all tetraphosphonatesat a concentration of 9.0� 10-7 mol/L can completely inhibitcrystallization over an 8 h period, which indicated a dramaticeffect on induction time. Figure 1 indicates that an increase inadditive concentration results in a tind increase. This meansthat the duration of the induction period is increased byincreasing additive concentration. When we compare theeffect of additives on calcium sulfate dihydrate crystalliza-tion, the retardation ranking is DDTMP > ODTMP >HDTMP> EDTMP.
These results demonstrate that inhibition efficiency in-creases proportionally to the number of methylene groupslinking the twoNatoms (see Scheme1). It is also interesting tonote that the crystallization reaction following the initialinduction period takes place at a rate comparable to the rateof crystallization from pure solution for all additives. Thisphenomenon has been discussed byLiu andNancollas,17 whoattributed this stabilization action to an increase in the energyof the formation of the critical nuclei as a result of theendothermal adsorption of the additive on the surface ofthe nucleus. This model, which requires a high mobility ofthe adsorbed inhibitor ions along the crystal surface yields acomparatively low value for the surface coverage needed toaccomplish growth blockage. If the inhibitor ions are rapidlyadsorbed, the nuclei remain subcritical and disappear. Theinhibitor ions are then available for repeated adsorption at theedges of newly developing nuclei. This eventually leads tobreakdown and disintegration of a number of availableembryos before further growth can take place. In this way,outgrowth of the nuclei beyond their critical value is ham-pered; in due course, because of their thermodynamic in-stability, most nuclei would redissolve, thus freeing up theadditives. The changes in solution concentration during thisstagemay be too small to be detected. Therefore, the adsorbedadditives retard crystal growth temporarily, but they soondesorband the growth can resumeat a rate comparable to thatof the unpoisoned system.22 This sequence of additive adsorp-tion and desorption contributes to intermittent inhibition.This subject area undoubtedly needs more research.
Since the amounts of additive in solution are small, thegrowth inhibition is most likely caused by additive adsorptionof the active growth sites on crystal surfaces. However,calcium-phosphonate complex formation cannot be ruledout. Such metal-inhibitor complexes were found to promoteinhibition of barite (BaSO4).
15b,23
Table 1. Crystal Data and Structure Refinement for Ca[(EDTMP)-(H2O)2] 3H2O (Ca-EDTMP)
Ca[(EDTMP)(H2O)2] 3H2O
empirical formula C6H24CaN2O15P4
formula weight 528.24temperature (K) 298(2)wavelength (A) 0.71073crystal system monoclinicspace group C2/cunit cell dimensions
a (A) 13.206(3)b (A) 10.368(2)c (A) 13.763(3)R (deg) 90.00β (deg) 97.367 (18)γ (deg) 90.00
volume (A3) 1868.9 (7)Z 4density (calc) (g 3 cm
-3) 1.877absorption coefficient (mm-1) 0.758F(000) 1096crystal size (mm) 0.11 � 0.08 � 0.05θ range for data collection (deg) 2.51 to 28.06index ranges -16 e h e 16, -7 e k e 13,
-16 e l e 17reflections collected 5926independent reflections 2099 [R(int) = 0.0251]independent reflections [I > 2σ(I)] 1766 [R(int) = 0.0248]refinement method full-matrix least-squares on F2
data/restraints/parameters 2099/0/141goodness-of-fit on F2 1.077final R indices [I > 2σ(I)] R1 = 0.0362, wR2 = 0.1052R indices (all data) R1 = 0.0439, wR2 = 0.1094largest diff peak and hole (e 3 A
-3) 0.494 and -0.384
Table 2. The Effect of Additives on Calcium Sulfate Crystallization
polymer concentration � 107(M) tind (min) R0/Ri
control 47 1.0EDTMP 1.2 47 1.0
2.3 58 1.03.5 75 1.24.6 97 1.311.5 a a
HDTMP 1.0 66 1.22.0 97 1.13.0 145 1.14.0 191 1.210.0 a a
ODTMP 0.9 85 1.01.9 127 1.12.9 181 1.23.9 250 1.29.0 a a
DDTMP 0.9 100 1.01.7 145 1.02.6 225 1.13.5 410 1.38.7 a a
aNo crystallization.
Figure 1. Effect of additive concentration on calcium sulfate crys-tallization.
5148 Crystal Growth & Design, Vol. 9, No. 12, 2009 Akyol et al.
In Figure 2 plots of tind vs the number of methylene groups(-(CH2)x-, x = 2, 6, 8, 12) separating the N atoms (and byinference the phosphonatemoieties) are shown. It is clear thatthere is a linear dependence of tind on x.
The crystal growth rates, R, were determined as (mol/L 3min) from spontaneous experiments. The relative solutionsupersaturation with respect to gypsum, σ, is defined as
σ ¼ IP1=2 -Ksp1=2
Ksp1=2
¼ S1=2 -1 ð1Þ
in which IP is the ionic activity product andKsp represents thethermodynamic solubility product. They are summarized inTable 3. The ratio IP/Ksp represents the degree of super-saturation, S, and was computed by using MINEQLþ che-mical equilibrium modeling software,24 which is a free energyminimization program taking into account all equilibria inthe solution, mass balance, and electroneutrality conditions.The values of the thermodynamic solubility product (Ksp)and association constant of ions were obtained from theliterature.25-27The calculated growth rates and relative super-saturations are given in Table 4.
The rate of gypsumcrystallization canbe expressed in termsof semiempirical kinetics equation:
R ¼ kσn ð2Þwhere k is the rate constant for crystal growth, and n is theapparent order of the crystal growth.
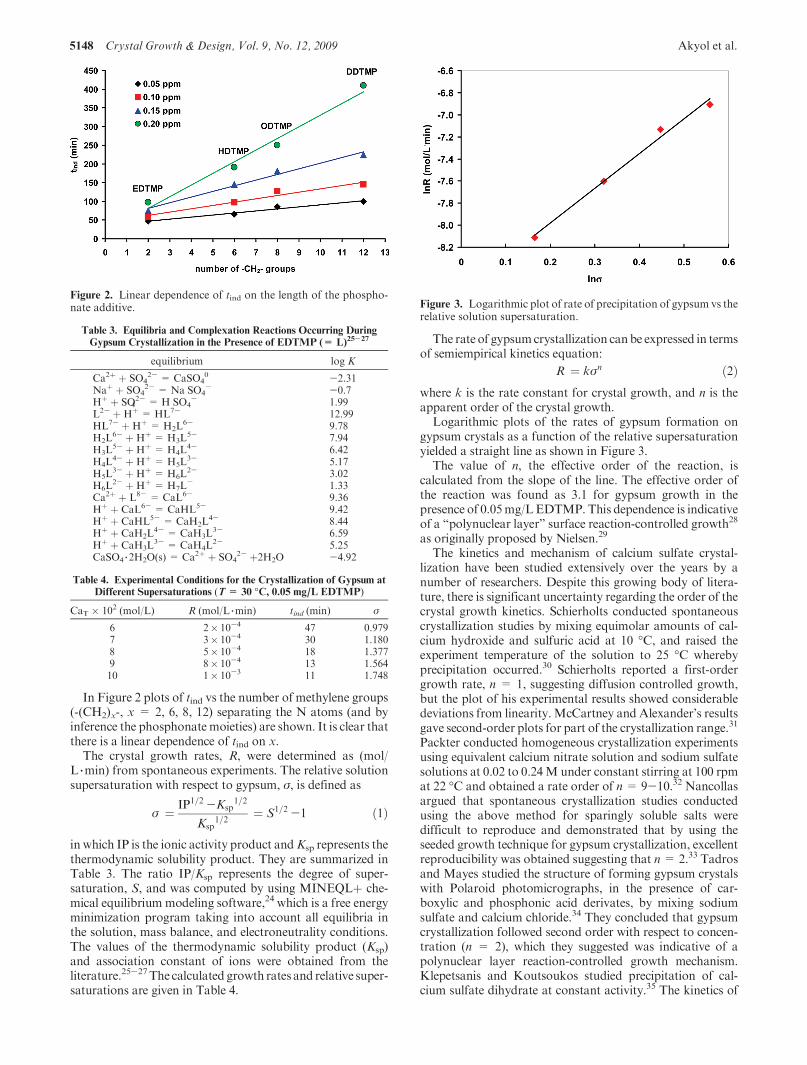
Logarithmic plots of the rates of gypsum formation ongypsum crystals as a function of the relative supersaturationyielded a straight line as shown in Figure 3.
The value of n, the effective order of the reaction, iscalculated from the slope of the line. The effective order ofthe reaction was found as 3.1 for gypsum growth in thepresence of 0.05mg/LEDTMP. This dependence is indicativeof a “polynuclear layer” surface reaction-controlled growth28
as originally proposed by Nielsen.29
The kinetics and mechanism of calcium sulfate crystal-lization have been studied extensively over the years by anumber of researchers. Despite this growing body of litera-ture, there is significant uncertainty regarding the order of thecrystal growth kinetics. Schierholts conducted spontaneouscrystallization studies by mixing equimolar amounts of cal-cium hydroxide and sulfuric acid at 10 �C, and raised theexperiment temperature of the solution to 25 �C wherebyprecipitation occurred.30 Schierholts reported a first-ordergrowth rate, n = 1, suggesting diffusion controlled growth,but the plot of his experimental results showed considerabledeviations from linearity.McCartney and Alexander’s resultsgave second-order plots for part of the crystallization range.31
Packter conducted homogeneous crystallization experimentsusing equivalent calcium nitrate solution and sodium sulfatesolutions at 0.02 to 0.24M under constant stirring at 100 rpmat 22 �C and obtained a rate order of n= 9-10.32 Nancollasargued that spontaneous crystallization studies conductedusing the above method for sparingly soluble salts weredifficult to reproduce and demonstrated that by using theseeded growth technique for gypsum crystallization, excellentreproducibility was obtained suggesting that n= 2.33 Tadrosand Mayes studied the structure of forming gypsum crystalswith Polaroid photomicrographs, in the presence of car-boxylic and phosphonic acid derivates, by mixing sodiumsulfate and calcium chloride.34 They concluded that gypsumcrystallization followed second order with respect to concen-tration (n = 2), which they suggested was indicative of apolynuclear layer reaction-controlled growth mechanism.Klepetsanis and Koutsoukos studied precipitation of cal-cium sulfate dihydrate at constant activity.35 The kinetics of
Figure 2. Linear dependence of tind on the length of the phospho-nate additive.
Table 3. Equilibria and Complexation Reactions Occurring During
Gypsum Crystallization in the Presence of EDTMP (= L)25-27
equilibrium log K
Ca2þ þ SO42- = CaSO4
0 -2.31Naþ þ SO4
2- = Na SO4- -0.7
Hþ þ SO42- = H SO4
- 1.99L2- þ Hþ = HL7- 12.99HL7- þ Hþ = H2L
6- 9.78H2L
6- þ Hþ = H3L5- 7.94
H3L5- þ Hþ = H4L
4- 6.42H4L
4- þ Hþ = H5L3- 5.17
H5L3- þ Hþ = H6L
2- 3.02H6L
2- þ Hþ = H7L- 1.33
Ca2þ þ L8- = CaL6- 9.36Hþ þ CaL6- = CaHL5- 9.42Hþ þ CaHL5- = CaH2L
4- 8.44Hþ þ CaH2L
4- = CaH3L3- 6.59
Hþ þ CaH3L3- = CaH4L
2- 5.25CaSO4 3 2H2O(s) = Ca2þ þ SO4
2- þ2H2O -4.92
Table 4. Experimental Conditions for the Crystallization of Gypsum at
Different Supersaturations (T = 30 �C, 0.05 mg/L EDTMP)
CaT � 102 (mol/L) R (mol/L 3min) tind (min) σ
6 2� 10-4 47 0.9797 3� 10-4 30 1.1808 5� 10-4 18 1.3779 8� 10-4 13 1.56410 1� 10-3 11 1.748
Figure 3. Logarithmic plot of rate of precipitation of gypsum vs therelative solution supersaturation.

Article Crystal Growth & Design, Vol. 9, No. 12, 2009 5149
precipitationwas found to be independent of pH, and order ofreaction of n=4 for the precipitation processwas found fromthe kinetics based on the initial rates. He et al. studied theseeded crystal growth rate of calcium sulfate dihydrate.36
They found that the growth followed a second-order para-bolic rate law. Attempts to model gypsum precipitation, asdiscussed above, showed that the reaction rate order seemedto be specific to the experimental system and experimentalconditions employed in the study.
Figure 4 shows the dependence of the induction period onthe supersaturation ratio for 0.05 mg/L EDTMP concentra-tion. It can be observed that the induction period for gypsumnucleation continuously decreases with an increase in super-saturation.
The dependence of the induction time on temperature andthe solution supersaturation, assuming steady state, is givenby eq 3,
log tind ¼ Aþ B
T3ðlog SÞ2 ð3Þ
where A and B are constants. B depends on the number ofvariables and is given by
B ¼ βγ3SVm2
ð2:303kÞ3v2 ð4Þ
where β is a shape factor (taken as 16π/3 here, assumingspherical shape for the nuclei forming), γs is the interfacialtension, Vm is the molecular volume, k is Boltzmann’s con-stant, and v is the number of ions in the calciumsulfate crystals(ν= 2). Plots according to eq 3 are shown in Figure 5.
The interfacial tension between the gypsum crystals and theaqueous solutions is a fundamental parameter for under-standing the rate of both nucleation and crystal growth.Relations between tind and 1/(logS)
2 with 0.05mg/LEDTMPgives a straight line (Figure 5). From the slope of this line, avalue of 45 mJ/m2 of the gypsum overgrowth was estimated.
The values of γs in the presence of EDTMPobtained in thiswork were compared with interfacial tension values forgypsum obtained by different research groups in Table 5.These results taken togetherwith those inTable 2 andFigure 2confirm that EDTMP is a good retardant for the calciumsulfate crystallization.
Effects of Additives on Calcium Sulfate Dihydrate Crystal
Morphology. In this work, phosphonate-based additiveswere tested for their ability to suppress growth of gypsumby using spontaneous crystallization experiments. The pre-sence of additives in supersaturated solutions affects not only
Table 5. Interfacial Tension Values for Calcium Sulfate Dihydrate in Aqueous Solutions Available in the Literature
additives concentration (mg/L) T (oC) γs (mJ/m2) ref
blank 30 23.2 Keller et al. (1978), ref 37amino-tris(methylenephosphonic acid), AMP 5 25 41.2 Prisciandaro et al. (2006), ref 25amino-tris(methylenephosphonic acid), AMP 10 25 46.5 Prisciandaro et al. (2006), ref 25amino-tris(methylenephosphonic acid), AMP 50 25 54.0 Prisciandaro et al. (2006), ref 25citric acid 10 25 37.0 Prisciandaro et al. (2003), ref 38citric acid 50 25 41.0 Prisciandaro et al. (2003), ref 38cetyltrimethylammonium bromide 100 80 8.7 Mahmoud et al. (2004), ref 39sodium dodecyl sulfate 100 80 6.7 Mahmoud et al. (2004), ref 39ethylenediamine-tetrakis (methylenephosphonic acid), EDTMP 0.05 30 45 this work
Table 6. Comparison of Gypsum Crystal Characteristics Based on SEM Results in the presence of EDTMP
EDTMP concentration
control 2.3 � 10-7 mol/L 3.5 � 10-7 mol/L 5.7 � 10-7 mol/L
SEM measurement needle plate needle plate needle plate needle plate
size (μm) Wa Lb W L W L W L W L W L W L W L2.4 33.0 9.3 33.6 2.4 26.2 6.7 29.9 2.3 15.8 6.6 25.8 2.3 13.9 5.8 18.8
SDc (0.7 (9.4 (4.8 (13.1 (0.7 (8.6 (2.7 (10.2 (0.7 (5.6 (2.5 (9.7 (0.5 (4.2 (2.2 (8.5
aW = width. bL = length. cSD = standard deviation. All dimensions are expressed in μm.
Figure 4. Dependence of the induction time on the supersaturationratio of gypsum in the presence of 0.05 mg/L EDTMP. The line isdrawn to aid the reader.
Figure 5. Relation between log tind and 1/(log supersaturationratio)2 with 0.05 mg/L EDTMP.

5150 Crystal Growth & Design, Vol. 9, No. 12, 2009 Akyol et al.
the kinetics of crystal growth but crystal size as well, asshown in Tables 6 and 7. SEM images were collected forsubsequent visual analysis in order to assess the effects ofadditives containing phosphonic acid on crystal morphology(shape and size). The characteristic morphology of gypsumprecipitated in the absence of additives is shown Figure 6a.Examination of the morphology of the precipitated gypsumcrystals by SEM showed the formation of the characteristicneedle-like and plate-like crystals. The crystal habit of theprecipitated calcium sulfate crystals was affected by presenceof additives, as may be seen in the scanning electron photo-graphs shown in Figure 6b-e. The presence of additivesresulted in less elongated needle and plate-like crystals. Thelength of the needle-like crystals is reduced to 13.9 μm in thepresence of 5.7 � 10-7 mol/L EDTMP as shown in Table 6.
Crystal sizes of gypsum were also measured by particlesizer. The results are summarized in Table 7. The arithmeticand geometric mean diameters of gypsum crystals are lowerwith all additives than in the absence additives. The lowermean diameter may indicate that the formed gypsum crystal
growth is lowered compared with the control. The particlesizer results clearly show that DDTMP is the most effectiveadditive because crystals have the smallest size in the pre-sence of DDTMP.
Physicochemical Characterization and Crystal Structure of
[Ca(EDTMP)(H2O)2] 3H2O. Further insight into the com-plexation mode of EDTMP with Ca2þ in the solid state canbe obtained by studying the Ca-EDTMP solids precipitatingfrom the reaction of Ca2þ and EDTMP and by examinationof the crystal structure of the Ca2þ-EDTMP material. Thecrystals of the Ca-EDTMP coordination polymer are rhom-bic in their morphology, Figure 7.
The XRD powder pattern of [Ca(EDTMP)(H2O)2] 3H2Osolids was measured and compared to the calculated patternfrom the crystal structure (vide infra); see Figure 8. The twopatterns match well which is proof that the bulk material isidentical to that of single crystals.
The crystal structure of theCa-EDTMPcompound revealsan extended, one-dimensional polymer with EDTMP2- actingas both chelating and bridging ligand, Figure 9.
Figure 6. SEMof formed gypsum crystals in the presence of (A) no additives, (B) 0.15 mg/L EDTMP, (C) 0.15 mg/LHDTMP, (D) 0.15 mg/LODTMP, and (E) 0.15 mg/L DDTMP.

Article Crystal Growth & Design, Vol. 9, No. 12, 2009 5151
There are some interesting features of the structure. The-PO3H
- group coordinates to Ca2þ through only one of itsthree oxygens. This is in contrast to several literature exam-ples that demonstrate the strong propensity of the -PO3H
-
group to bridge two or more metal centers. Two -PO3H-
groups, one from eachN, form an 11-membered chelate ringwith Ca2þ. The same function occurs on the other side of the-CH2CH2- linker that renders the whole tetraphosphonatea bridge between two Ca2þ centers. Thus, one can envisionthe 1D polymer as a ribbon in a “wave-like” motion com-posed of Ca-EDTMP-Ca dimers, see Figure 10. Bond dis-tances and angles are presented in Table 8.
The Ca2þ is located in a slightly distorted Oh environmentshaped by four equatorial phosphonate oxygens and twoaxialH2O’s trans to each other. The Ca-O(P) bond distances are2.3325(18) and 2.3507(17) A, whereas the Ca-Owater bonddistance is 2.392(2) A. The water of crystallization rests abovea plane formed by four phosphonate oxygens that pointtoward it. Two of them are protonated formingH-bondswithit. The specific bridging mode of EDTMP observed in thestructure of Ca-EDTMP causes the ligand to acquire astrained position. Thus, the H2O-Ca-OH2 axial vectors inthedimeric “unit” are not aligned, but formadihedral angle of
47.18�. Metric features within the EDTMP backbone arevirtually the same as those in free EDTMP or its ionic salts.40
Only a handful of structurally characterized metal-EDTMPcompounds have been reported.41 The coordination mode ofEDTMP is distinctly different in these materials.
Structural Features of Calcium-Phosphonate Binding and
Links to Gypsum Inhibition. Examination of the crystalstructure of gypsum reveals that Ca2þ is 8-coordinated bysix sulfate oxygens and two water molecules in a “cis”arrangement, Figure 11.
Therefore, it is reasonable to envision that the interac-tion of phosphonates with the gypsum surface takes place
Table 7. Gypsum Particle Size Distribution in the Presence of 0.15 mg/L
Tetraphosphonates
diameter (μm) blank EDTMP HDTMP ODTMP DDTMP
arithmetic mean (μm) 23.39 21.59 20.84 19.66 17.81
geometric mean (μm) 33.85 33.02 32.09 31.25 27.69
mean square deviation (μm) 13.6 13.6 13.7 13.7 12.1
Figure 7. SEM images of single crystals of [Ca(EDTMP)-(H2O)2] 3H2O.
Figure 8. Calculated and measured XRD powder patterns of[Ca(EDTMP)(H2O)2] 3H2O.
Figure 9. Structure of the Ca coordination environment. The equa-torial ligands (O2, O6A, O2B, O6AA) are phosphonate oxygens fromtwo different EDTMPs and the axial ones are two water molecules(O7, O7A).
Figure 10. Wave-like one-dimensional ribbons in the structure of[Ca(EDTMP)(H2O)2] 3H2O viewed along the a-axis. Waters ofcrystallization are shown as large red and green spheres. Colorcodes: Camagenta, P orange, O red, Cblack,Nblue.Hydrogens areomitted for clarity.
Table 8. Selected Bond Distances (A) and Angles (deg) for[Ca(EDTMP)(H2O)2] 3H2O
bonds angles
Ca(1)-O(6)#1 2.3325(18) O(6)#1-Ca(1)-O(6)#2 180.0Ca(1)-O(6)#2 2.3325(18) O(6)#1-Ca(1)-O(2) 92.04(6)Ca(1)-O(2) 2.3507(17) O(6)#2-Ca(1)-O(2) 87.96(6)Ca(1)-O(2)#3 2.3507(17) O(6)#1-Ca(1)-O(2)#3 87.96(6)Ca(1)-O(7)#3 2.392(2) O(6)#2-Ca(1)-O(2)#3 92.04(6)Ca(1)-O(7) 2.392(2) O(2)-Ca(1)-O(2)#3 180.0P(1)-O(2) 1.4967(18) O(6)#1-Ca(1)-O(7)#3 85.13(8)P(1)-O(3) 1.5084(18) O(6)#2-Ca(1)-O(7)#3 94.87(8)P(1)-O(1) 1.5704(19) O(2)-Ca(1)-O(7)#3 91.63(7)P(1)-C(2) 1.811(2) O(2)#3-Ca(1)-O(7)#3 88.37(7)P(2)-O(6) 1.4971(18) O(6)#1-Ca(1)-O(7) 94.87(8)P(2)-O(5) 1.5074(19) O(6)#2-Ca(1)-O(7) 85.13(8)P(2)-O(4) 1.5720(17) O(2)-Ca(1)-O(7) 88.37(7)
O(2)#3-Ca(1)-O(7) 91.63(7)O(7)#3-Ca(1)-O(7) 180.00(11)

5152 Crystal Growth & Design, Vol. 9, No. 12, 2009 Akyol et al.
through surface complexation by substitution of these watermolecules by phosphonate oxygens. In order to map suchcalcium-phosphonate interactions we have also examinedstructural features of calcium-phosphonate binding in anumber of calcium-tetraphosphonate structures, namely,Ca-EDTMP (this work), Ca-AMP2b (AMP = amino-tris(methylenephosphonate)), Ca-HDTMP,42 and Ca-ODTMP.43 A common structural feature in these struc-tures is that a chelating ring is formed by the twophosphonate moieties, part of the carbon chain (theamino-bis(methylene) moiety), and the Ca center; seeFigure 12. The Ca-EDTMP is a special one because an11-membered ring forms through Ca-phosphonate inter-actions from phosphonate groups belonging to two dif-ferent N atoms. In the other three structures, eight-membered rings are formed through Ca-phosphonateinteractions from phosphonate groups belonging tothe same N atom. This feature is common in all thesestructures. The O-Ca-O angle ranges from 86.57� to87.96�, not far from the H2O-Ca-H2O angle of 98.40�in gypsum.
On the basis of the above arguments and assuming thatthe only interaction between the tetraphosphonates andthe gypsum surface is through the amino-bis(methy-lenephosphonate) moiety of the additives, one would expectthat all tetraphosphonate additives (except EDTMP) shouldexhibit the same or similar inhibition characteristics. How-ever, this is not the case, as discussed in previous sec-tions. Therefore, additional interactions must be occurring.One can envision interactions of an amino-bis(methy-lenephosphonate) moiety with a calcium ion on the gypsum
surface, and, concurrently interaction of the second amino-bis(methylenephosphonate) group with a second, neighboringsurface calcium. In gypsum, there are three close Ca neighborsper Ca, one at 5.670 A and two others at 6.533 and 6.274 A, allon a plane parallel to the ac plane. The question is whether thephosphonate additives have sufficient length to span the appro-priate distance, so they interact with two neighboring surfacecalcium centers. By measuring the longest phosphonate-to-phosphonate O 3 3 3O distance for each additive (from each“end” of the molecule), the following results are obtained:EDTMP 5.206 A, HDTMP 8.546 A, ODTMP 9.724 A, andDDTMP 16.369 A. It appears that all additives (exceptEDTMP) possess sufficient length to span two neighbor-ing calcium ions; therefore, if this argument alone is usedto explain the inhibitory activity all additives should becomparable, if not the same. At this point one shouldinvoke possible interactions with surface calcium ionslocated further away. The distances of the secondCa neighbors are 10.502, 12.548, 13.066 A. It becomesapparent that only DDTMP is capable of spanning such along distance, and thus it is the only tetraphosphonatethat can participate in such long-range interactions. Itshould be noted that the polymethylene spacers betweenthe N atoms in the tetraphosphonate backbone allowsufficient flexibility, so “longer” phosphonates may po-tentially participate in short-range and long-range inter-actions with surface Ca ions.
One could envision a possible interaction between twophosphonate groups (belonging to the same N atom) withtwo neighboring calcium ions. The phosphonate-to-phospho-nate O 3 3 3O distances are 3.715 A for EDTMP, 3.927 A forHDTMP, 4.247 A forODTMP, and 4.219 A forDDTMP.Allare much shorter than the shortest Ca 3 3 3Ca distances; there-fore, this kind of interaction is not likely to occur.
A special note should be made about EDTMP-gypsuminteractions. On the basis of the binding mode found in thecrystal structure of [Ca(EDTMP)(H2O)2] 3H2O and the ana-lysis above, EDTMP can interact with the gypsum surfacevia two pathways: (a) two phosphonate groups (from twodifferent N atoms) interacting with the same surface Ca2þ
ion. This chelating mode of binding of EDTMP is thesame as that observed in the structure of [Ca-(EDTMP)(H2O)2] 3H2O. (b) Two phosphonate groups(from two different N atoms) interacting with different(neighboring) surface Ca2þ ions. EDTMP possesses suffi-cient length to achieve such interaction with immediate Ca2þ
neighboring ions, but not with these located further away, asdiscussed above. The above interactions are shown schema-tically in Figure 13.
Figure 11. View of the layered portion of the gypsum crystal downthe c-axis, showing the calcium-coordinated water molecules inblue. Color codes: calcium green, sulfur yellow, oxygen red, hydro-gen white.
Figure 12. Coordination modes of a bis-phosphonate moiety on calcium, showing the possible replacement of two neighboring watermolecules from Ca, in the structure of gypsum.

Article Crystal Growth & Design, Vol. 9, No. 12, 2009 5153
Conclusions
According to these experimental results, all phosphonateadditives evaluated in this study strongly affect crystal-lization rates and crystal sizes and show inhibitory activityfor gypsum crystallization. Phosphonate group additivesinhibited gypsum precipitation by adsorbing onto crystalsurfaces, thus blocking sites for new crystal growth. In theabsence of additive, needle- and plate-like particles wereobtained. The presence of additives inhibited the crystalgrowth of gypsum possibly through adsorption onto theactive growth sites for crystal growth sites for crystalgrowth due to their charge and hydrophilic effects. Theadditive concentration and the degree of supersaturationare found to be important parameters for the control ofgypsum crystallization. Possible pathways for growth in-hibition are based on the hypothesis that the phosphonateadditives interact with surface calcium ions via surfacecomplexation. It was proposed that this occurs by cal-cium-bound water replacement by the anionic phospho-nate oxygen groups.
Acknowledgment. Funding for this work was made possi-ble in the framework of a Bilateral Cooperation Programbetween Turkey and Greece. M.€O. thanks the Scientific andTechnological Research Council of Turkey (TUB_ITAK,Project No: 105M329) andK.D.D. thanks the General Secre-tariat of Science and Technology (Greece, under contract no.GSRT 2007-202e).
Supporting Information Available: Elemental, spectroscopic andthermogravimetric analyses results, additional structural views, andfull structural details for [Ca(EDTMP)(H2O)2] 3H2O. Copies ofcrystallographic data for the structuremay be obtained free of chargefrom CCDC by quoting the reference number 605561. This materialis available free of charge via the Internet at http://pubs.acs.org.
References
(1) (a) Uchymiak, M.; Lyster, E.; Glater, J.; Cohen, Y. J. Membr. Sci.2008, 314, 163–172. (b) Atamanenko, I.; Kryvoruchko, A.; Yurlova, L.;Tsapiuk, E. Desalination 2002, 147, 257–262. (c) Alimi, F.; Elfil, H.;Gadri, A. Desalination 2003, 157, 9–16. (d) Le Gouellec, Y. A.;Elimelech, M. J. Membr. Sci. 2002, 205, 279–291. (e) Shih, W.-Y.;Rahardianto, A.; Lee, R.-W.; Cohen,Y. J.Membr. Sci. 2005, 252, 253–263.
(2) (a) Seewoo, S.; Van Hille, R.; Lewis, A.Hydrometallurgy 2004, 75,135–146. (b) Demadis, K. D.; Katarachia, S. D. Phosphorus, SulfurSilicon 2004, 179, 627–648. (c) Papadaki, M.; Demadis, K. D.Comments Inorg. Chem. 2009, 30, 89–118.
(3) (a) Sweeney, F. M.; Cooper, S. D. Society of Petroleum EngineersInternational Symposium on Oilfield Chemistry, New Orleans,LA, March 2-5, 1993; paper SPE 25159. (b) Oddo, J. E.; Tomson,M. B. Corrosion/92; National Association of Corrosion Engineers,Houston, TX, 1992; Paper No. 34. (c) Xiao, J.; Kan, A. T.; Tomson,M. B. Am Chem. Soc.-Division of Fuel Chemistry, SymposiumPreprints 1998, 43, 246–249. (d) Browning, F. H.; Fogler, H. S.AIChEJournal 1996, 42, 2883–2896. (e) Vetter, O. J. J. Pet. Tech. 1973, 25,339–353. (f) Pairat, R.; Sumeath, C.; Browning, F. H.; Fogler, H. S.Langmuir 1997, 13, 1791–1798. (h) Browning, F. H.; Fogler, H. S.AIChE J. 1996, 42, 2883–2896.
(4) (a) El-Shal, H.; Rashad, M. M.; Abdel-Aal, E. A. Cryst. Res.Technol. 2002, 37, 1264–1273. (b) Rashad, M. M.; Baioumy, H. M.;Abdel-Aal, E. A. Cryst. Res. Technol. 2003, 38, 433–439.
Figure 13. Possible interactions of EDTMP (upper) andDDTMP (lower) with the gypsum surface. Phosphonate structures are schematic andnot drawn to scale.

5154 Crystal Growth & Design, Vol. 9, No. 12, 2009 Akyol et al.
(5) Tlili, M. M.; Rousseau, P.; Amor, M. B.; Gabrielli, C. Chem. Eng.Sci. 2008, 63, 559–566.
(6) Prisciandaro, M.; Lancia, A.; Musmarra, D. Ind. Eng. Chem. Res.2001, 40, 2335–2339.
(7) Hamdona, S. K.; AlHadad,O. A.Desalination 2008, 228, 277–286.(8) Lioliou, M. G.; Paraskeva, C. A.; Koutsoukos, P. G.; Payatakes,
A. C. J. Colloid Interface Sci. 2006, 303, 164–170.(9) Tadros,M. E.;Mayes, I. J. Colloid Interface Sci. 1979, 72, 245–254.(10) (a) Dogan, €O.; Akyol, E.; €Oner, M. Cryst. Res. Technol. 2004, 39,
1108–1114. (b) €Oner, M.; Do�gan, €O.; €Oner, G. J. Cryst. Growth 1998,186, 427–437.
(11) Mwaba, M. G.; Gu, J.; Golriz, M. R. J. Cryst. Growth 2007, 303,381–386.
(12) (a) Cowan, J. C.; Weintritt, D. J. Water-Formed Scale Deposits;Gulf Publishing Co.: Houston, TX, 1976. (b) Bott, T. R. Fouling ofHeat Exchangers; Elsevier Science: Amsterdam, 1995. (c) Demadis,K. D. in Compact Heat Exchangers and Enhancement Technologyfor the Process Industries; Shah, R. K., Ed.; Begell House Inc.:Redding, CT, 2003; pp 483-490. (d) Demadis, K. D.; Lykoudis, P.Bioinorg. Chem.Appl. 2005, 3, 135–149. (e) Demadis, K. D.; €Oner,M.In Green Chemistry Research Trends; Pearlman, J. T., Ed.; NovaScience Publishers: New York, 2009; Chapter 8, pp 265-287. (f)Demadis, K. D.; Pachis, K.; Ketsetzi, A.; Stathoulopoulou, A. Adv.Colloid Interf. Sci. 2009, 151, 33–48. (g) Demadis, K. D.; Neofotistou,E. Chem. Mater. 2007, 19, 581–587.(h) Demadis, K. D.; Stathoulopou-lou, A. Ind. Eng. Chem. Res. 2006, 45, 4436–4440.
(13) (a)Amjad,Z.Mineral Scale Formation and Inhibition; PlenumPress:New York, 1995. (b) Hulliger, J. Angew. Chem., Int. Ed. 1994, 33,143–162. (c) Didymus, J. M.; Oliver, P.; Mann, S.; DeVries, A. L.;Hauschka, P. V.;Westbroek, P. J.Chem.Soc. FaradayTrans. 1993, 89,2891–2900.
(14) (a)Gill, J. S.Desalination 1999, 124, 43–50. (b) Benton,W. J.; Collins,I. R.; Grimsey, I. M.; Parkinson, G. M.; Rodger, S. A. Faraday Discus.1993, 95, 281–297. (c) Bosbach, D.; Hochella, M. F., Jr. Chem. Geol.1996, 132, 227–236. (d) Weijnen, M. P. C.; Van Rosmalen, G. M.J. Cryst. Growth 1986, 79, 157–168.
(15) (a) Stamatakis, E.; Chatzichristos, C.; Sagen, J.; Stubos, A. K.;Palyvos, I.; Muller, J.; Stokkan, J.-A. Chem. Eng. Sci. 2006, 61,7057–7067. (b) Barouda, E.; Demadis, K. D.; Freeman, S. R.; Jones, F.;Ogden,M. I.Cryst. GrowthDes. 2007, 7, 321–327. (c) Demadis,K.D.;Neofotistou, E.; Mavredaki, E.; Tsiknakis, M.; Sarigiannidou, E.-M.;Katarachia, S. D. Desalination 2005, 179, 281–295. (d) Bishop, M.;Bott, S. G.; Barron, A. R. Chem. Mater. 2003, 15, 3074–3088.
(16) Abdel-Aal, N.; Sawada, K. J. Cryst. Growth 2003, 256, 188–200.(17) Liu, S. T.; Nancollas, G. H. J. Colloid Interface Sci. 1975, 52, 593–
601.(18) (a) Lesueur, C.; Pfeffer,M.; Fuerhacker,M.Chemosphere 2005, 59,
685–691. (b) Dyer, S. J.; Anderson, C. E.; Graham, G. M. J. Pet. Sci.Eng. 2004, 43, 259–270. (c) Demadis, K. D.; Ketsetzi, A. Sep. Sci.Technol. 2007, 42, 1639–1649. (d) Demadis, K. D.Phosphorus SulfurSilicon 2006, 181, 167–176.
(19) (a) Mikolajczyk, M.; Balczewski, P. Top. Curr. Chem. 2003, 223,162–214. (b) Princz, E.; Szil�agyi, I.; Mogyor�osi, K.; Lab�adi, I.J. Therm. Anal. Calorim. 2002, 69, 427–439. (c) Carter, R. P.; Carroll,R. L.; Irani, R. R. Inorg. Chem. 1967, 6, 939–942.
(20) K�ırbo�ga, S.; €Oner, M. Cryst. Growth Des. 2009, 9, 2159–2167.(21) Akyol, E.; Bozkurt, A.; €Oner, M. Polym. Adv. Technol. 2006, 17,
58–65.(22) Liu, S. T.; Nancollas, G. H.Colloid Interface Sci. 1973, 44, 422–429.(23) (a) Tomson,M.B.;Kan,A. T.; Fu,G.SPEJ. 2006, 11 (3), 283–293.
(b) Boak, L. S.; Graham, G. M.; Sorbie, K. S. Proceedings of the SPEInternational Symposium on Oilfield Chemistry; Houston, TX, USA,1999; pp 643-648. (c) Graham, G. M.; Boak, L. S.; Sorbie, K. S. SPEProduction & Facilities, February, 2003; pp 28-44. (d) Graham, G.M.; Boak, L. S.; Sorbie, K. S. Proceedings of the SPE InternationalSymposium on Oilfield Chemistry; Houston, TX, USA, 1997; pp611-626. (e) Sweeney, F. M.; Cooper, S. D. Proceedings of the SPEInternational Symposium on Oilfield Chemistry; New Orleans, LA,USA, 1993; pp 77-89.
(24) MINEQLþ Chemical Equilibrium Modeling System Ver. 4.0,Hallowell, ME, 1998.
(25) Prisciandaro, M.; Olivieri, E.; Lancia, A.; Musmarra, D. Ind. Eng.Chem. Res. 2006, 45, 2070–2076.
(26) Klepetsanis, P. G.; Koutsoukos, P. G. J. Cryst. Growth 1998, 193,156–163.
(27) Klepetsanis, P. G.; Dalas, E.; Koutsoukos, P. G. Langmuir 1999,15, 1534–1540.
(28) Klepetsanis, P. G.; Koutsoukos, P. G. J. Colloid Interface Sci.1991, 143, 299–308.
(29) Nielsen. A. E. Kinetics of Precipitation; Pergamon Press: Oxford,1964.
(30) Schierholtz, O. J. Can. J. Chem. 1958, 36, 1057–1063.(31) McCartney, E. R.; Alexander, A. E. J. Colloid Interface Sci. 1958,
13, 383–396.(32) Packter, A. J. Cryst. Growth 1974, 21, 191–194.(33) Nancollas, G. H. J. Cryst. Growth 1968, 3-4, 335–339.(34) Tadros,M. E.;Mayes, I. J. Colloid Interface Sci. 1979, 72, 245–254.(35) Klepetsanis, P. G.; Koutsoukos, P. G. J. Cryst. Growth 1989, 98,
480–486.(36) He, S.; Oddo, J. E.; Thomson, M. B. J. Colloid Interface Sci. 1994,
163, 372–378.(37) Keller, D. M.; Massey, R. E.; Hileman, O. E. Can. J. Chem. 1978,
56, 831–838.(38) Prisciandaro, M.; Lancia, A.; Musmarra, D. Ind. Eng. Chem. Res.
2003, 42, 6647–6652.(39) Mahmoud, M. H. H.; Rashad, M. M.; Ibrahim, I. A.; Abdel-Aal,
E. A. J. Colloid Interface Sci. 2004, 270, 99–105.(40) (a) Polyanchuk, G. V.; Shkol0nikova, L. M.; Rudomino, M. V.;
Dyatlova, N.M.;Makarevich, S. S. J. Struct. Chem. 1985, 26, 586–594. (b) Demadis, K. D.; Barouda, E.; Zhao, H.; Raptis, R. G.Polyhedron 2009, 28, 3361-3367.
(41) (a) Mondry, A.; Janicki, R. Dalton Trans. 2006, 4702–4710. (b)Janicki, R.; Mondry, A. Polyhedron 2008, 27, 1942–1946. (c) Wu, J.;Hou, H.; Han, H.; Fan, Y. Inorg. Chem. 2007, 46, 7960–7970. (d)Demadis, K. D.; Barouda, E.; Stavgianoudaki, N.; Zhao, H. Cryst.Growth Des. 2009, 9, 1250–1253.
(42) Colodrero, R.M. P.; Cabeza, A.; Olivera-Pastor, P.; Infantes-Molina,A.; Barouda, E.; Demadis, K. D.; Aranda, M. A. G. Chem.;Eur. J.2009, 15, 6612–6618.
(43) Cabeza, A.; Aranda, M. A. G., personal communication.