Embed Size (px)
Citation preview

THE DETERMINANTS OF SYSTEMATIC RISK
EXPOSURES OF AIRLINE INDUSTRY
LEE CHYN HWA
UNIVERSITI SAINS MALAYSIA
2011

ii
ACKNOWLEDGEMENT
This research could not be possible without the guidance, help, and encouragement of many
individuals. I am greatly indebted to my supervisor Dr. Hooy Chee Wooi for his stimulating
suggestions, encouragement and providing much-needed assistance in all time of research for
and writing of this thesis. Truly, from the bottom of my heart, it is really my honour to have
him as my supervisors. Besides, I would like to thank Mr. Bryan Tai Kui Guan for spending
his time and effort, providing valuable comments and sharp insights that really help me
improve this thesis. My sincere gratitude extends to the staff of IPS, Ms Thevambiga who
provided me with assistance in making sure that this thesis is complying to the standard and
policies of USM. Special thanks to my family, especially my wife, father and mother for their
patience, care, moral support, sacrifices, and encouragement to me in meeting the challenges
I faced throughout my study.

iii
TABLE OF CONTENTS
Page
Acknowledgements ii
Table of Contents iii
List of Tables vii
List of Figures viii
Abstrak ix
Abstract xi
Chapter 1 INTRODUCTION 1
1.0 Chapter Overview 1
1.1 Motivation 1
1.2 Problem Statement 3
1.3 Research Objectives 4
1.4 Research Question 5
1.5 Definition of Key Terms 5
1.6 Scope of the Study 6
1.6.1 Overview of the Airline Industry 6
1.6.2 The Airline Industry in North America, Europe and Asia 8
1.7 Significance of Study 11
1.8 Organization of the Remaining Chapters 11
Chapter 2 LITERATURE REVIEW 12
2.0 Chapter Overview 12
2.1 The Concept of Systematic Risk 12
2.2 Beta as a Measure of Systematic Risk 14
2.3 Determinants of Systematic Risk in General Industry 16

iv
2.3.1 Firm size 16
2.3.2 Liquidity 18
2.3.3 Profitability 20
2.3.4 Financial Leverage 21
2.3.5 Operating Leverage 24
2.3.6 Growth 26
2.4 Determinants of Systematic Risk in Airline Industry 28
2.4.1 Firm size 28
2.4.2 Liquidity 29
2.4.3 Profitability 30
2.4.4 Financial Leverage 30
2.4.5 Operating Leverage 31
2.4.6 Growth 31
2.5 Theoretical Framework 33
2.6 Hypothesis Development 34
2.6.1 Firm size 34
2.6.2 Liquidity 35
2.6.3 Profitability 37
2.6.4 Financial Leverage 39
2.6.5 Operating Leverage 40
2.6.6 Growth 42
CHAPTER 3 METHODOLOGY 43
3.0 Introduction 43
3.1 Research Design 43
3.1.1 Type of Study 43

v
3.1.2 Population 44
3.1.3 Sample Frame 44
3.1.4 Unit of Analysis 45
3.1.5 Sample Size & Sampling Method 45
3.2 Measurements of Dependent Variables 45
3.2.1 CAPM as Systematic Risk Measure 45
3.2.2 CAPM Limitations
49
3.2.3 Is CAPM Still Popular Today?
51
3.2.4 Beta Measured Using Alternative Risk Pricing Model 53
3.2.4.1 International Fama French 3-Factor Model 53
3.2.4.2 International 4-Factor Model 55
3.2.4.3 International 5-Factor Model 56
3.2.5 Selection of the Best Systematic Risk Measure 57
3.3 Measurement of Independent Variables 58
3.4 Data Analysis 61
3.4.1 The Panel Models for Examining the Determinants of Systematic Risk 61
3.4.2 Specification Tests on Panel Model 64
3.4.3 The Empirical Model for Determinant of Systematic Risk 65
CHAPTER 4 RESULTS 67
4.0 Chapter Overview 67
4.1 Systematic Risk Determinants for World Airline
67
4.1.1 Descriptive Statistics of Variables 67
4.1.2 Correlations among Variables of the Study 69
4.1.3 Regression Analysis 70
4.2 Systematic risk determinants for North America, European and Asia Airlines: A comparison
73

vi
4.2.1 Descriptive Statistics of Variables 73
4.2.2 Correlations among variables of the study 75
4.2.3 Regression Analysis 78
4.3 Summary of the Findings 80
CHAPTER 5 DISCUSSION AND CONCLUSION 83
5.0 Chapter Overview 83
5.1 Systematic Risk Determinants for World Airline 83
5.2 Systematic Risk Determinants for North America, European and Asia Airlines: A Comparison
84
5.3 Implications of The Study 89
5.4 Limitations and Suggestions for Future Research 94
5.5 Conclusion 97
REFERENCES 100
APPENDICES
Appendix A: List of Sampled Airline Companies 107

vii
LIST OF TABLES
Page
Table 1.1 Number of Fleet and Share of Fleet of Airlines across Region 10
Table 2.1 Name and Measure of the Explanatory Variables 60
Table 4.1 Descriptive Statistics of Variables 69
Table 4.2 Correlation Analysis for All Independent Variables and Dependent Variable
70
Table 4.3 Panel Regressions Explaining Systematic Risks in World Airline Companies
72
Table 4.4 Descriptive Statistics of Variables 75
Table 4.5 Correlation Analysis for All Independent Variables and Dependent Variable
78
Table 4.6 Panel Regressions Explaining Systematic Risks in US, European and Asia Airline Companies
81
Table 4.7 Summary of the Findings 82

viii
LIST OF FIGURE
Page
Figure 1.1 Number of Fleet across Region in Year 2010 & 2030 10
Figure 2.1 Theoretical Framework
33

ix
Penentuan Pendedahan Risiko Sistematik bagi Industri Penerbangan
Abstrak
Sejak kebelakangan ini, industri penerbangan telah terdedah kepada risiko sistematik yang
amat tinggi. Prestasi syarikat-syarikat penerbangan yang tersenarai di bursa saham boleh
dipengaruhi oleh risiko sistematik, menyebabkan kemeruapan harga saham yang tinggi, dan
mungkin membawa kepada sumber modal ekuiti yang tidak stabil. Syarikat-syarikat
penerbangan perlu bersaing untuk mendapatkan sumber modal ekuiti di pasaran, maka adalah
penting untuk syarikat-syarikat ini memahami faktor-faktor yang menyumbang kepada
pendedahan risiko sistematik yang berkaitan dengan ciri-ciri syarikat. Kajian ini bertujuan
untuk meneroka faktor-faktor yang menentukan pendedahan risiko sistematik syarikat
penerbangan dan membandingkan samada faktor-faktor ini adalah berbeza bagi syarikat-
syarikat penerbangan di Amerika Utara, Eropah dan Asia.
Penyelidikan kajian ini merangkumi sampel penuh yang mengandungi 54 syarikat
penerbangan berasal dari rantau Amerika Utara, Eropah, Asia, Amerika Selatan, Timur
Tengah, Afrika dan Oceania. Memandangkan kepentingan syarikat-syarikat penerbangan dari
rantau Amerika Utara, Eropah dan Asia dari segi ekonomi, kajian ini juga membandingkan
penentu risiko sistematik bagi syarikat-syarikat penerbangan di ketiga-tiga rantau tersebut. 11
syarikat penerbangan di Amerika Utara, 12 syarikat penerbangan Eropah dan 18 Asia
syarikat penerbangan diambil daripada sampel penuh dan dibahagikan kepada tiga
subsamples masing-masing terdiri daripada syarikat penerbangan yang berasal dari rantau
yang sama untuk membolehkan perbandingan penentu risiko sistematik. Data empirikal yang
digunakan dalam kajian ini termasuk maklumat dari penyata kewangan dan pasaran saham.
Untuk mendapatkan sampel yang konsisten, harga saham yang dipakai adalah dari Januari
1990 hingga Disember 2010. Satu model penentuan harga aset 5-faktor telah digunakan

x
untuk menganggar nilai beta sebagai pengukur risiko sistematik dan faktor-faktor yang
menentukan risiko sistematik ini dikaji dengan analisis regresi panel. Data panel yang
digunakan untuk model penentu adalah dari tahun 1993 hingga 2010.
Hasil kajian menunjukkan hubungan positif antara keuntungan, “leverage” kewangan
dan “leverage” operasi dengan risiko sistematik. Analisis regresi panel atas subsampel yang
mengandungi syarikat-syarikat penerbangan dari rantau Amerika Utara mendapati bahawa
“leverage” operasi berhubungan positif dengan pendedahan risiko sistematik. Bagi syarikat
penerbangan Eropah, keuntungan merupakan satu-satunya factor yang mempunyai hubungan
positif dan signifikan dengan risiko sistematik. Bagi syarikat-syarikat penerbangan Asia
“leverage” kewangan, “leverage” operasi, dan keuntungan adalah penting dan dikaitkan
secara positif dengan risiko sistematik.

xi
The Determinants of Systematic Risk Exposure of Airline Industry
Abstract
In recent years, the airline industry has become exposed to high systematic risk. The bottom
lines of listed airline companies can be vulnerable and influenced by external shocks, causing
high volatility in share price, and might lead to unstable source of equity capital. As firms
compete for sources of equity capital available at the markets, it is the interest of firms’
management to have better understanding on how factors related to firm characteristic affects
the systematic risk exposure of companies. This study aims to explore the potential factors
affecting airlines systematic risk exposure and compare systematic risk determinants for
airline companies across North America, Europe and Asia.
The analysis of this study consist of a full sample which includes 54 listed airline
companies from North America, Europe, Asia, South America, Middle East, Africa and
Oceania. In view of economic importance of airlines from North America, Europe and Asia,
this study also look into whether the systematic risk determinants for airline companies varies
across these three regions.11 North America airlines, 12 Europe airlines and 18 Asia airlines
are extracted from the full sample and subdivided into three subsamples each consists of
airlines origin from same regions to enable comparison of systematic risk determinants across
regions. The empirical data include information in both financial statements and stock
market. To make the sample consistent, the latest consistent sample of stock prices is from
January 1990 to December 2010. A 5-factor asset pricing model is used to estimate the
company beta which is the indicator for systematic risk, and the factors determining the
systematic risk is investigated using panel regression. The annul betas are generated using 3-
year rolling regression. So, the actual panel data used for the determinant model is 1993-
2010.

xii
The results reveal positive relationship between world airlines’ profitability, financial
leverage and operating leverage with systematic risk exposure. The panel regression analysis
of subsamples found that North America airlines systematic risk exposure is positively
related with operating leverage. As for European airlines, only profitability is positive and
significant related to systematic risk. For Asia airlines, financial leverage, operating leverage
and profitability are significant and positively associated with the systematic risk.
1
Chapter One
INTRODUCTION
1.0 Chapter Overview
This chapter introduces the research outline of the study. It begins with highlighting the
motivation of the study and the problem statement followed by research objectives and research
question. Definition of key terms of certain variables will also be included to assist in
understanding. This chapter also presents the scope of the study which is airline industry and a
subsection that give an overview of airline industry in North America, Europe and Asia. It ends
with the significance of the study and will give a brief overview of the remaining chapters in the
thesis.
1.1 Motivation
Within the last few decades the airline industry has become exposed to frequent high external
shocks. Among these shocks are: terrorist attacks of September 11th 2001, the outbreak of
diseases such as SARS and H1N1 infections, recession origin from bursting of dot-com bubbles,
Asia financial crisis and the recent subprime mortgage crisis, the earthquake and tsunami that hit
Japan in March 2011 and the unpredictable raise and fall in oil price. The bottom lines of listed
airline companies can be vulnerable and influenced by these external shocks, causing high
volatility in share price, and might lead to unstable source of equity capital. The horrible event of
2001 have causes the world airline industry to record net losses of USD 13 billion and it took six
years for the industry to turn around and recorded a total net profit of USD 14.7 billion (The
Economist, 2011).

2
In the USA alone, the succession of troubles described above have caused four US
network carriers namely Northwest, United US Airways, Delta Airlines and United Airlines to
file for Chapter 11 bankruptcy protection in the last decade. American Airlines is the only US
network carrier that so far never files for Chapter 11 bankruptcy but its share price has twice
plunge by more than 90% within the last ten years. The first free fall occurred during period
between 2001 and 2003 cause by terrorist attack and recession and the second episode happened
between 2007 and 2009 due to subprime mortgage crisis.
In finance, there are two form of uncertainty that cause variation in stock price. First,
there is the uncertainty that comes from condition in macro environment such as those external
shocks that buffeted airlines in the last couple of years. This kind of uncertainty which firms
have no control on it is called systematic risk. The second form of uncertainty is unsystematic
risk, which can be defined as a stock’s volatility caused by firm-specific events. A supply chain
disruption that affects a single company or only a few closely related companies represents a
source of firm-specific risk.
Unsystematic risk caused by firm specific events can be eliminated by holding a fully
diversified portfolio that consists of stocks that uncorrelated among each other. If an investor
holds such portfolio of uncorrelated stocks, volatility in stock price caused by firm specific
events such as the loss of key personal or major supply chain disruptions are likely to offset one
another. Therefore, unsystematic risk is not important in asset’s risk pricing. On the other hand,
the market-related systematic risk exposure is unavoidable as it is caused by market events and
cannot be diversified away even by holding a large portfolio of different stocks. Investors will
always concern how these market events will affect their stock returns. Thus, systematic risk
plays a center role in risk pricing.

3
Even though systematic risk is caused by external shocks that firm have no control,
however, managerial decisions on finance, operations and investments can change the degree of
systematic risk exposure (Lee and Jang, 2007). Managerial decisions affect financial
performances, which in turn affect exposure to systematic risk. During an economic recession
the airline can choose strategies that manage the extent to which economic slowdown has on its
operating profits even though the airline cannot prevent the economic downturn itself. For
example, plane leasing rather than ownership can shift toward a lower operating leverage.
Therefore, for airlines executives, understanding determinants of the firm's systematic risk would
enable them to formulate strategies and setting policies that can mitigate the risk exposure,
further enhance firm value, and maximizing the returns of firms and shareholders.
Despite the fact that systematic risk affect stock price and cost of equity capital, over the
years researchers have not paid much attentions to the airline industry’s systematic risk exposure.
In order for management to manage their company successfully, it is important to know how
managerial decisions such as those on finance, operation and investment affect the systematic
risk exposure of airline companies. Under the current challenging yet competitive business
environments, identifying the factors contribute to systematic risk exposure; especially those
related to firm characteristic is urgently needed.
1.2 Problem Statement
In today’s highly competitive business environment, more than ever, airlines’ managers need to
make strategic decisions that can create competitive advantage, steering their companies into
sustainable growth path and enhance the value of their respective firms. The strategic decisions
especially those on finance, operation and investment cannot be properly made without

4
considering the risk involved. Previous studies have found that managerial decision affect
financial performances, which in turn affect exposure to systematic risk. As virtually all firms
fighting for equity capital available at the markets, it is the interest of firms’ management to have
better understanding on how factors related to firm characteristic affects the systematic risk
exposure of companies.
Many studies have investigated how factors related to firm characteristic contribute to
systematic risk exposure of airline companies. In most studies, these factors are proxies by firm
specific variables related to managerial decision such as capital structure, leverage ratio and so
on. However, most of the research had been focuses on US airlines. Over the past few years,
important changes in both operations and capital markets for the US airline industry have
occurred. In the study conducted by Lee and Jang (2007), the average return on assets (ROA) for
the sampled US airline companies was -0.28 percent. In contrast, this study included more recent
data up to year 2010 reported a mean ROA ratio of -12.43 percent for North America airlines.
Beta determinants may change as operation and capital market conditions change (Levy &
Sarnat, 1984).
Futhermore, we only encounter two studies that look into systematic risk determinants of
Asia airlines - Hung and Liu (2005) whom examined the potential factors affecting Taiwan
airlines’ systematic risk and Hooy and Lee (2010) who carried out their study in the context of
East Asia airlines. Research that uses and compares data across North America, European and
Asia airlines are important as the natures of airline business in these regions are vastly different
(Damuri and Anas, 2004).
1.3 Research Objectives

5
This study attempts to accomplish two main objectives as follows:
1. To determine whether firm specific variables namely firm size, liquidity, profitability,
financial leverage, operating leverage and growth affects systematic risk of world airlines.
2. To compare systematic risk determinants for airline companies across three different regions.
1.4 Research Question
To achieve the above objectives, the study tries to answer the following research question:
1. What is the relationship between firm size and systematic risk?
2. What is the relationship between liquidity and systematic risk?
3. What is the relationship between profitability and systematic risk?
4. What is the relationship between financial leverage and systematic risk?
5. What is the relationship between operating leverage and systematic risk?
6. What is the relationship between airline companies’ growth and systematic risk?
7. Do systematic risk determinants differ across three different regions namely, North America,
Europe and Asia?
1.5 Definition of Key Terms
1. Systematic risk represents relative volatility to the market, or the risk of a stock relative to
the risk of the market portfolio. (Van Horne,2001).
2. Beta is the measurement for systematic risk and reflects the collective judgment of investors
on the extent to which macroeconomic conditions influence firms and depends on marketing
policy, production policy, and firm policies and decisions, all of which are affected by
corporate financial policy (Ben-Zion & Shalit,1975; Logue & Merville, 1972).

6
1.6 Scope of the Study
1.6.1 Overview of the Airline Industry
The scope of this study entails the airline industry. This study examines the firm-specific factors
affecting systematic risk exposure of publicly traded airline companies.
The airline industry brings customers to almost everywhere in the world, and has played
an important and fundamental role in creating a globalized and integrated world economy.
During the early development of airline industry, its growth was largely due to introduction of
new technologies such as those that enable the development of commercial aircraft in 1950s.
Major changes in growth factors took place only after the economic deregulation that started
with US airlines in 1978. Since then, management issues such as profitability, competitive
strategies and cost saving have taken the center stage in determining airline growth. The
deregulation of airline industry has brought enormous benefit to majority of air travelers. After
the deregulation, the demand for air travel grows significantly, at the same time average air fares
has declined rapidly. Today, the air travel fares for US domestic flight is less than half of 1978
levels (ATAA, 2008). Worldwide, the deregulation of airline industry has allowed many new
entrants leading to a fiercely competitive global airline market.
By 2008, there are more than 2000 airline companies around the world which offer
flights to over 3700 destinations worldwide (ATAG, 2008). Over the past 30 years, the industry
has attained averaged 5% annual growth rate whereby the demand for air travel is mainly driven
by economic growth. On global basis, some analysts estimate that world airlines are expected to
continue growing at 4–5% annual growth rate for the next 10-15 years; even after taking into
consideration relatively pessimistic assumptions regarding global economic growth. The

7
projected economic growth is expected to cause a doubling of air travel around the globe within
the next 15 years.
Yet this buoyant outlook may be hiding some of the gloomy pictures. In the past decades,
world airlines have been deeply affected by numerous systematic shocks. The terrorist attacks of
September 11th 2001 paralyzed the US airline industry and at the same time the SARS health
scare brought down demand in Asia. Then the rise in oil prices in 2008, recession in US cause by
subprime mortgage crisis and volcanic eruptions put further stress on world airlines. The effect
of this series of shocks is reflected in airlines’ financial performance. After the horrible event of
2011, world airlines plunge into net loss and it took six years before they finally recovered and
recorded a total profit of $14.7 billion in 2007. Then another shocks arrived. The price of jet fuel
surge to over $170 per barrel, more than doubling the previous level; and subsequently the
subprime mortgage crisis sent load factors down again.
Currently, the economic impact of global airline industry has been estimated to be $3.5
trillion a year, which is equivalent to about 7.5% of world gross domestic product (ATAG, 2008).
Besides the economic importance, there are many other industries such as hospitality and tourism
that are closely related to airline industry, making the volatility of airline profits and their
subsequent exposure to systematic risk a major concern. Therefore, it is vital to investigate the
determinants of the systematic risk in order for airline management minimizing their company
risk exposure.
Since the deregulation of US airlines in 1978, many new entrants scrambled into the
industry and competition within the industry become intensified. Fundamentally, the competitive
strategies and management practices of airline companies have deeply changed by the new level
of increased competition. Issues regarding productivity enhancement and cost saving became

8
major goals of not just US airlines but non-US airlines as well as the pressure for reduce
government involvement in airline business spread across the world. In the past, airlines hoped to
reduce cost by taking advantage of scale economies either through internal growth and/or
mergers. Airlines around the world has been expanding their networks and trying to forge
partnerships which gave birth to “global alliances” such as Star Alliance, Oneworld and
SkyTeam. These alliances allow airlines to corporate on a higher level on issues such as
marketing, branding and code sharing and to serve the consumers better. Ultimately, airlines
within these alliances will able to benefit from economies of scale through these partnerships.
1.6.2 The Airline Industry in North America, Europe and Asia
Data from Air Transport Association, ICAO show that since airline deregulation, North America
is leading the rest of the world in terms of air traffic, followed by Europe and Asia-Pacific.
However, The International Air Transport Association (IATA) has predicted that by 2014 Asia
will account for about 30% of the world's air traffic, leading to a projected boom in air travel. By
then, China, Hong Kong and Japan will become the top three markets for air travel in Asia. Even
through a deepening sovereign debt crisis in Europe will surely affect demand in Asia, many
believe that strong domestic demand will partly insulate its airlines. According to Boeing, in the
next 20 year, Asia’s economy is expected to grow at an average rate of 4.7 percent per year
significantly outpace the world’s average growth rate. By 2030, Asia’s contribution to the world
GDP is expected to reach 35 percent; additional 8 percent from current level. The rapid
expansion of Asia’s economy will create strong demand for air travel within Asia region and also
between Asia and other regions of the world.

9
In the midst of persistence debt crisis, it is easy to forget how vibrant European
economies once were. But in spite uncertainty, German’s exports remain strong and there are
many emerging high growth European countries that driving the region growth. Looking forward,
Europe’s overall GDP is expected to grow at an annual rate of 2 percent for the next twenty years.
More importantly, European Union’s is trying to liberalized transportation sector which will
benefited airline companies enormously.
Despite eastward shifting of economic power in the last decade, the outlook for North
American airline industry remains favorable. Airlines are expected to continue the consolidation
process, reducing capacity and improving their financial performance. The short haul demand
which refer to traveling within North America is expected to grow at an average rate of 2 percent
a year, but with the raise of South America and Asia economies, the long haul traffic is expected
to grow at the rate of 4.5 percent annually.
Using data published by Boeing in Current Market Outlook 2011-2030, we constructed
Figure 1.1 and Table 1.1 which shows number of fleet and share of fleet across 7 regions in the
world in great details. We believe that these data are good proxies for air traffic demand as
airlines will have to purchase and modernize their fleets to accommodate the ever increasing
demand for air travel. Figure 1.1 shows that in year 2010, North America airlines still have the
most number of fleet follow by European airlines and Asia airlines. However by year 2030, Asia
airlines will own the most number of airlines, with North America airlines tailing at third place
behind European airlines. In term of percentage share of fleet shown in table 1.1, Asia, North
America and Europe airlines together will own a total of 78.87% of world fleet in 2030.

10
Figure 1.1: Number of Fleet across Region in Year 2010 and 2030
Table 1.1
Number of Fleet and Share of Fleet of Airlines across Region
Region Number of Fleet Share of Fleet (%)
Year 2010 2030 2010 2030
Asia 3960 12480 20.40 31.57 North America 6610 9330 34.05 23.60 Europe 5520 9410 28.44 23.80 Oceania 450 1000 2.32 2.53 Middle East 1040 2710 5.36 6.86 Latin America 1150 3390 5.92 8.58 Africa 680 1210 3.50 3.06 Total 19410 39530 100.00 100.00
The data highlight that for the next twenty years, Asia, North America and Europe will
remain as three most important economic blocks in the world and airlines from these regions will
continue to play important role in supporting these region growth. Therefore, in this study, we
specifically focus on airlines in North America, Europe and Asia with the intention of
discovering their potentially different systematic risk determinants.
0
5000
10000
15000
20000
25000
30000
35000
40000N
um
ber
of
Fle
et
2010
2030

11
1.7 Significance of the Study
The significance of this study can be view from three perspectives. From investors perspective
this study contribute to risk return relationship. In an investment decision making process,
investors will have to consider risk return relationship. By establish relationship between firm
specific variables with systematic risk, investors can identify a particular level of systematic risk
exposure of airline companies from the publicly available information such as financial
statements.
From the firm perspectives, the management can set target for the level of systematic risk
exposure and tailor their financial, operating and marketing policies to achieve the target. As the
goal of a firm is to maximize its shareholders wealth, naturally firms’ management would target
maximum return under specific level of risk exposure. Therefore, a thorough understanding of
the impact of firm specific variables under management’s control on systematic risk is of great
importance as it allowed firms to set their policies to achieve lowest possible risk and highest
possible returns.
To airline finance decision makers better understanding about systematic risk enable
them to consider investors’ expectations by taking into consideration the impact of their
operation and financial policies on stock return.
1.8 Organization of the Remaining Chapters
The rest of this study is organized as followed: chapter 2 reports a review of the literature in this
topic; chapter 3 outlines the research model and the framework of the analysis involved as well
as the data employed and their sources. Chapter 4 presents the results and chapter 5 are
discussion on the findings. Concluding comments are in the final section.

12
Chapter Two
Literature Review
2.0 Chapter Overview
This chapter highlights important contributions from previous studies related to the topic of
systematic risk determinants. The chapter includes the concept of systematic risk, beta as a
measurement of systematic risk, theory and research related to systematic risk determinants in
general industry as well as in airline industry. It also covers hypothesis development and end
with research framework.
2.1 The Concept of Systematic Risk
In order to have a better understanding, it is useful to first define the concept of systematic risk.
Risk represents the “probability distribution of the consequences of each alternative” (March &
Simon, 1958, p. 137). In finance, risk is commonly refers to the unexpected variability of returns.
The variations in returns are higher whenever there is an increase in uncertainty. There are two
factors that cause variation in stock return. First, there is the uncertainty that comes from
condition in general economy such as changes in monetary and fiscal policies, business cycle, oil
price, and volatility in exchange rate. These macroeconomic factors cannot be predicted with
certainty and the stock returns of all companies are affected by these factors. This kind of risk
that arises from uncertainty in macroeconomy in called systematic risk. In addition, there is risk
that associated with specific company. A sudden departure of key personnel of a company
represents a source of firm-specific risk. These factors affect that particular company without
affecting other companies in economy. Such risk is call unsystematic risk.

13
Systematic risk plays a center role in modern financial theory especially in risk pricing.
According to modern portfolio theory, investors are expected to be compensated for bearing
systematic risk whereas unsystematic risk is unimportant and no compensation will be given to
investors for bearing unsystematic risk. In order to illustrate this matter further, let’s consider the
following example.
Consider a diversification strategy in which an investor could include additional stocks in
his portfolio without incurring significant cost,. For example, consider an investor invest half of
his portfolio fund in AirAsia’s stocks and another half in Singapore airline’s stocks. Because
firm specific factors that influence both companies are different, it is unlikely that any firm
specific factor can cause the stocks of both companies to move in either direction simultaneously.
Therefore, diversification effectively reduces volatility of the investor’s portfolio. When the
investor diversify into many more stocks, the exposure to firm specific factors will spread out
even thinner and portfolio volatility will continue to reduce. Eventually, however, even the
investor hold every company stock, he cannot avoid risk altogether as all stocks are affected by
common macroeconomic aggregates such as business cycle. When the business cycle moves into
recession, no one can avoid the exposure to downward risk regardless of the amount of stocks
that being held. Thus, portfolio risk reduces as the number of stocks in portfolio increases, but it
cannot be reduced to zero. The risk that remains is known as systematic risk. In contrast,
unsystematic risk can be eliminated through diversification strategy.
Since unsystematic risk can be reduced through diversification without incurring
additional cost, it is logical that investors should not be compensated for bearing it. Thus,
investors should only be compensated for the bearing systematic risk that cannot be diversified
away.
14
2.2 Beta as a Measure of Systematic Risk
As mentioned above, all stocks are affected by systematic risk. However, some stocks will be
more sensitive than others to macroeconomic shocks. During a slowdown in economy, airline
companies might be more responsive to the macroeconomic changes than healthcare companies.
Therefore, each firm must be assigned with a sensitivity coefficient to macroeconomic
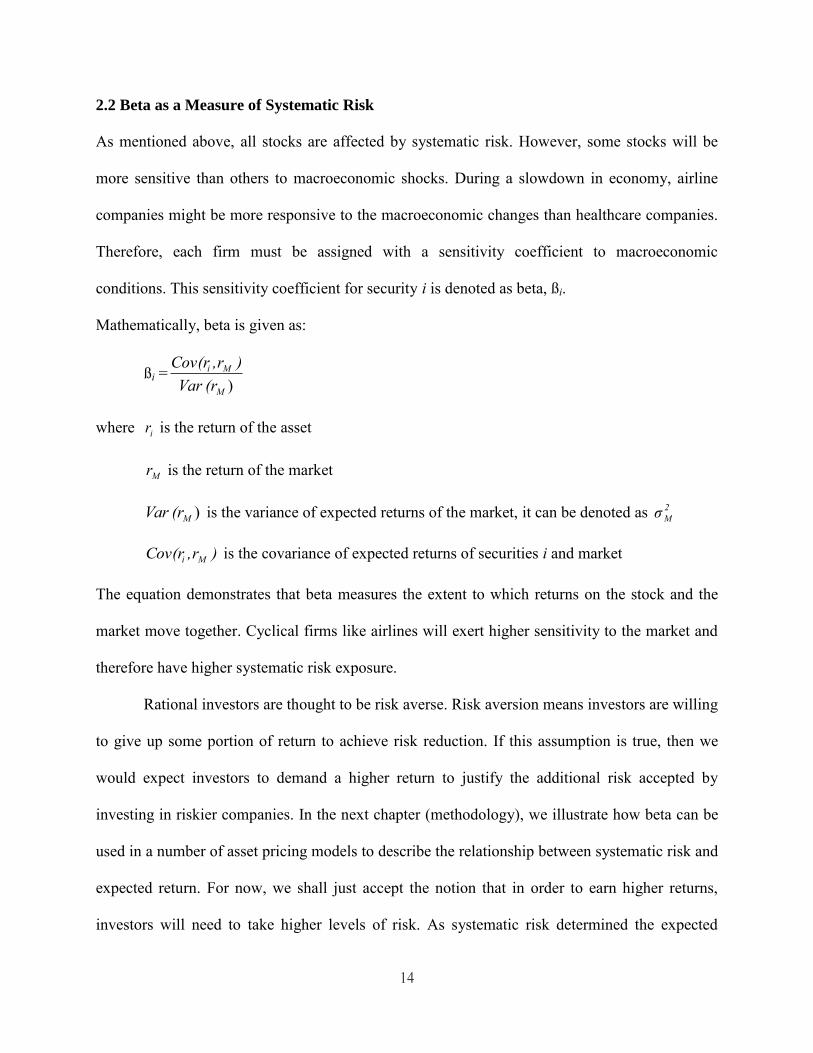
conditions. This sensitivity coefficient for security i is denoted as beta, ßi.
Mathematically, beta is given as:
ßi = )M
Mi
(r Var)r,Cov(r
where ir is the return of the asset
Mr is the return of the market
)M(r Var is the variance of expected returns of the market, it can be denoted as 2Mσ
)r,Cov(r Mi is the covariance of expected returns of securities i and market
The equation demonstrates that beta measures the extent to which returns on the stock and the
market move together. Cyclical firms like airlines will exert higher sensitivity to the market and
therefore have higher systematic risk exposure.
Rational investors are thought to be risk averse. Risk aversion means investors are willing
to give up some portion of return to achieve risk reduction. If this assumption is true, then we
would expect investors to demand a higher return to justify the additional risk accepted by
investing in riskier companies. In the next chapter (methodology), we illustrate how beta can be
used in a number of asset pricing models to describe the relationship between systematic risk and
expected return. For now, we shall just accept the notion that in order to earn higher returns,
investors will need to take higher levels of risk. As systematic risk determined the expected
15
return of stocks and thus its intrinsic value; it is critically important to study the determinants of
systematic risk exposure of companies.
Previous study of the determinants of systematic risk can be classified into either macro
or micro categories based on their orientation. In the macro category, many studies have look
into the relationship between systematic risk and macroeconomic variables such as real GDP
growth, inflation rate, money supply, interest rate and the federal deficit (Ben-Zion & Shalit,
1975). In the micro category, earlier work has focused on individual firms' systematic risk
exposure as related to their underlying characteristic and activities. This type of study begins
with the empirical work of Beaver et al (1970) which studied the relationship of several
accounting variables such as profitability ratio, dividend payout ratio, liquidity, leverage, growth
and asset size to the firm's systematic risk, and found significant relationship between them.
Since then, plenty of research had been carried out in this area. Based on the literature, the
potential list of determinants for beta includes firm size, liquidity, profitability, financial leverage,
operating leverage and growth.
In this study, we only look into these micro aggregates as potential list of systematic risk
determinants in airline industry. The reason is while it is those macro variables such as the real
GDP that initially gain the spot light as potential determinant of systematic risk exposure,
subsequent empirical studies does not show promising result (Robichek and Cohn, 1974). Ideally,
the relationships between the activities and characteristics of a firm and the systematic risk
exposure of its common stock should be investigated within the context of a fully developed
model. However, no such model exists, and existing asset pricing models such as CAPM do not
specify the firm-related determinants of risk. Therefore, to provide some logical basis for
specifying variables, this study first introduces a number of potential systematic risk
16
determinants together with theories that support their inclusion, and then evaluates and critiques
these theories during hypothesis development.
2.3 Determinants of Systematic Risk in General Industry
The section discusses the theory and the results of empirical studies related to systematic risk
determinants in non-airline industry.
2.3.1 Firm Size
The size of the firm is one of the determinants of systematic risk, where large firms tend to have
lower beta. There are several theoretical arguments which may be correlated with one another,
can be advanced in support of this assertion.
Marketability: According to Fisher (1959), firms' securities are marketable assets. In
particular, large firms’ securities are considered less risky as assets are highly liquid and can be
easily convert into cash. In essence, investors are concern with risk incurred by holding a firm
security; the risk associated with the difficulty of turning the security into cash particularly
during the period of high market volatility. If securities markets were "perfect", converting a
security into cash would be no problem. However, in reality, selling a security require someone
to purchase it. In certain time, the investor might end up suffering huge lost when he or she
might have to sell the security at a huge discount to its fair value. Thus marketability can
influence the risk perceived by investor.
Due to concern over marketability, it is an interest for investor to estimate the degree of
imperfection of the market for a particular security. There are several possible ways to estimate

17
the degree of imperfection. The trading volume of a particular security and its bid-ask price
spread are variables sometimes suggested as measures of marketability.
Probability of Bankruptcy: firms do not grow large overnight; rather they take a period of
time to grow into their existing size. Since non-performing firms tends to fail in the first few
years of their operation, it is logical to assume that firm’s size composes a measure of its past
performance. Thus, firm’s size may be serve as an indicator of its future performance and, hence,
firm’s risk. This hypothesis is well supported by various empirical studies. In one of the studies,
Queen and Roll (1987) found that firm size provide a good prediction of firm failure. Over a
decade, smallest firms have about fifty percent chance of failing, whereas largest firms have a
about twenty per cent motility rate over two decades.
Diversification: In order to earn above average return in competitive environment, large
firms which have the resources and capabilities tend to diversify into different business sectors.
As large firms tend to have better access into financial market and able to raise capital at a lower
cost compare to small firm (Titman and Wessels, 1988), it allow them to be well diversify. Firms
can reduce risk by simply invest in combinations of businesses which are fairly uncorrelated
(correlation coefficient -1≤ ρ ≤ 1). Unless the managements choose to diversify into businesses
which are perfectly correlated, large firms would tend to have lower variability in returns when
compared with firms with smaller size. According to portfolio theory, less variation on firms’
returns does not mean lower risk. Covariance of firms’ returns with market returns also has to be
lower in order to achieve risk reduction. However, from individual investor point of view, so
long as firms can diversify their businesses with higher efficiency than individual investor can
achieve with his own stock portfolio; large firms can be perceived as less risky.

18
Economies of Scale: Large firms may also choose to pursue economies of scale as
strategy to earn above average returns. Economies of scale would enable firms to incur lower
unit costs. So long as product price remain the same, firms would able to earn higher profit
margin. The above average return can be consider as a buffer against losses, reducing the
probability of bankruptcy risk (Ben-Zion and Shalit, 1975).
Large firms may also tend to have low systematic risk due to their better ability to
mitigate the impact of social-economic and political changes (Sullivan, 1978). The negative
correlation between firm size and systematic risk has been confirmed in a number of empirical
studies, including those by Logue and Merville (1972), Breen and Lerner (1973), Lev and
Kunitzky (1974), Pate1 and Olsen (1984), Ang et al. (1985), Gu and Kim (1998), Kim et al.
(2002) and Kim et al. (2010).
2.3.2 Liquidity
Competing theories exist regarding the relationship between liquidity and systematic risk. Jensen
(1984) supports a positive correlation between a firm's liquidity and systematic risk. According
to Jensen (1984) high liquidity may increase a firm's agency cost of free cash flow and therefore
leads to higher systematic risk. The agency cost of free cash flow is part of modern day
management conundrum. In majority of companies, investors do not involve in managing the
companies’ daily operation. Rather, the role of managing company is being carried out by
professional managers. This separation of ownership and control has resulted in a potential
conflict of interest which is termed agency problem. (Berle and Means, 1932 as cited in
Abdullah, 2004). Overall, agency theory predicts that the separation of owners and managers

19
potentially will lead to managers of firms taking actions, which might not align with the goal of
maximizing shareholders’ wealth (Jensen & Meckling, 1976).
Moreover, high liquidity may imply that available resources are invested in marketable
securities and are not invested in operating assets that generate high earnings, which could lead
to increase risk (Borde 1998). High liquidity levels too can lead to more aggressive investment
and therefore to higher risk (Borde et al., 1994). In both study, the ratio of cash and short-term
securities investments to total assets (quick ratio) was employed as liquidity indicator. The
researches argued that misallocation of resources may arise due to imperfection in managements’
compensation plan. In most companies, managers are compensated based on the size of the firm
they manage. Indirectly it encourages managers of firms with high liquidity to engage in
activities expansion. In the process, capital might be misallocated into area where the firm has
little expertise and capability, thus, increases exposure to systematic risk.
In contrast, Logue and Merville (1972) and Moyer and Chartfield (1983), postulating a
negative relationship between liquidity and systematic risk. The researches claimed that high
liquidity is an indication of low level of short-term liabilities and helps lower systematic risk. In
another words, the higher the ratio of liquid assets to total assets, the easier the firm can meet
short term cash need and therefore lower risk. The argument seems logical as liquid assets are
defined as cash or cash equivalent which can be easily converted into cash, and therefore can be
used to meet short term financing needs lowering the risk of insolvency.
An early investigation of the relationship between current ratio and beta by Beaver,
Kettler, and Scholes (1970) found a negative relationship between the two. Similar finding was
reported by Mear and Firth (1988) and Moyer and Chartfield (1983). However, empirical studies

20
by Borde (1998), Rosenberg and McKibben (1973) and Pettit and Westerfield (1972) found
positive correlation between liquidity ratios and systematic risk.
2.3.3 Profitability
Theoretically, the impact of profitability on systematic risk may be contradicting depending on
corporate strategic decision. Borde (1998) postulated that if high profitability (using ROA as
measurement) is due to superior operating performance, a negative correlated relationship may
exist between profitability and systematic risk. That is, those airlines with high profitability due
to excellent management and operating efficiency will have small probability of losses or
bankruptcies thus, lower risk. Borde (1998) assertion is in support of Logue and Merville, (1972)
hypothesis where high profitability lowers the probability of business failure, thus lowering a
firm's systematic risk. Scherrer and Mathison (1996) too argued that the stability of the cash flow
from operating real estate, which reduces the systematic risk, is determined by the ability to
manage the property profitably. On the other hand, Borde (1998) also postulated that firms that
enjoy high operating profit over long period of time and may implement excessive growth
strategies and thus exposed to high systematic risk.
Early empirical studies showed inconclusive results. Borde's (1998) reported a negative
relationship between return on assets and systematic risk. Logue and Merville (1972) too showed
that beta is not only negatively correlated with return on assets but also with another profitability
ratio i.e. profit margin. Mear and Firth (1988) and Melicher (1974) regression analysis, however,
found beta positively related to profitability.
It is interesting to note that, relationship between profitability and systematic risk may not
be consistent over different type of businesses. Borde et al. (1994) found that market returns for

21
life insurance companies are positively correlated with systematic risk, supporting the
hypothesized positive risk-return relationship. But, market returns for property-liability-
insurance companies are found to be negatively correlated with systematic risk.
2.3.4 Financial Leverage
Modigliani and Miller (1958) suggested that as the amount of debt in the firm's capital structure
increases, risk also increases. Building on MM proposition, Hamada (1972) proposed that it is
necessary to make adjustment to firms’ beta for those firms that are financially leveraged. His
formula is:
Where = the levered firm's common stock beta,
* = the unlevered firm's common stock beta
S = the total market values of the firm’s common stock after debt financing.
= the total market values of the firm’s common stock before debt financing.
After testing his model empirically, Hamada concluded that if the Miller and Modigliani
propositions on corporate tax leverage are correct, then approximately 21 to 24% of common
stocks systematic risk can be explained merely by the additional financial risk taken on by the
underlying firm which uses debt and preferred stock. Therefore, corporate financial leverage
does count considerably for the increases in systematic risk.
However, because the total market values of the firm’s common stock before debt
financing is not directly observable for a levered company, Rubinstein (1973) make several
assumptions and developed Hamada model to become:
22
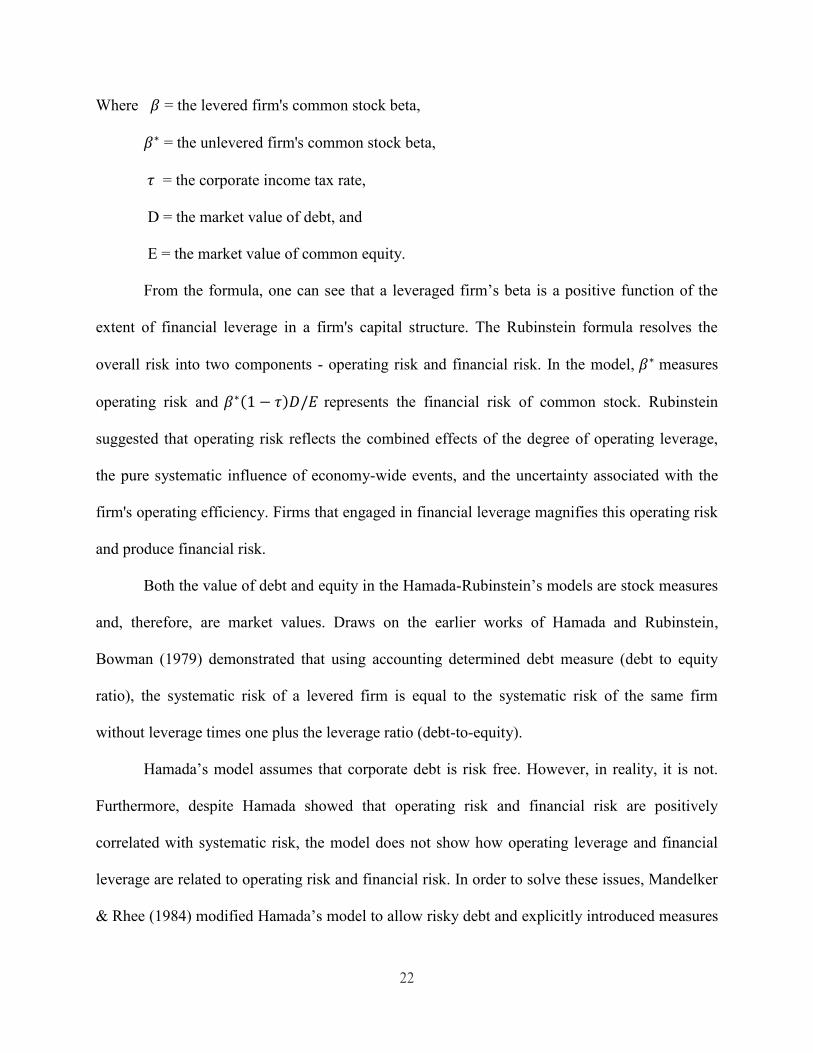
Where = the levered firm's common stock beta,
= the unlevered firm's common stock beta,
= the corporate income tax rate,
D = the market value of debt, and
E = the market value of common equity.
From the formula, one can see that a leveraged firm’s beta is a positive function of the
extent of financial leverage in a firm's capital structure. The Rubinstein formula resolves the
overall risk into two components - operating risk and financial risk. In the model, measures
operating risk and represents the financial risk of common stock. Rubinstein
suggested that operating risk reflects the combined effects of the degree of operating leverage,
the pure systematic influence of economy-wide events, and the uncertainty associated with the
firm's operating efficiency. Firms that engaged in financial leverage magnifies this operating risk
and produce financial risk.
Both the value of debt and equity in the Hamada-Rubinstein’s models are stock measures
and, therefore, are market values. Draws on the earlier works of Hamada and Rubinstein,
Bowman (1979) demonstrated that using accounting determined debt measure (debt to equity
ratio), the systematic risk of a levered firm is equal to the systematic risk of the same firm
without leverage times one plus the leverage ratio (debt-to-equity).
Hamada’s model assumes that corporate debt is risk free. However, in reality, it is not.
Furthermore, despite Hamada showed that operating risk and financial risk are positively
correlated with systematic risk, the model does not show how operating leverage and financial
leverage are related to operating risk and financial risk. In order to solve these issues, Mandelker
& Rhee (1984) modified Hamada’s model to allow risky debt and explicitly introduced measures

23
of the degree of operating and financial risk into their theoretical model. Empirically tested,
Mandelker & Rhee’s model showed further support for Hamada’s model. The results
consistently showed positive regression coefficients for both degree of operating leverage (DOL)
and degree of financial leverage (DFL), suggesting that both are positively correlated with the
systematic risk of common stock. A major contribution of the Mandelker and Rhee (1984) model
compared to Hamada (1972) and Rubinstein (1973) models is that it uses leverage values based
on accounting flow numbers rather than market stock numbers.
Without developing theoretical model, Ben-Zion and Shalit (1975) too argued in favor of
positive relationship between financial leverage and systematic risk. According to the researches,
financial leverage is an important determinant of a firm equity risk as creditor and preferred
stock holder has priority over common stock holder on firm’s asset in the event of firm
liquidation. The higher the debt leverage in the firm's capital structure, the higher is the risk of
bankruptcy, and the lower is the valuation of its stock price.
According to Van Horne (2001), the use of financial leverage may create incremental
value to the shareholders as the interest payments are tax deductible. Therefore, firms may
attempt to maintain an optimal capital structure which minimizes its weighted average cost of
capital at the same time maximizes the value of the shareholders. However, debt financing not
necessarily always benefits the shareholders. Company’s value may fall with the increased
financing due to increased financial risk or lower perceived quality of earnings. The fall in value
will then causes high volatility in stock price. Thus, high debt leverage exposes shareholders to
high systematic risk.
Consistent with theory, empirical findings have unanimously supported this hypothesized
positive relationship (Beaver et al., 1970; Hamada, 1972; Ben-Zion & Shalit, 1975; Bowman,

24
1979; Gahlon & Gentry, 1982; Mandelker & Rhee, 1984; De Jong & Collins, 1985; Amit &
Livanat, 1988; Marston & Perry, 1996; Kim et al., 2007 and Lee & Jang, 2007).
2.3.5 Operating Leverage
Traditionally in finance, risk is decomposed into two components - operating risk (often called
business risk) and financial risk. Operating risk is usually referring to the uncertainty in firms’
operating results, especially operating earnings. Financial risk is associated with the effect
on uncertainty of financial policy, especially the debt-equity mix and the fixed interest
charge associated with debt.
The early theoretical research on the relationship between operating leverage and
systematic risk was started off by Rubinstein (1973). Rubinstein (1973) argued that systematic
risk can be decomposed into operating risk and financing risk. Operating risk reflects the
combined effects of the degree of operating leverage, the systematic impact of macroeconomic
events, and the uncertainty associated with the firm's operating efficiency. Therefore, according
to Rubinstein model, there is a linear relationship between systematic risk of levered firm with its
degree of operating leverage.
Lev (1974) first develops a theoretical model that postulate a positive relationship
between operating leverage and firms’ systematic risk exposure. He then tested his model
empirically and confirm that there is a positive correlation between operating leverage and
systematic risk, even though the explanatory power is rather weak. Lev (1974) defined a firm's
operating leverage as the ratio of the fixed to variable operating costs. In other words, high
operating leverage means a higher percentage of fixed costs relative to variable costs. In general,
when a firm has high operating leverage, it will endure higher earnings volatility with respect to