Embed Size (px)
Citation preview
IntroductionTraditional Methods for Project Management
Graph-Based Methods: PhilosophyGraphical Methods of Risk Analysis
SYSM 6304: Risk and Decision AnalysisLecture 5: Methods of Risk Analysis
M. Vidyasagar
Cecil & Ida Green ChairThe University of Texas at DallasEmail: [email protected]
October 17, 2015
M. Vidyasagar Methods of Risk Analysis
IntroductionTraditional Methods for Project Management
Graph-Based Methods: PhilosophyGraphical Methods of Risk Analysis
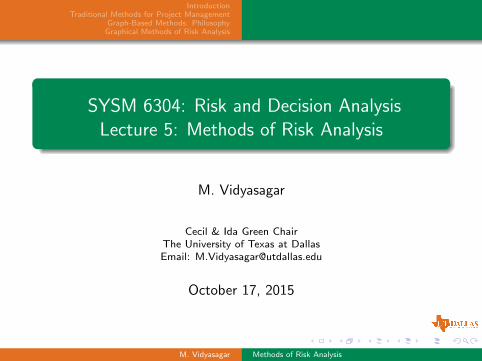
Outline1 Introduction
2 Traditional Methods for Project Management
Gantt Chart
PERT Charts
Critical Path Method (CPM)
3 Graph-Based Methods: Philosophy
4 Graphical Methods of Risk Analysis
Event Trees
Decision Trees
Fault Trees
Bayesian Networks
M. Vidyasagar Methods of Risk Analysis
IntroductionTraditional Methods for Project Management
Graph-Based Methods: PhilosophyGraphical Methods of Risk Analysis
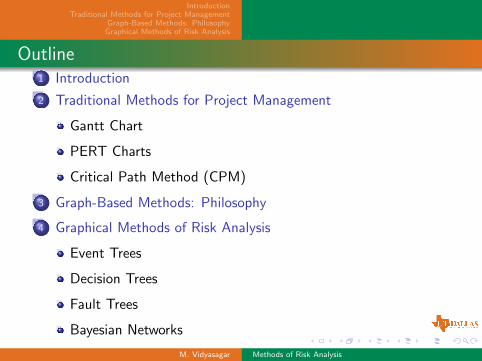
Outline1 Introduction
2 Traditional Methods for Project Management
Gantt Chart
PERT Charts
Critical Path Method (CPM)
3 Graph-Based Methods: Philosophy
4 Graphical Methods of Risk Analysis
Event Trees
Decision Trees
Fault Trees
Bayesian Networks
M. Vidyasagar Methods of Risk Analysis
IntroductionTraditional Methods for Project Management
Graph-Based Methods: PhilosophyGraphical Methods of Risk Analysis
Some Popular Methods of Risk Analysis
Basic Premise: Bad outcomes arise due to multiple failures, notjust one failure.
So to analyze the cascading effects of multiple failures, variousapproaches are used.
Event trees
Fault trees
Decision trees
Bayesian networks
All of them represent the problem as a weighted directed graph,where individual nodes represent outcomes of random variables andedge weights represent probabilities.
For the sake of completeness, we also review historical methods.M. Vidyasagar Methods of Risk Analysis
IntroductionTraditional Methods for Project Management
Graph-Based Methods: PhilosophyGraphical Methods of Risk Analysis
Gantt ChartPERT ChartsCritical Path Method (CPM)
Outline1 Introduction
2 Traditional Methods for Project Management
Gantt Chart
PERT Charts
Critical Path Method (CPM)
3 Graph-Based Methods: Philosophy
4 Graphical Methods of Risk Analysis
Event Trees
Decision Trees
Fault Trees
Bayesian Networks
M. Vidyasagar Methods of Risk Analysis
IntroductionTraditional Methods for Project Management
Graph-Based Methods: PhilosophyGraphical Methods of Risk Analysis
Gantt ChartPERT ChartsCritical Path Method (CPM)
Outline1 Introduction
2 Traditional Methods for Project Management
Gantt Chart
PERT Charts
Critical Path Method (CPM)
3 Graph-Based Methods: Philosophy
4 Graphical Methods of Risk Analysis
Event Trees
Decision Trees
Fault Trees
Bayesian Networks
M. Vidyasagar Methods of Risk Analysis

IntroductionTraditional Methods for Project Management
Graph-Based Methods: PhilosophyGraphical Methods of Risk Analysis
Gantt ChartPERT ChartsCritical Path Method (CPM)
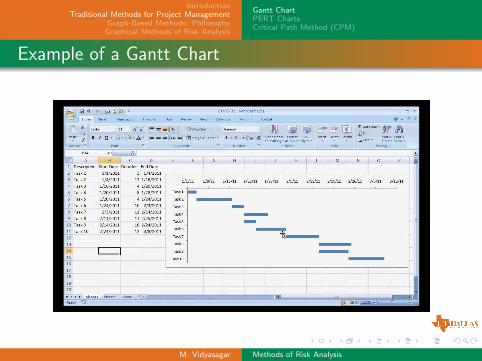
The Gantt Chart
The Gantt chart was invented by Henry Gantt in the 1910’s. Itrepresents each activity in a project as a horizontal bar, with startand end times indicated, as shown on the next slide.
M. Vidyasagar Methods of Risk Analysis
IntroductionTraditional Methods for Project Management
Graph-Based Methods: PhilosophyGraphical Methods of Risk Analysis
Gantt ChartPERT ChartsCritical Path Method (CPM)
Example of a Gantt Chart
M. Vidyasagar Methods of Risk Analysis
IntroductionTraditional Methods for Project Management
Graph-Based Methods: PhilosophyGraphical Methods of Risk Analysis
Gantt ChartPERT ChartsCritical Path Method (CPM)
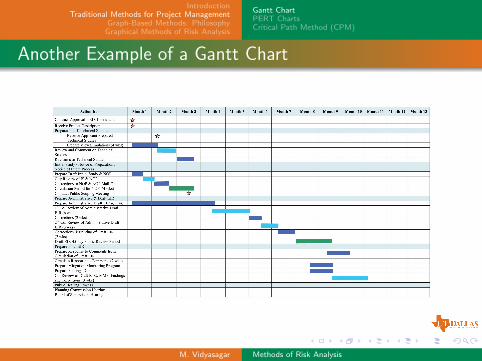
Another Example of a Gantt Chart
M. Vidyasagar Methods of Risk Analysis
IntroductionTraditional Methods for Project Management
Graph-Based Methods: PhilosophyGraphical Methods of Risk Analysis
Gantt ChartPERT ChartsCritical Path Method (CPM)
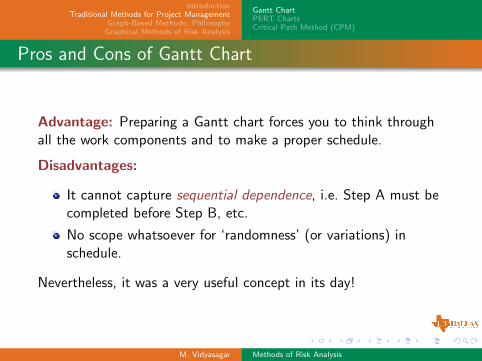
Pros and Cons of Gantt Chart
Advantage: Preparing a Gantt chart forces you to think throughall the work components and to make a proper schedule.
Disadvantages:
It cannot capture sequential dependence, i.e. Step A must becompleted before Step B, etc.
No scope whatsoever for ‘randomness’ (or variations) inschedule.
Nevertheless, it was a very useful concept in its day!
M. Vidyasagar Methods of Risk Analysis
IntroductionTraditional Methods for Project Management
Graph-Based Methods: PhilosophyGraphical Methods of Risk Analysis
Gantt ChartPERT ChartsCritical Path Method (CPM)
Outline1 Introduction
2 Traditional Methods for Project Management
Gantt Chart
PERT Charts
Critical Path Method (CPM)
3 Graph-Based Methods: Philosophy
4 Graphical Methods of Risk Analysis
Event Trees
Decision Trees
Fault Trees
Bayesian Networks
M. Vidyasagar Methods of Risk Analysis
IntroductionTraditional Methods for Project Management
Graph-Based Methods: PhilosophyGraphical Methods of Risk Analysis
Gantt ChartPERT ChartsCritical Path Method (CPM)
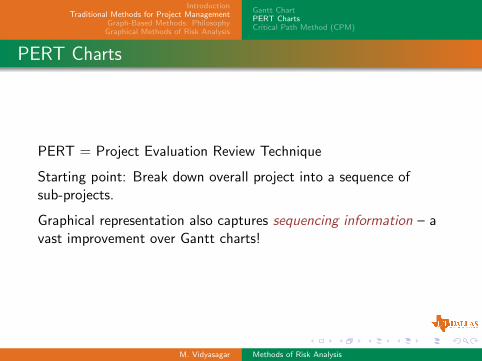
PERT Charts
PERT = Project Evaluation Review Technique
Starting point: Break down overall project into a sequence ofsub-projects.
Graphical representation also captures sequencing information – avast improvement over Gantt charts!
M. Vidyasagar Methods of Risk Analysis
IntroductionTraditional Methods for Project Management
Graph-Based Methods: PhilosophyGraphical Methods of Risk Analysis
Gantt ChartPERT ChartsCritical Path Method (CPM)
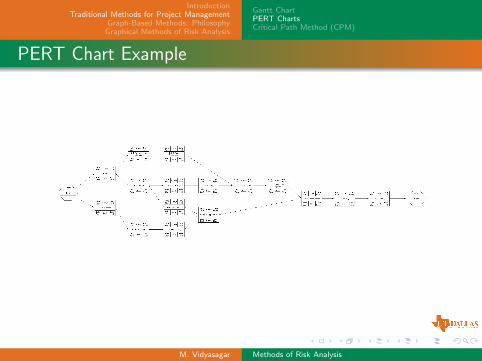
PERT Chart Example
M. Vidyasagar Methods of Risk Analysis
IntroductionTraditional Methods for Project Management
Graph-Based Methods: PhilosophyGraphical Methods of Risk Analysis
Gantt ChartPERT ChartsCritical Path Method (CPM)
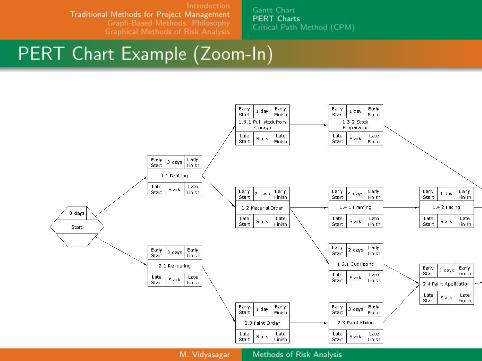
PERT Chart Example (Zoom-In)
M. Vidyasagar Methods of Risk Analysis
IntroductionTraditional Methods for Project Management
Graph-Based Methods: PhilosophyGraphical Methods of Risk Analysis
Gantt ChartPERT ChartsCritical Path Method (CPM)
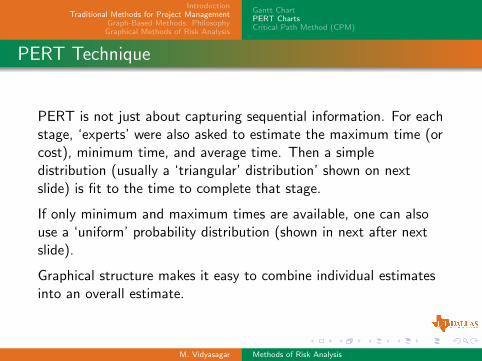
PERT Technique
PERT is not just about capturing sequential information. For eachstage, ‘experts’ were also asked to estimate the maximum time (orcost), minimum time, and average time. Then a simpledistribution (usually a ‘triangular’ distribution’ shown on nextslide) is fit to the time to complete that stage.
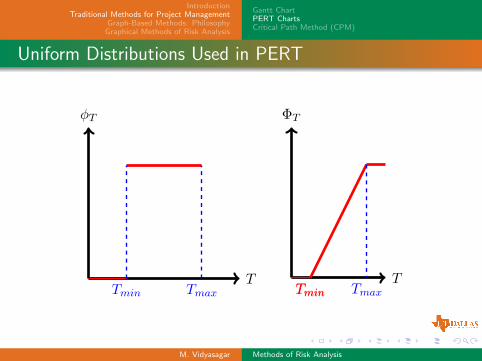
If only minimum and maximum times are available, one can alsouse a ‘uniform’ probability distribution (shown in next after nextslide).
Graphical structure makes it easy to combine individual estimatesinto an overall estimate.
M. Vidyasagar Methods of Risk Analysis
IntroductionTraditional Methods for Project Management
Graph-Based Methods: PhilosophyGraphical Methods of Risk Analysis
Gantt ChartPERT ChartsCritical Path Method (CPM)
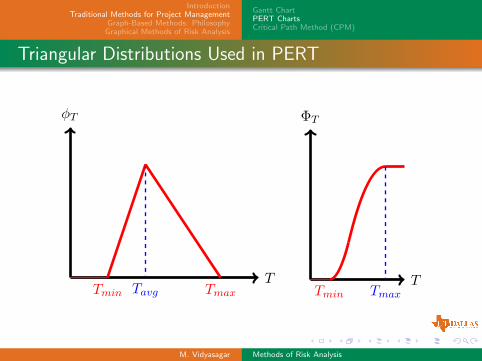
Triangular Distributions Used in PERT
φT
TTmin Tavg Tmax
ΦT
TTmin Tmax
M. Vidyasagar Methods of Risk Analysis
IntroductionTraditional Methods for Project Management
Graph-Based Methods: PhilosophyGraphical Methods of Risk Analysis
Gantt ChartPERT ChartsCritical Path Method (CPM)
Uniform Distributions Used in PERT
φT
TTmin Tmax
ΦT
TTminTmin Tmax
M. Vidyasagar Methods of Risk Analysis
IntroductionTraditional Methods for Project Management
Graph-Based Methods: PhilosophyGraphical Methods of Risk Analysis
Gantt ChartPERT ChartsCritical Path Method (CPM)
Limitations of PERT
PERT was evolved for an era when computation was difficult!Today we need not worry about doing complex computations!
PERT cannot take into account dependence among differentsteps (dependence among different random variables). Inother words, PERT assumes that all random variables areindependent.
M. Vidyasagar Methods of Risk Analysis
IntroductionTraditional Methods for Project Management
Graph-Based Methods: PhilosophyGraphical Methods of Risk Analysis
Gantt ChartPERT ChartsCritical Path Method (CPM)
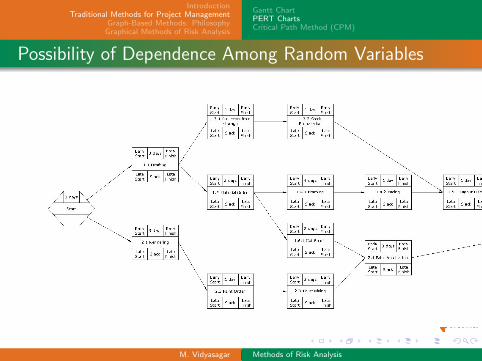
Possibility of Dependence Among Random Variables
If Step from 1 to 3 takes longer than expected, wouldn’t we expectthe step from 3 to 5 also to take longer than expected?
M. Vidyasagar Methods of Risk Analysis
IntroductionTraditional Methods for Project Management
Graph-Based Methods: PhilosophyGraphical Methods of Risk Analysis
Gantt ChartPERT ChartsCritical Path Method (CPM)
Outline1 Introduction
2 Traditional Methods for Project Management
Gantt Chart
PERT Charts
Critical Path Method (CPM)
3 Graph-Based Methods: Philosophy
4 Graphical Methods of Risk Analysis
Event Trees
Decision Trees
Fault Trees
Bayesian Networks
M. Vidyasagar Methods of Risk Analysis

IntroductionTraditional Methods for Project Management
Graph-Based Methods: PhilosophyGraphical Methods of Risk Analysis
Gantt ChartPERT ChartsCritical Path Method (CPM)
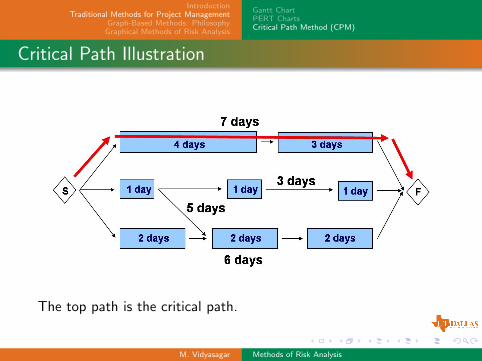
Critical Path Method (CPM)
In this method, one again lays out the components of the overallproject, and works out the average (expected) time needed tocomplete each task.
The longest path through the graph is the critical path, becausethere is no slack in it at all.
Ergo: Pay attention to the critical path and don’t worry about therest (until they become critical!).
M. Vidyasagar Methods of Risk Analysis
IntroductionTraditional Methods for Project Management
Graph-Based Methods: PhilosophyGraphical Methods of Risk Analysis
Gantt ChartPERT ChartsCritical Path Method (CPM)
Critical Path Illustration
The top path is the critical path.
M. Vidyasagar Methods of Risk Analysis
IntroductionTraditional Methods for Project Management
Graph-Based Methods: PhilosophyGraphical Methods of Risk Analysis
Outline1 Introduction
2 Traditional Methods for Project Management
Gantt Chart
PERT Charts
Critical Path Method (CPM)
3 Graph-Based Methods: Philosophy
4 Graphical Methods of Risk Analysis
Event Trees
Decision Trees
Fault Trees
Bayesian Networks
M. Vidyasagar Methods of Risk Analysis
IntroductionTraditional Methods for Project Management
Graph-Based Methods: PhilosophyGraphical Methods of Risk Analysis
Basics of Graphical Representations
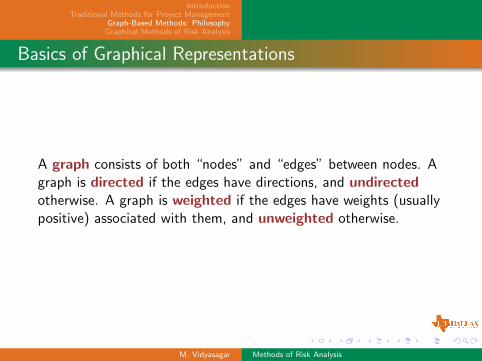
A graph consists of both “nodes” and “edges” between nodes. Agraph is directed if the edges have directions, and undirectedotherwise. A graph is weighted if the edges have weights (usuallypositive) associated with them, and unweighted otherwise.
M. Vidyasagar Methods of Risk Analysis
IntroductionTraditional Methods for Project Management
Graph-Based Methods: PhilosophyGraphical Methods of Risk Analysis
Acyclic vs. Cyclic Graphs
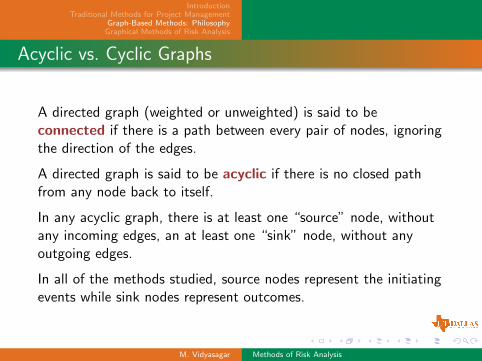
A directed graph (weighted or unweighted) is said to beconnected if there is a path between every pair of nodes, ignoringthe direction of the edges.
A directed graph is said to be acyclic if there is no closed pathfrom any node back to itself.
In any acyclic graph, there is at least one “source” node, withoutany incoming edges, an at least one “sink” node, without anyoutgoing edges.
In all of the methods studied, source nodes represent the initiatingevents while sink nodes represent outcomes.
M. Vidyasagar Methods of Risk Analysis
IntroductionTraditional Methods for Project Management
Graph-Based Methods: PhilosophyGraphical Methods of Risk Analysis
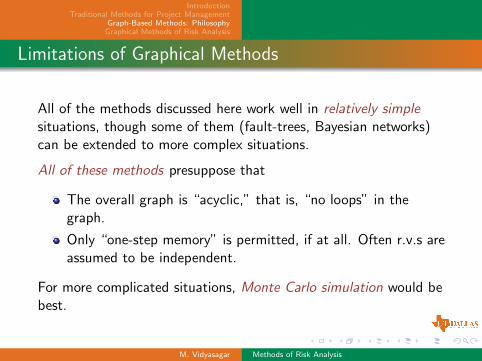
Limitations of Graphical Methods
All of the methods discussed here work well in relatively simplesituations, though some of them (fault-trees, Bayesian networks)can be extended to more complex situations.
All of these methods presuppose that
The overall graph is “acyclic,” that is, “no loops” in thegraph.
Only “one-step memory” is permitted, if at all. Often r.v.s areassumed to be independent.
For more complicated situations, Monte Carlo simulation would bebest.
M. Vidyasagar Methods of Risk Analysis
IntroductionTraditional Methods for Project Management
Graph-Based Methods: PhilosophyGraphical Methods of Risk Analysis
Event TreesDecision TreesFault TreesBayesian Networks
Outline1 Introduction
2 Traditional Methods for Project Management
Gantt Chart
PERT Charts
Critical Path Method (CPM)
3 Graph-Based Methods: Philosophy
4 Graphical Methods of Risk Analysis
Event Trees
Decision Trees
Fault Trees
Bayesian Networks
M. Vidyasagar Methods of Risk Analysis
IntroductionTraditional Methods for Project Management
Graph-Based Methods: PhilosophyGraphical Methods of Risk Analysis
Event TreesDecision TreesFault TreesBayesian Networks
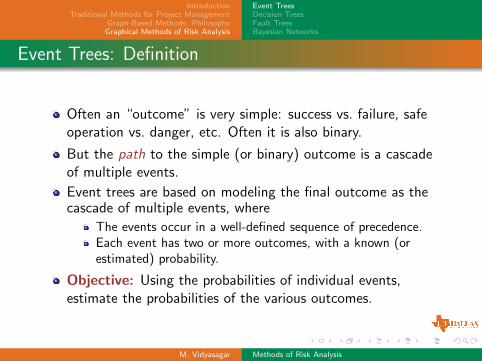
Event Trees: Definition
Often an “outcome” is very simple: success vs. failure, safeoperation vs. danger, etc. Often it is also binary.
But the path to the simple (or binary) outcome is a cascadeof multiple events.
Event trees are based on modeling the final outcome as thecascade of multiple events, where
The events occur in a well-defined sequence of precedence.Each event has two or more outcomes, with a known (orestimated) probability.
Objective: Using the probabilities of individual events,estimate the probabilities of the various outcomes.
M. Vidyasagar Methods of Risk Analysis
IntroductionTraditional Methods for Project Management
Graph-Based Methods: PhilosophyGraphical Methods of Risk Analysis
Event TreesDecision TreesFault TreesBayesian Networks
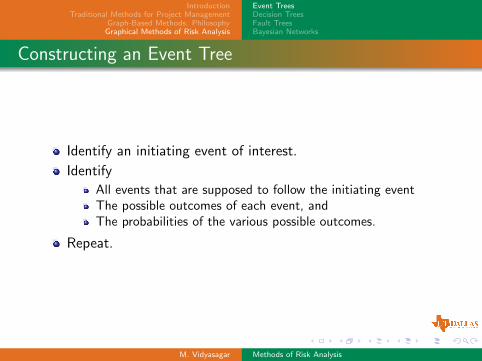
Constructing an Event Tree
Identify an initiating event of interest.
Identify
All events that are supposed to follow the initiating eventThe possible outcomes of each event, andThe probabilities of the various possible outcomes.
Repeat.
M. Vidyasagar Methods of Risk Analysis
IntroductionTraditional Methods for Project Management
Graph-Based Methods: PhilosophyGraphical Methods of Risk Analysis
Event TreesDecision TreesFault TreesBayesian Networks
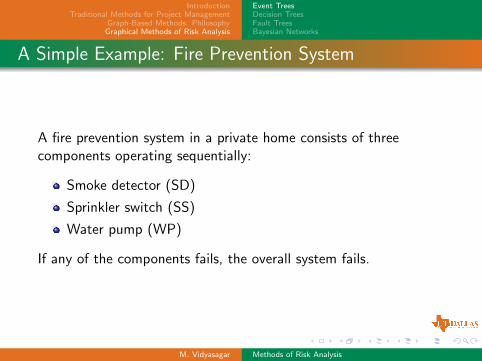
A Simple Example: Fire Prevention System
A fire prevention system in a private home consists of threecomponents operating sequentially:
Smoke detector (SD)
Sprinkler switch (SS)
Water pump (WP)
If any of the components fails, the overall system fails.
M. Vidyasagar Methods of Risk Analysis
IntroductionTraditional Methods for Project Management
Graph-Based Methods: PhilosophyGraphical Methods of Risk Analysis
Event TreesDecision TreesFault TreesBayesian Networks
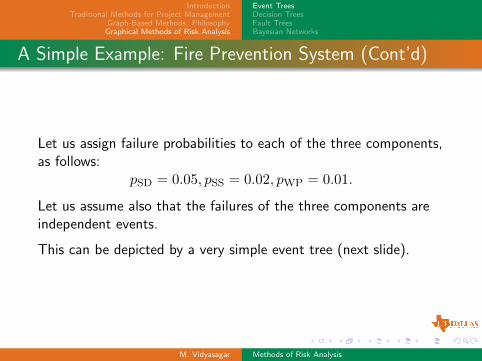
A Simple Example: Fire Prevention System (Cont’d)
Let us assign failure probabilities to each of the three components,as follows:
pSD = 0.05, pSS = 0.02, pWP = 0.01.
Let us assume also that the failures of the three components areindependent events.
This can be depicted by a very simple event tree (next slide).
M. Vidyasagar Methods of Risk Analysis
IntroductionTraditional Methods for Project Management
Graph-Based Methods: PhilosophyGraphical Methods of Risk Analysis
Event TreesDecision TreesFault TreesBayesian Networks
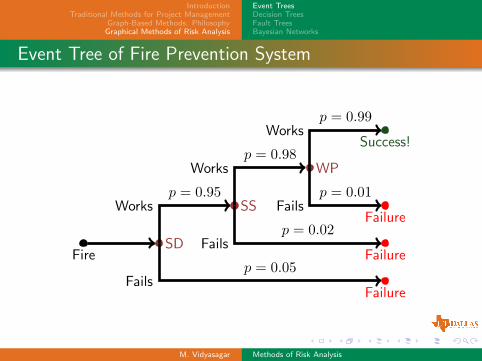
Event Tree of Fire Prevention System
FireSD
Worksp = 0.95
Failsp = 0.05
SS
Worksp = 0.98
Failsp = 0.02
WP
Worksp = 0.99
Failsp = 0.01
Failure
Failure
Failure
Success!
M. Vidyasagar Methods of Risk Analysis

IntroductionTraditional Methods for Project Management
Graph-Based Methods: PhilosophyGraphical Methods of Risk Analysis
Event TreesDecision TreesFault TreesBayesian Networks
Analysis of Event Tree
There are four paths in all, out of which three lead to failure andonly one leads to success.
The probability of each path is the product of the probabilities ofthe individual events (as events are assumed to be independent).
Therefore the probability of success is
pS = 0.95× 0.98× 0.99 = 0.92169,
while the probability of failure is the sum of the probabilities of thethree paths:
pF = (0.95× 0.98× 0.01) + (0.95× 0.02) + 0.05
= 0.07831.
M. Vidyasagar Methods of Risk Analysis
IntroductionTraditional Methods for Project Management
Graph-Based Methods: PhilosophyGraphical Methods of Risk Analysis
Event TreesDecision TreesFault TreesBayesian Networks
Some Common Erroneous Statements
The literature contains some erroneous statements about eventtrees.
In an event tree, every node can have only two outgoing edges(i.e., every event can have only two possible outcomes).
This is incorrect. It is permissible for a node to have more thantwo outgoing edges. But the weights (probabilities) of all outgoingedges must, of course, add up to one.
M. Vidyasagar Methods of Risk Analysis
IntroductionTraditional Methods for Project Management
Graph-Based Methods: PhilosophyGraphical Methods of Risk Analysis
Event TreesDecision TreesFault TreesBayesian Networks
Some Common Erroneous Statements (Cont’d)
In an event tree, every node can have only one incoming edge (i.e.,every event can have only one possible way to happen).
This too is incorrect. It is permissible to have multiple edgespointing into one node.
In fact the previous example can be redrawn as shown in the nextslide.
M. Vidyasagar Methods of Risk Analysis
IntroductionTraditional Methods for Project Management
Graph-Based Methods: PhilosophyGraphical Methods of Risk Analysis
Event TreesDecision TreesFault TreesBayesian Networks
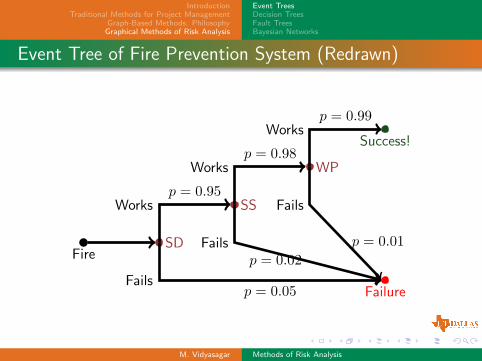
Event Tree of Fire Prevention System (Redrawn)
FireSD
Worksp = 0.95
Failsp = 0.05
SS
Worksp = 0.98
Failsp = 0.02
WP
Worksp = 0.99
Fails
p = 0.01
Failure
Success!
M. Vidyasagar Methods of Risk Analysis
IntroductionTraditional Methods for Project Management
Graph-Based Methods: PhilosophyGraphical Methods of Risk Analysis
Event TreesDecision TreesFault TreesBayesian Networks
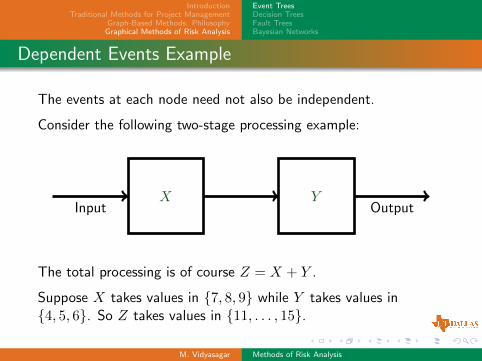
Dependent Events Example
The events at each node need not also be independent.
Consider the following two-stage processing example:
Input OutputX Y
The total processing is of course Z = X + Y .
Suppose X takes values in {7, 8, 9} while Y takes values in{4, 5, 6}. So Z takes values in {11, . . . , 15}.
M. Vidyasagar Methods of Risk Analysis
IntroductionTraditional Methods for Project Management
Graph-Based Methods: PhilosophyGraphical Methods of Risk Analysis
Event TreesDecision TreesFault TreesBayesian Networks
Dependent Events Example (Cont’d)
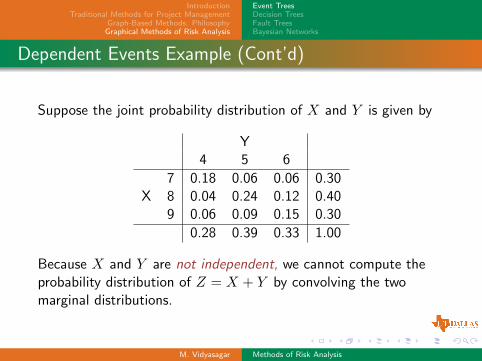
Suppose the joint probability distribution of X and Y is given by
Y4 5 6
7 0.18 0.06 0.06 0.30X 8 0.04 0.24 0.12 0.40
9 0.06 0.09 0.15 0.30
0.28 0.39 0.33 1.00
Because X and Y are not independent, we cannot compute theprobability distribution of Z = X + Y by convolving the twomarginal distributions.
M. Vidyasagar Methods of Risk Analysis
IntroductionTraditional Methods for Project Management
Graph-Based Methods: PhilosophyGraphical Methods of Risk Analysis
Event TreesDecision TreesFault TreesBayesian Networks
Dependent Events Example (Cont’d)
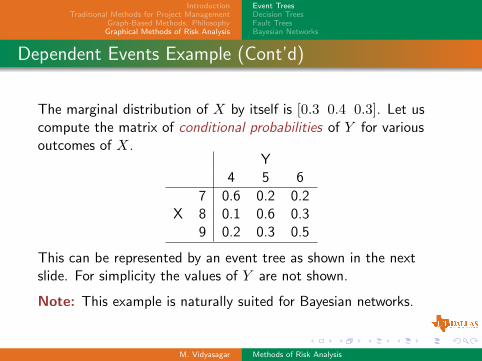
The marginal distribution of X by itself is [0.3 0.4 0.3]. Let uscompute the matrix of conditional probabilities of Y for variousoutcomes of X.
Y4 5 6
7 0.6 0.2 0.2X 8 0.1 0.6 0.3
9 0.2 0.3 0.5
This can be represented by an event tree as shown in the nextslide. For simplicity the values of Y are not shown.
Note: This example is naturally suited for Bayesian networks.
M. Vidyasagar Methods of Risk Analysis
IntroductionTraditional Methods for Project Management
Graph-Based Methods: PhilosophyGraphical Methods of Risk Analysis
Event TreesDecision TreesFault TreesBayesian Networks
Event Tree for Two-Stage Processing Example
Start
7
8
9
X
11
12
13
14
15
Z
0.3
0.4
0.3
0.6
0.2
0.2
0.1
0.6
0.3
0.2
0.3
0.5
M. Vidyasagar Methods of Risk Analysis
IntroductionTraditional Methods for Project Management
Graph-Based Methods: PhilosophyGraphical Methods of Risk Analysis
Event TreesDecision TreesFault TreesBayesian Networks
Dependent Events Example (Cont’d)
There is one path each leading to Z = 11 and to Z = 15, twopaths each leading to Z = 12 and to Z = 14, and three pathsleading to Z = 13.
The probability of each path can either be computed using thetable or conditional probabilities. For example
Pr{Z = 12} = Pr{X = 7&Y = 5}+ Pr{X = 8&Y = 4}= 0.06 + 0.04 = 0.10.
M. Vidyasagar Methods of Risk Analysis

IntroductionTraditional Methods for Project Management
Graph-Based Methods: PhilosophyGraphical Methods of Risk Analysis
Event TreesDecision TreesFault TreesBayesian Networks
Dependent Events Example (Cont’d)
But we can also compute
Pr{X = 7&Y = 5} = Pr{X = 7} · Pr{Y = 5|X = 7}
and similarly for the other term. Both approaches give the sameanswer.
Adding up all the probabilities gives the probability distribution ofZ:
φZ = [ 0.18 0.10 0.36 0.21 0.15 ].
It is possible to automate this process so that quite large eventtrees can be analyzed.
M. Vidyasagar Methods of Risk Analysis
IntroductionTraditional Methods for Project Management
Graph-Based Methods: PhilosophyGraphical Methods of Risk Analysis
Event TreesDecision TreesFault TreesBayesian Networks
Outline1 Introduction
2 Traditional Methods for Project Management
Gantt Chart
PERT Charts
Critical Path Method (CPM)
3 Graph-Based Methods: Philosophy
4 Graphical Methods of Risk Analysis
Event Trees
Decision Trees
Fault Trees
Bayesian Networks
M. Vidyasagar Methods of Risk Analysis
IntroductionTraditional Methods for Project Management
Graph-Based Methods: PhilosophyGraphical Methods of Risk Analysis
Event TreesDecision TreesFault TreesBayesian Networks
Decision Trees
Decision trees are essentially the same as event trees, except thatat several nodes, some decision needs to be taken, such as theassociated profit (or loss), the amount of investment needed, etc.
In short, the outcomes in decision trees are usually numerical,whereas in event trees they can also be “abstract” r.v.s.
M. Vidyasagar Methods of Risk Analysis
IntroductionTraditional Methods for Project Management
Graph-Based Methods: PhilosophyGraphical Methods of Risk Analysis
Event TreesDecision TreesFault TreesBayesian Networks
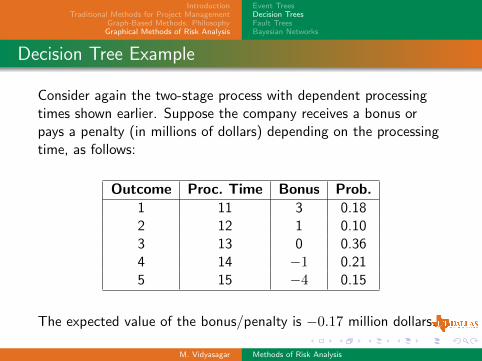
Decision Tree Example
Consider again the two-stage process with dependent processingtimes shown earlier. Suppose the company receives a bonus orpays a penalty (in millions of dollars) depending on the processingtime, as follows:
Outcome Proc. Time Bonus Prob.1 11 3 0.182 12 1 0.103 13 0 0.364 14 −1 0.215 15 −4 0.15
The expected value of the bonus/penalty is −0.17 million dollars.
M. Vidyasagar Methods of Risk Analysis
IntroductionTraditional Methods for Project Management
Graph-Based Methods: PhilosophyGraphical Methods of Risk Analysis
Event TreesDecision TreesFault TreesBayesian Networks
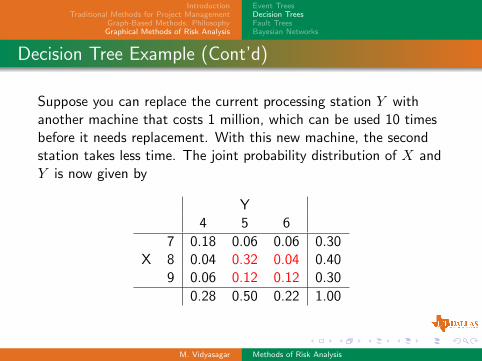
Decision Tree Example (Cont’d)
Suppose you can replace the current processing station Y withanother machine that costs 1 million, which can be used 10 timesbefore it needs replacement. With this new machine, the secondstation takes less time. The joint probability distribution of X andY is now given by
Y4 5 6
7 0.18 0.06 0.06 0.30X 8 0.04 0.32 0.04 0.40
9 0.06 0.12 0.12 0.30
0.28 0.50 0.22 1.00
M. Vidyasagar Methods of Risk Analysis
IntroductionTraditional Methods for Project Management
Graph-Based Methods: PhilosophyGraphical Methods of Risk Analysis
Event TreesDecision TreesFault TreesBayesian Networks
Decision Tree Example (Cont’d)
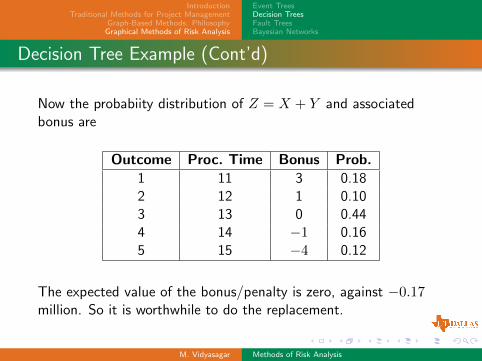
Now the probabiity distribution of Z = X + Y and associatedbonus are
Outcome Proc. Time Bonus Prob.1 11 3 0.182 12 1 0.103 13 0 0.444 14 −1 0.165 15 −4 0.12
The expected value of the bonus/penalty is zero, against −0.17million. So it is worthwhile to do the replacement.
M. Vidyasagar Methods of Risk Analysis

IntroductionTraditional Methods for Project Management
Graph-Based Methods: PhilosophyGraphical Methods of Risk Analysis
Event TreesDecision TreesFault TreesBayesian Networks
Decision Trees: Useful URL
A detailed discussion of decision trees and several examples can befound at the following URL:
http://orms.pef.czu.cz/text/game-theory/DecisionTheory.html
M. Vidyasagar Methods of Risk Analysis
IntroductionTraditional Methods for Project Management
Graph-Based Methods: PhilosophyGraphical Methods of Risk Analysis
Event TreesDecision TreesFault TreesBayesian Networks
Outline1 Introduction
2 Traditional Methods for Project Management
Gantt Chart
PERT Charts
Critical Path Method (CPM)
3 Graph-Based Methods: Philosophy
4 Graphical Methods of Risk Analysis
Event Trees
Decision Trees
Fault Trees
Bayesian Networks
M. Vidyasagar Methods of Risk Analysis
IntroductionTraditional Methods for Project Management
Graph-Based Methods: PhilosophyGraphical Methods of Risk Analysis
Event TreesDecision TreesFault TreesBayesian Networks
General Philosophy
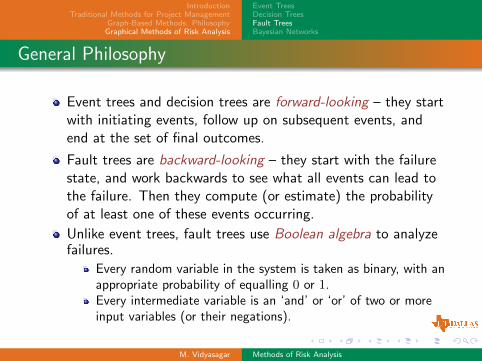
Event trees and decision trees are forward-looking – they startwith initiating events, follow up on subsequent events, andend at the set of final outcomes.
Fault trees are backward-looking – they start with the failurestate, and work backwards to see what all events can lead tothe failure. Then they compute (or estimate) the probabilityof at least one of these events occurring.
Unlike event trees, fault trees use Boolean algebra to analyzefailures.
Every random variable in the system is taken as binary, with anappropriate probability of equalling 0 or 1.Every intermediate variable is an ‘and’ or ‘or’ of two or moreinput variables (or their negations).
M. Vidyasagar Methods of Risk Analysis
IntroductionTraditional Methods for Project Management
Graph-Based Methods: PhilosophyGraphical Methods of Risk Analysis
Event TreesDecision TreesFault TreesBayesian Networks
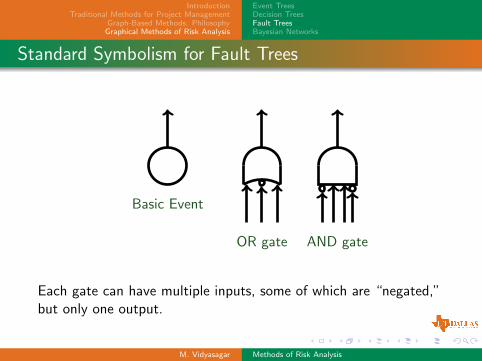
Standard Symbolism for Fault Trees
Basic Event
OR gate AND gate
Each gate can have multiple inputs, some of which are “negated,”but only one output.
M. Vidyasagar Methods of Risk Analysis
IntroductionTraditional Methods for Project Management
Graph-Based Methods: PhilosophyGraphical Methods of Risk Analysis
Event TreesDecision TreesFault TreesBayesian Networks
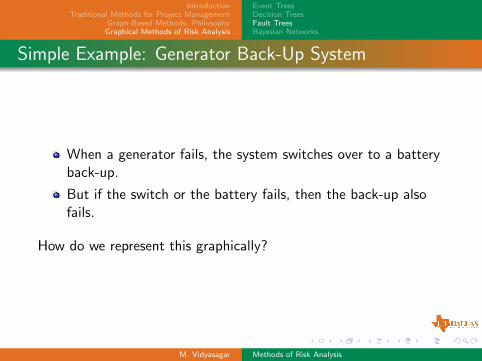
Simple Example: Generator Back-Up System
When a generator fails, the system switches over to a batteryback-up.
But if the switch or the battery fails, then the back-up alsofails.
How do we represent this graphically?
M. Vidyasagar Methods of Risk Analysis
IntroductionTraditional Methods for Project Management
Graph-Based Methods: PhilosophyGraphical Methods of Risk Analysis
Event TreesDecision TreesFault TreesBayesian Networks
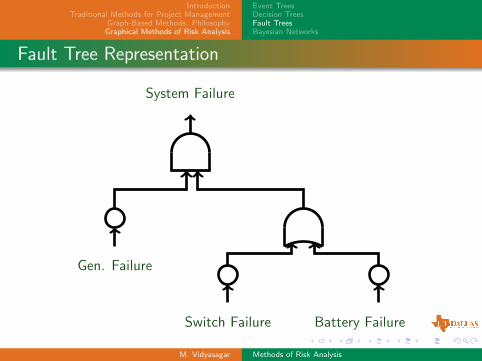
Fault Tree Representation
System Failure
Gen. Failure
Switch Failure Battery Failure
M. Vidyasagar Methods of Risk Analysis
IntroductionTraditional Methods for Project Management
Graph-Based Methods: PhilosophyGraphical Methods of Risk Analysis
Event TreesDecision TreesFault TreesBayesian Networks
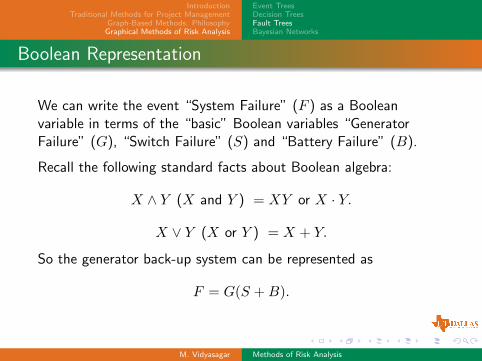
Boolean Representation
We can write the event “System Failure” (F ) as a Booleanvariable in terms of the “basic” Boolean variables “GeneratorFailure” (G), “Switch Failure” (S) and “Battery Failure” (B).
Recall the following standard facts about Boolean algebra:
X ∧ Y (X and Y ) = XY or X · Y.
X ∨ Y (X or Y ) = X + Y.
So the generator back-up system can be represented as
F = G(S +B).
M. Vidyasagar Methods of Risk Analysis
IntroductionTraditional Methods for Project Management
Graph-Based Methods: PhilosophyGraphical Methods of Risk Analysis
Event TreesDecision TreesFault TreesBayesian Networks
Minimal Cutsets
A minimal cutset is a set of Boolean variables such that
Setting every variable to “True” causes the top event to be“True.”
Setting any proper subset to “True” does not necessarilycause the top event to be “True.”
M. Vidyasagar Methods of Risk Analysis
IntroductionTraditional Methods for Project Management
Graph-Based Methods: PhilosophyGraphical Methods of Risk Analysis
Event TreesDecision TreesFault TreesBayesian Networks
Minimal Cutsets of Back-Up Example
Because F = G(S +B), there are two minimal cutsets: {G,S}and {G,B}.
So the failure probability is the total probability that either thegenerator and switch fail together, or that the generator andbattery fail together.
If we assume that all these events are independent, then the totalfailure probability is P (G)P (S) + P (G)P (B).
Even if the events are not necessarily independent, this gives aquick upper bound.
M. Vidyasagar Methods of Risk Analysis
IntroductionTraditional Methods for Project Management
Graph-Based Methods: PhilosophyGraphical Methods of Risk Analysis
Event TreesDecision TreesFault TreesBayesian Networks
Identifying Minimal Cutsets in Large Fault Trees
Even in very large fault trees, it is possible to identify minimalcutsets efficiently.
Start from the top event.
If it is an “AND” gate, each input must be true (or false ifone input is negated).
If it is an “OR” gate, any one input must be true.
Repeat all the way down.
This approach can be automated, making this a very practicalapproach.
M. Vidyasagar Methods of Risk Analysis
IntroductionTraditional Methods for Project Management
Graph-Based Methods: PhilosophyGraphical Methods of Risk Analysis
Event TreesDecision TreesFault TreesBayesian Networks
Constructing Fault Trees
One of the major advantages of fault trees is that it is possible toconstruct models for individual subsystems, and then “aggregate”them to get a fault tree for the overall system.
This is highly desirable because usually no one has a thoroughunderstanding of every single component.
Also, there exist algorithms for constructing minimal cutsets forquite large fault trees, thus enhancing the applicability of theapproach.
M. Vidyasagar Methods of Risk Analysis
IntroductionTraditional Methods for Project Management
Graph-Based Methods: PhilosophyGraphical Methods of Risk Analysis
Event TreesDecision TreesFault TreesBayesian Networks
Combining Fault Trees and Event Trees
Often event trees are very simplified representations of complexsystems, where each node represents a fairly complex subsystem.Fault trees can be used to construct very elaborate representationsof each subsystem, and also to provide worst case failureprobabilities of each subsystem. These numbers can then be usedin the event tree analysis.
M. Vidyasagar Methods of Risk Analysis
IntroductionTraditional Methods for Project Management
Graph-Based Methods: PhilosophyGraphical Methods of Risk Analysis
Event TreesDecision TreesFault TreesBayesian Networks
Outline1 Introduction
2 Traditional Methods for Project Management
Gantt Chart
PERT Charts
Critical Path Method (CPM)
3 Graph-Based Methods: Philosophy
4 Graphical Methods of Risk Analysis
Event Trees
Decision Trees
Fault Trees
Bayesian Networks
M. Vidyasagar Methods of Risk Analysis
IntroductionTraditional Methods for Project Management
Graph-Based Methods: PhilosophyGraphical Methods of Risk Analysis
Event TreesDecision TreesFault TreesBayesian Networks
Bayesian Networks: Philosophy
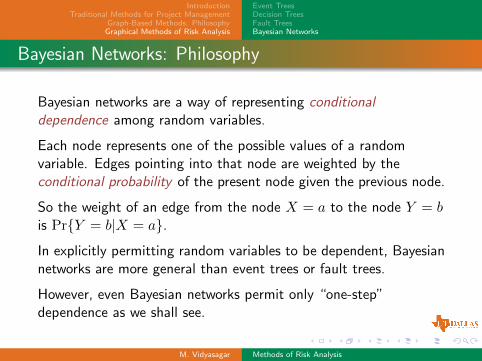
Bayesian networks are a way of representing conditionaldependence among random variables.
Each node represents one of the possible values of a randomvariable. Edges pointing into that node are weighted by theconditional probability of the present node given the previous node.
So the weight of an edge from the node X = a to the node Y = bis Pr{Y = b|X = a}.
In explicitly permitting random variables to be dependent, Bayesiannetworks are more general than event trees or fault trees.
However, even Bayesian networks permit only “one-step”dependence as we shall see.
M. Vidyasagar Methods of Risk Analysis
IntroductionTraditional Methods for Project Management
Graph-Based Methods: PhilosophyGraphical Methods of Risk Analysis
Event TreesDecision TreesFault TreesBayesian Networks
Bayesian Network Example 1
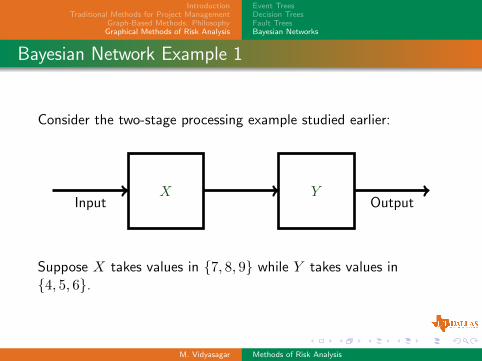
Consider the two-stage processing example studied earlier:
Input OutputX Y
Suppose X takes values in {7, 8, 9} while Y takes values in{4, 5, 6}.
M. Vidyasagar Methods of Risk Analysis
IntroductionTraditional Methods for Project Management
Graph-Based Methods: PhilosophyGraphical Methods of Risk Analysis
Event TreesDecision TreesFault TreesBayesian Networks
Bayesian Network Example 1 (Cont’d)
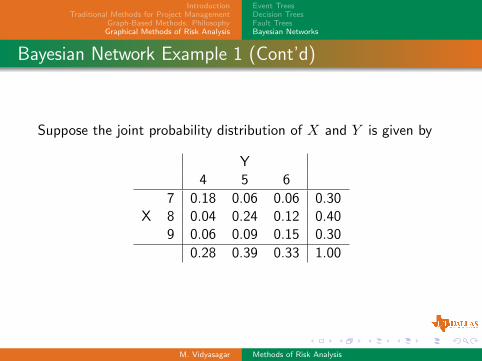
Suppose the joint probability distribution of X and Y is given by
Y4 5 6
7 0.18 0.06 0.06 0.30X 8 0.04 0.24 0.12 0.40
9 0.06 0.09 0.15 0.30
0.28 0.39 0.33 1.00
M. Vidyasagar Methods of Risk Analysis
IntroductionTraditional Methods for Project Management
Graph-Based Methods: PhilosophyGraphical Methods of Risk Analysis
Event TreesDecision TreesFault TreesBayesian Networks
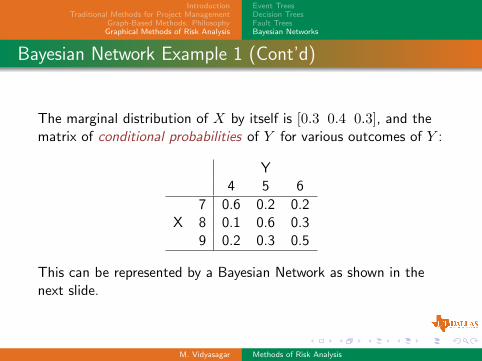
Bayesian Network Example 1 (Cont’d)
The marginal distribution of X by itself is [0.3 0.4 0.3], and thematrix of conditional probabilities of Y for various outcomes of Y :
Y4 5 6
7 0.6 0.2 0.2X 8 0.1 0.6 0.3
9 0.2 0.3 0.5
This can be represented by a Bayesian Network as shown in thenext slide.
M. Vidyasagar Methods of Risk Analysis
IntroductionTraditional Methods for Project Management
Graph-Based Methods: PhilosophyGraphical Methods of Risk Analysis
Event TreesDecision TreesFault TreesBayesian Networks
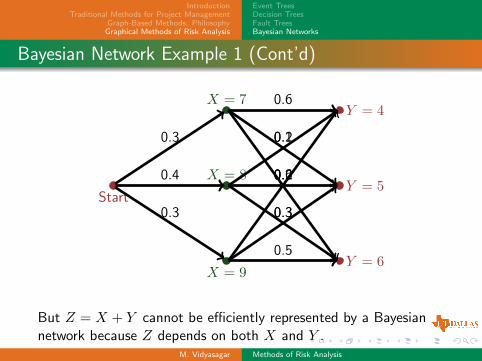
Bayesian Network Example 1 (Cont’d)
Start
X = 7
X = 8
X = 9
Y = 4
Y = 5
Y = 6
0.3
0.4
0.3
0.6
0.2
0.2
0.1
0.6
0.3
0.2
0.3
0.5
But Z = X + Y cannot be efficiently represented by a Bayesiannetwork because Z depends on both X and Y .
M. Vidyasagar Methods of Risk Analysis
IntroductionTraditional Methods for Project Management
Graph-Based Methods: PhilosophyGraphical Methods of Risk Analysis
Event TreesDecision TreesFault TreesBayesian Networks
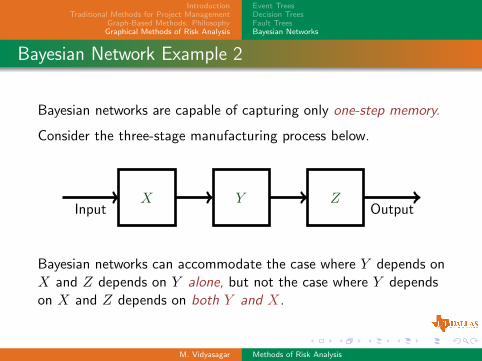
Bayesian Network Example 2
Bayesian networks are capable of capturing only one-step memory.
Consider the three-stage manufacturing process below.
Input OutputX Y Z
Bayesian networks can accommodate the case where Y depends onX and Z depends on Y alone, but not the case where Y dependson X and Z depends on both Y and X.
M. Vidyasagar Methods of Risk Analysis
IntroductionTraditional Methods for Project Management
Graph-Based Methods: PhilosophyGraphical Methods of Risk Analysis
Event TreesDecision TreesFault TreesBayesian Networks
Bayesian Belief Networks
Bayesian networks are very popular in artificial intelligence (AI)circles, because the actual conditional probabilities can be replacedby one’s “beliefs” as to what those conditional probabilities oughtto be.
By treating these “beliefs” as actual conditional probabilities, thebeliefs can be “propagated” along the network.
Since different human experts are knowledgeable about differentparts of the network (and can thus give realistic “beliefs”), whilebeing ignorant about everything else, Bayesian networks provide asimple and mathematically valid procedure for combining beliefsfrom different humans.
M. Vidyasagar Methods of Risk Analysis