Embed Size (px)
Citation preview
TG 1161 A
MAY 1971
Copy No.
"lecbnical Memorandum
SYNTHETIC APERTURE SONAR
J. N. BUCKNAM
A. M. CHWASTYK
H. D. BLACK
F. C. PADDISON
F6 J L 1972
-- C
THE JOHNS HOPKINS UNIVERSITY • APPLIED PHYSICS LABORATORYR-pwoduce- b,NATIOHNA. TECHNICALINFORMATION SERVICE
U S •'Q'•~ •f C~e
p o pu r , Ar A 51
Approved for public relioase, 'istributior unlimitedt.
UNCUMSSEFIED
DOCUMENIT CORTROL DAT A- R &D
The Johns Hopkins University Applied Physi"cs Lab. I Unclssift-d8621 Georgia AvenueSilver Sprints. '11d. 20910 _______
Synmhetic Aperture Sonar
Technical '1roadm
J. 'N. Bucknam, A. ?%I. 'Thwastyk, H. D. Black, and F. C_ Paddisonj
lb Pr-Co- -AIKE TA OTLn. OP PAZESA9 OF CFN
M11aY 1971 4 46 I1,*.&. CC2;~C: 014 GRAX9 NO. =* RIGIUALT0WS REOCRT =3i!5E901
b- PXoji.Cr U0, -TG 1161ATask QOMO i*:30
-21 I ' oSTrne3o"Ru5 7ATEMENT Approved for public release; distribution unlimited.
IS UPPLEJErUTARY NOTES 12- SPWSSORING IILITARY ACTIVSTY
* Advanced Researci Projects Agency113. A25TRACT
This zreport discusses synthetic-aperture imagery applied tothe beabed Treaty verification problem. it presents the basic, theory of the syn-thetic-aperture side-locking sonar and shows the transition region from real to
smnthetic aper-ture ini terms of resolution and mnappin rate Coieal egi-
Sneering and detailed design work will be reijuired to perfect the syr-thetic -aperturetechnique. In addition, the form. and character of ocean bottom structures housingpotential threats and their possible locations must be defined so that the imagremakers can intelligently develop diseriminators and judgment tools. Considerableai~zntion is paid in the report to th~e signal -process~ng problenm and output display.The paper also disc~usses development costs, normal development schedules, criti-c~al technir al areas, critical mediam stability experiments, characteristics of1possuioe demonstration hardware., z~nd the state of the art of precise navigation atsea.
NDrOV 6517 UNCLASSIF IEDSecuirity ClassicWat-ion

II IISynthetic aperEure sonarAcoustic irager-"Synthetic arrayIfedium te.mporat and spatial stobflitySeabced Treally VerificationAcou.stEic cross section of -weawon st•orage eaclitiesOcean spa*tial and temporal stability
wI
II
<I
TG 1161A
MAY 1971
i" Tecbnical Memorandum
SYNTHETIC APERTURE SONARL _ J. N. BIJCKNAM
A. M. CHWASTYK
j H. D. BLACK
F. C. PADDISON
SPONSORED BY ARPA UNDER .O 1566 AMENDMENT 1
THE JOHNS HOPKINS UNIVERSITY a APPLIED PHYSICS LABORATORY8621 Georgia Avenue, Silver Spring, Maryland 20910
"Opcratin* tmdr Cottraa N00017-62-C-0604 wtd, the Depertme't ol the Ncvy
Ap;rovod for public relfasa: dhstribution unlimltacL
THE JOHN "Oftats tuara.1e - APPLIED PHYSICS LABORATORY
ABSTRACT
1LVisibility in the ocean at optical frequencies is
limited to hundreds of yards under the best of circum-stances. The alternate means for "seeing" objects in theocean is through acoustic imagery. High-resolution acous-tic system; are in use to locate small objects such asmines and swim-ers; however, these must operate at veryhigh acoustic frequencies to obtain the needed resolution,uhich because of the extreme attenuation at these frequen-cies limits their range. Very low acoustic frequenciesare used by geologists to penetrate the ocean and map itsfloor at great depths, however with poor resolution. Atintermediate frequencies and with synthetic aperture tech-niques, imaging of a rather substantial swath of oceanbottom is possible. S)nthetic aperture radar imagery to-day is competitik-e with optical photography, and thereis no reason apparent why with the application of similartechniques acoustic imagery cannot approach radar imagery.However, considerable engineering, detailed design, anddemonstration are required in the perfection of theacoustic technique. In addition, the form and characterof the acoustic image of potential objects of interestand their possible locations must h'e defined for discrim-ination and system deployment reasons.
The report discusses the basic theory of the-- synthetic aperture side-looking sonar and tradeoffs between
real and synthetic aperture in terms of resolution andmapping rate. Considerable attention is paid to thesignal-processing problem and output display, as well asthe state-of-the-art of navigation at sea. The paper alsodiscusses the development costs, normal developmentschedules, critical technical areas, critical medium"stability experiments, and possible demonstration hard-ware system characteristics.
" "- This work on high-resolution acoustic imaging hasbeen supported under the Advanced Marine Technology Pr,,gramof the Strategic Technology Office of the Advanced ResearchProjects Agency. This report on the application of thattechnology to the Seabed Treaty verification problem wasprepared at the request of the Weapons Evaluation and Con-trol Bureau Field Operations of the United States ArmsControl and Disarmament Agency.

APPLIED PHYSICS LABORATCRY
CONTENTS
" - List of Illustrations . . vii
List of Tables . ix
Preface xi
.21. Introduction 1
Summary 1Requirements of Seabed Treaty Policing System. 2
"Candidate Mapping Systems. . 3
2. System Tradeoffs for Real and Synthetic-- Aperture Systems 13
Real Aperture Mapping Systems . 13V ._Synthetic Aperture Mapping Systems . . 15Comparison of the Systems. . 19
I 3. Schedule and Cost Estimates . . 25
Suggested Systems . . 25Development Schedule and Costs. . 26
- Production Costs . 26
4. Critical Areas and Feasibility Demonstration . 29
Critical Areas . 29Feasibility Demonstration. 41
References .. .. 45
-v

APFLEMD FHsý LASCAAT CRY
ILLUSTR.TIONS
11. Real Aperture Mapping SysteZ .
2. Transmit!Receive Beam Pattern of Real
Hydrophone Array. 8
"3. Plan View of Synthetic Aperture Geometry,
Without Filling . . . 9
4. Plan View of Synthetic Aperture Geometry,With Filling 11
5. Synthetic Array Mapping System . . 12
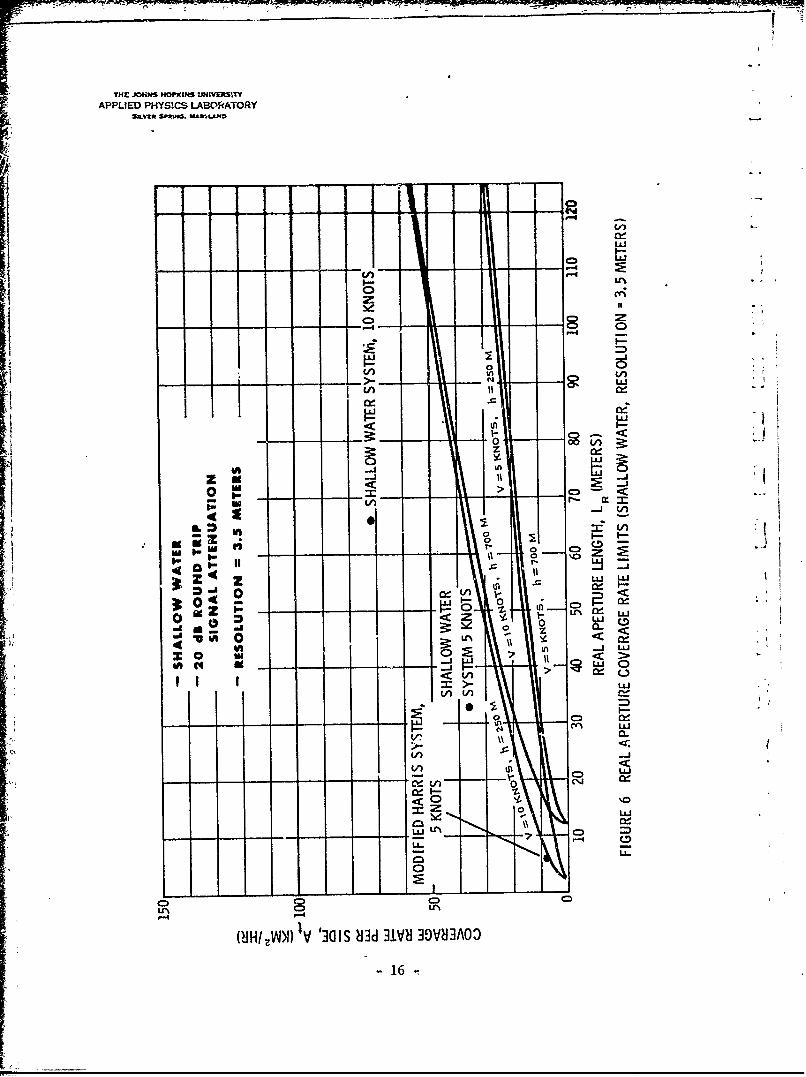
- 6. Real Aperture Coverage Rate Limits(3.5-meter Resolution) . 16
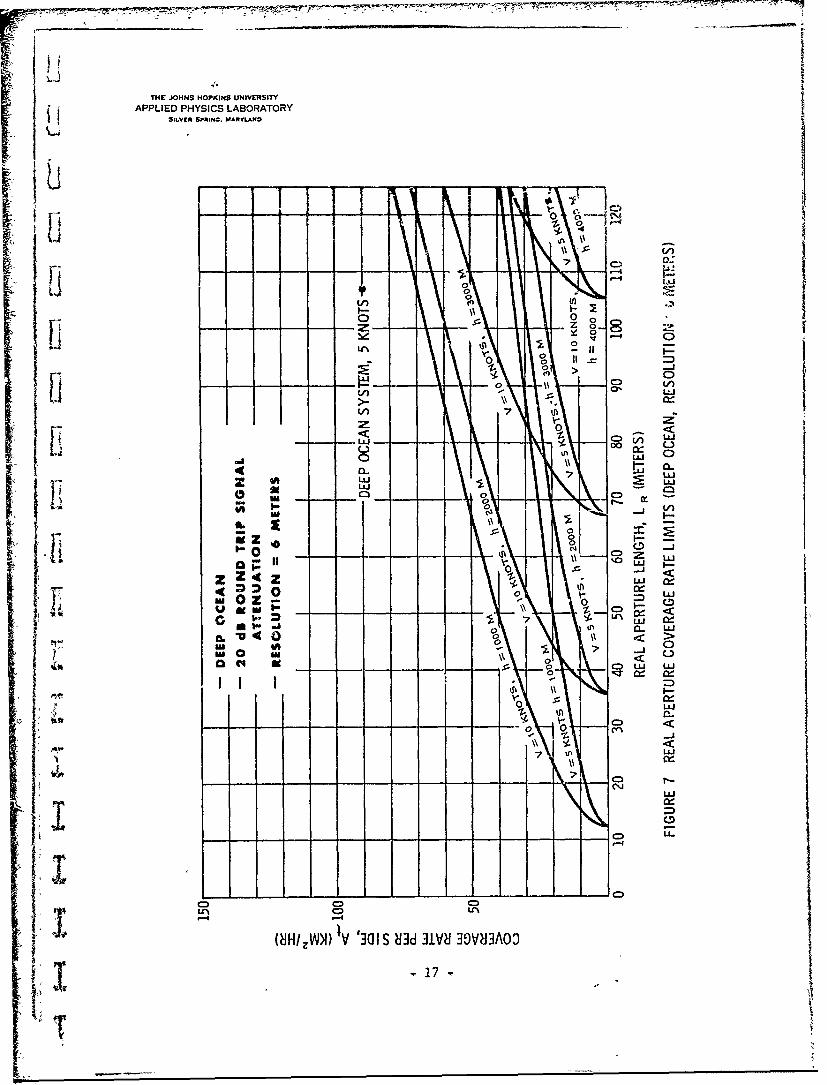
7. Real Aperture Coverage Rate Limits(6-meter Resolution) • • 17
i 8. Synthetic Aperture Coverage Rate Limits(3.5-meter Resolution) . . 20
9. Synthetic Aperture Coverage Rate Limits(6-meter Resolution) . . . . . 21
- 10. System Tradeoffs - Shallow Depths . . 22
11. System Tradeoffs - Deep Ocean Depths. . 23
12. Proposed Medium Stability Experiment. 31
13. Block Diagram, Synthetic ApertureSonar Processor . . . . 34
U . Precediom page bWank
- vii -
Iw

IL]"APPIED PHVSICS LBATCRY
24-" .SPacS Wa-oeA
Ii-TABLES
I2. Development Schedule and Costs - Exclusive. off Platform . . . . . . .. 27
T- 3. Mapping System Production Cost Estimates. 28
T"
I 1f U
L, [Preceding page blankVi
I
APPLIED PH4YSICS LABORATORY
PREFACE
This paper discusses synthetic aperture imageryapplied to the Seabed Treaty verification problem. Itwas written at the request of the United States ArmsControl and Disarmament Agency. The concept of "holo-graphic" filling of the synthetic aperture was suggestedby Mr. F. E. Nathanson; the discussion on data processingrequirements was written by Mr. A. M. Chwastyk, targetrecognition and identification by Mr. F. C. Paddison,and navigation at sea by Mr. H. D. Black. The major shareof unifying the report and the system analysis was doneby Mr. J. N. Bucknam.
"The Applied Physics Laboratory has been studyingthe general problem of new techniques for ocean aad ben-thic search and imagery as part of the Advanced HarineTechnology Prdgram for the Strategic Technology Officeof the Advanced Research Projects Agency.
To a large extent, the synthetic aperture systemdiscussed in this paper was drawn from a very comprehensivestudy performed by the Submarine Signal Division of theRaytheon Company on the feasibility of synthetic aperturearrays for high resolution ocean bottom mapping (Ref. 1).The system discussed in this paper for the filling of thesynthetic aperture array to suppress sidelobes is dif-ferent from that discussed in the Raytheon reports. TheRaytheon system uses a frequency-diversity technique toallow multiple pulses to be in the water simultaneously.The system discussed in this paper uses a coherent,fixed-frequency technique.
Preceding page blank| A
THE JOHNS HOPKINS UNIVF.nITY
APPLIED PHYSICS LABORATORYSS,2•SMl[N SPýt,IG SA4JYLAD
S' •"1. INTRODUCTION
ee Interest in mapping the bottom of the oceans hasTrecently received an increased impetus from the Seabed
" ~Treaty development and negotiations. The treaty, which
would prohibit the emplacement of nuclear and other weap-ons of mass destruction on the seabed, has been preparedby the United Nations, and has been ratified by the UnitedStates, the Soviet Union, and more than the number requiredto bring it into force. There is no explicit validationrequirement, or technique called out by the treaty for itsenforcement.
The United States has demonstrated a limitcd cap-"ability of locating and identifying objects or. the ocean
floor with the U.S. Navy ship Mizar when she located thesubmarines Thresher and Scorpion, the submersible Alvin,and the French submarine Eurydice. In addition to systemssuch as the Mizar's, a system for surveying large ocean orcontinental shelf regions to select areas for more detailedscrutiny by Mizar type systems is needed.
This paper examines the operational requirements ofa Seabed Treaty policing system for continental shelf ordeep ocean use and demonstrates" the suitability of anacoustic synthetic aperture surveillance system for such
U ta task.
SUMMARY
In the remaining portion of SectiDn 1 operationalreouirements of a Seabed Treaty policing system are out-I lined. It is then shown, by way of example, that con-ventional acoustic. imaging systems require excessivelylong hydrophone array lengths in order to meet these re-quirements. The synthetic aperture technique is suggestedas suitable solution to this problem, and a tutorialdescription of the operation of a synthetic aperture map-ping system is then presented.
1,* -1-
L)
THE JOHNS HOPKINS UNIVIMITY
APPLIED PHYSICS LABORATORY
.1,1-LV.ER SFRIS. MARYLAND
Section 2 more fully develops the tradeoffs be-tween conventional and syntheti c aperture mapping systems.System coverage rate limits ara found parametrically forb,)th systems. Tradeoff curves are then found that divide-;he coverage-rate/resolution plane into two regions: onein which conventional mapping techniques are desired;the other in which synthetic aperture techniques are pre-ferable. In shallow waters, such as those over a contin-ental shelf, real aperture surveillance systems can beused, producing reasonable resolution, though with limitedmapping rates. Real aperture techniques are not usefldin the deep ocean. The synthetic aperture is effectivein deep water as well as in continental shelf regions.
Cost and schedule estimates are presented inSection 3 for several hypothetical synthetic aperture sys-tems. A reserch and development program is suggested.
- Small-quant-ty production costs are estimated.
Risk areas are identified in Section 4; mediumstability, data processing, target recognition and inter-pretation, and navigational limitations are items dis-cussed. A feasibility demonstration system is suggested.
REQUIREMENTS OF A SEABED TREATY POLICING SYSTEM
From an operational standpoint, the task of Sea-bed Treaty policing is formidable. Effective policing istantamount to frequent and thorough mapping of thoseocean bottom areas that are potentially suitable forweapon emplacement. At the moment it is uncertain howmuch area must be mapped and how often the maps must beupdated. It is not unreasonable, however, to hypothesizean area 2500 km long and 120 km wide, or an area of 300 000km2 (this corresponds approximately to the area of the con-tinental shelf of the U.S.). If it is assumed that amonitoring platform operates for 600 hours per month withthe remaining 120 hours used for maintenance and refurbish-ment, a single platform must map 500 km2 /h to performmonthly surveillance of this area. Several platforms couldaccomplish the task at a proportionately lower coveragerate per platform.
-2

!ITHE JOHNS HOfIINS UNIVERSITY
APPLIED PHYSICS LABORATORYSILVER SPRIW4. MARYLAND
CANDIDATE MAPPING SYSTEMS
Existing Systems
A survey of the literatur (Refs. 1 to 3, andothers) and conversations with those in the field indi-
cated that tihece are three general surveillance systemsin use: optical systems with ranges less than 100 meters;mine hunting (scanning) sonars with ranges of perhaps 300meters; and sidelooking sonars with ranges up to 750 meters.Optical systems, although de3irable because of their highresolution, appear to be limited to use at low-coverage
T rates owing to the severe underwater scattering of light.Acoustic systems are more promising for generalized sur-veillance, although existing ones are capable of mappingonly 1 to 6 km2 /h.
Acoustic Imaging Systems
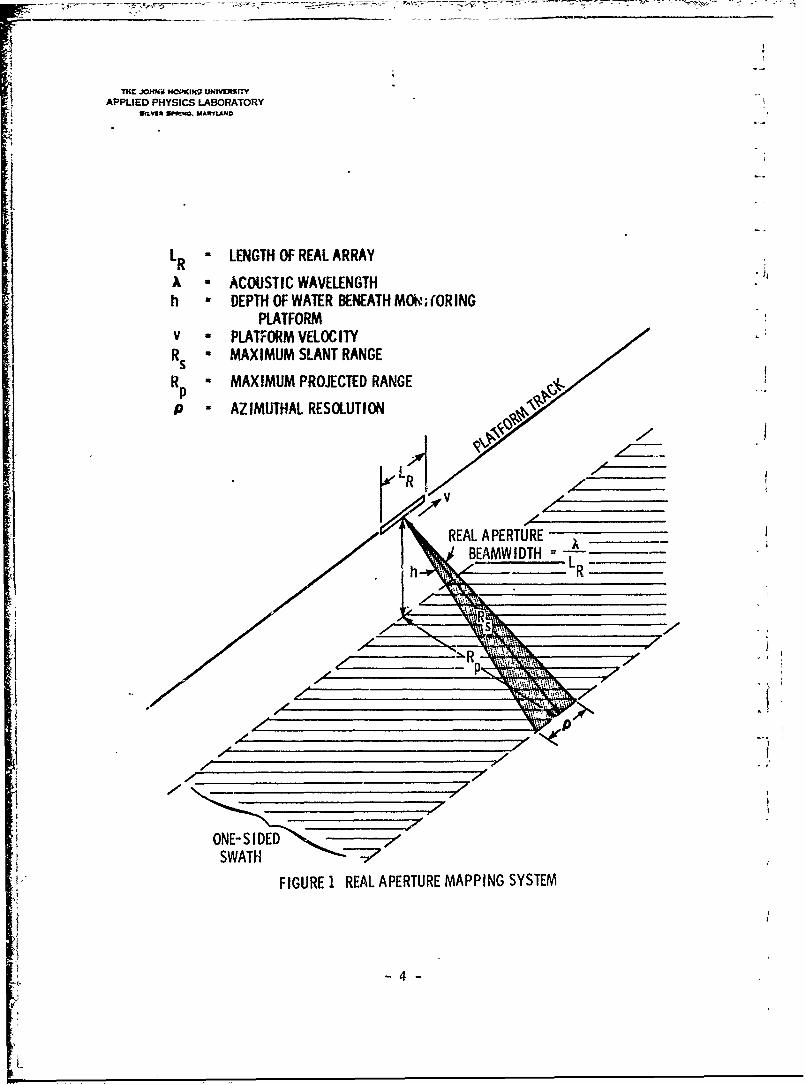
An acoustic imaging system in its simplest formconsists of a linear array of hydrophones of length LR"The array is mounted on, or towed by, a platform movingat a velocity v. At an acoustic wavelength X, the
azimuthal angular resolution is approximately X/LR radians.The basic geometry is illustrated in Fig. 1.
An imaging system of this type, which we shalldesignate a real aperture system, maps the ocean flooron the basis of return echo strength versus broadsiderange. Range resolution is achieved by using short pulses(or longer pulhes with appropriate receiver pulse compres-sion). Azimuth resolution, p, is determined by the widthof the receive beam at maximumn range:
m= ax
T3
* mrTH JOC9JMB MO-PKIM9~ UNIVKRSTIYAPPLIED PHYSICS LABORATORY
S!LVEX gPftG. UARILAJ4D
•.4
LR - LENGTH OF REAL ARRAY
-- ACOUSTIC WAVELENGTHh - DEPTH OF WATER BENEATH MOIN, ORING
PLATFORMv - PLATFORM VELOCITYRs "MAXIMUM SLANT RANGE
R MAXIMUM PROJECTED RANGE
p0 - AZIMUTHAL RESOLUTION
L/e R
REAL APERTURE ,•--hAMW IDTH-,
,00
,,
-011
ONE- SI DED"S SWATH -7
FIGURE 1 REAL APERTURE MAPPING SYSTEM

THE J Oe WCRSMAPPLIED PHYSICS LABORATORY
SNXZUn Spft ML*,.
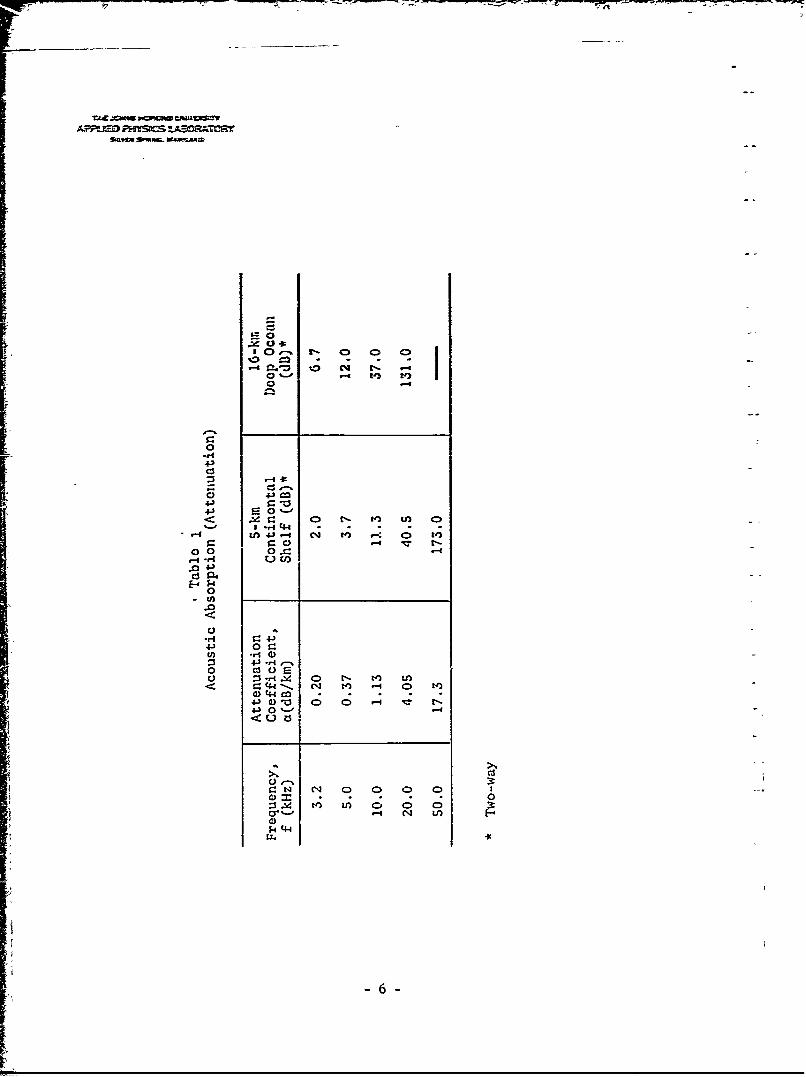
The limitations of such systems are best illus-trated by way of example. Suppose a platform is to mapat a rate of 150 km2 /h at a resolution of 3.5 meters. Thespeed of the platform will be assumed to be no greaterthan 10 knots in order that propeller cavitation noiseattendant at high speeds does not interfere with theacoustic imaging system. At this speed, echoes must bereceived from a maximum broadside range of about 5 km toachieve a coverage rate of 150 km2 /h. Accustic attenua-tion effects can be quite severe over such long ranges.These effects, which are frequency dependent, are sum-marized in Table 1. From this table we can see that amaximum frequency of about 10 kHz is indicated in orderto keep the transmitter power within- reason.
A 3.5-meter resolution at 5-km range requires abeamwidth of about 0.7 milliradian. The aperture extentmust therefore be at least 1400 wavelengths. At 10 kHzthe hydrophone receive array must be more than 200 meterslong and contain 1400 or more hydrophones, lest gratinglobes should appear. Still longer aperture lengths wouldbe required to suppress sidelobe levels without compromis-ing resolution at maximum range. Such arrays appear ex-y pensive and impractical.
The need for such excessively long hydrophonearrays can be eliminated by use of the synthetic aperture7' technique. The technique, which was developed for high-resolution radar imagery, capitalizes on the uniform lin-ear motion of the platform by synthesizing a long arrayfrom the stored echoes received by a short array at con-
"IA •secutive positions along the platform track. The systemis more complex than a simple real array imaging system
-- in that it requires the addition of appr:opriate datastorage and processing equipment ond inertial navigationequipment to provide precise information on platform de-iviations from the nominal constant speed, straight-linepath.
I
I -5-
APOLE FXSE L-= Am f
%~ ~V:
< Z - m In C
-4 En ~ 4--4Cj t
0 0
o 4JJ
443rAr-4.). r
Z l 04 C r- V) U) 0
400 0 ~ '-
4-) 0
.00
:s r 14 0 ) U ;C
4-44
wAv~ery simplified e rIation- of the meaocd ofa~a?~cSynthesis falle~s_ A platfoxim is Mowing Z.: can-
stamt depth znd speed zleng a straig~ht-lice trath- Mrateden the platfoxim is a tran~m'itlreceiwe 2r~ay of hydrrop2ýeswA::h idezriezl tzransmit and recei-re pztterns shzped zszl1iustratied in Fig.. 2. As the rehicle trayeerses its path,an accustiL.c pulse is em~itted ewvery T secomis, 2a~ the re-turn echoes are ccheremntly =3;ped and stored at each rangebin- The interpulse perricd T is equal to the rc~rd triptime to the =-xinn range of interest,
idiere c is th-e sou-nd propagatio eelocity- As the 0chfrom the last -range bin is s2=ped, the platforn has zoveda distance equal to its vellocity timea the intexrpulseperiod, or
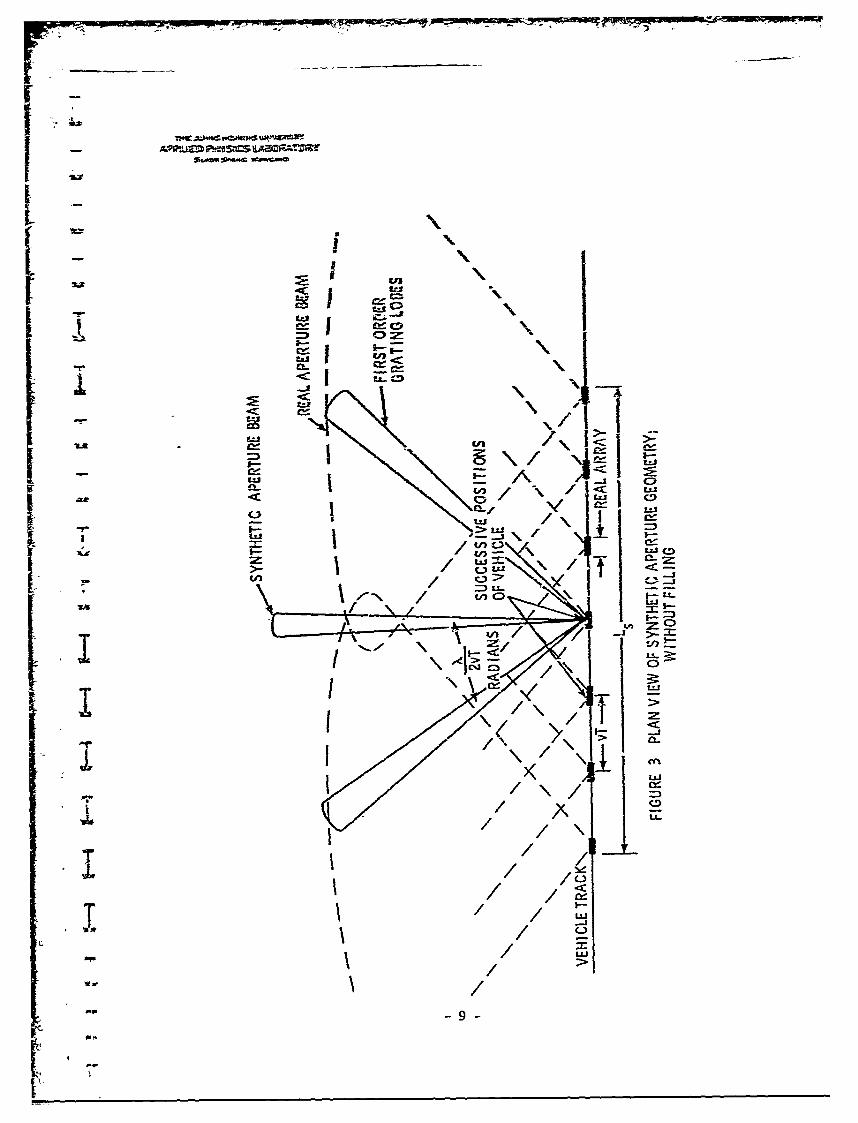
At this new, position, another pul se is emitted, and theprocess reveate~d. The szo-ed echoes are retained untilthe platform- has travelled a distanee equal to the deiiredsynthetic aoertur.': lrangth, Ls. The sýýr of stored echoessresembles thie outp- xs o~f an array of elements of lengthLs- with interelemerl spacing vt. The geometry of the syn-thettic array is shown in Fig. 3 The beam is now. synthe-sized by coherently sunmming the stored echoes.
For a given synthetic array length, Ls, the syn-L thetic beamwidth is )A12Ls, or one-hal.f that for a real
array of the same length. (This improved resolution re-sults because the individual radiators in the syntheticarray are seouentially excited, whereas in thc real. arrayall elements radiate simultaneously.)
The length of the real transmit array should be nomore than twice the desired azimuth resolution. Thisensures that thic beamwidth of the real transmit array iswide enough to illuminate a target over the entire length
ao of the synthetic array.
~7-

CCD
-r 1 AX
-r \a
'-UWC
LuL
LZJ
ii Ii
C-)D
LLLL
_Imnlee~tatien of a synthetic apertuLre sorar system-is further coqplicat~ed by two effects:
i- Sec.se of the relatively low sueed of so&.Md,the platforn travels an appreciable dist=_ce in an inter-pulse peiod.. This resultsin a "thtined" synthetic array,one in dhich the interelement soacings are many wa-e-lengths. As a rasult of this t•him. ess" of the array,second and higher order grating lobes (m-desired side-lobe responses equal in magnitude to the Mainlobe) appearin the synthetic array pattern. These are illustratedin Fig. 3. One w•ay to eliminate these grating lobes isto fill the along-track distance between successive pulseswith a linear array of receive only hydrophone subarrays(see Fig. 4). The resultant array pattern is then theproduct of the patterns of the thin synthetic transmit --array and of the filled synthetic receive array. In
order that the grating lobes of the transmit array pat-tern be cancelled, the synthetic receive array patternshould have nulls at the locations of the grating lobes.If the length of the real receive array is twice thedistance travelled by the platform in an interpulse period,the grating lobes will be properly cancelled (Ref. 4).Figure 5 depicts the operation of a synthetic aperture sys-tem with proper real receive array length.
2. In the seabed surveillance problem, most tar-gets of interest will be in the Fresnel zone of thesynthetic array. This complicates the required process-ing in two ways. First, a given target is not at thesame range from all elements in the synthetic arrvy sothat echoes from a given target will appear in differentrange bins, determined by the position of the pulse in thesynthetic array. Second, quadratic phase corrections willhave to be applied to the data in order to focus the syn-thetic array. These problems add to the complexity of thesignal processing.
One final complexity required of the processor inany synthetic aperture system is the ability to add phasecorrections to the stored data to compensate for devia-tions the platform takes from its nominal speed andpath. An accurate inertial reference is therefore re-quired to measure these deviations.
-10
LdL9
00C
uEjCC) In5
L CL IL -C){L
LLJMr :I In a.
-oA 7L
C-- CD,
C.).
I LL.
/ CC)
/ I--/n a. i
/j>-
I> /
1;4-11-
APSCLIW2 F%-YS.UZS LSSAT=amoRY
0 I0LLA -4c"
Lu L-
_-_j ~t
< ~AV) J> J OL
Li.. LL VjIL V
I- U .
If- 12L <
AFFUED PHYSICS LA90RA-ORY
2. SYSTEM TR1ADEOFFS FOR REALAND SYNUhETIC APERTUILE SYSTF-S
In this section we shall explore parametrically thecoverage rate and resolution capabilities of acousticimaging systems. We shall do this for both real and syn-thetic aperture systems, after which we shall compare thetwo. Comparison will yield tradeoff curves that indicatethe parameter break points at which synthetic aperture
,- -systems are to be desired over real aperture systems.
"An acoustic imaging system, whether real or syn-thetic, achieves a coverage rate At determined by thevadocity of the platform (carrying the energy source) and
-- the maximum broadside range from which it receives use-ful returns:
.11 A = vRp per side. (1)t p
is the projection onto the ocean floor of the maximumslant range, Rs. These two ranges and the depth of thewater below the platform, h, are related by:
R 2 h 2 +R 2 (2), s p"
Thus,At =v s . (35)
U For a given platform velocity, v, and depth, h, the cover-age, At, is maximized by finding that system with the
Sgreatest useful Rs.
REAL APERTURE MAPPING SYSTEMS
For a real aperture mapping system, the maximumslant range must be constrained by the desired azimuthresolution, p, and the diffraction-limited beamwidth ofthe physical aperture, X/LR:
F Rs P/U , ' (4)13c
mHC .40M 0pG m LveXD e WaSnTAZ'PUED PHYSICS LABORATORY
where f is the acoustic frequency, A the acoustic wave-length, c the speed of sound in water, and LR the lengthof the physical aperture. Thus, at a water depth h,
-s pvf ( c ) C•R2
At = k2-h2 < c LR 1- per side. (5)
The 'aperture rust move no more than one aperturelength durhiig an interpulse period T or "holes" willappear in the coverage. Thus,
vT < LR. ()
Since T must be at least the round-trip propagation timefor a target at maximum slant range:
2R
" S. T> s_. C(7)
and we have from Eqs. (6) and (7) another constraint on R
R< cLR (8)Rs -2vC8
and, hence, on At,
At 2-h2 < cL (RV 1,2vh0 2At Vs - 2 1- per side. (9)
Absorption effects in the acoustic medium producean exponential decay in signal power with propagation dis-tance. This effect is described by the attenuation co-efficient, ca(F):
ac(F) = 1.09 •--_-- + 400 " + 0.000275F2 dB/km,Il+ r= 4-1-00+=FL (10)
where F is the acoustic carrier frequency exprcssed inkilohertz. If a is the maximum tolerable path loss ex-pressel in decibels, then another constraint on Rs andAt is:
0- -I- -
THI' 10"NS DOFPKINS L~watrmTyL .APPLIED PHYSICS LABORATORY
S< a 02ct(f) (1
and
At -=v./fi-h2 va 0 IF: I- :Pir per side.
2VC5 -"cY 01
b•2a(F) (a 0e side.
For a given set of parameters p, v, f, ao, h, andt LR, the minimum value of the three upper bounds on At ofEqs. (5), (9), and (12) determi.ies the maximum coveragerate for a real aperture syst•;m. Furthermore, for anyp, v, s, h, and LR, an optimum acoustic frequency f canbe found that maximizes the minimum value of the threebounds. This optimization is easily done (in an analyt-ical sense only; in the hardware world, one may be con-strained to use other than the optimum frequency, givinga lower coverage rate). A resulting set of curves ofmaximum coverage rate at optimum frequency versus realaperture length is shown in Figs. 6 and 7.
SYNTHETIC APERTURE MAPPING SYSTEMS
r iFor a synthetic aperture of length Ls, the angular
resolution is X/2Ls. Thus, to achieve an azimuthal re-solution p at the maximum slant range Rs, we must have:
t~i XR_s sp. (13)
The interpulse period, T, must be at least the round trip
propagation time from the end of the synthetic array to atarget at maximum slant range, Rs, broadside to the array.That is,
T 2 RT) 2 (14)
S- 152
THE JOH~NS HOPKSNS WUNVERSITYAPPLIED PHYS!CS LABORtATORY
I--
-I-
00
wl tnN IN 1
11- -
-Ji
-Z Lii
I=.
LgLii
<0 .z.o
0 0 DI.- I---<
0 r Y
4(/~)~ 1 1clI in~ 3JjV 39H3z~~ ~ ~ 16m1 ý
in C4 I
THE JOHNS HOPKCINS UNIVMRITYAPPLIED PHYSICS LABORATORY
SILVER SPRING. MARYLAND
Ki 0
II-00
0 >
z 0 <
p; z~liIm il CD~ ItK 0(1 U
7 LLU
0 w0 c.'J
ju 0 z -ue
07{Iw <
-------------------------------------------------------------------Ii~~~~~~~~ >~H~~)1 GS ~ IHJV3O7i < 1)
L0T -NZ _ U
THE .0HINS HOPKINS UNIVIERSITY
APPLIED PHYSICS LABORATORYSOLvlI SF,,nG. MAXYLA.,
Using Eq. (13) to eliminate Ls from Eq. (14), we obtainan upper-bound value of R of:
ET~ [1+ (X) -1/2 (5R s <_ 2- I+ ) 2]
To suppress grating lobes in the synthetic array pattern,the real receive array length, LrR, must be twice the dis-tance travelled by the platform in an interpulse period,
LrR =2vT. (16)
This equation aliows us to eliminate T from Eq. (15):
< cLR 1+r -1/
Rs 4V [ 2] (17)
Thus we have a bound on At:
rjCcLRj 2 11/2t R = v SR _ v -4v)2 -h
2 per side.
4p (18)
Attenuation caused by absorption effects limits themaximum range in a manner similar to the real aperturesystem, although the attenuation limit, ao, in this casemust not be exceeded at the end points of the syntheticarray for a target at maximum slant range, Rs, broadsideto the array. Thus,
IL ) 2 a+ < 0 (19)s - 2a(F)'
where a(F) is given by Eq. (10). Eliminating Ls from Eq.(19) by using Eq. (13), we obtain another bound on Rs:
a a 0 [+s [2a(F) i 2] 2ac(F) [(4- 2 -1/ (20)
The corresponding bound on At is:
18
IT
ThE JO"NS HOICNS UNVERSTY
APPLIED PHYSICS LABORATORYSILVERt SPRMG. M mnwAND
[a_2 1-1/2At y= - i [+ C--2 - per side. (21)
• 1+ "
For a given set of parameters p, v, f, ao, h, andLrR, the minimum value of the two upper bounds on At ofEqs. (18) and (21) determines the maximum coverage rateof a synthetic aperture system. As in the real aperturecase, the frequency f can be optimized for each particularset of values of p, v, ao, h, and LrR to maximize the mini-mum value of the two bounds. This optimization resultsin a set of curves of maximum coverage rate at optimumfrequency versus real receive aperture length. A set ofsuch curves is shown in Figs. 8 and 9.
COMPARISON OF THE SYSTEMS
To understand the necessity for a synthetic aper-ture approach at large coverage rates, one need only ex-amine the coverage limits of Figs. 6 to 9. It is seenfrom the curve3 that, for shallow depths and very lowcoverage rates, real aperture systems accomplish the re-
SVquired coverage with shorter aperture lengths, while athigher coverage rates, synthetic apertures require muchsmaller real apertures. The actual break point betweenthe two systems is a-function of p, v, h, and aO.
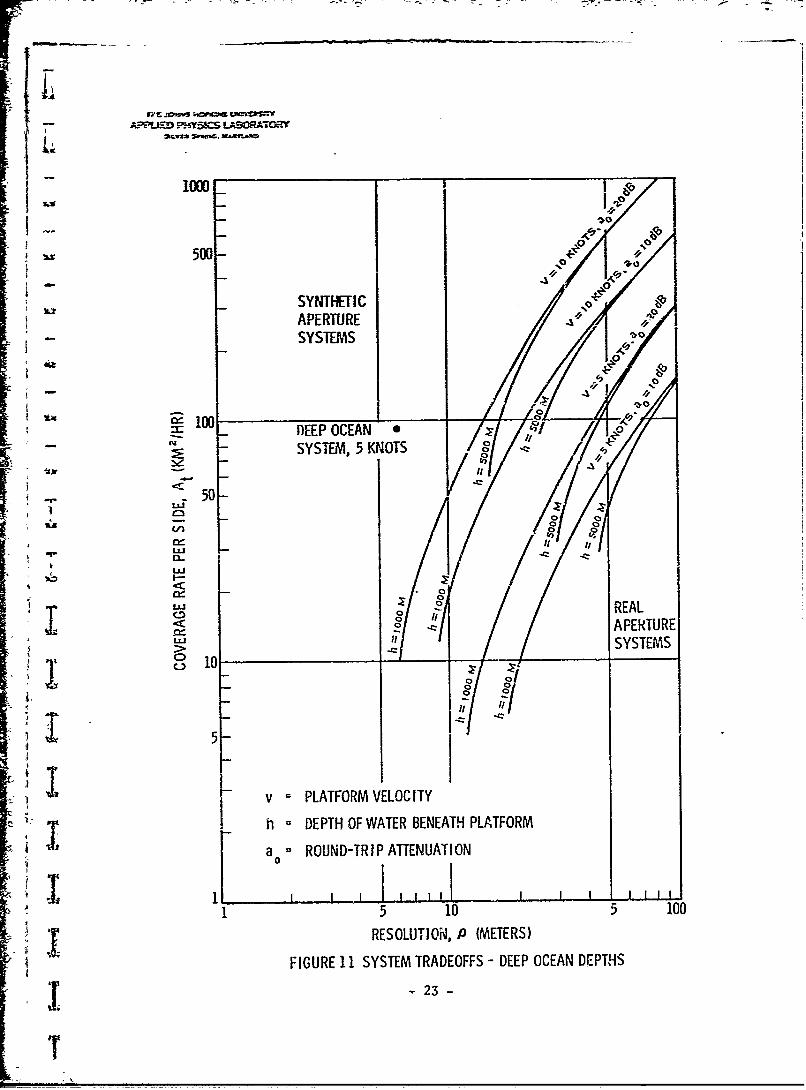
The loci of the break points are plotted in Figs.10 and 11 for several combinations of velocity, depth, andattenuation limit. These loci divide the (At, p) planeinto two regions: (a) in the region above and to the leftof a given locus a synthetic aperture system can map atthe required coverage rate and resolution with a shorterphysical aperture length than a real aperture system re-quires; (b) in the region below and to the right of thegiven locus, a real aperture mapping system requires ashorter physical aperture length. It should be emphasizedthat these tradeoff curves have been drawn with physicalaperture length minimization in mind. The processor com-plexity necessary for synthetic aperture synthesis is con-siderably greater than that for the real aperture case.
-19
r
THE JOHNdS too9Kpe L*MvEptrrn
APPLIED PHYSICS LABORATORYSE.YZR~ SI&.G. MATL&,c3
-n-
z ILLJ
I--,
I JI
Z NN)Z
LI=)
U))
0 (L Lii
-IL
U) 8 0 = )
mgLi -. A-
M a~II--------------------------- L)
Z zUW)ý c lii
Li> 00
L -~n - -HzN <no CJ,
y1 211
Li
20 -
APPLIED PHIYSICS LA9CRATORY
uii
00
02 0p
IL UN
T3-
a-lit
mI m LI ýC) m
0C4I UWN I- V 31LNd3V 3V3
~1 Li21
APP-JED PW. SaCS LA.R'ATOMY•9X S MIlll "' ' * "t
PLAF•ORM VELOCIrYi
h - DEPTH- OF WATER BENEATH PLATFOPUM509- a°D - ROUND-TRIP ATTENUATION 2
SYNTRETiC #
1 -PERURE
10 SHALLOW WATER A& 4-YTM 0 KNOTS
50- SHALLOW' WATER- SYSTEM, "5 KNOTS
,v REALC~o APERTURE
,.v SYSTEMS
I~ .,
> MODIFIED HARRISF1I R 1SYSTEM, 5 KNOTSYA- S
5 - 0
1 5 10 .50 100
RESOLUTION, P (METERS)•-FIGURE 10 SYSTEM TRADEOFFS- SHALLOW DEPTHS
• -~22.
AP=5VZD PHYSSCS LASCRNFOR
1000 blo
sx 500-
w SYNTHETIC o
APERTURE
- SYSTEMS
2- 4'! !04• ~~10,
10- DEEP OCEAN * I
_SYSTEM, 5 KNOTS C
-F <a50-, , 0-I Lii - I
REAL
•-- v =PLATFORM VELOCITY
•"I_ h= DEPTH OF WATER BENEATH PLATFORM
a ROUND-TRIP ATTENUATIONSI - 2le
0 T0 0
I I I f ~ ill I - II1
5 5c 105 0
'23;
APPUED PHYSICS LABORATORY
Thus, for system requirements in the vicinity of the trade-off cu-ves of Figs. 10 and 11, special consideration shouldbe given to the relative merits of short physical aperturelengths and simple processors. In many cases it may beprudent to settle for a longer physical aperture lengthfor the sake of a simpler processor.
Also plotted in Figs. 10 and 11 are the operatingpoints of the four specific synthetic aperture systemsto be discussed in Section 3.
- 24 -
THE JO 4sOOPKIU W(rVRSII
APPLIED P4YSICS LABORATORY
* L7- 3. SCHEDULE AND COST ESTIMATES
In light of the system capabilities determined inSection 2 and the operational requi-rements of a SeabedTreaty policing system briefly considered in Section 1,three synthetic aperture surveillance systems are postu- Slated in this section. Order-of-magnitude development andproduction cost estimates and approximate development timesare included for each. In addition, the costs and develop-ment times of a suitable feasibility demonstration systemare estimated. It should be emphasized that all cost anddevelopment time estimates in this paper are, at best,educated guesses and are not to be construed as anythingmore than order-of-magnitude guides.
All the systems discussed in this section have beenplotted on the system coverage limit curves of Figs. 6to 9 and on the system tradeoff curves of Figs. 10 and 11.
SUGGESTED SYSTEMS
Shallow Water Systems
To monitor continental shelves or other shallowwater areas, two alternative synthetic aperture systems aresuggested that are capable of two-sided mapping at cover-age rates of 72 and 144 km2 /h. The slower system travelsat 5 knots and processes 200 seconds of data to form thesynthetic aperture. The faster system travels at 10 knots,requiring half the processing time but twice the real arraylength of receive hydrophones. Both systems achieve3.5-meter azimuth resolution at a maximum range of 5 km andoperate with a 3-kHz acoustic carrier frequency. Thischoice of carrier frequency is not rigid but was chosen forits low attenuation coefficient and because sonar hardwareexist that operate at this frequency.
Deep Ocean System
For monitoring deep ocean depths, a 6-meter resolu-
- 25

mHC JOHNS 4OPKhIP UN2VESflyAPPLIED PHYSICS LABORATORY
SU.VIR 20*004. MAwywt"
tion system is suggested. The platform travels at 5 knotsand processes 320 seconds of data. Its maximum range of16 km give the system a two-sided coverage rate of18G km2/h.
Feasibility Demonstration System
A very low coverage rate system is suitable fordemonstration of the feasibility of synthetic apertureacoustic mapping systems. The demonstration system couldbe fabricated from the modified Harris, Model 853, NarrowBeam Echo Sounder described in Section 4, operating at anacoustic carrier frequency of 12 kHz. The system wouldprovide a 16 km2/h two-sided coverage rate with a 3-meterresolution at 900 meters maximum range.
DEVELOPMENT SCHEDULE AND COSTS
Preliminary to assembly of a demonstration system,measurements should be made to determine medium stability.This experiment, which is described in Section 4, shouldtake from 9 to 12 months to complete and cost from$100 000 to $150 000, including data reduction.
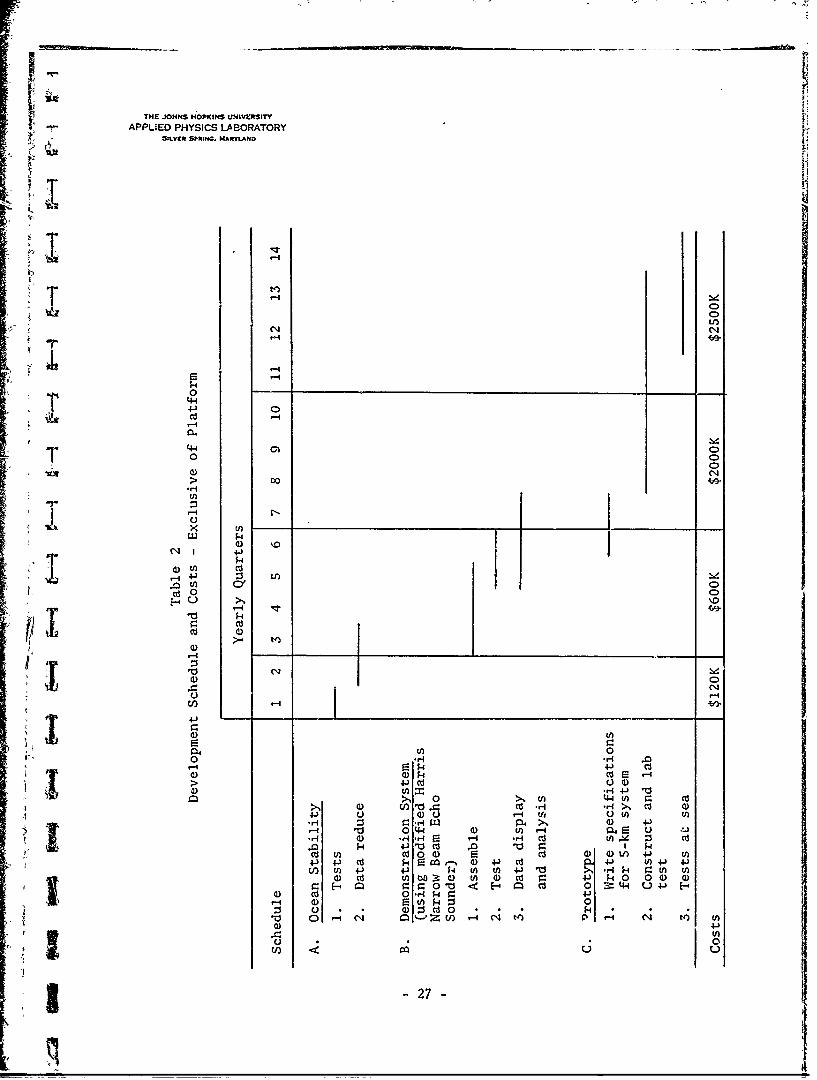
Following completion of this experiment, a demon-stration system can be assembled from the Harris equip-ment, a multichannel tape recorder, and land-based dataprocessing. This program, including test, could be com-pleted in 1 year. Specifications for a seagoing proto-type could be completed in another 3 months and the pro-totype system assembled from existing parts in another 18months. Thus, assuming funding levels shown in Table 2,a working prototype could be available within 3-1/2 yearsafter initial experiments.
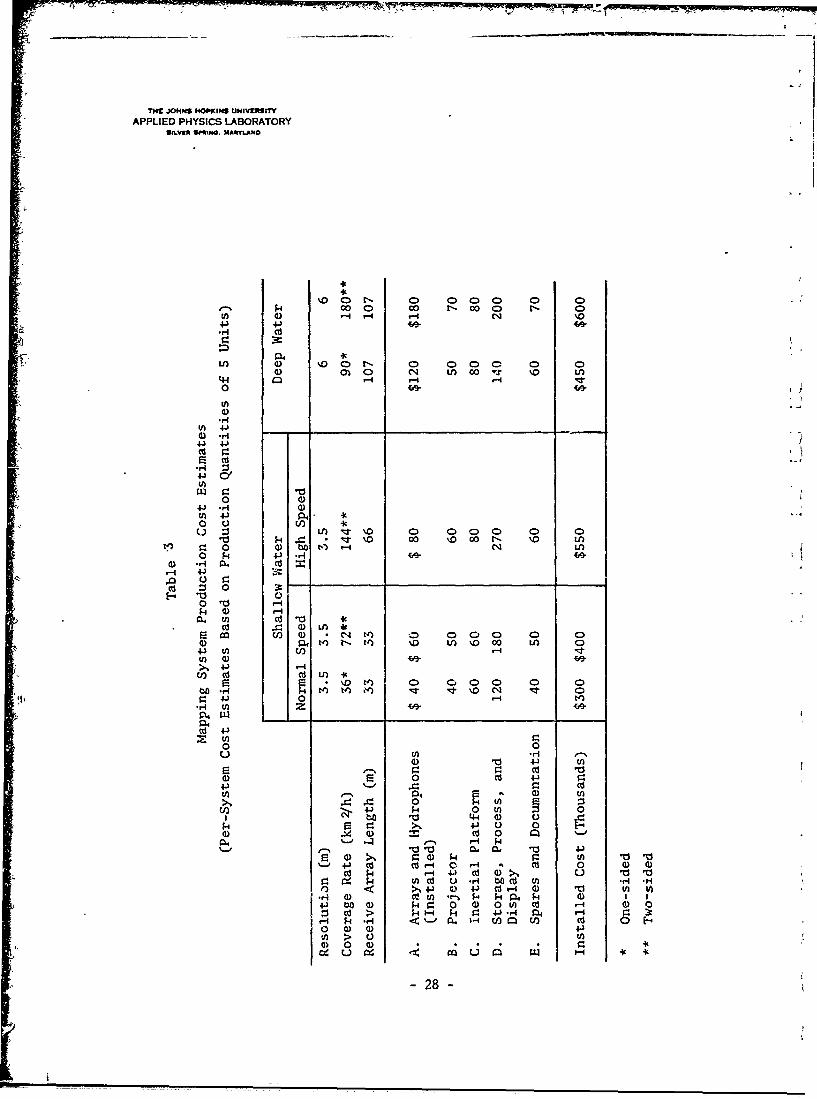
PRODUCTION COSTS
Estimates of mapping system production costs, basedon production quantities of five units, are presented inTable 3. Cost estimates are presented in this table forthe systems discussed in this section, in one case for botha one- and two-sided coverage system.
- 26 -
THE JOHNS HiOPKINS UNIVERSITYAPPLIED PHYSICS LABORATORY
-41
C4-4
0.
0 0Vs 0)
;> 00
C.)
ri4J :i!s w!r!'1>
V) 0J0~~ rjr-
1- 4J0J) .d r= -
> 4-27- Q
THE JOHNS HOPKINS UNIVKE"IlYAPPLIED PHYSICS LABORATORY
SlLW* SMfiu. )4ARYLAND
0.0 C) 0 000 0 C0oo4 0 00 CO C- 00()C
U) .4 -4 4 C14 NO0
0
a)
+-) 4.)_ _ _
4-) 4.)
0
O 0U) 4.) C4) 0 0 C) C
\ I) ~ '0 00 0\0 0 0 0-\o0 0 )0 4 1:4) '-4 C14 LI)
O k. 4.) *rI 30 ri 0. cd
:3 0'U 0
1.4 t -Id 10 Im. U) eq' 4. 0
Q P4 COO r- C)l~) \D 0%000 0i 04.) U) CO-4 t
U) 0dcd I
1- tý %D m C) 0 000 0 0
41) 0
O 0
0 4Jc '4- 4 .4In '-'a) 0x) 0 .
U). 4 o 0 tAII = :4. - 0 U)
'U (44-04J4 B d c -0 4.)C 0 0)
0d $4 0- 4 Cd 0) U r04 C4 k n d -41i t d I
0~~~~~ <) >, '0 J( r44 U )t~.-4 d) ( d I -r-%- 0 4 H la, 04 0 0I44J 00 0 9 0>. V) 'U 'U 4
I) > $4. P:04.) C-H 0L 'U4 (9 3:k~- 0 H I'%. I-I U.4 1.P U)4 0
0 00 4.)
0)0 a) 04
-28-
ThE JOHNS HOPKINS UNIVERSITY
APPLIED PHYSICS LABORATORYSILVERt SPRING. MARYLAND
4. CRITICAL AREAS AND FEASIBILITY DEMONSTRATION
CRiTiCAL AREAS
Synthetic aperture mapping systems achieve theirhigh coverage rates by coherently processing acousticechoes received over long periods of time, over longspatial separations along the vehicle track, and from longslant ranges. The following areas are therefore criticalto their success as mapping systems.
Medium Stability
The most crucial issue is that of medium stability.The ocean is a turbulent medium. There exist within itrandom inhomogeneities constantly undergoing turbulentmixing. This mixing of "patches" of water at varying temper-atures gives rise to a random thermal microstructure with-in the sea that varies with time.
Acoustically, the effect of this inicrostructureis to produce a random spatial and temporal variaticn inthe phase and amplitude of an acoustic wavefront that haspropagated through the turbulent region. Because thevelocity of sound is determined by, among other things,the temperature of the water, the time of arrival of anacoustic ray that has propagated through many patches ofvarying temperatures varies randomly about a mean value.This causes a random phase component in an acoustic car-rier frequency. In addition, the turbulent patches actlike acoustic lenses on a wavefront with spatial extent,causing random focusing and defocusing of the wavefront.The most turbulent regions of the ocean are at the surface,along the boundary of stratification of water density dueto severe thermoclines, and in boundary regions betweenthe general ocean and strong ocean currents. The firsttwo of these can be avoided by transiting the real aper-ture at such a depth that it is normally below them.This can be done either by placing the system on a sub-marine or towing the array underwater. In either case,the data stabilization system requirements are simplersince these are both quieter platforms.
Clearly, the performance of the synthetic apertureimaging sonar, which relies particularly on phase co-herence between succes.ive synthetic aperture elements,is potentially limited by tha medium instabilities well
- 29 -

7Tf3
THE JOHNS HOPKINS UNIVERSITY-
APPLIED PHYSICS LABORATORYSILVIft SPR3NlG. MARYLAND
Tim
Iii
I
V)I
Ix .) --J
N N _"
W ..--
C..' .. •! I •I
ITL
LAJU
,!-
zz
C)
tt Z L_ c) 2
TH AOMNS HOPKINS~~t UNFE5Tqf•lR YAPPLIED PHYSICS LABORATORY
S4.vza Se•.. MAILMu0e
periment, followed by laboratory checkout of the experi-mental apparatus and data reduction algorithms in a con-trolled environment, and finally the measurements them-selves. This experiment should take from 9 to 12 monthsto complete and cost from $100 000 to $150 000, includingdata reduction.
A mention of the state-of-the-art of towing arraysbehind a ship or submarine is appropriate here. Thereis considerable effort in this field of technology today,and it will probably change drastically in the near future.
Data Processing
The storage of raw data and subsequent formatidn ofthe synthetic aperture image requires a data storage andprocessor of moderate complexity. A fairly detailed look -
has been taken at the structure of the processor requiredto implement the shallow-water normal-speed system dis-cussed in Table 2(Ref. 6). A brief review of the systemfollows.
A platform consists of a 5-meter long transmitterarray and a 64-element, 33-meter long linear receive array.A burst of a carrier frequency (5 ms of 3 kHz) is trans-mitted at time intervals corresponding to the time ittakes the receive array to travel half its length (6.6 s).The receive elements are connected so as to form eightsubarrays of approximately 4-meter length apiece, eachhaving a broadside beamwidth of uO.12 radian. Outputsof the subarrays are demodulated, sampled every 5 ms, dig-itized, and stored into a core memory. One-thousand re-turns, corresponding to as many range bins, from each pulsetransmitted and each of the eight subarrays are stored ina sector of the memory. Subsequent received sets forother transmit pulses are stored in memory sectors sothat, as the 32nd set is being received, the previous 31sets are available for synthetic aperture beamforming.
-32
THE JOHNS MM*APPLIED PHYSI E-J ORATORY
[ ij SILVZR S,"i00. MARYLAND
The processing is done in three basic steps:
1. Returns from a given area of ocean floor (essen-F tially from an area of 4 x 33 meters) are re-
called from tha memory.
2. Phase corrections, for geometric and timingconsiderations, are applied to each return.
3. A broadside beam, located at the center of thesynthetic array, plus adjacent beams on eitherside of center are formed to resolve the 4 x 33meter area into eight resolution cells ofapproximately 4 x 4 meters. Steps 1, 2, and3 are repeated for each range bin. The imagingis achieved after the ship has transited the
p area; consequently, the image formed is one-half the length of the synthetic aperture be-hind the position of the real array.
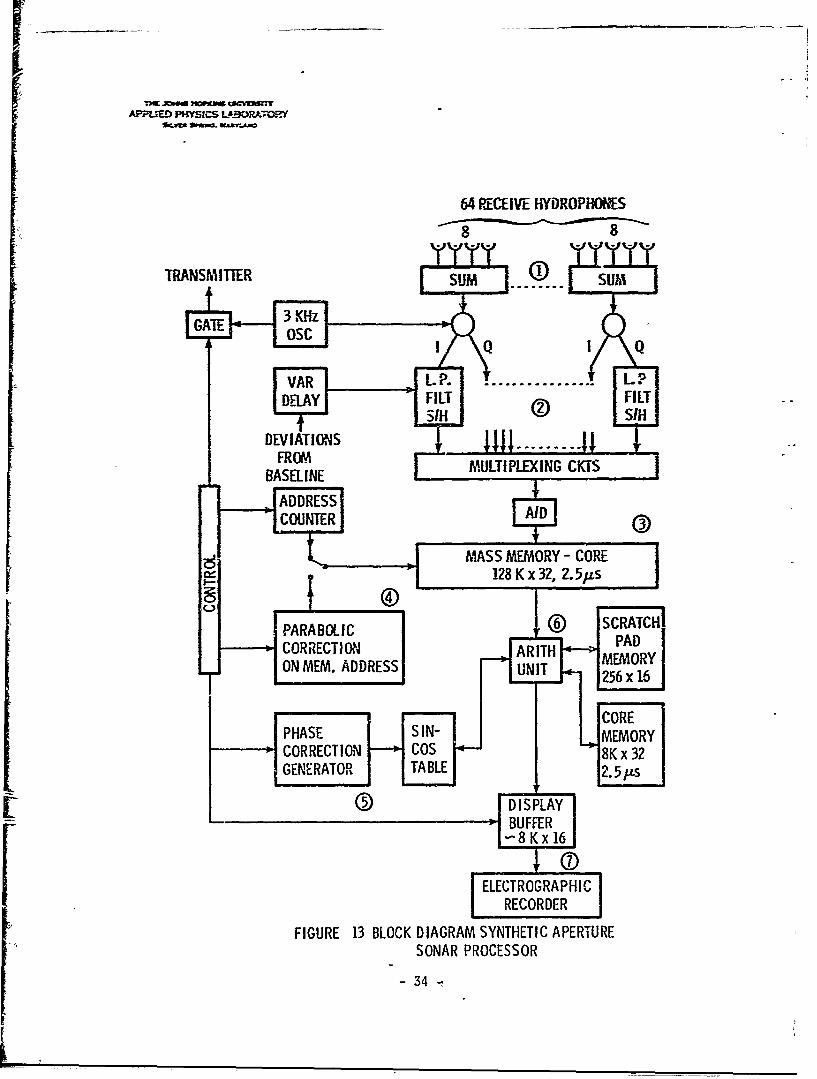
-F A preliminary block diagram of the system is shownin Fig. 13. The numbered areas are described below:
1. The 64 hydrophones are arranged in subgroupsof eight adjacent hydrophones each. Outputs of all hy-drophones in a subgroup are summed (analog) to form over-lapping broadside beams.
2. Outputs of each beam are demodulated into in-"phase (I) and quadrature (Q) channels. The bipolar out-:; puts are then low-pass filtered (200 Hz) and sent to asample-and-hold circuit. The sampling time (as well asthe transmit time) can be varied to allow for platformdrifts, i.e., deviations from baseline. The outputs ofthe sample-and-hold circuits are multiplexed and digitizedat a 3200 Hz conversion rate.
3. The memory must store 1000 (or 1024) range gatedreturns from each transmit pulse for each of eight beams"for a total of 16 000 eight-bit words. A total of 32 ofthese "Tx sets" must be stored, rcquiring a memory of4 x 106 bits with a probable format of 128 000 words x32 bits per word. Memory write cycles should have pri-ority over memory read cycles to prevent a buildup of data
§ between the A/D converter and memory.
* 4. Memory addresses for readout must reflect theparabolic range correction factors. This can be done byusing the perpendicular range as a base address and
- 33 -
•mJ
APPIjED PHYSICS L'.!J-B------Y
64 RECEIVE HYDROPHONES
8 8
VA L J ................ LFDE, A Y I FFILT
DEVIATIONS lilt -
FROMBAEL MULTIPLEXING CKTSBASELINE
ANEO. ADDRESSR- C ORE
FOTER RR R E
A P ESSORYASS 34 COR
12,8 K x13,2./L
CORECIO ELETORAHI PA
RECORDERE
PHSESINAR PROMESSO
CORECTON Cos8K4 3
APPLIED PHYSICS LABORATORY*LVGm e "l60. MAUYLAND
adding correction factors that are a function ofTX setnumber and range.
5. Parabolic phase corrections are required toobtain a coherent set of data for a given range. As dataare extracted from memory, phase corrections are fed intothe arithmetic unit. Since the phase function is con-tinuous with respect to the subbeam position, phase cor-rections can be generated or calculated from prestoredplus interpolation constant data. This would yield anangle that would address a sine-cosine table. The sine-cosine table is also used for rotations required for form-ing the fillin beams. As the raw data are extracted fromthe main memory, the corresponding phase corrections areapplied to the data prior to its storage in a small rel-atively high-speed memory.
6. The processing to be done on the now coherentset of data, ux, to obtain along-the-axis cells, Ub, is:
+64Ub = u expi (-2rkb/128y),
x=-63 x
where b = beam position relative to center of synthetic
aperture data set = -3, -2 ... +4,
y = perpendicular range,
x - subarray spatial beam position index rela-tive to center of array (128 nonoverlappingdata points),
k/y = beam shifting factor so that along-the-trackresolution cell positions remain constantwith perpendicular range.
The above equation must be solved for all perpendicularranges between transmit pulses. Also, it should be notedthat each Tx processing cycle, produces overlapping finebeams, covering identical spatial positions but from adifferent-by-one set of Tx returns. These are combinedcoherently, thereby requiring additional memory storage ofapproximately 4k x 32 bits,
7. For processing efficiency the output of the
processing unit is a series of seven "x" (along the
a 35 -

r rc.s th of= a hofr. T.e m • . ..... s-:i--oe "
WO.. bor 6wis.W 1 bi-s!.
Stlarge ly res far e& ystod• i n c -
position &e•l~ t.o platýr =-ck - ie ro~hesq omea f_--• •
ccz. c•£o o imae for y is _"• os - c, th ana
iz.for y e e lose crd rhir ofresea aerto p r
Stero s iS packe lsfres ilkose txFcsat e by c•o~ syt0
higherTur h21 1 in ose rCZs •senoally aX.-s re mncoara. as toeWell aos stic rajes,. Alcl•tgti2cinepzulebeqcarae of azee ofn heas barg ohe endsoieomd sradr ofethri
• ter.ost og o the anie•enry.Fr~thrre ithey anodnte oe
sciteicngan is epentienai uof taret tuhnessi oaa'e arec-
ocean flhe harcoftheritacrgieofts..~ n reul-te
Sfro ate irsn ai oan sttri is bse.n
con~osition oRf. 7). fln tha aty fen looseiogrphith area
nd acoustic gedoyni cose thof thet ofdsa ocats to hardrock or 9Acked sadnehose mPeaceas ahere uphto 39 tio-
ene:etations =W ers hard roc be kd ba capacedsan scaebtter
I~ ~ b most~l of the_ inidn enry the reore the mou of aa
scgtterigss deprendent •-pon the oroupgere 2ofd the areawhern the tchratertic size of the therin ireg litie
tios rofg the seatie bars awvleghcatte-vn ro.g is en-thhace gloreatly ove tha t of flt suraeotesn
crposition (Rf.7.n th atlor2m the phybsi-ofraphic a-reas hcandaoustic dmis fmc of the wlo 2 ~yf=lordse o:eanit are
known or easly deterinedwhose iear-eas whre uphtoMto-
Pentepetration, is goin toc ae dfcult secau ttor
satrougnesis cadeprendenteuponte, asucantes opposthe caseWhere the caterristis smoeoth and flat (ref. ulr8).e
isroghyth sm a awveenth -36-ig s n

L•
-- ..•.,W=WM• W- u: _
AcasIc barnncattlr fr targets is deterdined byth eir sizee, os S, h zzr:_ rw -c - -
a. Scattr is sdIa to 7ad&r - thb-t d-rferermt shapes hraryediffr•bet scatterin 1 rer-rls s =a• t"et Cre dandMt=C-= the W'ele of the inchidet ray 7; the -Asize of the shtts._er. i es, differs,. hv er, in that oreaCOMstic 55! zeae a oCCMsregSeI exalte rant efa-
eticA Wave, ereas to :Ze adEar S=Ce is patrizeng and troes-Werse.. The affyct of dteS Aiffe-•e- ins to si-liine theacs ic seschtteroldg pdbieDrvfro fheoer cases to bec tsered eS considerable body of dsta exists rnthescatteriog by narTics geometrac shcoes of =2ra- energa
tCoeoer, hers little has be=sure ve is ChetIcshn The
t suraltice of the s adar, &-ta to h g ,hraidet a nacst avcwavelecdgths is possible ord s d be dnue.r techiote! fin- slu ion o acoustic scattering 0olF S RIe. =a
rather ocilex ssýes haet e been propacseon together ae - can exrMerIMeM~ta pro'gra fbor their Verificadoc, ji~ef. !9).
iic Aside -rial the shia e a doev e depierae:cies, acoas-tcbackscatter freuD metallic cr cocreC-te target St.r~C-
tures will be in srharro contrast to tlhe ~gback-ground?- because of the higý acecstic 12Dedence of thesetargget: material1s (Ref. 10).. ftrthernore, it may bee pos-
- sible at very 1oR accustic frejr-encxies for the inele-entacoustic ware to excite certains ieczanical response mae-esof cbjects such as s=,airnes, deep si;'uaer-sibles, or cy-
- lindrical weapon- housings. - Te excited resonant node mayretaransmnit energy to the nedininB, dissipating the stored
a. energy. T~his may be detected as an izdividual line re-71 ~sponse, uiaich would differ from tha response of the gen-
eral badckgroun~d. )Khether mechanical resonant =,odes ofstructures with shape and size sufficient to store awearon of yass dest ruction can be excited and subsequently
-detected requires considerable analysis and ex-erizentalverification. This effort has considerable potentialsince it provides a possible nechanism for simple detec-tion of high strength pressure vessels whether an thesurface of the seabed, buried beneath it, hidden in a cave,or deep in solid rock or sand. The numerical techniquefor the solution of acoustic scattering problems (Ref. 9)can include limited number of coupled differential equa-tions of tie excitable modes of a container made of a spec-ific material and shape; however, empirical techniques are
T necessary to identify the modes that can be excited.
"S 2~37-
Finally, a rticrl -st be deca~ed to describethe character and ==rc-eties of voreintial, Uwea~=S 20d thewlta~iers that Mig?.t be el!ac-d 03 or in the oceanf loars
In stmm=ry, trze r f.at eqaenc Of- air-filled,higýI-strecss cvnrtzin-s Ma-y be deetecta251e against the ggen-erl.- baCkgrea=6 Of the Sea bOt-r-iM at ra2ter ICWc 2CCQti_-Cfre•7.cies.
At zhe rq-• enies pcrsced earlier for accsticwamsery, rnamtLy, S.5 to S Mz, target. ider.tiicfiatio3ca-n mcly bee ez-e as it is Awith vptdeal or radar- imagery,;.e-, by !oai-g for ch2 ges in the ocza bed andlor the
hsfg -g of c5ar-cte_-tic shr=s mad siz-'s hat differrnthe nor•-m-al terrain. Evea at the 3.5 to S kHz fre-
cqrezey; awa~stic izager-y aIfiords e.--o-zgh peeratiG3 of thebott-o- of the t to se trcq-;i soft bot•ems to hardstrmctjrzs swch as uc~ld be rre-:iired to hccase wearons -
A~alysfs of 2ac3ustic backLscatter of raricas geo-ime~ic sa_ es is required, as is azalysis of the abilityto excite and ilisua-lize strurctnral mechamical rsnfre=uencies.
Precise X•aigatim a-t Sea
Nsavigation at sea dif fem irm that on 1iand (sur-veying) in two main respects.
1. The navigator's position at sea is continuouslychanging, and consequently the position now is rost likelynot what it will h e in the i"mediate futture.
2. With adequate knowledge of the geopotential,the distance from the center of the earth to the navigatoris accurately known at sea whereas on land topographic in-formation (leveling) is required. As a consequence of thesetwo factors, navigation at sea is roughly as difficult asis surveying on land. The precision of the result is de-termined by the precision of the data and the precisionof the "known" (unknown) constraints: on land, heightabove sea level; and at sea, ship's motion. Most systemsare affected by one or the other (or both).
- 38 -
AP"FLIED PF%5oSac LASCRATCRY
It is widely recognized that classical celestialnavigation -is limited in precision not only by the data(angular meastrements) but by the availability of thedata. A glance at a synoptic weather chart shows that
-- in "most" places "most of the time" it is cloudy; theexception to this statement exists in narrw bands oflatitude aroand the Tropics of Cancer ad Capricorn.Even when the data are available, the precision of theez-ta limits the vrecision of the result to several n•,t-ical miles.
:.e are carefýlly avoiding the use of the word"accuranc••' for a very good reason: the word "12 rac,,•"connotes existence of a staneard against which we mea-
-r sure the accuracy of a secon-dary system. For example,it is reasonable to talk about the accuracy of a lengthmeas urement be e the meter exists as an unassailablestandard of length.- Po such stanrard exists for a nav-
T igation system, and therefore, we are forced to talk ofinternal consistency or precision. Once again we haveto make a slig2ht excentien - there is in the court)ardat the Old Green1cich Observatoxy a brass strip definedas 0' longitude. The ability of the system to reproducethis 00 longit"de might be called its "accurac," in one""co.,rdinate, at one place. (Basic characteristics of
- any system prnýosed as an absolute standard are thatthe system have high precision and be readily availablefor co-narison.)
Of all the navigation systems we know- in currentexistence, the Transit Systen (U.S. Navy Navigation Sat-ellite System) is the most precise. It does, however,have certain shortconings and limitations, as do allnavigation, systems. The Transit System relieves thelong-standing problems imposed by the weather on cel-estial schemes; moreover, it is globally available(unlike LORAN) and is currently being exploited andused by co-nercial companies, both U.S. and foreign,as well as foreign governnents. Its present limita-tions for at sea usage are that:
1. For utmost precision it requires preciseknowledge of the ship's motion while the satellite dataare being monitored (roughly 10 minutes). As a ruleof thumb, one knot error in the ship's speed causes a0.2 nmi position error. On the other hand, vethods areknown that use only computer software to reduce thissensitivity by a factor of 5.
S-9 39-

APF-VUM FiaSICS LP.3CRA-OIY
2. Position infor'mation is not continuously avail-able. A fix can be obtained on the average of about onceevery hour - more often near the poles, less often nearthe equator. Consequently the user must depend on somesupplm,-•:•nry systee,, e.g-, dead reckoning, to keep trackof his position between fixes. Hf MIM.N_ is avaiiable,differential LROU meas.rements should provide a reason-able augmentation o- any dead-reckoning scheeme. An ex-pensive but effective method of providing interpolationbetween satellite passes is, of course, an inertial sys-
We have svoken about the liitations of Transitwithout mentioning its real assets: with a precise know-ledge of ship's mozion (say, to the nearest 0.1 knot)**it is capable of consistently giving precisions - day inand d;y out on a worldwide basis - far better than anyother operational system. The fix is in a single globalcoordinate systen, making dattm ties (coordinate trans-formations) Lmsecessaxy. If one has several passesavailable at an anchorage, then the user can coa=ute(sun-ey) his position in three-dinensional space, as wellas :i the traditional latitude and longitude. The equip-ment to do this is co"_pletely automatic and is currently(1970) cc-ercially available fron two manufacturers.It is relatively expensive. The co=.uter receiver con-binations currently are selling for about $70 000. Areceiver with data output equi-pent (punched paper tape)is available for approximately $50 000. Almost any gen-eral-purpose digital computer can be progr =-ed for thenavigation computation. Directional antennas are not re-quired. The system has been operating around the clockalmost without failure for seven years. There are cur-rently four satellites in orbit.
We have deliberately slighted inertial systemsbecause of their inherent instabilities and expense.It is well known that pure inertial systems possessSchuler instabilities. This is a system resonance that
Note in Table 3 that an inertial platform is already
"required to compensate for platform motion.
"** LORAN can be used for this purpose.
- 40 -

m st be removed (or damed) if reasonable results are to"be obtained over long at-sea periods; otherwise, the pre-cision of the fix continuously degrades (in an oscilla-tory sense) with time. One way to damp these oscillationsis to use a hyborid navigation systen, e.g., satellitedoppler-inertial. Once again, these systems tend to beboth complex and expensive.
Among the current inertial systems in operationalusage today is the subnarine inertial navigation system(SINS) used in the U.S. Navy's Polaris submarine. Thisis probably the most precise inertial systen available;the system is cavab!e of correcting the velocity error,assLirng the Schuler instability has been dawed andsteady state is reached. There are nany c-mercial in-ertial systems currently available that are less expen-sive and less precise. -he future holds considerable
F - pxromise for increased precision in inertial and hybridsystems.
The location "accuracies" desired for a craft"cappirg the ocean botto3 are: (a) to be able to designate,
j after-the-fact, an interesting area for closer ex-aina-tion, and (b) to mininize the overlap required for registryof "side-by-side maps. The two-sided ground swath nappedby the synthetic aperture technique ranges from 16 to 20i kam. The cuent satellite navigation systen accuracy,
- together with a current co-ercial inertial system orLMORAY, %-here availableand together with procedures tominimize velocity errors, appears to be more than adequatefor either tasl. It should be noted that the task oflocating an object on the ocean bottom with a high re-solution system sucl as that of the Mizar should be nuc.hsimpler with the support of the system proposed herein,-whicl in addition to furnishing location position alsofurnishes a topographic map of the surrounding area.
FEASIBILITY DEMONSTRATION
An early demonstration of a synthetic aperture bot-tom mapping system could be built around a modifiedHarris Model 853 Narrow Beam Echo Sounder (Ref- 11),Harris ASW is a Division of the General Instrminent Corp-oration, Westwood, Massachusetts.
V - 41-

APPEJED PHYSICS LACP.ATCR-
The Narrow Bean Echo Soumder is an electronicallystabilized narrowbeam depth-sounding systea used on theU.S. Coast and Geodetic Survey Shio Surveyor. The equip-raent is nodified to look directly below the ship usinga 2-2/3a fore and aft bea- and a 540 athwart ship bean.A separate broad (200) receive beas is used, and it, to-gether with the tr-ansmit bean, is electronically stabilizedwith respect to the local vertical supplied by a verticalgyro. The systen is used for accurate bottom profiling.The transmit and receive .-cray have the following para-meters:
L = TransBit anerturf length = n
LR = Receive aperture length = 3 n
N. = No. elements, tansmit = 80
NR = No. elements, receive = 40
eT = Transmit beazeidth = 540 x 2-2/3° (0.04 rad)
9R = Receive bearwidth = 200 x 2-2/30 (0.04 rad)
' = 12 kHz, 1(wavelength) = 0.12 12
r = 7 ms, cT/2= 5.5 a
P = Acoustic power = 4 k-W
T = 1-15 s
"Using the Harris system in conjunction with a multi-channel ta-e recorder and land-baseddata processing facil-
ities, synhetic aperture demonstration systems with the"follouing .,ets of parameter could be built.
Slow Speed Normal Speed
v = velocity (m/s) 1.25 2.5
LR = 2vT (m) 3.0 6.0*
T = Interpulse period (s) 1.25 1.25
R -R = cT/2 (m) 875 875
Number of range cells 128 128
*Formed by the concatenation of two of the Harris 3.0-mape:-tures. - 42 -
SAPPUED PHYSICS LAORTORY
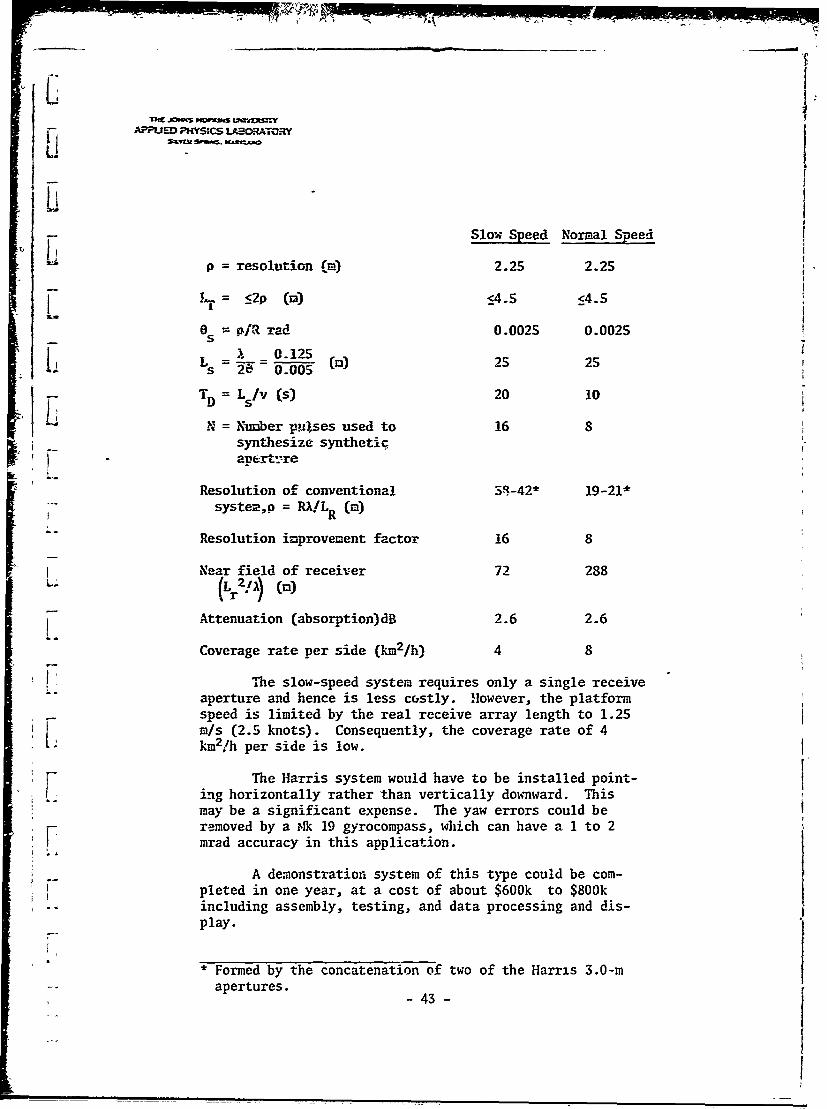
Slow Speed Normal Speed
p = resolution Wi) 2.25 2.25
,= _2p (M3) :_4.5 <4.5
0 = pIR rad 0.0025 0.0025S
SC0.125L = - .0O5 (3) 25 25
TD = Ls/v (s) 20 10
N = Number pulses used to 16 8synthaesize synathet-iq
Resolution of conventional 3R-42* 19-21*
system,p = RX/LR (m)
Resolution improvement factor 16 8
Near field of receiver 72 288
(L 2 ) (.X. Attenuation (absorption) dB 2.6 2.6
Coverage rate per side (km2 /h) 4 8
The slow-speed system requires only a single receiveaperture and hence is less costly. However, the platformspeed is limited by the real receive array length to 1.25m/s (2.5 knots). Consequently, the coverage rate of 4
-. km2!h per side is low.
The Harris system would have to be installed point-,V ing horizontally rather than vertically downward. This
may be a significant expense. The yaw errors could beremoved by a AIk 19 gyrocompass, which can have a 1 to 2mrad accuracy in this application.
A demonstration system of this t)ye could be com-pleted in one year, at a cost of about $600k to $800kincluding assembly, testing, and data processing and dis-play.
* Formed by the concatenation of two of the Harris 3.0-mapertures. 43
THE JOH4S HOpKS LemIIVfhy
APPLIED PHYSICS LABORATORY
REFERENCES
1. G. M. Walsh, Final Report, Feasibility Study, SyntheticAperture Array Techniques for High Resolution OceanBottom Mapping, Report No. R593, 29 December 1967, andPhase 1A, Report No. R664, 31 July 1968, Raytheon Com-ii pan.y, Portsmouth, Rhode Island.
2. J, E. Sanders, K. 0. Emery, and E. Uchupi. "Microto-pography of Five Small Areas of the Continental Shelfby ,ide Scanning Sonar," Geological Society of AmericaFle%:in, Vol. 80, April 1969, pp. 561-572.
Ii3. Oc.ean Bottom Scanning Sonar, Westinghouse Brochure,•_ 1965.
4. P. J. Luke, "Far Field Pattern of Synthetic ApertureI System," APL/JHU MRT-7-126, 1 May 1970.
S. A Proposal to Plan an Experiment Determining OceanAcoustic Stability Relating to Synthetic ApertureI Sonar, Raytheon Proposal #P 5548-0-51, 14 August 1970.
6. A. M. Chwastyk, "Synthetic Aperture Sonar ProcessingSystem," APL/JHU MPT-2-037, 6 July 1970.
7. R. J. Urick, Principles of Underwater Sotind forEngineers, MacGraw-Hill, N.Y. (particularly sectionon Sea Bottom Reverberation, pp. 217-225).[ 8. B. C. Heezen, "Physiograrhic Provinces and Acoustic
Domains," U.S. Navy Journal of Underwater Acoustics,Vol. 17, No. 1, January 1967.
9. MBAssociates Proposals and Report:
a. Program Plan, Seabed Treaty Verification Study,ii MB-P-70/23, April 1970.
Sb. Program Plan, Submarine Acoustic Cross-SectionStudy, MB-P-70/II.
c. An Integral Equation Approach to Acoustic Scat-tering from Fluid-Immersed Elastic BodiesKB (Report), MB-TM-69/104.
Preceding page blank - 45 -
THE JOHNS HOPKINS V' WERSITYAPPLIED PHYSICS .ABORATCRY I
SI.Vzt SPRt•. •. AND
10. M. C. Junger, The Detection of Deep Submergence Hullsby Passive and Active Sonar, Cambridge AcousticalAssociates, February 1962 (DDC 328210).
11. Narrow Beam Echo Sounder, Harris ASW Division Brochure,
General Instrument Corp., Westwood, Massachusetts. --
'i
I
T
-46-