Embed Size (px)
Citation preview
Synthesis of lignin star model compounds and
their dehydrogenation polymer growth study.
-
Master thesis
Ulisse Montanari
ASC: Advanced Spectroscopy in Chemistry
May 2015
Project supervisor: Jussi Sipilä
Organic chemistry laboratory
Departement of chemistry
Faculty of sciences
Helsinki University
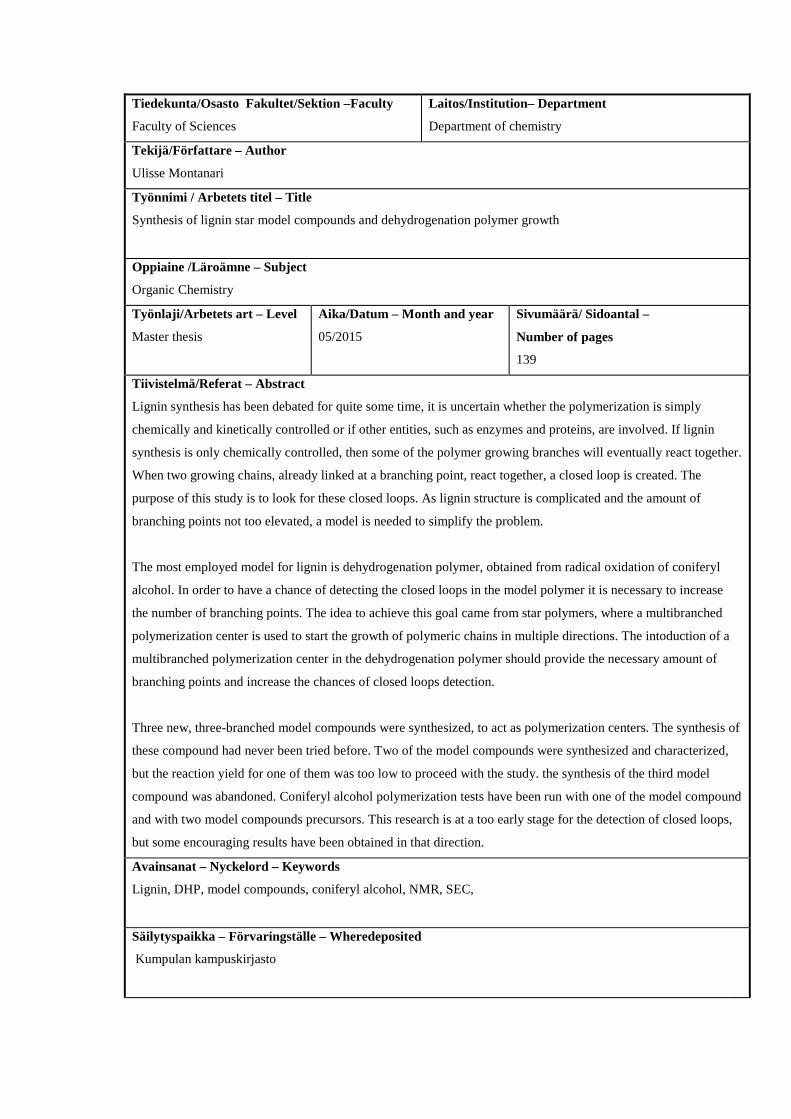
Tiedekunta/Osasto Fakultet/Sektion –Faculty
Faculty of Sciences
Laitos/Institution– Department
Department of chemistry
Tekijä/Författare – Author
Ulisse Montanari
Työnnimi / Arbetets titel – Title
Synthesis of lignin star model compounds and dehydrogenation polymer growth
Oppiaine /Läroämne – Subject
Organic Chemistry
Työnlaji/Arbetets art – Level
Master thesis
Aika/Datum – Month and year
05/2015
Sivumäärä/ Sidoantal –
Number of pages
139
Tiivistelmä/Referat – Abstract
Lignin synthesis has been debated for quite some time, it is uncertain whether the polymerization is simply
chemically and kinetically controlled or if other entities, such as enzymes and proteins, are involved. If lignin
synthesis is only chemically controlled, then some of the polymer growing branches will eventually react together.
When two growing chains, already linked at a branching point, react together, a closed loop is created. The
purpose of this study is to look for these closed loops. As lignin structure is complicated and the amount of
branching points not too elevated, a model is needed to simplify the problem.
The most employed model for lignin is dehydrogenation polymer, obtained from radical oxidation of coniferyl
alcohol. In order to have a chance of detecting the closed loops in the model polymer it is necessary to increase
the number of branching points. The idea to achieve this goal came from star polymers, where a multibranched
polymerization center is used to start the growth of polymeric chains in multiple directions. The intoduction of a
multibranched polymerization center in the dehydrogenation polymer should provide the necessary amount of
branching points and increase the chances of closed loops detection.
Three new, three-branched model compounds were synthesized, to act as polymerization centers. The synthesis of
these compound had never been tried before. Two of the model compounds were synthesized and characterized,
but the reaction yield for one of them was too low to proceed with the study. the synthesis of the third model
compound was abandoned. Coniferyl alcohol polymerization tests have been run with one of the model compound
and with two model compounds precursors. This research is at a too early stage for the detection of closed loops,
but some encouraging results have been obtained in that direction.
Avainsanat – Nyckelord – Keywords
Lignin, DHP, model compounds, coniferyl alcohol, NMR, SEC,
Säilytyspaikka – Förvaringställe – Wheredeposited
Kumpulan kampuskirjasto
List of contents
1. Introduction....................................................................................................9
1.1. Biomass...............................................................................................10
1.1.1. BIOMASS TO FUELS………………………………………………………...……10
Thermal conversion……………………………………………………………….……. . 10
Bioalcohols: methanol, ethanol and butanol……………………………...……………. 12
Biodiesel………………………………………………………………………………….. .14
Conclusions………………………………………………………………………………. 15
1.1.2. BIOMASS TO CHEMICALS………………………………………………...…….17
Conversion of triglycerides…………………………………………………………………18
Conversion of carbohydrates……………………………………………………………. ..19
Terpenes conversion………………………………………………………………………..21
Conclusions…………………………………………………………………………………22
1.1.3. CONCLUDING REMARKS…………………………………………………….....22
1.2. Lignin……………………………………………………………….23
1.2.1. LIGNIN LINKAGES……………………………………………………………….25
Arylglycerol β-aryl ether (β-O-4)…………………………………………………………...26
Phenylcoumaran (β-5)……………………………………………………………………….27
Dibenzodioxocin ring and 5-5 bond………………………………………………………...27
Resinol (β-β), 1,2-diarylpropane (β-1) and other bonds…………………………………..28
Cross-links…………………………………………………………………………………...30
1.2.2. LIGNIFICATION......................................................................................................31
Hypothesis and theories…….……………………………………………………………….32
Peroxidases and Laccases…………………………………………………………………...33
1.2.3. APPLICATIONS........................................................................................................34
Paper industry……………………………………………………………………………….34
Other applications hindered by lignin…………………………………………………...…36
Lignin applications………………………………………………………………………..…36
1.2.4. LIGNIN ANALYSIS.................................................................................................37
Extraction methods……………………………………………………………………...…..38
Analysis methods……………………………………………………………………….……38
Acidolysis…………………………………………………………………………………….39
Thioacidolysis…………………………………………………………………………..……40
Derivatization followed by reductive cleavage (DFRC)………………………………..…40
Instrumental analysis……………………………………………………………………….41
Nuclear Magnetic Resonance……………………………………………………………….41
1.2.5. CONCLUDING REMARKS.....................................................................................43
1.3. Lignin biosynthesis.............................................................................44
1.3.1. MONOLIGNOL BIOSYNTHESIS...........................................................................44
Phenylalanine and Tyrosine ammonia lyases……………………………………..……….46
Cytochrome P450 hydroxylases (C4H, pC3H, F5H)………………………………..……..46
pC3H and hydroxycinnamoyl CoA transferases ………………………………………….46
4-Coumarate CoA ligases (4CL)……………………………………………………………47
O-Methyltransferases…………………………………………………………………….…48
Cinnamoyl CoA reductases…………………………………………………………...…….48
Cinnamyl alcohol dehydrogenases……………………………………………………...…..48
1.3.2. MONOLIGNOL BIOSYNTHESIS PERTURBATION………………………........49
PAL and C4H………………………………………………………………………………..49
4CL…………………………………………………………………………………………...49
C3H…………………………………………………………………………………………...50
CCOMT……………………………………………………………………………..……….50
COMT ……………………………………………………………………………………….50
CCR…………………………………………………………………………………………..51
F5H………………………………………………………………………………………...…51
CAD…………………………………………………………………………………………..52
1.3.3. MONOLIGNOL BIOSYNTHESIS: COMBINATORIAL VS CONTROLLED…..52
History and general ideas…………………………………………………………………...53
Lignin and DHP, same or different?……………………………………………………….54
Lignans biosynthesis………………………………………………………………………..54
New evidence from transgenic plants………………………………………………………55
Lignin oligomers profiling………………………………………………………………… ..55
Lignin template polymerization……………………………………………………….……56
Conclusion……………………………………………………………………………….…..56
1.3.4. APPLICATIONS........................................................................................................56
F5H upregulation, key to an easier pulping………………………………………………..57
Other applications……………………………………………………………………..…….57
1.4. Lignin model compounds....................................................................58
DHP…………………………………………………………………………………………...59
Released suspension cell culture lignin (RSCL)……………………………………………61
1.4.1. RESEARCH TOPIC....................................................................................................61
Founding hypothesis…………………………………………………………………...……61
Our project…………………………………………………………………………….…….62
Related research………………………………………………………………………..……63
Project outline………………………………………………………………………………..64
2. Experimental......................................................................................................65
2.1. Analysis...............................................................................................65
2.1.1. NUCLEAR MAGNETIC RESONANCE (NMR).....................................................65
NMR samples preparation………………………………………………………………..65
2.1.2. SIZE EXCLUSION CHROMATOGRAPHY (SEC).................................................66
SEC samples preparation……………………………………………………………….…..66
2.1.3. HIGH PERFORMANCE LIQUID CHROMATOGRAPHY (HPLC)……………..66
HPLC samples preparation………………………………………………………………..66
2.1.4. THIN LAYER CHROMATOGRAPHY (TLC)………………………………….....67
2.1.5. BIOTAGE SEPARATION………………………………………………………….67
2.2. Synthesis.............................................................................................67
2.2.1. MODEL COMPOUND 1 (MC1)...............................................................................68
Step 1: nucleophilic addition………………………………………………………………..69
Step 2: reduction and deprotection.………………………………………………………..69
2.2.2. MODEL COMPOUND 2 (MC2)…………………………………………………...70
Step 1: nucleophilic addition………………………………………………………………..71
Step 2: reduction and deprotection ………………………………………………………..71
2.2.3. MODEL COMPOUND 3 (MC3)…………………………………………………...71
Step 1: Benzyl vanillin synthesis……………………………………………………………73
Step 2: nucleophilic addition………………………………………………………………..73
Step 3: aldol condensation……………………………………………………………..……73
2.3. Polymerization....................................................................................74
Buffer preparation…………………………………………………………………………...74
Model compounds and coniferyl alcohol…………………………………………………...74
Polymerization procedure…………………………………………………………………...75
3. Results and Discussion......................................................................................77
3.1. Synthesis.............................................................................................77
3.1.1. MC1............................................................................................................................77
Step 1: nucleophilic substitution……………………………………………………………77
Step 2: hydrogenation ………………………………………………………………………81
Considerations……………………………………………………………………………….82
3.1.2. MC2…………………………………………………………………………………83
Step 1: nucleophilic substitution……………………………………………………………83
Step 2: hydrogenation ………………………………………………………………………85
MC2 synthesis: misinterpretation………………………………………………………….88
Considerations……………………………………………………………………………….89
MC1 and MC2 comparison…………………………………………………………………89
3.1.3. MC3...........................................................................................................................91
Benzyl vanillin synthesis…………………………………………………………………….92
Step 1: nucleophilic substitution……………………………………………………………92
Step 2: aldol condensation………………………………………………………………….93
Considerations………………………………………………………………………….……97
3.1.4. CONCLUDING REMARKS……………………………………………………….98
3.2. Polymerization………………………………………………………98
General considerations……………………………………………………………………...99
3.2.1. CONIFERYL ALCOHOL………………………………………………………...100
SEC data analysis…………………………………………………………………………..102
NMR data analysis…………………………………………………………………………103
Comparison strategy……………………………………………………………………….106
3.2.2. METHYLRESORCINOL........................................................................................107
Methylresorcinol, internal comparison…………………………………………………..108
Methylresorcinol, CA DHP comparison. …………………………………………..……110
3.2.3. PHLOROGLUCINOL..............................................................................................113
Phloroglucinol, internal comparison………………………………………………...........113
Phloroglucinol, CA DHP comparison…………………….........…………………………115
3.2.4. MODEL COMPOUND 1 (MC1).............................................................................117
MC1, internal comparison…………………………………………………………..……..118
MC1, CA DHP comparison……………………………………………………..…………119
3.2.5. CONCLUDING REMARKS...................................................................................122
4. Conclusion........................................................................................................124
4.1. Summary...........................................................................................124
4.1.1. SYNTHESIS............................................................................................................124
4.1.2. POLYMERIZATION...............................................................................................125
4.2. A preliminary work...........................................................................126
4.3. Future work.......................................................................................127
4.3.1. SYNTHESIS............................................................................................................127
4.3.2. POLYMERIZATION...............................................................................................128
5. Acknowledgments............................................................................................130
6. References........................................................................................................131

List of Abbreviations
4CL = 4-Coumarate CoA ligase
BBAVone = 1-(4-(benzyloxy)-3-methoxyphenyl)-2-bromoethan-1-one
C4H = Cinnamate-4-Hydroxylase
CCOMT = Caffeoyl CoA O-Methyltransferase
CCR = Cinnamoyl CoA reductases
CM = Central Molecule (molecule present in polymerization reaction mixture)
CoA = Coenzyme A
COMT = Caffeic acid O-Methyltransferase
DEPT = Distortionless Enhancement by Polarisation Transfer
DFRC = Derivatization Followed by Reductive Cleavage
DHP = dehydrogenation polymer
DIPA = Diisopropylamine
DMF = dimethylformamide
DMSO = Dimethyl sulfoxide
DP = Dirigent Protein
EtOAc = Ethyl Acetate
F&F = Flavors and Fragrances
F5H = ferulate-5-hydroxylase
FAME(s) = Fatty Acid Methyl Ester(s)
FTS = Fischer-Tropsch Synthesis
G = guayacyl phenylpropanoid unit
GC = Gas Chromatography
GTL = Gas to Liquid
H = p-hydroxyphenyl phenylpropanoid unit
HCT = hydroxycinnamoyl CoA:shikimate/quinate hydroxycinnamoyl transferase
HMBC = Heteronuclear Multiple Bond Correlation
HPLC = High Performace Liquid Chromatography
HQT = hydroxycinnamoyl CoA:quinate hydroxycinnamoyl transferase
HRP = Horseradish Peroxidase
HSQC = Heteronuclear Single Quantum Coherence spectroscopy
LC = Liquid Chromatography
MC 1, 2, 3 = Model compound 1, 2, 3 .
MeRe = MethylResorcinol
MeRe(BAV)2 = 2,2'((5-methyl-1,3-phenylene)bis(oxy))bis(1-(4-(benzyloxy)-3-
methoxyphenyl)ethan-1-one)
MG = coniferyl alcohol, monomer
MH = p- coumaryl alcohol, monomer
Mn = number-average molecular weight
MS = Mass Spectrometry
MS = synapyl alcohol, monomer
Mw = Molecular Weight
Mw = weight-average molecular weight
MWL = Milled Wood Lignin
NADPH = Nicotinamide Adenine Dinucleotide Phosphate
n-BuLi = n-Butyl Lithium
NMR = Nuclear Magnetic Resonance
NOESY = Nuclear Overhauser Effect spectroscopy
PAL = Phenylalanine Ammonia Lyases
pC3H = p-coumarate-3-hydroxylase
PDI = Polydispersity
Ph(OBAVone)3 = 2,2',2''-(benzene-1,3,5-triyltris(oxy))tris(1-(4-(benzyloxy)-3-
methoxyphenyl)ethan-1-one)
Ph(OH)3 = Phloroglucinol
Phe = Phenylalanine
RI = Refractive Index
RSCL = Released Suspension cell Culture Lignin
RT = Room Temperature
S = syringyl phenylpropanoid unit
S1 = inner layer, secondary cell wall
S2 = middle layer, secondary cell wall
S3 = outer layer, secondary cell wall
SEC = Size Exclusion Chromatography
TAL = Tyrosine Ammonia Lyases
TOCSY = TOtal Correlated SpectroscopY
Tyr = Tyrosine
WGS = Water-Gas Shif
9
1 Introduction
It does not matter who you listen to or which article you read, everybody agrees that we are
running out of fossil fuels. It might be sooner or later, according to different evaluations,
but oil and coal will inevitably end and probably in a not so distant future [1]. The current
industrial development is unsustainable, both from an energetic and an environmental point
of view. We are using too many resources, we are exploiting the territory too much, and
we are so focused on the present that we do not care about the future. During the past
century energy consumption has increased 17 folds with related emission of greenhouse
gasses CO2, SO2 and NOx [2].With the world population hitting 10 billion in 2050 [3], this
trend is clearly self-destructive. More and more people, in and out of the scientific
community are becoming aware of that, and the requests for a greener and more
sustainable way are becoming more relevant.
Politics will be left aside; it is beyond our purpose to say which country is doing good or
bad and why. It is better to focus on what science, and chemistry in particular, can do to
help. Even if chemistry is usually seen as dangerous, poisonous and polluting, this is only
one of the sides of the medal. Of course chemical industry has been responsible for
ecological disasters, even more so if oil spills and nuclear accidents are included in the
count. The media impact of these catastrophes is huge, which explains chemistry bad
reputation. The other side of the medal is unknown to most people, for example the study
to develop greener and safer procedures, the search for eco-friendly materials and
reactants, and the creation of new and more sophisticated devices to reduce pollution.
These are all things that chemistry is involved into, and hopefully in the future the image
of chemistry will change to reflect that as well.
One of the possible solutions to the environmental problems that afflict the earth, are
renewable resources. Everything necessary for our society, such as energy and chemicals,
should be produced in a sustainable way, without using more that what the earth can
produce. Otherwise our “ecological capital” will soon be exhausted and there will be
nothing left. There are several renewable resources that are currently being discussed and
researched such as solar, geothermal, wind and hydroelectric power. The aim of this paper
is not to review them all, but to focus on the conversion of biomass. Biomass conversion
and employment is the wider topic in which the small and specific research of our group
belongs.
10
1.1 Biomass
Biomass is the biological material derived from living, or recently living organisms [4].
This includes any kind of plant grown for any purpose, like converting them to fuels or
chemicals, and all sorts of bio wastes such as municipal and agricultural wastes or forest
residues. Biomass, as a source of energy, is much more evenly distributed than fossil fuels;
therefore country investing in biomass conversion will not only help the environment but
will also decrease their energy dependency from foreign sources. As far as renewable
resources go, biomass is unique and different from all the others. The reason is that
biomass is the only renewable resource that produces carbon, which means it is the only
currently known way to sustainably produce chemicals and fossil-like (carbon-based)
fuels. It does not mean that biomass is the best of all renewable resources, because these
advantages come with severe drawbacks. In fact, biomass has a much lower energy
production potential if compared to solar, and it is usually competing with food production,
either by processing edible resources or by occupying agricultural terrain. Advantages and
disadvantages of biomass will be discussed later, after an overview of the possible
applications. The first topic treated will be conversion of biomass to fuels, followed by
conversion to chemicals.
1.1.1 BIOMASS TO FUELS
There are several ways to convert biomasses to biofuels, depending on the kind of biomass
employed, the different catalysts, the process adopted and the kind of fuel. The most
common, promising and state of the art technologies for conversion will be shortly
reviewed.
Thermal conversion.
Beyond old fashioned wood combustion, there are two main thermal treatments currently
performed on biomass: gasification and pyrolysis. Gasification is a fast procedure
conducted at high temperature, optimized to increase the yield of the gaseous fraction. The
process produces low amount of solid residues, and the composition of the gaseous part
can be tuned by modifying the reaction atmosphere. Air or pure oxygen will increase the
amount of CO2, while steam increases the H2 yield. Gasification is currently the most
promising way to thermally convert biomass [5,6]. Pyrolysis is conducted under more
11
moderate conditions: lower temperature, longer residence time, higher pressure, low
concentration of oxygen. The main product is pyrolysis oil, a liquid mixture of more than
400 small molecules, most of them hydrocarbons [7,8], with both a solid and a gaseous
fraction as byproducts, which are usually burned in place in order to produce the heat
necessary for the reaction [9,10].
For the conversion to fuels, both pyrolysis and gasification products, undergo steam
reforming to produce bio syngas, a mixture of CO and H2 [11]. During steam reforming the
hydrocarbons react with steam, with the help of a nickel-based catalyst [12], according to:
CnHm +nH2O ⇌ nCO + (n+m/2)H2 Formula 1.1
This reaction commonly employs methane as feed. Substitution of this high purity reactant
with biomass feeds makes the process harder, requires optimization and additional
purification steps. This translates in higher costs and lower yield compared to fossil-based
processes [13]. It is to be said that currently steam reforming of CH4 is the most used and
economically favorable way to produce pure H2. It involves two water-gas shifts (WGS)
steps, CO purification and CO2 removal. In principle the methane could be substituted by
biomass, but the yield would be extremely reduced. A lot of research is necessary to match
the yield of bio-based processes with the yield of petrol chemistry. Besides, hopefully in
the future H2 will be produced by water electrolysis and therefore the whole biomass to
hydrogen technology will not be needed.
Once a pure feed of syngas is obtained, it can be easily converted to fuels through the
available and economically viable technology of Fischer-Tropsch Synthesis (FTS). FTS
has been around since the 1930’s, when it was introduced in Germany [14], a lot of
progress has been made ever since and there is a wide and flourishing literature on the
subject [15-18]. FTS converts syngas to linear olefins, a high quality fuel. The feed needs
to be pure in order not to poison the catalyst, resulting in a cleaner product, without S, N or
aromatic impurities. This makes fuels produced by FTS more eco-friendly than the
petroleum-based ones. The catalysts employed are iron-based with Al2O3/SiO2 doping. By
variation of the doping and reaction conditions the distribution of the products can be
controlled, it is possible to statistically obtain the desired length of hydrocarbon chains to
produce gasoline, kerosene and diesel. It is evaluated that as the price of oil rises, FTS-
based gas to liquid (GTL) technology will become more and more important [19].
12
To summarize, it is possible to convert biomass to high purity carbon-based fuels. The
process requires first conversion of biomass to hydrocarbons by gasification or pyrolysis.
Then steam reforming of the obtained hydrocarbons to produce syngas and eventually
synthesis of gasoline and diesel by FTS.
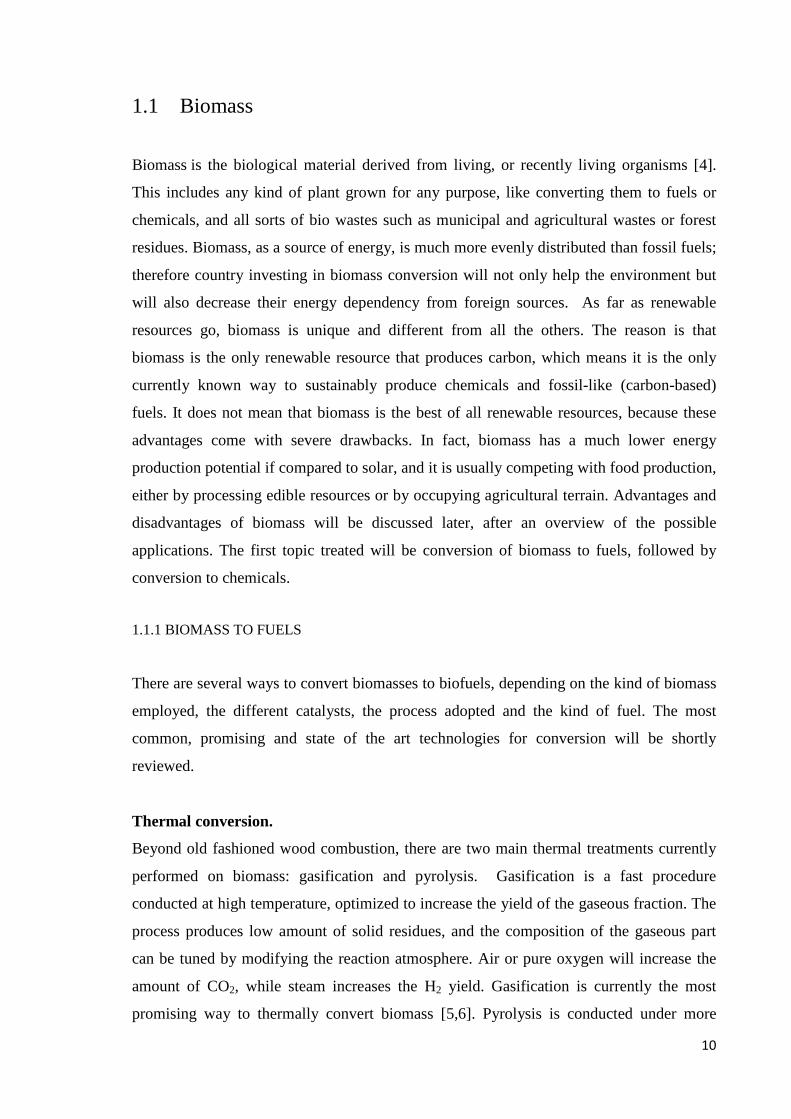
Bioalcohols: methanol, ethanol and butanol.
Bioalcohols are a category of bioproducts that can be, and currently are, employed as clean
liquid fuels. Ethanol (2) is the most important of the three and will be discussed longer. It
is very similar under many aspects to butanol (3), therefore the latter will be treated very
shortly. On the other hand methanol (1) production is very different from the other two and
will require a separate treatment. The mentioned alcohols are reported in Figure 1.1.
Figure 1.1Methanol, ethanol and butanol, the alcohols most employed as biofuels.
Ethanol is produced trough biological fermentation of sugars, usually using yeast, and then
distilled to the purity required by engines. It can be used as an additive to standard fuels
without engine modification or can be burned pure in specific devices. When used as
additive to gasoline it increases the octane number and the oxygen content, facilitating
combustion [20]. The cost for ethanol production is not currently competitive with oil-
based fuels, but it is made so by governmental support in several countries [21]. Corn,
wheat and sugar beet are common feedstock for bioethanol production, with good yields
and favorable conversion.
As favorable as it may be, ethanol from corn is in competition with food production, and
causes the rise of food prices and necessitates terrains that cannot be dedicated to other
cultures. Therefore it is necessary to find an alternative to fermenting ethanol from edible
feedstock. Lignocellulosic materials, such as wood and agricultural wastes, are a viable
alternative, but there are several connected problems that need to be solved. Wood and
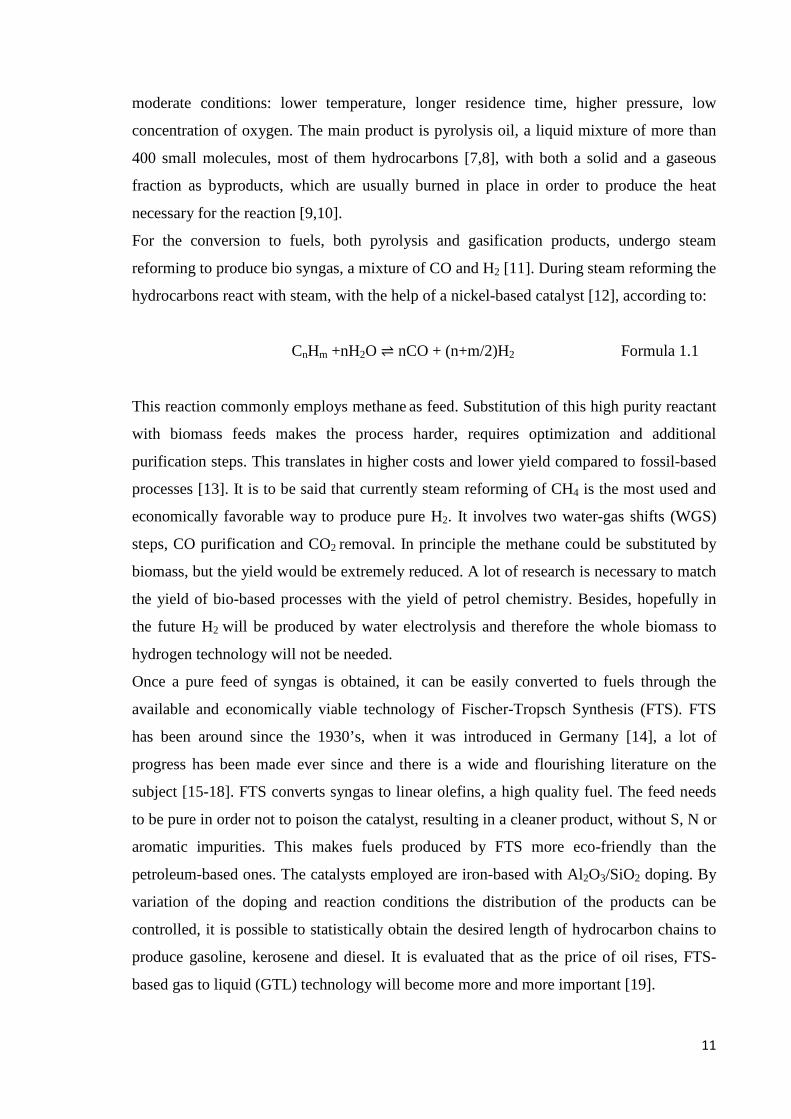
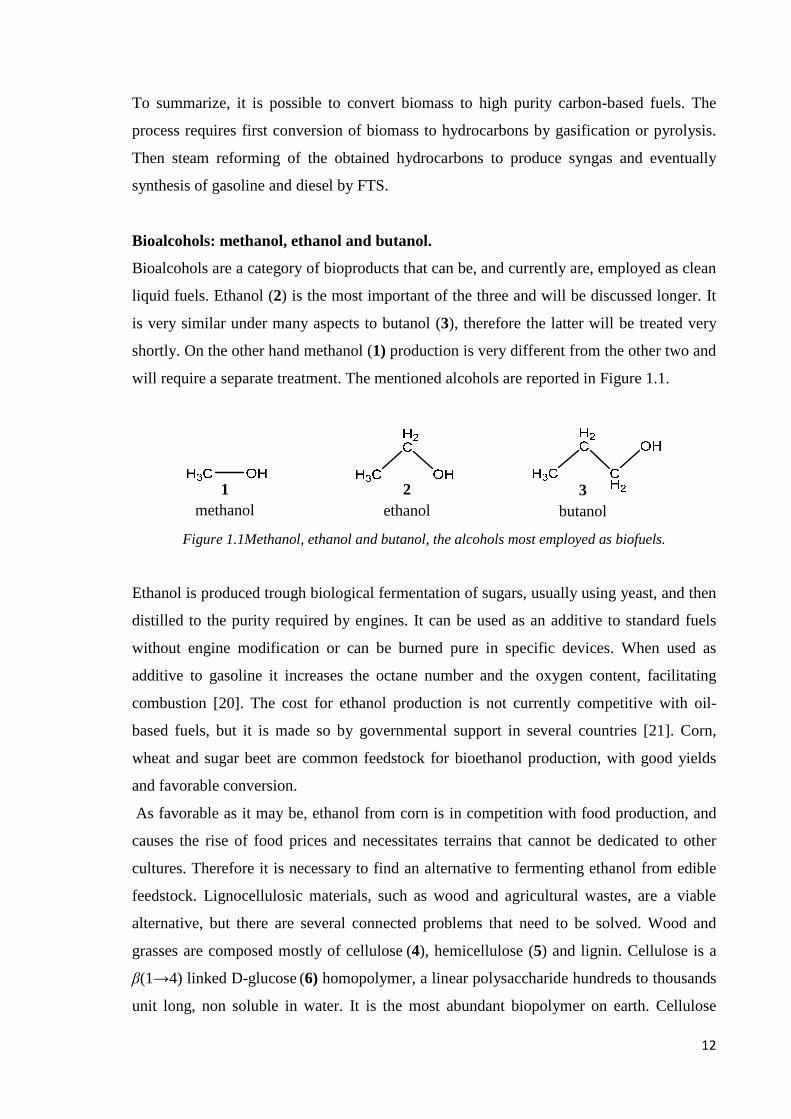
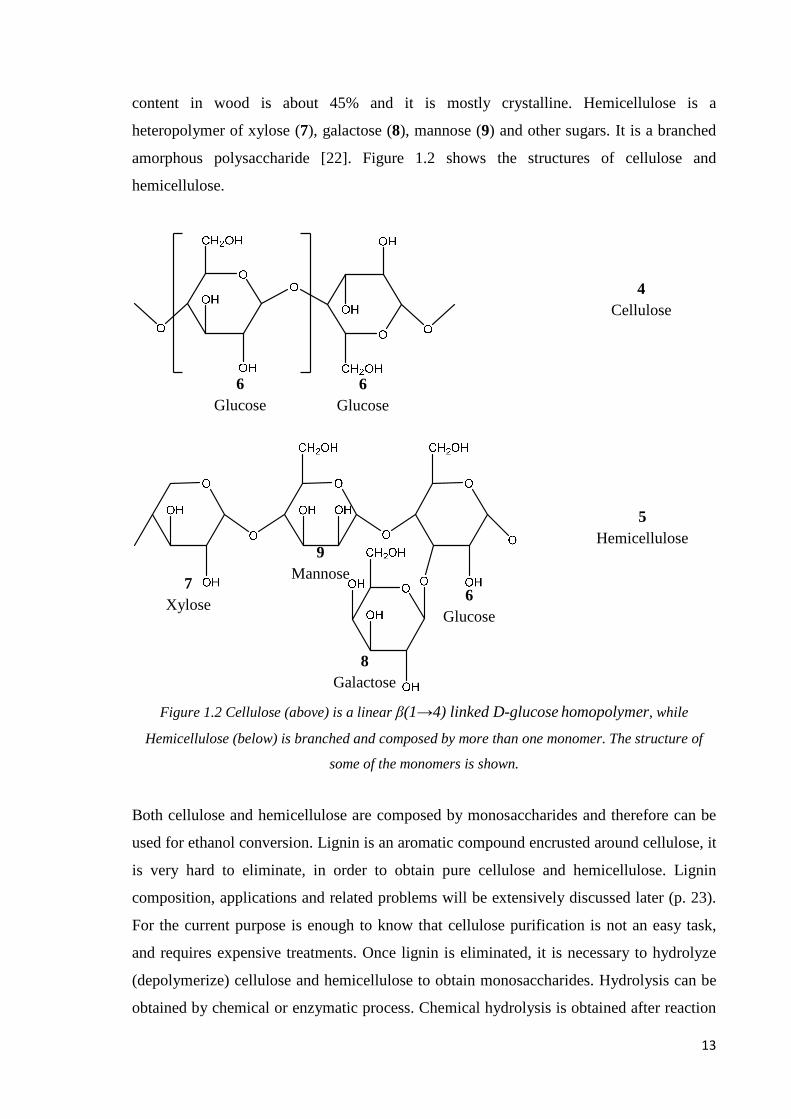
grasses are composed mostly of cellulose (4), hemicellulose (5) and lignin. Cellulose is a
β(1→4) linked D-glucose (6) homopolymer, a linear polysaccharide hundreds to thousands
unit long, non soluble in water. It is the most abundant biopolymer on earth. Cellulose
1 methanol
2 ethanol
3 butanol
13
content in wood is about 45% and it is mostly crystalline. Hemicellulose is a
heteropolymer of xylose (7), galactose (8), mannose (9) and other sugars. It is a branched
amorphous polysaccharide [22]. Figure 1.2 shows the structures of cellulose and
hemicellulose.
Figure 1.2 Cellulose (above) is a linear β(1→4) linked D-glucose homopolymer, while
Hemicellulose (below) is branched and composed by more than one monomer. The structure of
some of the monomers is shown.
Both cellulose and hemicellulose are composed by monosaccharides and therefore can be
used for ethanol conversion. Lignin is an aromatic compound encrusted around cellulose, it
is very hard to eliminate, in order to obtain pure cellulose and hemicellulose. Lignin
composition, applications and related problems will be extensively discussed later (p. 23).
For the current purpose is enough to know that cellulose purification is not an easy task,
and requires expensive treatments. Once lignin is eliminated, it is necessary to hydrolyze
(depolymerize) cellulose and hemicellulose to obtain monosaccharides. Hydrolysis can be
obtained by chemical or enzymatic process. Chemical hydrolysis is obtained after reaction
4 Cellulose
5 Hemicellulose
6 Glucose
7 Xylose
8 Galactose
9 Mannose
6 Glucose
6 Glucose
14
with acid. The acid concentration influences the outcome, but both diluted and
concentrated acid hydrolysis have some advantages. Enzymatic hydrolysis is achieved with
specific enzymes that cleave the bonds between polysaccharides [13].Once the hydrolysis
is complete it is possible to convert monosaccharides to ethanol trough simple
fermentation. Specific description of each method is beyond the purpose of this review.
Butanol is processed in the same way as ethanol, with the exception that it is necessary to
find a different organism to convert the sugars. Butanol has several advantages over
ethanol, in particular: Butanol can be blended in higher amount with gasoline, it has a
higher octane number, can be transported in existing pipelines and provides better safety
[23].Methanol has similar characteristics as a fuel as the other alcohols, but is different
when its production is concerned. Sustainable methanol production is currently not
economically possible. Methanol is normally synthesized from syngas, but could also be
obtained in the future from coal, after cleaning and reaction with steam and O2. To convert
biomass to methanol it would be necessary to first convert biomass to syngas with the
process described above (p. 10) and then use the syngas to produce methanol. This long
process makes agricultural methanol way more expensive than bioethanol and methanol
from natural gas [24].
Biodiesel
Triglycerides (10) extracted from oleaginous plants, such as soybean, rapeseed and
sunflower, were tested as diesel fuels by Rudolph Diesel more than 100 years ago. They
turned out to be far too viscous to be employed, causing clogging, and with a too low
cetane number. Triglycerides are fatty acid esters of glycerol (11), with a carbon chain of
12 to 18 units, and they can be easily transesterificated with methanol (1) or ethanol (2).
The fatty acid methyl esters (12) (FAMEs) obtained, have the right viscosity and properties
to be employed as biodiesel. No engine modification would be required, and since they are
obtained from biomass their overall CO2 production would be near 0, making them a good
green alternative to diesel. As a bonus, transensterification from triglycerides to FAMEs
gives pure glycerol as a byproduct. Currently glycerol is employed mostly in
pharmaceutical and cosmetics industries but the huge amount of glycerol produced by a
FAMEs fuel industry would easily saturate the market.
The traditional way to transesterification is via liquid basic catalysis [25], but as solid
catalysts are much better for industries, several studies have been made in that direction
[26]. Strong organic bases or enzymes, immobilized in zeolites or polymers, as well as
15
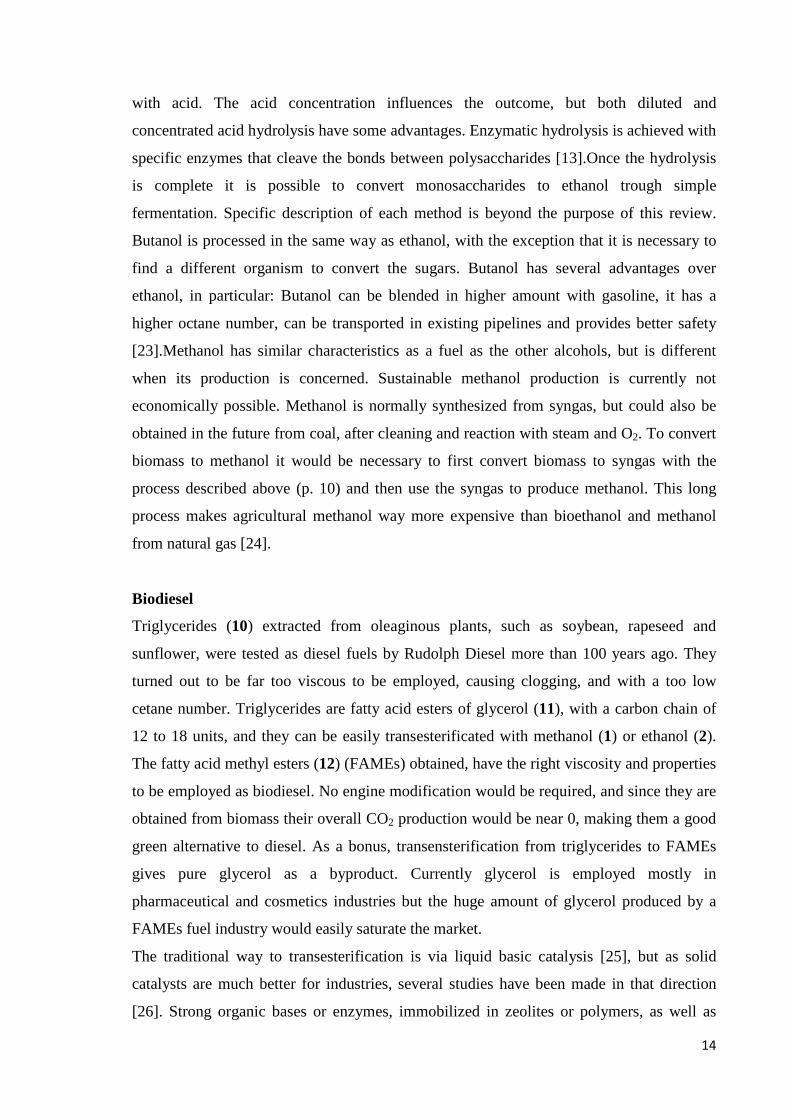
multimetallic oxides catalysts have been studied with various degree of success [27-30].
Figure 1.3 shows the general reaction of triglyceride transesterification to FAME.
Figure 1.3 Shows the transesterification reaction of a triglyceride and methanol, to produce
FAMEs.
Beyond the technological problems related to the conversion from glycerol to methyl esters
there are several obstacles preventing FAMEs to become an economically viable fuel. First
of all, the price of the feedstock makes the cost of biodiesel to be the double of petrol
derived diesel. The second problem is more ethical than economical: every plant that could
be used to extract fatty acids is also edible. It would be enough to use waste cooking oil,
beef tallow and yellow grease, but again all the problems related to feed impurities will
have to be solved, and new processes and catalysts would have to be researched and
optimized.
Conclusions
Biomass as a source of fuel, and thus energy, shows great advantages but also big
limitations. First of all, biofuels are in principle CO2 neutral. All the CO2 produced by
combustion, has been absorbed from the atmosphere by the plants, which makes them so
relevant in green chemistry. Biofuels are also sustainable, as they come from a renewable
resource. Those two last points are more or less common to all other renewable energy
sources, but what makes biomass unique is the chance to produce liquid carbon-based fuels
similar to petrol-derived ones. This means that the change of feedstock, from fossil to
renewable, would not require a radical change in the existing industries and technologies.
It is much easier to introduce something on the market if you do not have to modify and
reinvent every single process or instrument. Moreover, the possibility to produce fossil-like
10 Triglyceride
11 Glycerol
12 FAME
1 Methanol
Base +

16
fuels means that it is possible to efficiently store energy derived from a renewable
resource, which is not possible yet for all the others (at least until a viable way to
electrolyze water to hydrogen and store it is found). Finally, it is necessary to discuss the
effective gain in energy that biofuel could provide, i.e. the energy balance between the
energy necessary to produce biofuels and the energy provided by the same biofuels. The
subject is thoroughly discussed by Hill et al. and the outcome is that the balance is positive,
even if not outstanding [31].
Biofuels sound great, but after the advantages it is necessary to give a good look to the
drawbacks. Even with state of the art technologies and catalyst, there isn’t any process that
can be cost-competitive with fossil fuels. Every biofuel on the market can be afforded only
thanks to government support. It is most likely that, as the oil price rises and new
technologies lower the biofuel price, this situation will be eventually inverted.
Even with the most optimistic evaluations, biomass-based fuels will never be enough to
cover the world’s energy demand. There are different assessments and different opinions,
with the same core message: biomass potential for energy production is not enough and
other renewable resources will be necessary to fill that gap. In 2005 a report from USDA
estimated the amount of all agricultural and forest wastes at about 1.350 billion tons,
calculated to satisfy 30% of fuel transportation demand in the US [23]. Again in 2005 it
was calculated that devoting all US corn and soybean production would only cover 12%
and 6% of gasoline and diesel consumption, respectively [31].This introduces the ethical
problem concerning biomass conversion. The highest yield for biofuels production is
obtained by conversion of edible feedstock. Leaving aside every economic consideration
(food prices rising and the likes) I do not think it would be proper to throw food in the tank
when people are starving. On the other hand, when wastes are used in place of edible
feedstock, the situation is inverted. It is a good thing to be able to recycle wastes, which
would maybe otherwise pollute, into something useful; but using wastes as feedstock has
its downsides, mostly connected to the impurities present in the reactant. This lowers the
yield and requires more research to optimize the process. Another downside of wastes is
that they are usually a huge amount of matter with really low value and low production
potential. Therefore, transport of wastes is a relevant expense in the production process. In
order to decrease the transportation cost, wastes need to be treated in situ, to increase the
value/mass ratio. Pyrolysis or drying of agricultural wastes, prior to transportation to the
conversion plant, would increase the value of wastes.
17
An alternative to a waste-based industry is to grow plants for the specific purpose of
converting them to fuels. This should be done with non-edible plants in non-agricultural
terrain, such as seaweeds, or trees in non productive fields. Hopefully in the future it will
be possible to actively produce energy from wastes and non food competitive cultures.
1.1.2 BIOMASS TO CHEMICALS
Conversion of biomass to chemicals is a more complicated topic than conversion to fuels.
Even if the amount of raw material converted to chemicals is only a small fraction of what
is employed for fuel production, the wide range of target molecules, the variety of
processes and strategies and the difference in reactants makes the topic broader and harder
to summarize. At present three main categories of biomass-based materials are used for
chemicals production: carbohydrates, vegetable oils and, in much lower quantities,
terpenes. Big efforts are being made to include lignocellulosic materials in this list, but so
far only few processes are available [32].
Also strategies for conversion can be divided in three wide areas, the first being via
degraded molecules. Conversion via degraded molecules means that biomass is either
gasified to syngas or pyrolyzed to bio-oil. Those starting materials are then converted using
the standard oil industry processes. Hydrocarbons are made out of syngas and pyrolysis oil
is separated, fractionated and reacted to obtain standard petrol chemistry building blocks.
This is a waste of biomass potential, as complex and highly functionalized molecules are
reduced to small building blocks in order to rebuild complex molecules after several steps.
It is currently the most common way to convert biomass because it does not require new
synthetic routes or the study of new processes. Some really interesting studies have been
made in this field [33]. Such studies are necessary to promote biomass culture and
research. It is not realistic to think that, from one day to another, it will be possible to
abandon all the oil-based plants and rebuild new biomass-based ones. Therefore is
necessary to apply the old synthesis method to the new resource, at least for a while. It
goes by itself that this strategy will hardly be cost-effective. Energy is employed to convert
biomass to small and cheap molecules easily obtainable from petrol distillation.
A second approach to biomass conversion is via platform molecules. This concept is much
better suited for the complete employment of biomass potential. The general idea is to treat
biomass in a biorefinery, i.e. a facility where biomass is reacted to obtain fuels, power, heat
and valuable chemicals just as it happens in a modern oil refinery. This strategy requires

18
the study of a completely new kind of chemistry, which starts from new building blocks
and requires new processes and new catalysts. Of course there is a huge amount of work,
but it is the way to fully exploit biomass. Big efforts are made to promote the biorefinery
concept, and several new platform molecules have been proposed [34].
The third and last kind of approach is via one-pot reactions. It is even harder to achieve
than the biorefinery strategy. Commercial products are usually a mixture of different
chemicals. It is possible to directly convert the different component of biomass in a single-
pot reaction including several catalytic steps, and obtaining a commercial product. This
way most separation and purification steps would be skipped, reducing production cost and
pollution. Of course the design and optimization of a one-pot process is extremely hard,
but still some research in that direction has been made [35-38].
Before a short overview of relevant applications, a few important points about chemicals
from biomass should be underlined. According to current knowledge, to achieve a fully
sustainable society there is no way around conversion of biomass to chemicals. Even if it is
possible to obtain energy from other renewable resources, such as solar, using biomass as
feedstock is the only way to sustainably produce carbon and therefore chemicals. Another
advantage is that materials and products derived from biomass are usually biocompatible,
for example biodegradable polymers. Therefore conversion of biomass to chemicals does
not only help achieving sustainability but also reduces pollution.
Conversion of triglycerides
As explained before, triglycerides (10) are fatty acid esters of glycerol (11). Their physical
properties make them suitable as a substitute for lubricants. About 50% of lubricants leak
and are spread in the environment, therefore a biodegradable alternative to petrol-derived
lubricants would help reduce pollution. FAMEs (12) are better suited than triglycerides as
lubricants (their synthesis is described above, p.14) but still their oxidation resistance and
rheological properties need to be improved. This can be achieved by epoxidation of the
FAME followed by alcoholysis [39]. Traditionally epoxidation is performed with strong
acid liquid catalysis. Recently researches managed to make the process greener and more
economically favorable for industries by introducing a solid catalyst. Titanium supported
catalyst gave good yields and selectivity [40]. Alcoholysis is performed using methanol (1)
and acid resins. The reacted fatty acids proved to be suitable as lubricants and
biodegradables [41].
19
Further applications for triglycerides include conversion to surfactants and polymers
[42,43]. A related topic is the conversion of glycerol, produced after transesterification of
triglycerides, to more useful chemicals [44,45].
Conversion of carbohydrates
Carbohydrates are the largest amount of biomass-based material converted to chemicals,
mostly coming from two sources, sucrose and starch. Carbohydrates conversion is a wide
and complicated topic; it is really hard to find a suitable example to summarize every
possible application. Carbohydrates are mostly employed in food and pharmaceutical
industries, chemical modifications are required to fit carbohydrates to the needs of
industry. Instead of focusing on a single example, the most common chemical reactions
employed and their particularities will be shortly described.
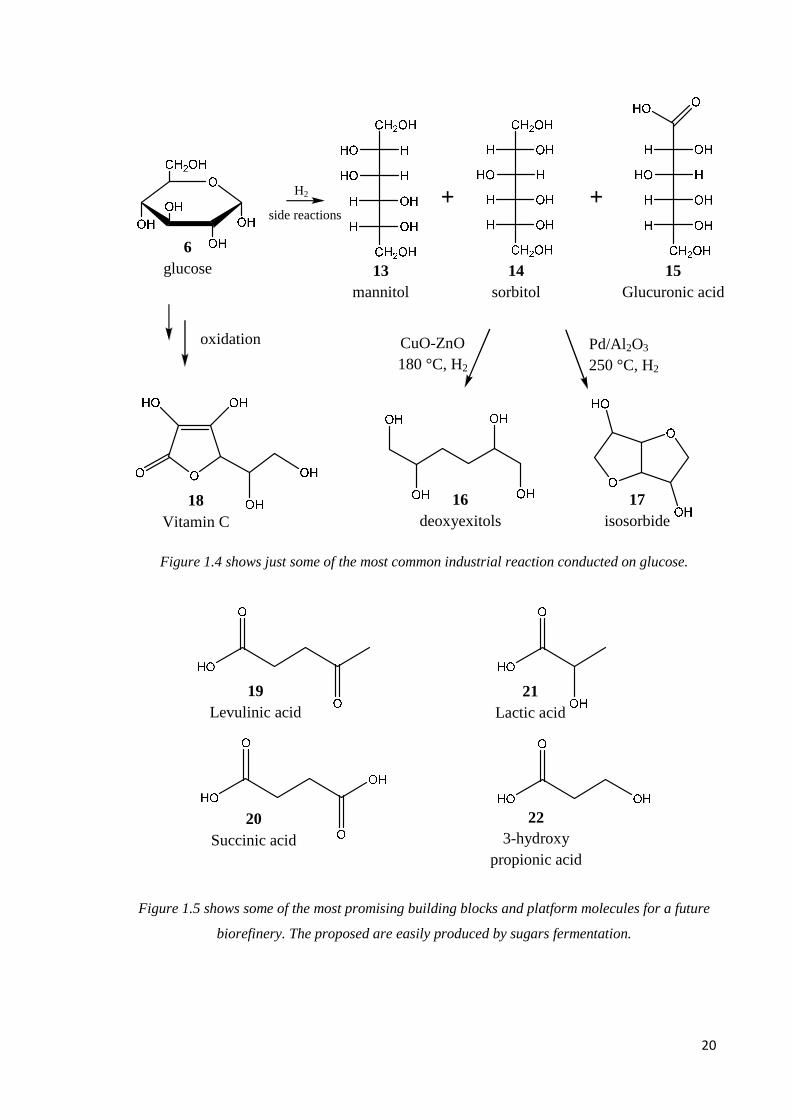
Hydrolysis of carbohydrates to obtain monosaccharides is probably the most common
reaction in this field [46]. Carbohydrates are easily hydrolyzed under mild condition, and
they do not present the problems described above for cellulose (4) (p.12). Once
monosaccharides, mostly glucose (6), are obtained, a common reaction is hydrogenation to
obtain mannitol (13) and sorbitol (14), with glucuronic acid (15) as a byproduct. As they
are employed in fine chemical industries, high yield and selectivity are required. Most
production is still based on Raney-Nickel catalysis, but ruthenium or platinum/ruthenium
catalysts seem to give good results [47]. Another interesting reaction is dehydroxylation
(C-OH bond breaking). The purpose is to produce deoxyhexitols (16) from sorbitol, which
can be used for polyester and polyurethane production instead of petrol derived molecules.
Copper-zinc catalysts are used to obtain deoxyhexitols while Palladium catalysts produce
isosorbide (17) [48]. Finally, carbohydrate oxidation is widely employed to obtain added
value chemicals, such as vitamin C (18). Most reactions are carried out with homogeneous,
enzymatic or microbial catalysis [49]. Figure 1.4 shows some examples for the reactions
described above. Despite all the possible application seen so far, carbohydrates present an
even more important feature. In fact most of the molecules proposed as biorefinery
building blocks are derived from saccharides fermentation. Levulinic acid (19), succinic
acid (20), 2-hydroxypropionic acid (lactic acid) (21), and 3-hydroxypropionic acid (22) are
all products of carbohydrate fermentation and they are currently the focus of a lot of
studies. Hopefully, in the future, those will be the platform molecules that will sustain
chemical industry [34,50-52]. Figure 1.5 shows the proposed future biorefinery building
blocks.
20
Figure 1.4 shows just some of the most common industrial reaction conducted on glucose.
Figure 1.5 shows some of the most promising building blocks and platform molecules for a future
biorefinery. The proposed are easily produced by sugars fermentation.
13 mannitol
15 Glucuronic acid
14 sorbitol
Pd/Al2O3 250 °C, H2
CuO-ZnO 180 °C, H2
17 isosorbide
6 glucose
21 Lactic acid
19 Levulinic acid
22 3-hydroxy
propionic acid
20 Succinic acid
oxidation
18 Vitamin C
16 deoxyexitols
H2 + + side reactions
21
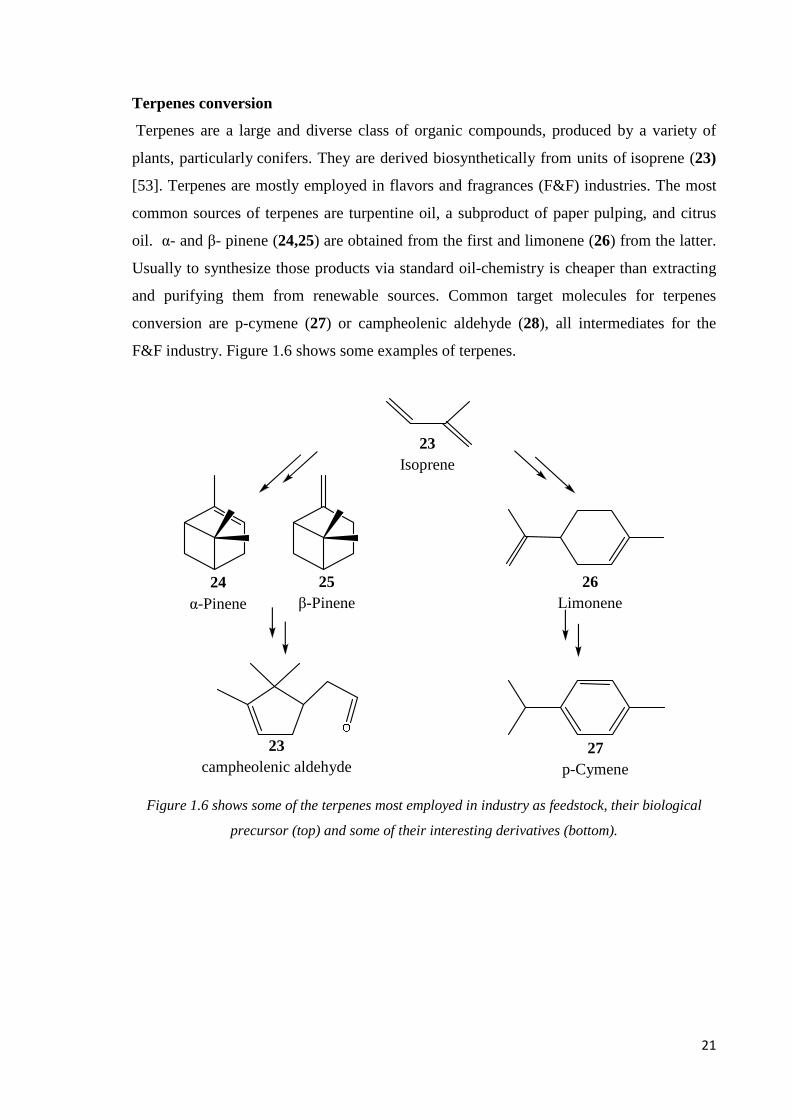
Terpenes conversion
Terpenes are a large and diverse class of organic compounds, produced by a variety of
plants, particularly conifers. They are derived biosynthetically from units of isoprene (23)
[53]. Terpenes are mostly employed in flavors and fragrances (F&F) industries. The most
common sources of terpenes are turpentine oil, a subproduct of paper pulping, and citrus
oil. α- and β- pinene (24,25) are obtained from the first and limonene (26) from the latter.
Usually to synthesize those products via standard oil-chemistry is cheaper than extracting
and purifying them from renewable sources. Common target molecules for terpenes
conversion are p-cymene (27) or campheolenic aldehyde (28), all intermediates for the
F&F industry. Figure 1.6 shows some examples of terpenes.
Figure 1.6 shows some of the terpenes most employed in industry as feedstock, their biological
precursor (top) and some of their interesting derivatives (bottom).
26 Limonene
23 Isoprene
27 p-Cymene
25 β-Pinene
24 α-Pinene
23 campheolenic aldehyde
22
Conclusions
A common feature in most of the applications is the amount of research devoted to find
solid catalysts for existing processes [54]. Solid catalysis is loved by industries because it
drastically reduces production costs, therefore research on solid catalysts achieve the goal
of making biocompatible processes economically viable. This is not the only advantage
provided. Using a solid catalyst usually means reducing the amount of solvent used or
being able to separate a product by filtration instead of distillation. Of course this is the
reason for the great economical advantage of solid over liquid catalysts, but what is usually
forgotten is the ecological advantage. Less solvent also means less solvent leaking in the
environment, smaller plants and lower risk of accidents. Less energy employed for
separation means less CO2 emission. And solid catalysts are less likely to leak out of the
reactor than liquid ones, reducing the risk of environment pollution. Even though every
application reported uses edible feedstock, it is possible to use wastes or non-food
competitive plantation instead. Just as for biofuels, cellulose (4) from agricultural wastes
could be used as a substitute for commonly employed carbohydrates, while waste oil could
replace vegetable oil. Of course, just as for biofuels, employing wastes as feed causes low
yield and production problems, linked to impurities, which need to be overcome. The way
to a biobased chemical industry is still long.
1.1.3 CONCLUDING REMARKS
The advantages and disadvantages of biomass, compared to other renewable resources and
compared to fossil fuels, have been discussed and some examples of applications of
biomass in industry have been made. Everything will be shortly resumed here. The main
advantage of biomass is being a renewable resource that produces carbon. This leads to:
1. Unique possibility, among the other renewable resources, of sustainably produce
chemicals.
2. Production of fossil-like fuels, which can employ current technologies and can be
stored.
3. Reduction of pollution, with CO2 neutral fuels and biocompatible chemicals.
As a bonus, biomass resources are more evenly distributed in the world than fossil fuels,
increasing energy independency for many countries.
23
Biomass has also several disadvantages, in particular:
1. Non cost-competitive with petrol-derived products. (Just like many other renewable
resource so far).
2. Chemicals could be efficiently produced only trough a brand new chemistry. Every
synthesis should be renewed and reinvented.
3. Competitive with food production. Employment of wastes to avoid competition
leads to several production problems.
4. Low energy production potential, at least another renewable resource will be
needed.
Overall biomass conversion is a wide, complex and expanding sector, with many particular
aspects that still need to be researched. Our work deals with one of those specific aspects:
lignin, which will be discussed in the next chapter.
1.2 Lignin
Lignin is one of the major constituents of wood, amounting to 20-30% of wood dry matter.
This makes it the second most abundant biopolymer on earth, after cellulose (4). Lignin
covers several fundamental roles in plant biology, for example it increases the cell wall
resistance to compression, which is crucial for wood structural integrity. Moreover lignin is
the compound responsible for waterproofing the cell wall, which allows transport of water
and nutrients in the plants vascular system. Finally, lignin plays a role in plants defense
against pathogens attacks. Evidence suggests that lignin has evolved in plants during land
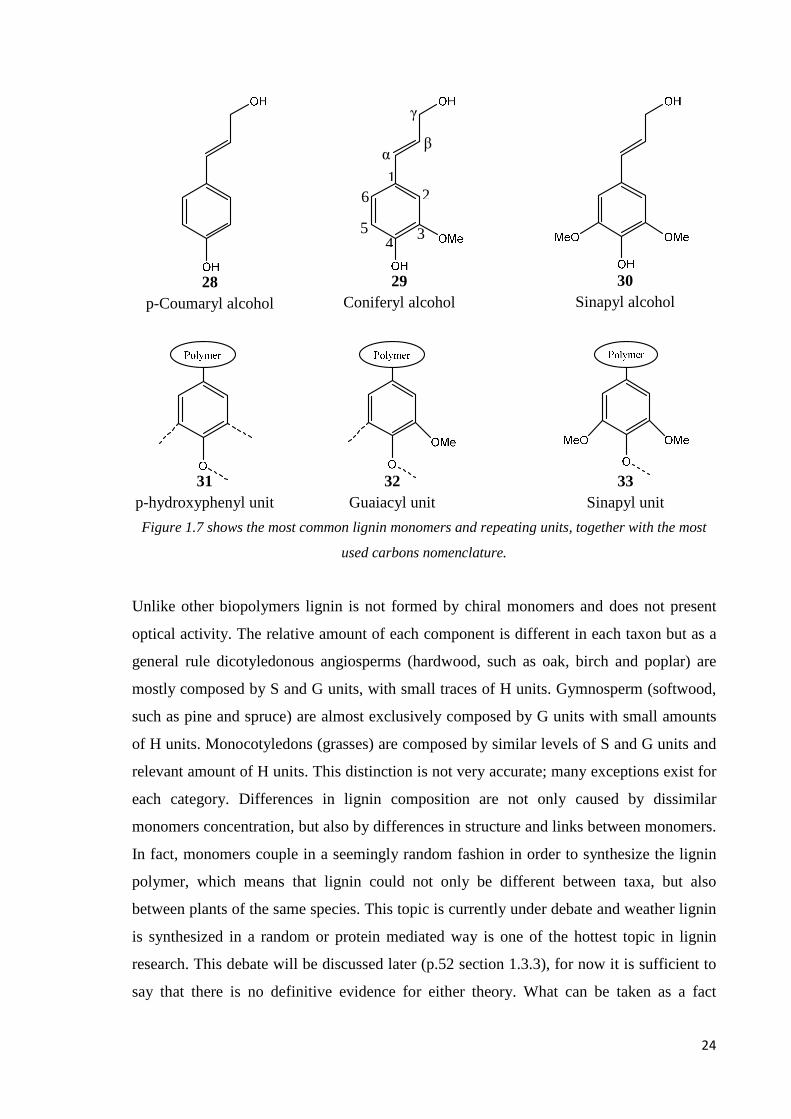
colonization [55]. Lignin is a polymer mostly constituted by three hydroxycinamyl
alcohols, which only differ in the degree of methoxylation: p–coumaryl (28) (MH),
coniferyl (29) (MG) and sinapyl (30) (MS) alcohols. When they are linked to the polymer
matrix they are usually referred to as p-hydroxyphenyl (31) (H), guaiacyl (32) (G) and
sinapyl (33) (S) phenylpropanoid units. Lignin monomers, with carbons nomenclature are
shown in Figure 1.7.
24
Figure 1.7 shows the most common lignin monomers and repeating units, together with the most
used carbons nomenclature.
Unlike other biopolymers lignin is not formed by chiral monomers and does not present
optical activity. The relative amount of each component is different in each taxon but as a
general rule dicotyledonous angiosperms (hardwood, such as oak, birch and poplar) are
mostly composed by S and G units, with small traces of H units. Gymnosperm (softwood,
such as pine and spruce) are almost exclusively composed by G units with small amounts
of H units. Monocotyledons (grasses) are composed by similar levels of S and G units and
relevant amount of H units. This distinction is not very accurate; many exceptions exist for
each category. Differences in lignin composition are not only caused by dissimilar
monomers concentration, but also by differences in structure and links between monomers.
In fact, monomers couple in a seemingly random fashion in order to synthesize the lignin
polymer, which means that lignin could not only be different between taxa, but also
between plants of the same species. This topic is currently under debate and weather lignin
is synthesized in a random or protein mediated way is one of the hottest topic in lignin
research. This debate will be discussed later (p.52 section 1.3.3), for now it is sufficient to
say that there is no definitive evidence for either theory. What can be taken as a fact
28 p-Coumaryl alcohol
29 Coniferyl alcohol
30 Sinapyl alcohol
31 p-hydroxyphenyl unit
32 Guaiacyl unit
33 Sinapyl unit
α
γ
β
6
5 4
2
3
1
25
though, is that lignin has an incredibly complicated structure. Even if an ordered, protein
mediated structure exists, it has not been found yet. Lignin composition is also influenced
by plants age, which increases the complexity of the picture [56], but what really makes
lignin structure so elaborate is the amount of possible links between constituting units.
Lignin synthesis starts with radical oxidation of one of the monomers, usually oxidizing a
free alcohol. The radical is stable due to the many possible resonances provided by the
aromatic ring and the conjugated double bond. This radical then reacts with another radical
monomer or with the growing polymer chain, the latter being by far the most likely option.
As the radical electron can be localized in many sites, all these sites are then viable for the
formation of the new bond, which leads to several possible inter-unit linkages.
1.2.1 LIGNIN LINKAGES
Lignin, or as someone calls it, lignins, due to the wide variety and diversity of this
polymer, present certain prominent inter-unit linkages. As said before, most of the linkages
derive from monomer-oligomer or oligomer-oligomer coupling reactions, while monomer-
monomer couplings have a small influence, probably because of the extremely diluted
reaction conditions. The name of the linkages is determined by the carbon atoms involved
in the bond, according to the nomenclature shown in Figure 1.7. The most important
linkages are arylglycerol β-aryl ether (β–O–4) (34) and phenylcoumaran (β–5) (36),
(probably derived from monomer oligomer couplings) biphenyl (5–5’) (37) and
biphenylether (4–O–5’) (39), (from oligomer-oligomer couplings), resinol (β–β) (40) and
1,2-diarylpropane (β–1) (41) couplings. A detailed description of the most important
linkages is given below. Not every linkage appears in lignin with the same frequency, and
not every monomer is available for every kind of linkage. For example S units (33) cannot
form a bond in position 5, while β is the most reactive position and most usually
connected. Some bonds are predominant in dimers formation, but they are much less
present in lignin and vice versa. For example 5-5 and 4-O-5 bonds are not present in
dimers, while β–β bonds are not likely found in polymers. Whether this is under simple
chemical and kinetic regulation or it is protein mediated will be discussed in the
appropriate section (p.52 section 1.3.3).
26
Arylglycerol β-aryl ether (β–O–4)
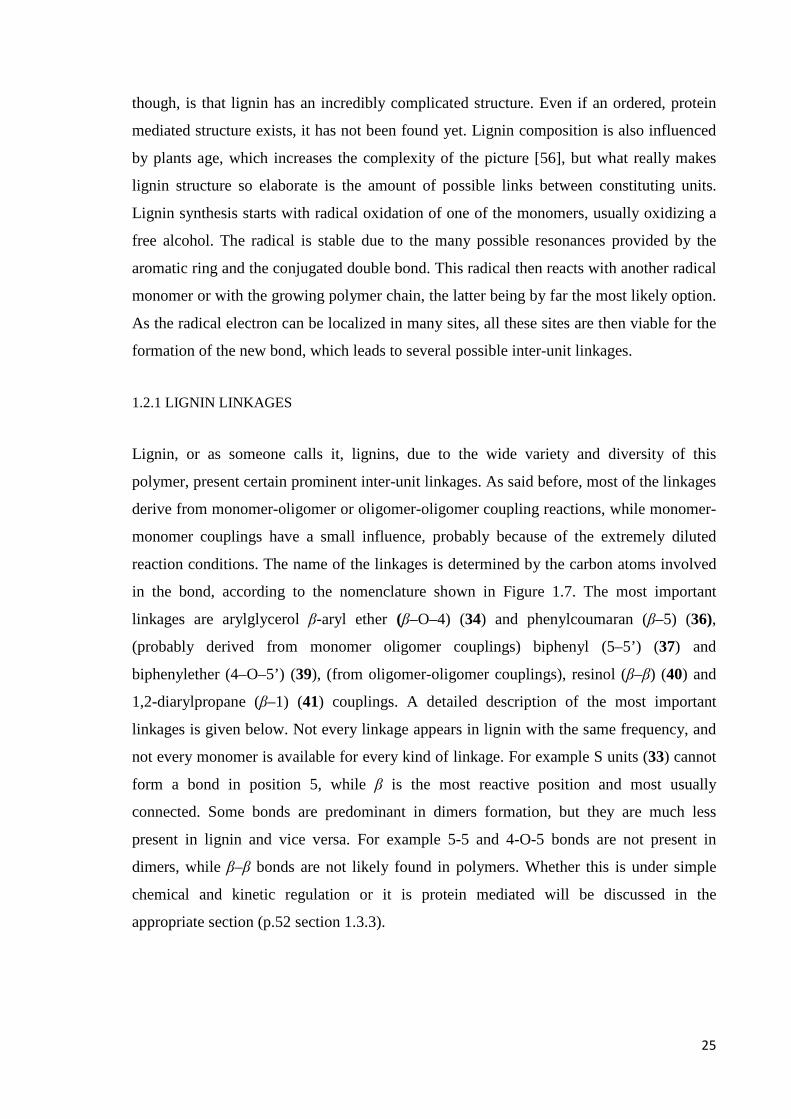
The β–O–4 bond (34) is the most abundant link in lignin and the most easily broken during
pulping processes. β–ethers (β–O–4 linked units) are formed after radical reaction of the β
position of a monomer with a free oxygen in position 4. Addition of water to the quinone
methide intermediate (35) re-establishes the compound aromaticity and leads to the final
product. Every monomer reacting at the β position has a quinone methide intermediate and
undergoes a similar reaction. As shown in Figure 1.8 the water molecule can attack the
quinone from both sides, resulting in two distinct isomers, erythro and threo. This
nomenclature comes from carbohydrate chemistry and it is just one of the many existing
ways to distinguish between isomers. The isomers are different in both physical and
chemical properties and therefore it is relevant to understand the mechanism behind their
distribution. Evidence suggests that the reaction is kinetically controlled and that
thermodynamics plays a secondary role. Guaiacyl β–ethers are present in lignin with a
50:50 erythro/threo distribution, consistent with thermodynamic equilibrium, but in
Syringyl β–ethers the ratio is 75:25 where thermodynamic distribution should be 55:45
[57,58]. Similar data are gathered from β-β linkages, of which only one isomer is usually
found instead of the 1:1 ratio expected from thermodynamics [59].
Figure 1.8 shows the reaction mechanism for the formation of the β-O-4 linkage. After radical
coupling and quinone methide intermediate formation, a water molecule attacks the α position and
restore aromaticity.
34 β-O-4
29 Coniferyl alcohol
H+
H2O
35 Quinone methide
Nucleophilic substitution Radical coupling OH2
27
Phenylcoumaran (β–5)
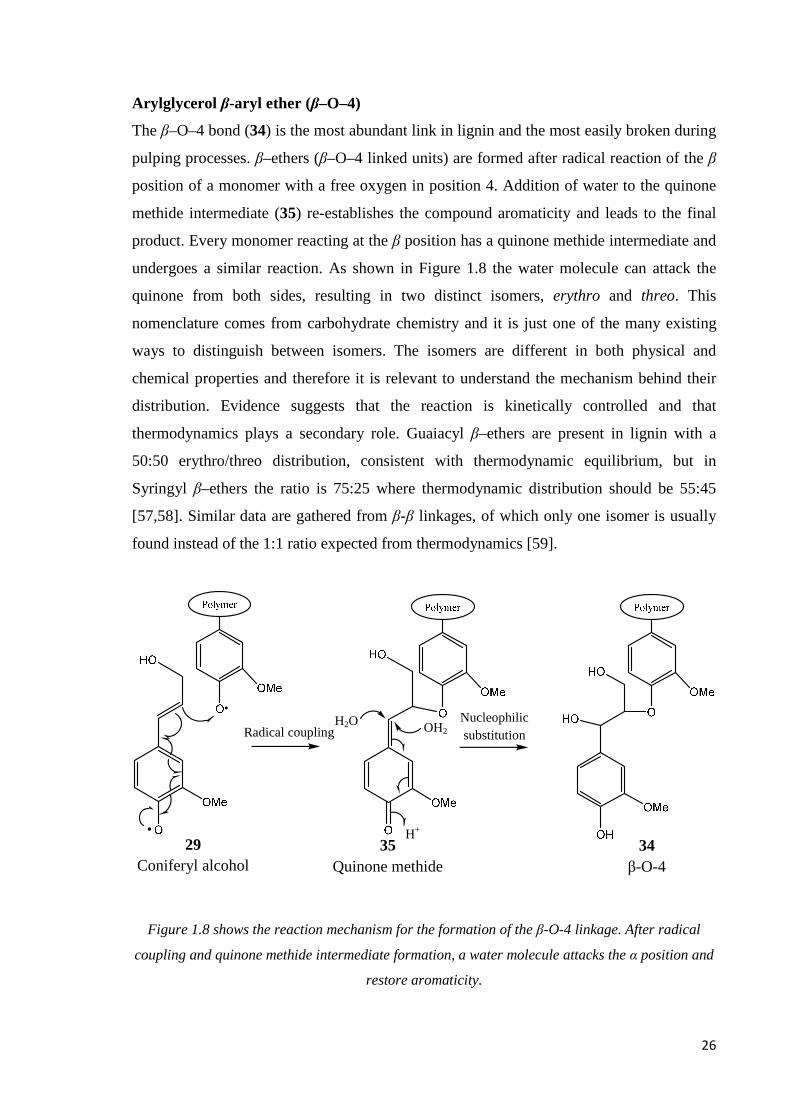
Phenylcoumaran (36) is another major linkage in lignin. As previously discussed, the
mechanism for its formation includes radical reaction between position β of the first
monomer and position 5 of the second, to produce the quinone methide intermediate (35).
As opposed to the β–O–4 bond (34), in this reaction water does not attack the quinone
methide. The α position of the first monomer is attacked by the free phenol of the second,
which restores aromaticity and forms the β–5 bond. Reaction mechanism is shown in
Figure 1.9.
Figure 1.9 shows the reaction mechanism for the formation of the β-5 linkage. In this reaction,
after the formation of the quinone methide intermediate, the aromaticity is restored by nucleophilic
attack of the free alcohol on position 4.
Dibenzodioxocin ring and 5-5’ bond
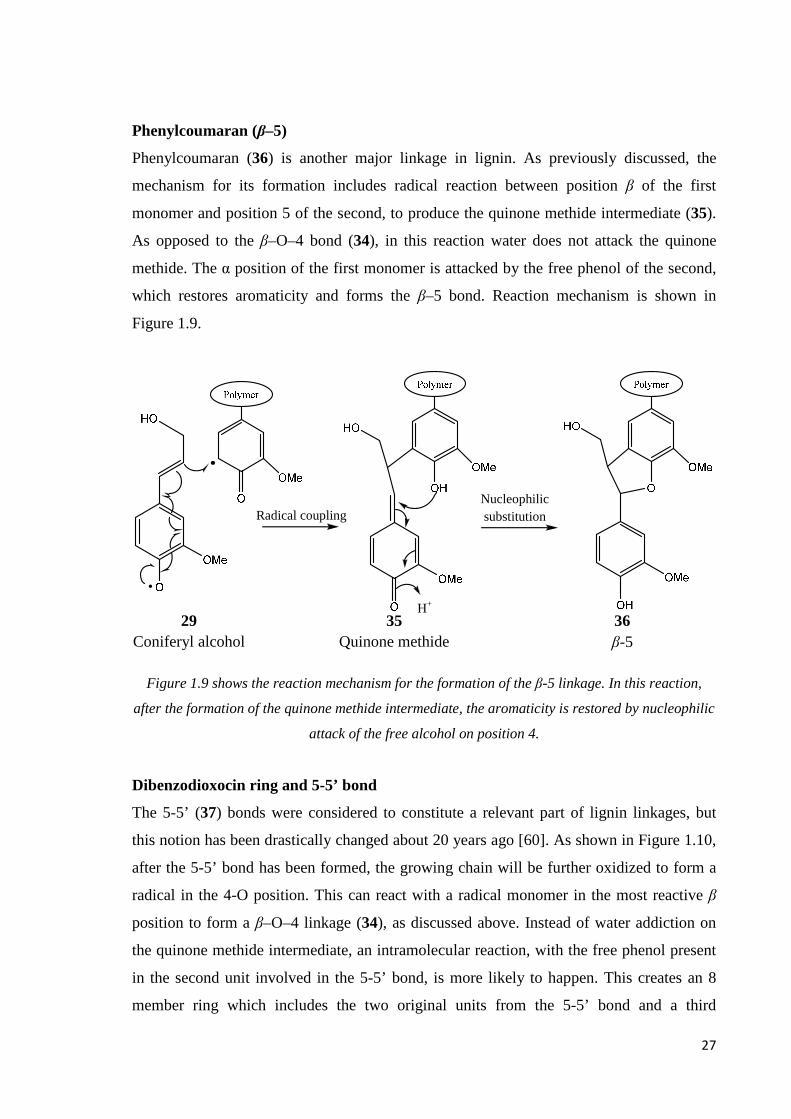
The 5-5’ (37) bonds were considered to constitute a relevant part of lignin linkages, but
this notion has been drastically changed about 20 years ago [60]. As shown in Figure 1.10,
after the 5-5’ bond has been formed, the growing chain will be further oxidized to form a
radical in the 4-O position. This can react with a radical monomer in the most reactive β
position to form a β–O–4 linkage (34), as discussed above. Instead of water addiction on
the quinone methide intermediate, an intramolecular reaction, with the free phenol present
in the second unit involved in the 5-5’ bond, is more likely to happen. This creates an 8
member ring which includes the two original units from the 5-5’ bond and a third
35 Quinone methide
29 Coniferyl alcohol
Radical coupling
36 β-5
H+
Nucleophilic substitution

28
monomer, bonded in α and β positions. This unit is named dibenzodioxocin (38) ring. Most
of the 5-5’ bonds in lignin are now considered to be part of a dibenxodioxocin ring. This
unit, together with 4-O-5 (39), is responsible for branching points in lignin, which would
otherwise be linear. Both 5-5’ and 4-O-5’ bonds are shown in Figure 1.11, along with other
lignin linkages.
Figure 1.10 Shows the formation of a β-O-4 bond on an already formed 5-5’ linkage and the
following closure of the dibenzodioxocin ring. The ring closure proceeds by free alcohol attach on
the quinone methide, to restore aromaticity.
Resinol (β–β), 1,2-diarylpropane (β–1) and other bonds.
Resinol (β–β) (40) bonds cover a minor amount of lignin linkages. They were initially
thought to originate from two monomers coupling in the most favorable position for both,
to form the β–β dehydrodimer, pinoresinol. This dimer would then be the starting point of
the growing polymer chain, explaining the low concentration of this bond. This theory was
later disputed by degradation study. β–ether cleaving methods (acidolysis, thioacidolysis
and others, discussed in detail pp. 39-40) revealed only traces amount of pinoresinol and
early work evidence of β–β presence was found to be wrong [61-63]. Further investigation
of thioacidolysis trimers showed that most β–β units are linked with 4-O-5’ (39) bonds,
35 Quinone methide
29 Coniferyl alcohol
38 Dibenzodioxocin ring
Radical coupling
H+
Nucleophilic substitution
29
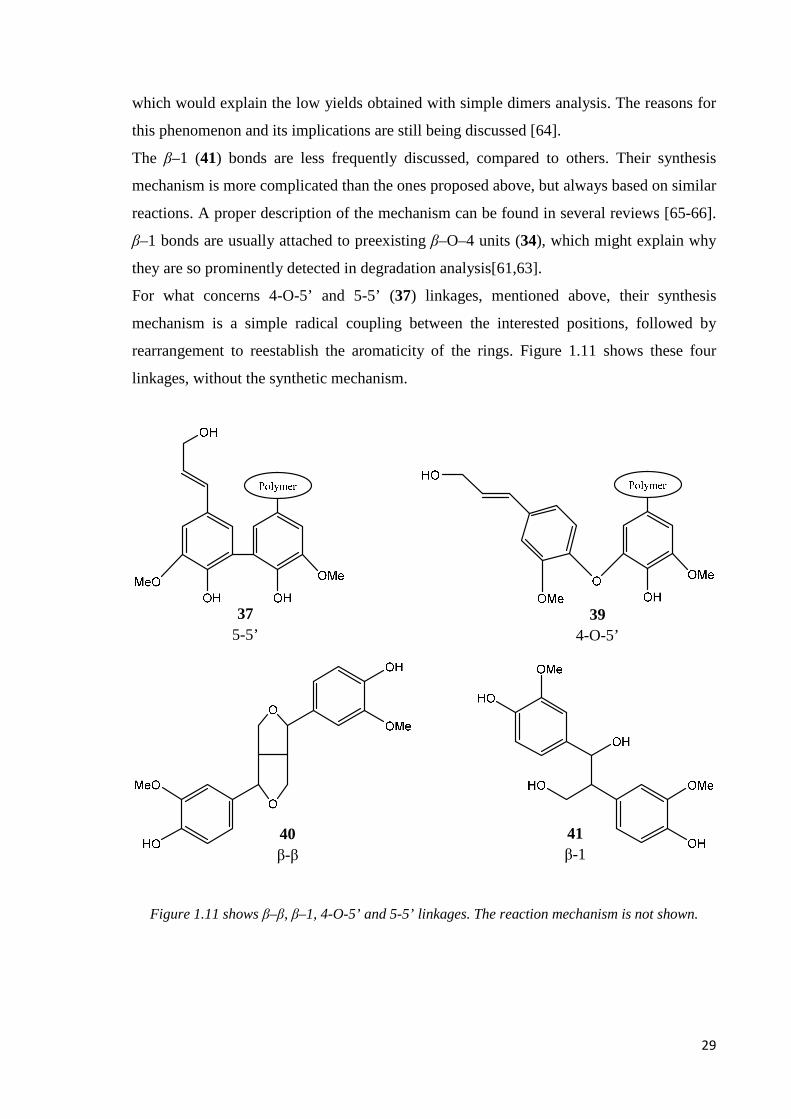
which would explain the low yields obtained with simple dimers analysis. The reasons for
this phenomenon and its implications are still being discussed [64].
The β–1 (41) bonds are less frequently discussed, compared to others. Their synthesis
mechanism is more complicated than the ones proposed above, but always based on similar
reactions. A proper description of the mechanism can be found in several reviews [65-66].
β–1 bonds are usually attached to preexisting β–O–4 units (34), which might explain why
they are so prominently detected in degradation analysis[61,63].
For what concerns 4-O-5’ and 5-5’ (37) linkages, mentioned above, their synthesis
mechanism is a simple radical coupling between the interested positions, followed by
rearrangement to reestablish the aromaticity of the rings. Figure 1.11 shows these four
linkages, without the synthetic mechanism.
Figure 1.11 shows β–β, β–1, 4-O-5’ and 5-5’ linkages. The reaction mechanism is not shown.
39 4-O-5’
37 5-5’
41 β-1
40 β-β

30
Cross-links
Quite some time has been devoted to the identification and description of the most
common linkages between lignin monomers. It is now time to focus on the relation
between lignin and other cell wall elements, in particular polysaccharides. There are
several kind of bonds between lignin and polysaccharides, the first is an ester bond
between a glucuronic acid (15), present in hemicellulose (5), and any free hydroxyl group
present on lignin surface, mostly in α and γ positions. Evidence for the existence of these
links is provided by borohydride (42) reduction and 2,3-dichloro-5,6-dicyano-p-
benzoquinone (43) oxidation studies [67]. Esters in α could also be formed via quinone
methide intermediate (35), after direct attack of glucuronic acid. Lignin can also be linked
to hemicellulose via ether links. Most likely Glucose (6) and Mannose (9) units are
responsible for those links, through reaction of a hydroxyl group with a quinone methide
on lignin surface [67]. The third kind of link is provided by hydroxycinnamic acids. They
are known to produce ester bonds with polysaccharides and ether or ester bonds with
lignin. Ferulic acid (49)(fig. 1.14), being bifunctional, is capable of joining lignin and
hemicellulose together by bonding a polymer on each side, creating an ester-ether bridge.
Several bonds on both sides are possible. Most likely ferulic acid incorporated in
polysaccharides will react either at the α position, via quinone methide reaction, or will be
incorporated in lignin radical oxidation reaction and form a β–ether [68,69]. Every cross
link discussed above is between hemicellulose and lignin. There is no solid evidence of
links between lignin and cellulose (4) or lignin and proteins at present, even if current
research and beliefs point in that direction. The mentioned molecules are reported in Figure
1.12

31
Figure 1.12 Shows 2,3-dichloro-5,6-dicyano-p-benzoquinone, sodium borohydride and ferulic
acid. The first two are employed for the anlaysis of lignin cross links. Ferulic acid is involved in
cross-links formation . Due to its bifunctionality, it can bond with both polysaccharides and lignin.
The two ends of the molecule can form ether or ester bonds with other alcohols or quinone
methides. Ferulic acid can be linked to lignin by radical oxidation and coupling.
1.2.2 LIGNIFICATION
Xylem is one of the two types of transport tissue in vascular plants and its main function is
the transport of water and nutrients. Lignin deposition takes place at the end of xylem cells
differentiation process, during secondary thickening of the cell wall. Cell wall is composed
by three layers: inner (S1) middle (S2) and outer (S3) layers. Lignin deposition always
occurs after carbohydrates deposition and it is strictly regulated both temporally and
spatially. Deposition starts in the cell corner, in the middle lamella and in the primary wall,
once the carbohydrates deposit in S2, lignin starts growing in the secondary wall. Lignin
penetrates the porous carbohydrate matrix, creating bonds and hardening the structure of
the cell wall, making it capable of resisting weight and tension [70]. Lignin concentration
is higher in the cell corners and in the middle lamella, however the highest amount of
lignin is found in the secondary wall, because it includes bigger parts of the cell wall.
Environmental conditions can modify lignifications, for example tension wood in
angiosperms has a higher crystalline cellulose (4) content and lower cellulose
concentration, while compression wood in gymnosperms is just the opposite. Monolignols
concentration and distribution is regulated as well. Lignification begins with high
concentration of H units (31), followed by G (32) and later on S units (33). Monomers
distribution is not only temporally regulated, but also spatially. Different parts of the plant
are composed by different monomers concentration, which is also valid for compression
wood in gymnosperms [71].
42 Sodium Borohydride
49 Ferulic acid
43 2,3-dichloro-5,6-dicyano-
p-benzoquinone

32
Hypothesis and theories
A great deal about how lignification happens is already known, what is not still properly
understood is how everything is controlled and what the implications are. For example, the
influence of carbohydrates on lignin growth is well documented by several studies, both on
in vivo lignin and on in vitro dehydrogenation polymer (DHP). Cellulose (4) is necessary
for lignin localization, without cellulose, lignin spreads across the cellule. Moreover,
evidence suggests that cellulose presence is also relevant for lignin orientation [72,73].
Yet, it is still unknown what kind of bonds or interactions are formed between lignin and
cellulose, and how its control over lignin actually happens.
It is known form electron microscopy that 3D lignin growth is organized, that in middle
lamella the polymer grows in spherical aggregates, while in secondary wall is more
stretched and oriented, but again the reasons or causes behind this phenomenon remain
mysterious [74]. It has been explained that each kind of monolignol is deposited at specific
times and in different parts of the plant, and of course such a precise organization needs
some sort of control mechanism [56]. The most likely hypothesis is that monolignol
diffusion is controlled by the biosynthesis reaction rates, and by the selectivity of each
enzyme involved in monolignol synthesis, but no definitive evidence of this fact exists.
Moreover, it is uncertain how monolignols are actually transported to the cell wall from
cytoplasm after their synthesis, another factor that could help understanding how their
distribution is controlled. The traditional theory is that coniferyl alcohol (29) is transported
as glucoside into the cell wall and then liberated. This theory originated from the presence
of UDP-G1c: coniferyl alcohol 4-O-glucosyltransferase in cytoplasm and of a coniferin-
specific 4-O-glucosidase in the cell wall. Those two enzymes are supposedly responsible
for the formation and braking of the glucoside, respectively. The activity of both enzymes
does not significantly decrease with sinapyl (30) alcohol as a substrate. Therefore coniferyl
alcohol (as well as the other monomers) is thought to be converted to coniferin (coniferyl
alcohol glucoside) in cytoplasm, diffused into the cell wall and then reconverted to
coniferyl alcohol by the 4-O-glucosidase [75]. This theory cannot explain what happens to
the glucose (6) liberated in the cell wall after glucoside scission. There is no evidence of
free glucose in the cell wall and usually carbohydrates deposition is completed once lignin
deposition starts [65]. Therefore either this theory is wrong or it is incomplete, but no other
solutions or hypothesis have been presented so far.
The last doubt about lignifications concerns nucleation sites. How and where lignin starts
to grow? There are three possible candidates for this role. The least likely hypothesis is that

33
the enzymes responsible for polymerization are trapped in the cell wall, but empiric
evidence disagrees with this hypothesis [76]. Arrays of dirigent sites, constituted by proline
rich proteins, are also thought to be contenders for the role of nucleation sites. The array of
proteins would start the polymerization and control the orientation of each monomer in the
growing chain [77]. Finally, the last option is to consider ferulic acid (49) responsible for
binding the first lignin monomers to the polysaccharide chain. As explained before ferulic
acid is bifunctional and while trapped in the carbohydrate chain could participate to lignin
polymerization and act as a starting site [78]. There is no compelling evidence for either of
those two last options, nucleation sites are still an open debate in lignin chemistry.
Peroxidases and Laccases
Another topic that is still partially unknown in lignification is the role of peroxidases and
laccases, the enzymes supposedly responsible for monolignols radical oxidation.
Peroxidases are a family of glycoproteins, containing a heme group and usually
monomeric. In vitro experiences prove that peroxidases are able to radically oxidize
cinnamyl alcohols and other phenolics in presence of H2O2 [65]. Laccases on the other
hand, are blue metallo-proteins, with 4 Copper atoms in the catalytic center. Laccases
employ molecular oxygen as a reactant to oxidize phenolic substrates. It has not been
confirmed by unquestionable experimental proof which enzyme is involved in
lignification, so far circumstantial evidence suggests that both might. In any case, the role
of the enzyme is to oxidize both the monomer and the growing polymer, before actual
polymerization can happen. The most credited hypothesis is that the enzyme does not
directly oxidize the growing polymer chain; instead a free electron is transported to the
polymer and exchanged via radical transfer by small oxidized molecules, like monolignols.
There are several reasons why, even after 60 and more years of research the role of these
enzymes is still uncertain. First of all, the wide amount of isoenzymes in different plants,
all able to oxidize monolignols but with different specificity and reactivity, makes
generalization difficult [79]. In addition, the overall complexity of the lignifications
process creates problems with enzyme sub cellular location and temporal correlation. For
what concerns peroxidases, endogenous H2O2 has been detected in lignifying tissues and
addition of an H2O2 scavenger caused lignin content to decrease [80]. Genetic upregulation
of peroxidase activity increased lignin content, but its downregulation did not have any
remarkable effect [81]. As stated before, involvement of peroxidases in lignifications is
plausible, but not certain. Colocalization of H2O2 in lignifying tissues could be related to

34
other processes and the increase of lignin content after upregulation could only be a side
effect. Laccases presence have been found in lignifying tissues, tightly bound to the cell
wall, and oxidase activity different from peroxidases have been detected during
lignifications [82]. It is possible that both enzymes are involved in lignifications, maybe at
different times. Laccases could be responsible for the beginning of polymerization reaction
and monolignol-monolignol coupling, while peroxidases would intervene later on, during
the polymer chain growth. Those are only speculations and more concrete evidence is
necessary.
1.2.3 APPLICATIONS
After a theoretical treatment of lignin, it is necessary to describe what is the real influence
of this biopolymer in the world, which are the possible applications and how is it relevant
for the industrial production. For many applications, lignin is usually considered a problem
and obstacle to be overcome. The reason is that most applications for wood require
cellulose (4), and lignin is just an impurity that needs to be eliminated. An obvious
example is paper industry, where cellulose is required to be as pure as possible to obtain
white paper.
Paper industry
Cellulose (4) is required to produce paper, but what is more relevant for our topic, is that
lignin is considered an impurity with adverse effects and therefore several strategies for its
removal have been designed. The process of separation of polysaccharides from lignin is
called pulping and it is accomplished in several ways. The most relevant is Kraft or sulfate
pulping, which covers about 70% of all chemical pulping production. During Kraft pulping
wood chips are cooked with the so called white liquor, a solution of NaOH and NaS2.
During cooking the sulfite and the hydroxyl base react with lignin, mainly breaking the α-
or β- ether bonds. Most reactions take place via nucleophilic addiction of the base to a
quinone methide (35) intermediate. The ether bond is then cleaved by internal bonds
displacement thanks to the participation of the introduced neighboring group, as shown in
Figure 1.13.

35
Figure 1.13 shows the mechanism of one of the most common reactions in paper pulping. The
pulping base reacts with the quinone methide intermediate and then breaks the ether bond by
internal bonds displacement.
Other side reactions are possible, but a specific study of pulping is beyond the purpose of
this work. A complete analysis can be found in specific reviews [83]. It is enough to say
that during pulping the easily breakable ether bonds in lignin are cleaved, while the
stronger C-C bonds are retained. As a result, about 95% of lignin becomes soluble and it is
then easily separated from the insoluble cellulose bulk. The aqueous phase now contains
exhausted chemicals, the residual lignin and all the aliphatic acids produced by pulping
reactions, together with every chemical derived from other lignin components (extractives
etc…). This aqueous phase, made dark by the molecules in solution, takes the name of
black liquor and it is combusted for energy production and chemicals recovery. After the
pulping step, cellulose needs to be bleached before white paper can be obtained.
Other pulping processes include sulfite pulping, where pH can be regulated to obtain
different results, anthraquinone pulping and soda pulping.
Another option scarcely considered is organosolvent pulping. It is based on dissolving
lignin in organic solvents such as phenol, cresol, methanol (1) or others with the help of
acid or basic catalysis. Finally, some mechanical pulping processes are possible, but the
yield and the separation degree are not adequate for chemical industry.
34 β-O-4
- OR - OH
35 Quinone methide
-OH
- -

36
Other applications hindered by lignin
As widely discussed, (pp. 10-22 sections 1.1.1, 1.1.2) when lignocellulosic materials are
employed for biomass conversion in place of high sugar containing feedstock, it is
necessary to use pure cellulose (4) as feed. The same pulping processes employed in paper
industries can be applied in this field.
Another field that is negatively affected by lignin is cattle feeding; in fact it has been found
that lignin content decrease digestibility in grasses. More specifically, this effect is
determined by the presence of ferulate cross links and not directly by the lignin content,
but no decisive evidence is available. The research in this field is currently pointing toward
plants genetic modification, in order to reduce either the lignin content or the frequency of
ferulate cross links. Of course, before even thinking of introducing genetically modified
organisms in our food chain, their effects and ecological impact should be carefully
studied.
Lignin applications
Despite being a hindrance for many applications, lignin can also be used to produce
something useful. Few or any projects for lignin employment are currently available for
industrial level production, therefore lignin is only considered as a waste sub product of
paper production and it is normally burned. Being able to exploit better this huge
renewable resource could be an important step toward sustainability, which is why more
and more studies are focused on lignin conversion. Research on lignin applications is at a
very early stage, but it is spread in many different sectors.
The most relevant process, probably the only industrial conversion of lignin, is the
production of vanillin from catalytic oxidation of lignosulfonate. Purification of the
reactant obtained from black liquor or other pulping byproducts is expensive and vanillin
produced from traditional oil chemistry is still more economically convenient [84].
Conversion of lignin to chemicals is at a very early stage, preliminary studies are being
conducted on lignin, mostly oriented toward enzymatic reactions. Different kinds of lignin
are being tested in different reaction conditions to discover which products are easily
generated and whether or not there is a chance to obtain useful molecules [85]. Less
complicated studies are aimed toward using lignin as a material without major
modification, for example as a building or insulant material. Even without a high added
value these applications offer the chance to employ a waste material for something useful
and could potentially make use of high amounts of lignin. In a recent study lignin was used
37
to synthesize a polyurethane-based geocomposite, polymeric foam injected in the ground
to make it more resistant. This foam could be employed in mines, to prevent the risk of
tunnel collapsing. Other than recycling a waste product, this application offers another
advantage. Being derived from biomass this polymer is biodegradable and much more eco-
friendly than a regular polymer, a relevant feature for something that has to be injected in
the ground [86]. Several other possible uses of lignin are being investigated, but any real
introduction of lignin as an industrial feedstock is still far away.
1.2.4 LIGNIN ANALYSIS
From what said so far, it is easy to reckon that lignin is a very complicated and hard to
analyze molecule. In fact, even after more than a hundred years of research there are still
areas widely unknown and fiercely debated. The reason for this is not only in the
complexity of the molecule itself, but also in the problems connected to lignin analysis.
These problems and the most common analytic tools will be described in this chapter.
Lignin is a big heteropolymer; composed by several monomers linked in many possible
ways and this obviously results in a complicated analysis with poor results. Aside from few
exceptions, no matter which analytical method is employed, big and complicated
molecules result in broad and overlapping signals, lower precision and an unclear analysis
overall. But if size and a complex structure were the only problems, much more about
lignin would be known, by now. Huge molecules such as enzymes and proteins, far bigger
than lignin, can have their structure completely solved, along with the 3D disposition of
every atom. What is really holding back lignin research, are the problem related to lignin
purification, the impossibility, so far, of analyzing a pure and unmodified part of the
polymer. In general there are two ways to achieve such a goal, either in vivo analysis or a
working purification routine. In vivo analysis of lignin is complicated by the presence of
every component of the cell wall. Cellulose (4) and hemicellulose (5), proteins and
everything else cover or smear every signal from lignin, making a proper structural
analysis almost impossible and yielding incomplete results. On the other hand there is no
purification procedure for lignin that does not modify its structure or its bonds, making any
analysis that follows only partially correct. Of course even partial results are better than
nothing and that is where our knowledge of lignin comes from, but these problems still
stand in the way of solving lignin structure. Lignin extraction and purification methods will
be shortly reviewed now, followed by the currently most employed analysis.

38
Extraction methods
As opposed to pulping, where the purpose is to purify cellulose (4) from lignin, the most
common way to obtain pure lignin without carbohydrate impurities are discussed here.
There are two main procedures to extract lignin nowadays, Klason’s and Björkman’s
methods, each with its own slight modifications. Klason lignin is obtained by removal of
carbohydrates from wood, through hydrolysis reaction in acidic media. Carbohydrates are
dissolved in water and lignin remains as the insoluble residue. Strong acidic conditions are
required for this reaction to happen, such as sulfuric acid, 40% hydrochloric acid or other
strong acid mixtures [87,88]. This method is usually employed to estimate the amount of
lignin present in a sample, but purified lignin is obtained only after reaction in very harsh
conditions. Many chemical reactions are expected to happen, in particular condensations,
which modify the structure of the polymer. Björkman’s lignin or milled wood lignin
(MWL) is what is currently employed as a sample for analysis. When a suspension of
wood in toluene is placed in a vibratory mill with a 9:1 dioxane/water mixture, lignin
becomes partially extractable. The extraction yield is around 30%, but a carbohydrate
impurity is also present, around 0.1%, depending on the milling duration and other
parameters [89,90]. Purity can be increased with longer milling times and digestion with
glycosidase or other enzymes. Even if this procedure is much less invasive than Klason’s
there are still some modifications occurring in lignin, which need to be taken into account.
The milling breaks some of the weakest bonds in lignin, lowering the molecular weight
(Mw). Since the bonds broken are mostly ethers, as a result MWL also has a higher amount
of free hydroxyl groups than in vivo lignin [91]. The final drawback that needs to be
considered is the low yield of the extraction. No matter how precise or powerful the
analysis, more than two thirds of the starting sample will be lost in the extraction, which is
a serious obstacle to quantitative analysis.
Analysis methods
Over the years several ways to analyze lignin have been designed and optimized, each with
advantages and drawbacks. They can be divided in wet chemistry methods and
instrumental methods. Wet chemistry methods are usually chemical degradation studies,
where lignin is reacted is some way and the products analyzed [92]. According to the
products and the kind of reaction performed, some information about the starting content
can be gathered. This kind of analysis belongs to the past because it is slow, destructive
and hard to perform, sometimes involving unsafe or undesired chemicals. Wet chemistry

39
analysis are less and less employed in research laboratories, but they are sometimes more
precise and more reliable than modern technology. The most relevant wet chemistry
procedures will be discussed, in particular acidolysis, thioacidolysis, and derivatization
followed by reductive cleavage (DFRC). For a deeper insight in wet chemistry, which
made the history of lignin chemistry, we suggest Adler’s review [93]. Instrumental
methods are quicker and easier to perform, usually more sensitive and non invasive. They
include spectroscopic methods such as UV, IR or NMR spectroscopy and other powerful
analytical tools like chromatography, mass spectrometry and others. Some time will be
devoted to the most relevant of the instrumental analysis. It is necessary to remember that,
even if some techniques are extremely powerful, their accuracy is limited by the starting
sample limitations, as previously discussed.
Acidolysis
Acidolysis is obtained by refluxing a lignin sample in dioxane-water (9:1) with 0.2M HCl.
After refluxing for 4h, the effect of acidolysis on MWL is the complete breaking of the β-
O-4 (34) bond [94]. Cleavage of the β-ether bond produces a light fraction of monomers
and dimers and a heavier fraction containing oligomers. In the past, this technique was
applied to arylglycerol-β-aryl ether model compounds (β-O-4 model compound) and the
outcome compared to what was obtained from a Björkman lignin sample. As the two
results matched, evidence for β-O-4 bonds in lignin was found. Today, this technique can
give more useful results if the heavier fractions are analyzed. As the β-O-4 is the only bond
broken by acidolysis, every dimer will contain one of the other possible bonds. Each dimer
needs to be purified and its structure solved. Since sometimes the reaction can considerably
modify the nature of the bond, each dimer needs to be studied and the original bond
identified. Once all this has been accomplished, it is possible to quantitatively analyze the
distribution of the different structures in lignin, simply by counting how many dimers are
present per each kind of bond. In other words acidolysis allows quantification of interunit
linkages in lignin [95].
When syringyl (33) units are present, for example in hardwoods, the work is harder
because both syringyl and guaiacyl (32) dimers need to be identified, but the outcome of
the analysis is not affected. Despite what one might think this method is not accurate for
quantitation of syrigyl and guaiacyl amounts. Monomers analysis from a birch sample
yielded a higher amount of syringyl units (≈3:5 guaiacyl/syringyl units ratio), despite the
fact that the S / G ratio in birch is 1:1. This is caused by the fact that monomers are
40
obtained only when a unit is linked on both sides by a β-O-4 bond, which is much more
likely to happen for S units. In fact G units can be linked to other residues by 5-5 (37) and
β-5 bonds, which are not possibly formed in S units. In acidolysis only dimers are used for
the quantitation, which leaves a big amount of sample unknown, making the quantitation
less reliable [96].
Thioacidolysis
Thioacidolysis was introduced by Nimz in the 70’s [97]; this procedure accomplishes the
same result as acidoolysis, with higher yields. Cleavage of the β-O-4 bond (34) is almost
complete, leading to a 91% yield of fractions from monomer to tetramer in beech wood
and 77% in spruce. Lignin is reacted with thioacetic acid CH3COSH and boron trifluoride
BF3, followed by saponification with 2M NaOH at 60°. The final step is reaction with
Raney nickel catalyst to eliminate sulfur. The higher yield allows a more reliable
quantitation of lignin bonds distribution, with a procedure similar to acidolysis [98].
Derivatization followed by reductive cleavage (DFRC)
DFRC is the newest of the wet chemistry analysis and as for the other two above, the
purpose of this analysis is to provide a simple, high yield and selective cleavage of the β-
O-4 bond (34). Being the most abundant linkage in lignin, cleavage of β-ethers provides
the most structural information, which is why so many analytical methods are focused on
it. Reaction of lignin with AcBr leads to α-ether cleavage and formation of α-bromo
derivatives. Addition of powdered Zinc catalyzes reductive elimination of Br and of β-
ethers, and produces alkenes. This method was applied on lignin with yields higher than
92% and high selectivity for α-and β- ether bonds. This method is slightly better than
thioacidolysis from a yield and selectivity point of view, but what makes it really better are
the lowest number of reaction steps and the lack of smell from Sulfur reagents [99].
41
Instrumental analysis
It would take too long to discuss each instrumental analysis in detail (and it would be
probably useless). Due to the wide range of application, instrumental analysis, and
spectroscopy in particular, is widely spread in every field of chemistry. The main feature of
each technique are well known and too complicated to be discussed here. Some specific
textbooks are advised to those who want a deeper understanding of these techniques
[100,101]. Here it will be just shown how modern analysis tools have influenced lignin
research.
Microscopy (electron and UV) is routinely employed and usually substitutes histological
analysis. Individuation of tension and compression wood, topochemical mapping of
extractives and lignin, study of lignin orientation are some of the results that can be
accomplished faster and better with such techniques [102-104]. Fluorescence and Raman
imaging are commonly employed for compression wood studies, involving quantitation
and identification, once again faster than any histological or chemical method [105,106].
Raman spectroscopy was used with good result to identify long range order in lignin, on
the other hand IR spectroscopy is common in industrial application, for example in paper
industry [107,108]. UV/Vis spectroscopy usually gives good results when applied to lignin,
due to the high aromaticity of the polymer [109]. Chromatography (liquid chromatography
LC, gas chromatography GC, size exclusion chromatography SEC) played a major role in
lignin fragments separation and purification, usually coupled with mass spectrometry (MS)
which provides a very fast and efficient oligomers identification routine [110]. Nuclear
magnetic resonance (NMR) is probably the most important of all spectroscopic techniques
in lignin chemistry and deserves a separate chapter, also because it is the main analysis
technique adopted in this study.
Nuclear Magnetic Resonance
The incredibly low sensitivity is the major drawback of NMR, compared to other
spectroscopic techniques. In general, spectroscopy involves transition between a ground
state and an excited state, separated by an energy gap. After excitation, the population of
the ground state migrates to the excited state. This migration or the following return to the
ground state produces a detectable signal. This signal is what is measured in each
spectroscopic technique. With techniques such as UV/Vis or IR spectroscopy, the two
states are separated by a relevant energy gap, which means that there is a big difference in
population between the two states. When the fist state is excited to the second, there is an
42
important change in population, which produces an easily detectable signal and therefore a
good sensitivity. On the other hand, NMR ground and excited state are extremely close in
energy, which means that that the population of the two states is nearly the same. The
signal produced by population change is therefore almost undetectable, which explains
why NMR sensitivity is several order of magnitude lower that other spectroscopic
techniques. NMR provides incredible advantages, which easily overcome the drawback of
low sensitivity. The low energy involved in the transition, other than reducing NMR
sensitivity, also assures that the molecule is not modified during analysis. The amount of
energy involved is in fact so small that physical or chemical modification of the molecule
is impossible, allowing analysis of an unperturbed state. Moreover, NMR provides unique
structural information, far more detailed than any other analysis. A molecule structure can
be completely solved by NMR, together with its 3D structure, a result that can be matched
only by X-ray crystallography. The aim of this paragraph is just to give a short introduction
to NMR potential. NMR theory is much better explained in several books [111].
For what concerns lignin, its polymeric nature always posed some problems for NMR.
Peaks overlapping and low resolution always put a limit to the amount of information that
can be gathered from a spectrum, but big steps have been made to overcome this problem.
More and more powerful magnet, from the 60 MHz magnets in the 70’s to 1000 MHz
today, provide an incredibly enhanced resolution, but the most significant step was the
introduction of 13C NMR, and 2D and 3D NMR experiments later on [66]. Application of
experiments other than proton provides a huge amount of information about bonds and
structures, not to talk about the otherwise impossible resolution that can be achieved.
Hundreds of 2D NMR experiments exist today, with a variety of characteristics. HSQC
correlates a carbon atom to its attached protons, NOESY provides tridimensional
information, and TOCSY individuates proton systems and so on [112]. With the help of
this powerful tool many problems have been solved. Assignment and quantitation of
erythro and threo isomers [113,114], bonds quantitation [115], lignin amount evaluationss,
all of those things and others are made much easier or even possible at all, with the help of
this instrument [116]. New links and new minor monomers have been discovered [117],
moreover the technology and operators proficiency is increasing so much that even whole
cell wall analysis are being accomplished [118-120]. NMR is a key to lignin
understanding, improvements in NMR technology have led to major breakthroughs in
lignin comprehension.
43
1.2.5 CONCLUDING REMARKS
Lignin is a very complicated biopolymer; it is composed by three major monomers linked
in several different ways, which makes it an exception among biopolymers. Each plant
species presents its own kind of lignin, with differences in monomers and linkages
distribution, which are also affected by environmental conditions and plant age. The
complexity of lignin has only been superficially touched in this chapter and the next will
not go much further. For a more detailed treatment of the subject we suggest the famous
book on lignin by Sarkanen [121]. Lignin, despite being the second most abundant
biopolymer on earth, is underexploited and only a few useful applications are currently
viable. In fact, lignin is commonly viewed as an obstacle in biomass application, such as
paper industry or ethanol production and it is usually just burned after separation. The
reasons for lignin under exploitation are to be researched in its complexity. A complicated
structure translates in a very difficult research, which turns into very low efficiency
applications or no applications at all. A better knowledge of lignin features would surely
help applicative research, but the very structure of lignin is adverse to an optimized
employment. The great variety of linkages between monomers makes it hard or too
expensive to degrade lignin to its components, which could be employed in industry. In
fact, the enzymatic cleavage approach adopted for other biopolymers would not work, due
to the high amount of different bonds, and the design of a specific chemical treatment per
each link would hardly be cost effective.
If it was possible to put lignin to good use, that could be a relevant step toward
sustainability, that is why many resources are being invested in this sector and why so
many researches are aimed in that direction. In order to understand how to manipulate
lignin it is first necessary to fully understand lignin structure, which is done by two main
approaches: model compounds and biosynthesis study. Each approach will be individually
discussed in the next chapters.
44
1.3 Lignin Biosynthesis
The study of lignin biosynthesis could and did provide useful information about lignin
structure. What is better than studying how something is formed, to understand what it
becomes? This field is undergoing an intense development, with many dark and debated
areas. Many details about lignification that were left behind in the previous chapter will be
now fully discussed and the most important points of view considered. Lignin biosynthesis
is normally studied by perturbation of the biosynthetic pathway, followed by analysis of
the results. By understanding what changes under a well defined condition, such as
inhibition of a specific enzyme, it is possible to understand the role of each component of
the very complicated biological synthesis pathway. Once the mechanisms will be fully
understood, maybe it will be possible to modify and manipulate the enzymes, in order to
produce a lignin with more favorable characteristics. The first part of this chapter will be
devoted to describe the state of the art knowledge on monolignol biosynthesis, followed by
discussion on the topics of lignification left behind in the previous chapter. To conclude,
the possible applications of genetic modification of lignin will be reported.
1.3.1 MONOLIGNOL BIOSYNTHESIS
Figures 1.14 and 1.15 report the monolignol biosynthesis pathway. Phenylalanine (44)
(Phe) and tyrosine (45) (Tyr), in the top left corner, are commonly considered to be the
starting point of monolignol biosynthesis, but some research group are now investigating
whether differentiation between protein and phenylpopanoids synthesis starts earlier. With
simpler words, it is being researched if the precursors of Phe that will become part of
proteins are different from the precursors of Phe that will become something else. The
functions of each enzyme involved in lignin biosynthesis, and what researchers have
accomplished on each one of them, will be described in the next paragraphs, individually.
It is important to keep in mind that this set of enzymes does not produce only monolignols
destined to lignification, but also plays a role in the synthesis of many other molecules.
Description of the system beyond the synthesis of monolognols is beyond our purpose.

45
Figure 1.14 Monolignol biosynthesis pathway. Some steps “??” are still unknown. The shikimate
cycle is described in fig. 1.15. PAL phenylalanine ammonia lyase, TAL tyrosine ammonia lyase,
4CH cinnamate-4-hydroxylase,COMT Caffeic acid O-Methyltransferase, F5H ferulate 5
hydroxylase, 4CL 4-Coumarate CoA ligase,CCR Cinnamoyl CoA reductases,
CAD Cinnamyl alcohol dehydrogenases.
45 Tyrosine
PAL
49 Ferulic acid 48 Caffeic acid 50 5-hydroxy ferulic acid
51 Sinapic acid
46 Cinnamic acid
44 Phenilalanine
47 p-coumaric acid
52 p-coumaroyl -CoA
53 Caffeoyl-CoA 54 Feruloyl-CoA 55 5-hydroxy feruloyl-CoA
56 Sinapoyl-CoA
57 p-coumar aldehyde
58 Caffeyl aldehyde
59 Conifer aldehyde
60 5-hydroxy coniferaldehyde
61 Sinapaldehyde
28 p-coumaryl alcohol
62 Caffeyl alcohol
29 Coniferyl alcohol
63 5-hydroxy coniferyl alcohol
30 Sinapyl alcohol
TAL C4H
CCOMT ?
CCOMT COMT
COMT
CCOMT ?
CCOMT ?
COMT
COMT
F5H
F5H
F5H
F5H
4CL 4CL 4CL 4CL 4CL
CCR CCR CCR CCR CCR
CAD CAD CAD CAD CAD
Shikimate cycle
Fig.1.15
??
??
??
46
Phenylalanine and Tyrosine ammonia lyases (PAL and TAL)
As can be seen in Figure 1.14 the role of PAL and TAL is the elimination of the ammine in
the two amino acids (Phe and Tyr) in order to form a double bond, which leads to
formation of cinnamic (46) and p-Coumaric (47) acids. PAL is the entry point for the
phenylpropanoid metabolism for most plant, only some grasses are able to convert Tyr to
p-Coumaric acid. The released NH4+ is the recycled for the synthesis of other amino acids,
which explains why lignification can continue without other sources of nitrogen [122]. The
first gene encoding PAL was published in 1985 [123]. Nowadays, after Arabidopsis (a
common model plant) genome sequencing has been completed, 4 different isoforms of
PAL have been identified and are being studied.
Cytochrome P450 hydroxylases (C4H, pC3H, F5H)
Three hydroxylation steps are involved in monolignol biosynthesis. The first step is
mediated by cinnamate-4-hydroxylase (C4H) and converts cinnamic acid (46) to p-
coumaric acid (47). This is a key step for every phenylpropanoid-derived metabolites (i.e.
suberins, hydroxycinnamic acids etc.). The second hydroxylation promotes insertion of an
alcohol in the aromatic position 4 and converts p-coumaric acid derivatives (52,57,28) to
caffeic acid (48) derivatives (53,58,62). It is mediated by p-coumaric acid hydroxilase
(pC3H). The last step, mediated by ferulate 5 hydroxylase (F5H), inserts a hydroxyl group
on carbon 5, necessary for the precursors (51,56,61) of sinapyl alcohol (30) [124].
All three of these reactions are mediated by cytochrome P450. Identification and
characterization of C4H and F5H was pretty straight forward [125,126], while pC3H
involved some further complications, described in the next chapter.
pC3H and hydroxycinnamoyl CoA transferases
The identity of the enzyme involved in 3 hydroxyl insertion was debated for a little longer.
Doubts were present about the nature of the enzyme and its substrate. In fact, pC3H cannot
convert p-coumaric acid (47) into caffeic acid (48), but p-coumaroyl shikimate (64) is a
suitable substrate for conversion into the caffeoyl shikimate (65) as well as its quinate
equivalent (66). The formation of these shikimate/quinate derivatives requires a specific
enzyme, hydroxycinnamoyl CoA:shikimate/quinate hydroxycinnamoyl transferase
(HCT/HQT).The particularity of this couple of enzyme is that they show high versatility,
being able to convert both coumaric and caffeic acid derivatives. Therefore HCT and HQT
are able to convert p-cumaroyl CoA (52) to p-coumaroyl shikimate/quinate.

47
The latter is then converted to caffeic shikimate/quinate (65,67) by pC3H which in turn is
reconverted to caffeoyl CoA (53) by the same HCT and HQT enzymes [127,128]. The
shikimate/quinate pathway is shown in Figure 1.15.
Figure 1.15 Shows the shikmate/quinate cycle. It is currently the only known pathway from
coumaric to caffeic derivatives. HCT/HQT, hydroxycinnamoyl CoA:shikimate/quinate
hydroxycinnamoyl transferase, p3CH, p-coumaric acid hydroxilase.
4-Coumarate CoA ligases (4CL)
The class of enzymes 4CL has a high substrate versatility. In fact, each of these enzymes is
able to convert almost every hydroxycinnamic acid (47-51) into a CoA ester (52-57). The
first 4CL gene was discovered in 1987 [129]. Every known 4CL has high substrate
versatility, but each enzyme shows its highest activity with a different substrate. Studies
have been conducted on the 4 different 4CLs present in Arabidopsis and each of these
enzymes has a different preferred substrate. The current hypothesis is that each enzyme is
specific for a different role, such as lignification, defense or flavonoids biosynthesis, and it
is therefore more active with the most suitable hydroxycinnamic acid [130].
68 shikimate
52 p-coumaroyl -CoA
66 p-coumaroyl quinate
69 quinate
67 Caffeoyl quinate
65 Caffeoyl shikimate
64 p-coumaroyl shikimate
53 Caffeoyl -CoA
68 shikimate
69 quinate
p3CH
p3CH
HCT HCT
HQT HQT

48
O-Methyltransferases
In the past, Caffeic acid O-Methyltransferases (COMT), were thought to be a bifunctional
enzyme [131]. They were supposed to be able to convert both caffeic (48) acid into ferulic
acid (49) and 5-hydroxyferulic acid (50) into sinapic acid (51), i.e. to be responsible for
methylation of both hydroxyls in 5 and 3 positions. This hypothesis was based on in vitro
study and proved to be wrong. In fact OMTs are composed by two classes of enzymes:
caffeoyl CoA O-methyltransferases (CCOMT), using caffeoyl CoA (53) as a substrate for
conversion to Feruloyl CoA (54) (methylation of 3 -OH), and COMT, involved in the
conversion of hydroxyconiferyl derivatives (50,55,60,63) to sinapyl derivatives (51,56,61),
for the production of sinapyl alcohol (30), as reported in Figure 1.14 [132,133]. The name
COMT is still employed for historical reasons, even if the enzyme should probably be
called otherwise.
Cinnamoyl CoA reductases
Just as 4CLs, also this family of enzymes has great substrate versatility. In fact Cinnamoyl
CoA reductases (CCRs) are able to convert every CoA ester shown in Figure 1.14 to the
corresponding aldehyde, using NADPH as a reducing agent. In particular p-coumaroyl,
caffeoyl, feruloyl, 5-hydroxyferuloyl and sinapoyl CoAs (52-56) are converted to p-
coumaryl, caffeyl, coniferyl, 5-hydroxyconiferyl and sinapyl aldehydes (57-61),
respectively. CCRs are type B-reductases. The first CCR gene encoding was reported in
1997 [134]. Eleven (or twelve) genes are proposed as CCR but only three have been
characterized so far. They display different activities and in one case, different selectivity,
but the biological implications for this fact are still unknown [135].
Cinnamyl alcohol dehydrogenases
Cinnamyl alcohol dehydrogenases (CADs) are a non substrate specific family of enzyme.
They are able to convert all the aforementioned aldehydes (57-61) into the corresponding
alcohols (28-30,62,63) (Figure 1.14). CADs are a type A-reductases and they use NADPH
as a reducing agent, extracting the 4-pro R hydrogen. Even if CADs are substrate versatile,
each one presents a higher activity for a specific substrate. CAD catalytic center is based
on three Zn atoms [136]. There are currently seventeen CADs reported, but some are
completely different from others. The first nine show high level of similarity between each
other, while the other eight are fairly different [137].The biological meaning and
implication of it are still being discussed.

49
1.3.2 MONOLIGNOL BIOSYNTHESIS PERTURBATION
The function of each enzyme present in Figure 1.14 has been discussed in detail, now it is
time to analyze the most relevant effects caused by perturbation of monolignol
biosynthesis. Disruption of the ordered biosynthesis pathway will provide useful
information about the regulatory aspects of monolignol synthesis and increase the general
understanding of lignin formation. Once again, the topic will be discussed one enzyme at a
time.
PAL and C4H
Leaving aside TAL and the minor tyrosine entry point, PAL and C4H constitute the
starting point for the synthesis of every monolignol. Therefore it is not a surprise, that
downregulation of those two enzymes leads to reduced lignin content [138]. On the other
hand, the effects on monolignol distribution were hardly foreseen. In fact downregulation
of PAL mostly reduces G units (32) amount, while C4H has the same effect on S units
(33). The causes of this phenomenon are still unknown, but three hypotheses have been
proposed [139]. The first is that the pathway to coniferyl alcohol (29) may bypass C4H, the
second is that C4H is involved in more reactions other than the 4-hydroxylation of
cinnamic acid (46) and the third is that C4H may be part of a specific metabolic channel
for production of sinapyl alcohol (30). None of these hypotheses is supported by evidence.
4CL
The effects of 4CL downregulation are variable, depending on the tested plant. Transgenic
plants usually show lower lignin content, but in certain cases an increase of
hydroxycinnamic acids bound to the cell wall is observed. Most of all, the effects on S/G
ratio are unpredictable [140]. In fact, tobacco shows a reduction in S units (33), while
transgenic Arabidopsis displays a lower amount of G units (32). To make it even more
uncertain, in aspen, the S/G ratio is not different from the control one [141]. These
contradictory effects are probably due to that fact that 4CLs are a wide family of enzymes,
each with its own substrate specificity. Therefore different effects on different transgenic
plants are reasonable.
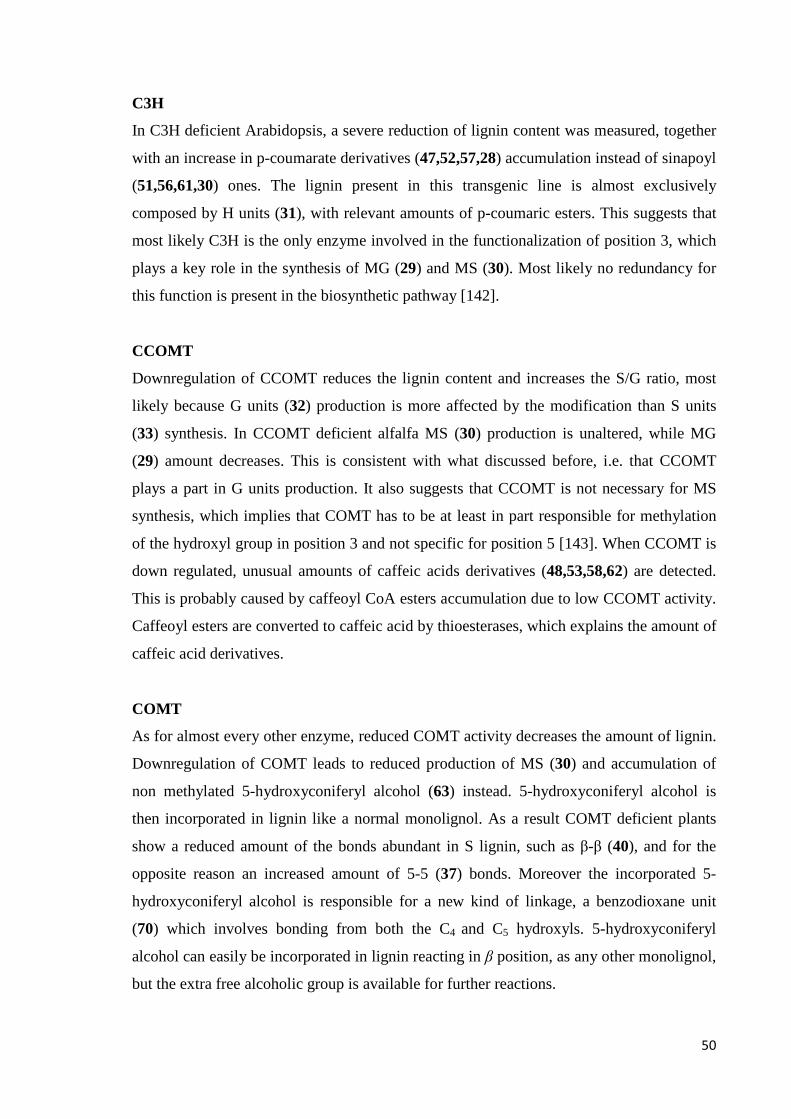
50
C3H
In C3H deficient Arabidopsis, a severe reduction of lignin content was measured, together
with an increase in p-coumarate derivatives (47,52,57,28) accumulation instead of sinapoyl
(51,56,61,30) ones. The lignin present in this transgenic line is almost exclusively
composed by H units (31), with relevant amounts of p-coumaric esters. This suggests that
most likely C3H is the only enzyme involved in the functionalization of position 3, which
plays a key role in the synthesis of MG (29) and MS (30). Most likely no redundancy for
this function is present in the biosynthetic pathway [142].
CCOMT
Downregulation of CCOMT reduces the lignin content and increases the S/G ratio, most
likely because G units (32) production is more affected by the modification than S units
(33) synthesis. In CCOMT deficient alfalfa MS (30) production is unaltered, while MG
(29) amount decreases. This is consistent with what discussed before, i.e. that CCOMT
plays a part in G units production. It also suggests that CCOMT is not necessary for MS
synthesis, which implies that COMT has to be at least in part responsible for methylation
of the hydroxyl group in position 3 and not specific for position 5 [143]. When CCOMT is
down regulated, unusual amounts of caffeic acids derivatives (48,53,58,62) are detected.
This is probably caused by caffeoyl CoA esters accumulation due to low CCOMT activity.
Caffeoyl esters are converted to caffeic acid by thioesterases, which explains the amount of
caffeic acid derivatives.
COMT
As for almost every other enzyme, reduced COMT activity decreases the amount of lignin.
Downregulation of COMT leads to reduced production of MS (30) and accumulation of
non methylated 5-hydroxyconiferyl alcohol (63) instead. 5-hydroxyconiferyl alcohol is
then incorporated in lignin like a normal monolignol. As a result COMT deficient plants
show a reduced amount of the bonds abundant in S lignin, such as β-β (40), and for the
opposite reason an increased amount of 5-5 (37) bonds. Moreover the incorporated 5-
hydroxyconiferyl alcohol is responsible for a new kind of linkage, a benzodioxane unit
(70) which involves bonding from both the C4 and C5 hydroxyls. 5-hydroxyconiferyl
alcohol can easily be incorporated in lignin reacting in β position, as any other monolignol,
but the extra free alcoholic group is available for further reactions.
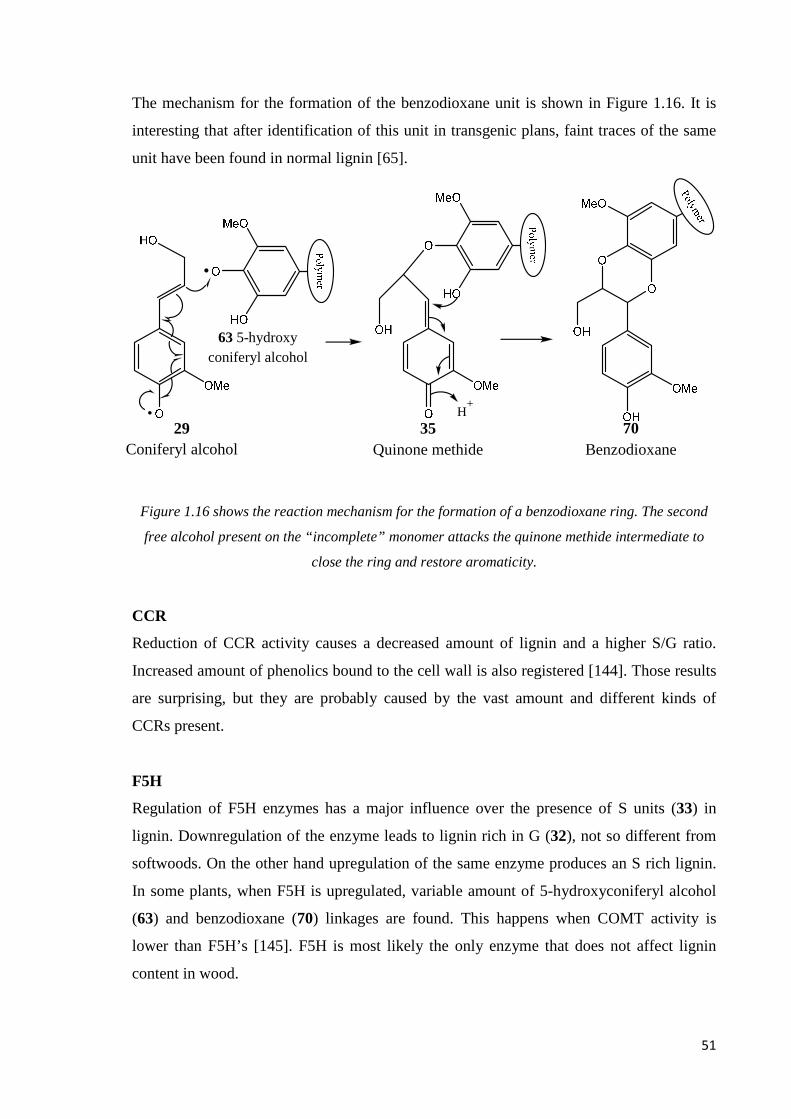
51
The mechanism for the formation of the benzodioxane unit is shown in Figure 1.16. It is
interesting that after identification of this unit in transgenic plans, faint traces of the same
unit have been found in normal lignin [65].
Figure 1.16 shows the reaction mechanism for the formation of a benzodioxane ring. The second
free alcohol present on the “incomplete” monomer attacks the quinone methide intermediate to
close the ring and restore aromaticity.
CCR
Reduction of CCR activity causes a decreased amount of lignin and a higher S/G ratio.
Increased amount of phenolics bound to the cell wall is also registered [144]. Those results
are surprising, but they are probably caused by the vast amount and different kinds of
CCRs present.
F5H
Regulation of F5H enzymes has a major influence over the presence of S units (33) in
lignin. Downregulation of the enzyme leads to lignin rich in G (32), not so different from
softwoods. On the other hand upregulation of the same enzyme produces an S rich lignin.
In some plants, when F5H is upregulated, variable amount of 5-hydroxyconiferyl alcohol
(63) and benzodioxane (70) linkages are found. This happens when COMT activity is
lower than F5H’s [145]. F5H is most likely the only enzyme that does not affect lignin
content in wood.
63 5-hydroxy coniferyl alcohol
29 Coniferyl alcohol
35 Quinone methide
70 Benzodioxane
H+
52
CAD
CAD catalyzes the final step of monolignol biosynthesis, but its downregulation barely
affects lignin content. This unexpected lack of variation is explained by substitution of
standard monolignols with their relative aldehydes. In fact CAD deficient lignin presents
unusually high amounts of coniferaldehyde (59) and sinapaldehyde (61) employed as
standard monomers [146].
1.3.3 LIGNIN BIOSYNTHESIS: COMBINATORIAL VS. CONTROLLED
It is now time to address probably the most controversial topic in lignin chemistry. It has
been brought up now and then in the previous chapters, but the evidence provided by
transgenic plants was needed before this topic could be properly discussed. The main
subject of discussion is whether lignin is randomly assembled under simple chemical
control, in a combinatorial way, or if its synthesis is instead strictly controlled by proteins
and enzymes.
Before moving on, it is important to remember that no compelling evidence is present for
either one of the theories, therefore both should be equally considered.
I would like to add a little personal consideration here, the reader should take it with all
due precautions. It seem to me, that people have been debating over this topic for so long
that they don’t care so much about the truth but about being right. Papers of groups on
opposed sides are factious, only partial evidence is reported and every data is twisted and
presented as if it is the definitive proof, when in reality could fit one theory just as well as
the other. The debate has degenerated so much that is not uncommon to find not-so-veiled
insults to the opposed faction. It’s totally understandable that such things happen, after a
long, frustrating and seemingly never ending argument, but we should all try to restrain
ourselves and remain objective. I’ll try to present the facts as impartially as I can and I
hope the readers will consider them in the same way, because being open minded is
probably one of the most important features or a good scientist.
53
History and general ideas
The combinatorial, or random, approach is currently accepted by the scientific
community, mostly because it has been proposed more than 50 years ago and not really
challenged until recent times. Freudenberg, in the 50’s, was the first to propose that lignin
was a polymer formed by the random coupling of monolignol oxidized radicals. This
conception is born form the high complexity of lignin, its lack of optical activity and the
apparent lack of long range ordering and repetitive structures. When structures similar to
lignin were found in randomly polymerized coniferyl alcohol (29) (DHP), the conclusion
that lignin is formed by random coupling came naturally [147]. It is important to underline
that the analytical tools available at Freudenberg’s times are in no way comparable to
today ones. This hypothesis was accepted almost without discussion in the scientific
community, even if warnings about this speculative hypothesis were given [148]. Beyond
the analytical difficulties that made lignin study a very complicated field, perhaps the
importance of Freudenberg name played a role in this unquestioned acceptance of his
theory. Over the year many claims were made about lignin and its structure, some more
speculative than others, and often only partially correct. Nowadays the random theory has
evolved into combinatorial and it is partially based on Occam’s razor. Sustainers of this
theory claim that every feature of lignin can be explained by simple kinetic and chemical
control, without the necessity of involving other non necessary entities, such as enzymes.
On the other hand, the opposed theory claims that lignin synthesis is somehow controlled
by proteins, called dirigent proteins (DPs), which define and regulate lignin structure. Long
arrays of DPs are hypothetically present in the cell wall, where they stereochemically
control every coupling reaction [149]. Even if doubts over the random coupling hypothesis
have always been present, this theory acquired importance and attention in the last 20
years, after discovery of dirigent proteins involved in lignans synthesis. The foundation of
this theory is inductive reasoning: as every other biomolecule synthesis is very strictly
regulated by enzymes, it is highly unlikely that lignin deposition is left without control.
Even if no final proof exists, a number of circumstantial data have been presented over the
years. Each case will be presented individually and as impartially as possible, considering
both points of view. The cases are presented in no particular order.
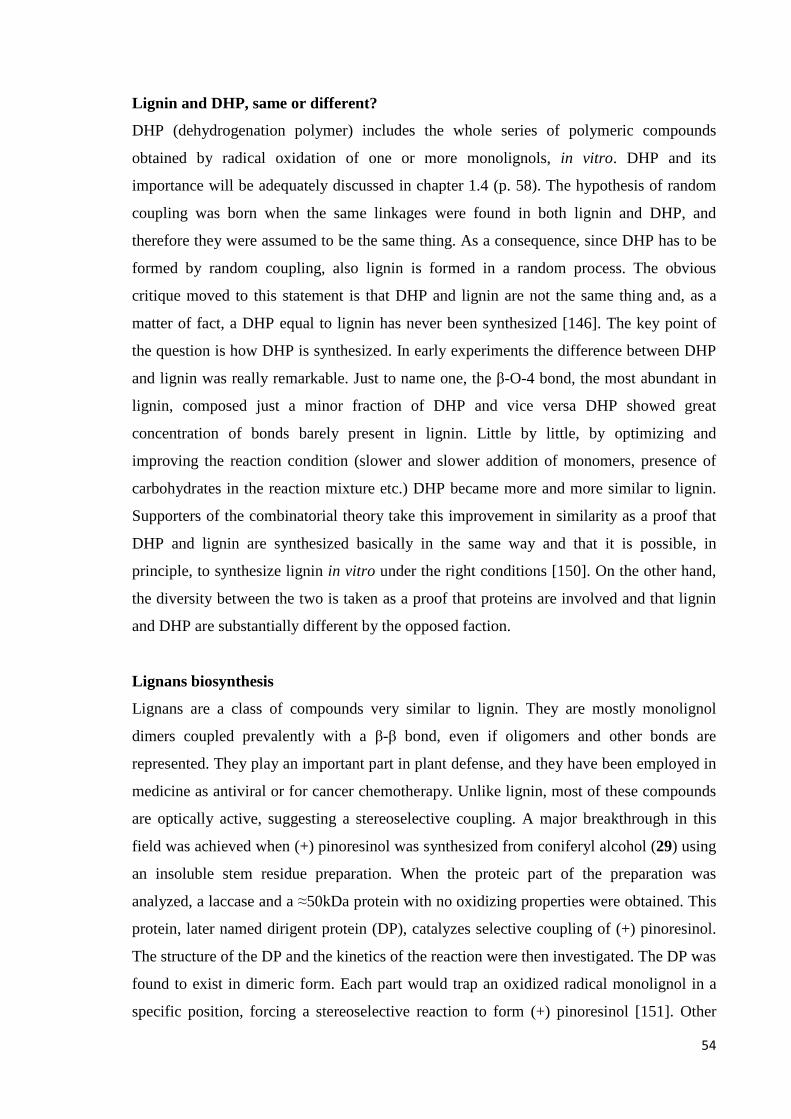
54
Lignin and DHP, same or different?
DHP (dehydrogenation polymer) includes the whole series of polymeric compounds
obtained by radical oxidation of one or more monolignols, in vitro. DHP and its
importance will be adequately discussed in chapter 1.4 (p. 58). The hypothesis of random
coupling was born when the same linkages were found in both lignin and DHP, and
therefore they were assumed to be the same thing. As a consequence, since DHP has to be
formed by random coupling, also lignin is formed in a random process. The obvious
critique moved to this statement is that DHP and lignin are not the same thing and, as a
matter of fact, a DHP equal to lignin has never been synthesized [146]. The key point of
the question is how DHP is synthesized. In early experiments the difference between DHP
and lignin was really remarkable. Just to name one, the β-O-4 bond, the most abundant in
lignin, composed just a minor fraction of DHP and vice versa DHP showed great
concentration of bonds barely present in lignin. Little by little, by optimizing and
improving the reaction condition (slower and slower addition of monomers, presence of
carbohydrates in the reaction mixture etc.) DHP became more and more similar to lignin.
Supporters of the combinatorial theory take this improvement in similarity as a proof that
DHP and lignin are synthesized basically in the same way and that it is possible, in
principle, to synthesize lignin in vitro under the right conditions [150]. On the other hand,
the diversity between the two is taken as a proof that proteins are involved and that lignin
and DHP are substantially different by the opposed faction.
Lignans biosynthesis
Lignans are a class of compounds very similar to lignin. They are mostly monolignol
dimers coupled prevalently with a β-β bond, even if oligomers and other bonds are
represented. They play an important part in plant defense, and they have been employed in
medicine as antiviral or for cancer chemotherapy. Unlike lignin, most of these compounds
are optically active, suggesting a stereoselective coupling. A major breakthrough in this
field was achieved when (+) pinoresinol was synthesized from coniferyl alcohol (29) using
an insoluble stem residue preparation. When the proteic part of the preparation was
analyzed, a laccase and a ≈50kDa protein with no oxidizing properties were obtained. This
protein, later named dirigent protein (DP), catalyzes selective coupling of (+) pinoresinol.
The structure of the DP and the kinetics of the reaction were then investigated. The DP was
found to exist in dimeric form. Each part would trap an oxidized radical monolignol in a
specific position, forcing a stereoselective reaction to form (+) pinoresinol [151]. Other

55
similar proteins were found later on and are currently under investigation. This was the
piece of evidence that basically started the whole protein controlled theory. Since lignans
and lignin are so closely related, it is natural to think that their synthesis is comparable. On
the other hand, the opponents underline that even if lignans and lignin are synthesized from
similar subunits, nothing proves that their synthetic mechanism is identical, also because
lignin is not optically active.
New evidence from transgenic plants
The new results from transgenic plant lines, introduced a new debate topic in this already
overheated argument. As discussed before (p. 49 section 1.3.2) regulation of some specific
enzymes led to incorporation of incomplete monomers and new bonds in lignin structure.
This happened mostly for the couple F5H-COMT and for CAD enzymes [152]. Moreover,
evidence suggests that these unreacted monolignols are present also in normal lignin. The
combinatorial faction takes this as the final evidence that the protein mediated theory is
wrong. In fact the ability of lignin to adapt to every situation (lack of monomers, different
monomers) is considered to be unlikely achieved by enzymes. The incredible variety of
conditions could hardly fit in the strictly regulated and very specific series of DPs
proposed. From their sides the supporters of Protein mediation question the integrity and
the effective meaning of the data proposed, mostly stating that the unreacted monolignols
are not really included in lignin.
Lignin oligomers profiling
Another piece of evidence in favor of the combinatorial theory comes from the analysis of
lignin oligomers. LC-MS/MS profiling of both synthetic DHP and natural lignin revealed a
very strict similarity between the two. Over 38 oligomers, from dimers to tetramers, have
been isolated and characterized both from synthetic and natural products, suggesting that
enzymatic control is not present or unnecessary in natural lignin. According to the authors,
DPs are not required to explain the reaction mechanism proposed [153]. This study does
not add much to the discussion on the equality or inequality between lignin and DHP,
discussed above, it just proposes more evidence of their similarity.
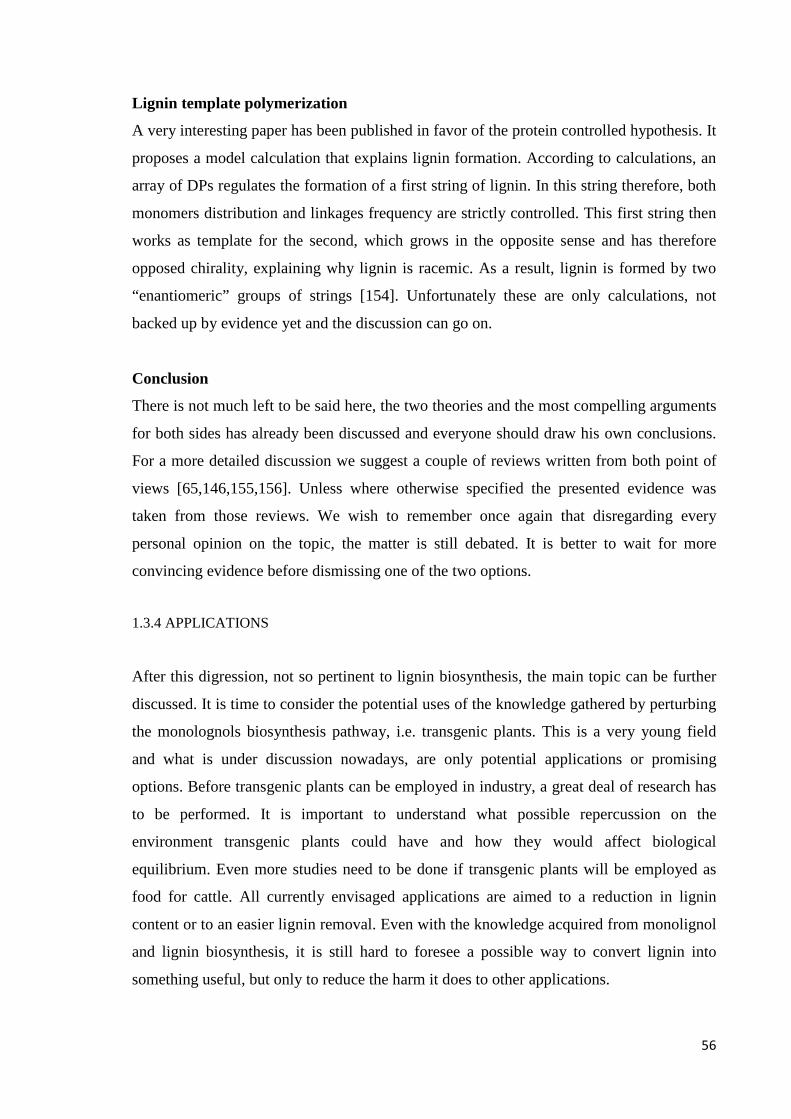
56
Lignin template polymerization
A very interesting paper has been published in favor of the protein controlled hypothesis. It
proposes a model calculation that explains lignin formation. According to calculations, an
array of DPs regulates the formation of a first string of lignin. In this string therefore, both
monomers distribution and linkages frequency are strictly controlled. This first string then
works as template for the second, which grows in the opposite sense and has therefore
opposed chirality, explaining why lignin is racemic. As a result, lignin is formed by two
“enantiomeric” groups of strings [154]. Unfortunately these are only calculations, not
backed up by evidence yet and the discussion can go on.
Conclusion
There is not much left to be said here, the two theories and the most compelling arguments
for both sides has already been discussed and everyone should draw his own conclusions.
For a more detailed discussion we suggest a couple of reviews written from both point of
views [65,146,155,156]. Unless where otherwise specified the presented evidence was
taken from those reviews. We wish to remember once again that disregarding every
personal opinion on the topic, the matter is still debated. It is better to wait for more
convincing evidence before dismissing one of the two options.
1.3.4 APPLICATIONS
After this digression, not so pertinent to lignin biosynthesis, the main topic can be further
discussed. It is time to consider the potential uses of the knowledge gathered by perturbing
the monolognols biosynthesis pathway, i.e. transgenic plants. This is a very young field
and what is under discussion nowadays, are only potential applications or promising
options. Before transgenic plants can be employed in industry, a great deal of research has
to be performed. It is important to understand what possible repercussion on the
environment transgenic plants could have and how they would affect biological
equilibrium. Even more studies need to be done if transgenic plants will be employed as
food for cattle. All currently envisaged applications are aimed to a reduction in lignin
content or to an easier lignin removal. Even with the knowledge acquired from monolignol
and lignin biosynthesis, it is still hard to foresee a possible way to convert lignin into
something useful, but only to reduce the harm it does to other applications.
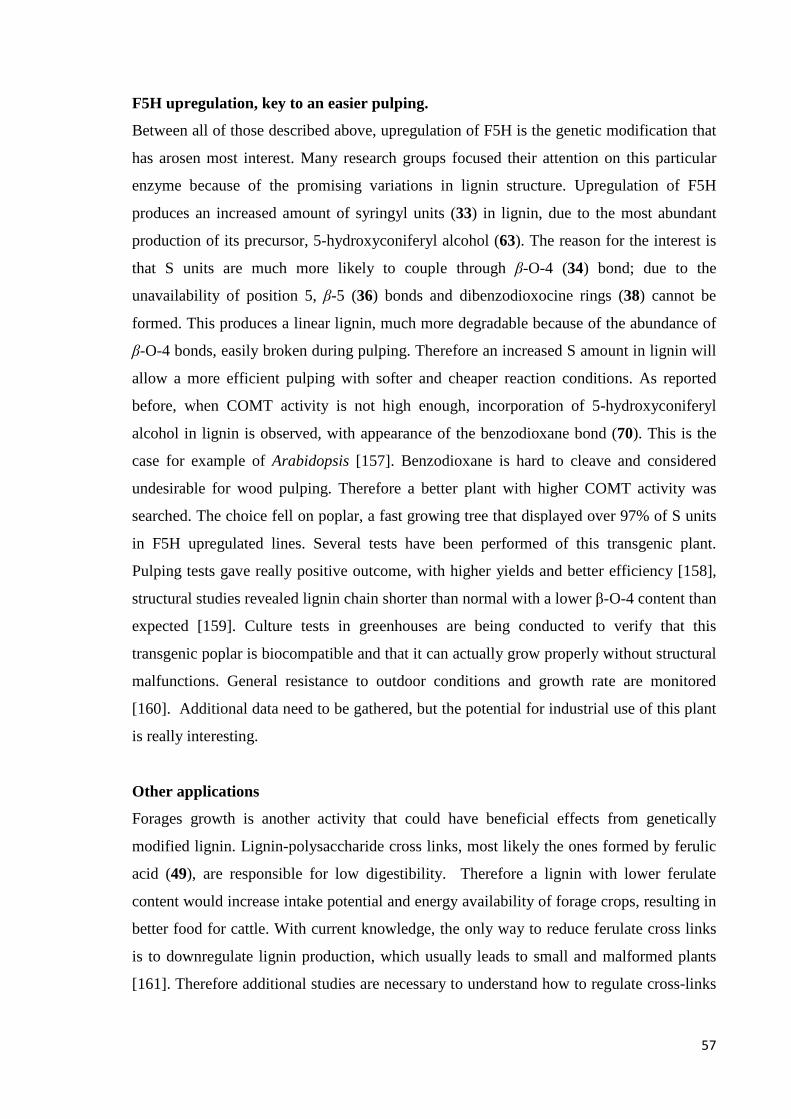
57
F5H upregulation, key to an easier pulping.
Between all of those described above, upregulation of F5H is the genetic modification that
has arosen most interest. Many research groups focused their attention on this particular
enzyme because of the promising variations in lignin structure. Upregulation of F5H
produces an increased amount of syringyl units (33) in lignin, due to the most abundant
production of its precursor, 5-hydroxyconiferyl alcohol (63). The reason for the interest is
that S units are much more likely to couple through β-O-4 (34) bond; due to the
unavailability of position 5, β-5 (36) bonds and dibenzodioxocine rings (38) cannot be
formed. This produces a linear lignin, much more degradable because of the abundance of
β-O-4 bonds, easily broken during pulping. Therefore an increased S amount in lignin will
allow a more efficient pulping with softer and cheaper reaction conditions. As reported
before, when COMT activity is not high enough, incorporation of 5-hydroxyconiferyl
alcohol in lignin is observed, with appearance of the benzodioxane bond (70). This is the
case for example of Arabidopsis [157]. Benzodioxane is hard to cleave and considered
undesirable for wood pulping. Therefore a better plant with higher COMT activity was
searched. The choice fell on poplar, a fast growing tree that displayed over 97% of S units
in F5H upregulated lines. Several tests have been performed of this transgenic plant.
Pulping tests gave really positive outcome, with higher yields and better efficiency [158],
structural studies revealed lignin chain shorter than normal with a lower β-O-4 content than
expected [159]. Culture tests in greenhouses are being conducted to verify that this
transgenic poplar is biocompatible and that it can actually grow properly without structural
malfunctions. General resistance to outdoor conditions and growth rate are monitored
[160]. Additional data need to be gathered, but the potential for industrial use of this plant
is really interesting.
Other applications
Forages growth is another activity that could have beneficial effects from genetically
modified lignin. Lignin-polysaccharide cross links, most likely the ones formed by ferulic
acid (49), are responsible for low digestibility. Therefore a lignin with lower ferulate
content would increase intake potential and energy availability of forage crops, resulting in
better food for cattle. With current knowledge, the only way to reduce ferulate cross links
is to downregulate lignin production, which usually leads to small and malformed plants
[161]. Therefore additional studies are necessary to understand how to regulate cross-links

58
in lignin. In any case before using transgenic plants as cattle food deep and accurate
studies on metabolism are necessary, together with eco-compatibility ones.
Genetic regulation of enzymes has been performed also on softwood conifers. The overall
results are partially consistent with hardwood tests and partially unexpected. Enzyme
regulation has been performed on pine for 4CL, CCOMT and CCR [162-164]. Reduction
of lignin content and changes in lignin composition were registered as expected, but other
phenotypic effects were observed as well. Modified carbohydrate metabolism and changes
in wood/bark ratio are some of the most unexpected effects measured in transgenic
softwoods. This results point out that gymnosperm physiological complexity is greater than
expected, most likely lignin plays a more relevant role in conifers development than in
angiosperms. This role will need to be further investigated before it will be possible to
effectively modify softwood [162].
1.4 Lignin model compounds
At the end of chapter 1.2 (p.43 section 1.2.5) two main approaches to lignin knowledge
were reported: biosynthesis study, which has just been covered, and model compounds.
The latter will be discussed here. A model compound is a simple molecule, synthesized or
otherwise obtained, which reacts in a similar way to the more complex compound of
interest. Basically, it is a simplified version of the molecule that needs to be studied. With
such a molecule, for example, it is possible to perform easier and more precise analysis, or
to test the specific reactivity of a small portion of a bigger molecule. It goes by itself that,
with a polymer such as lignin, the simplification provided by model compounds is more
than needed. Model compounds in lignin are mostly synthetic monlignols dimers or
oligomers, with two main applications. In early work, model compounds were used to
confirm and back up analytical data obtained from natural lignin. Degradative studies were
performed on both models and lignin samples to confirm the presence and identity of
specific bonds, structures and constituents. Later on the same strategy has been applied to
more advanced analysis methods, such as NMR. Model compounds are employed to obtain
clearer spectra, without interferences or overlapping peaks, in order to properly assign each
signal and identify specific peaks for each structure [165,166]. Our knowledge of lignin
has been widely improved by the analysis of model compounds, and peak assignment of in
vivo lignin made much easier. The other main field of application for model compounds is

59
the reactivity test for each lignin linkage. Most applicative studies conducted on lignin are
aimed at its decomposition, all kind of reactions have been attempted and studied, with the
purpose of better converting lignin to smaller constituents [167]. By using the appropriate
model compound it is possible to study each linkage individually, which allows more
specific tests and much more understandable results. Model compounds are very useful,
because they can simplify problems otherwise too complicated to be solved. The most
important feature of a model compound is its similarity to the original molecule; it is
pointless to perform very accurate analysis on a molecule which is not related to the real
target of the analysis. Sometimes it is hard to determine whether a molecule and its model
are similar enough. In any case, even with the most refined model, it is important to keep
in mind that it is just a model, and that it might not respond exactly as the original
molecule.
DHP
The most important features of dehydrogenation polymer have already been described (p.
52 section 1.3.3); here it will be discussed with more technical details. Leaving aside every
dispute about DHP similarity to natural lignin, only the data will be presented, and it is left
to the reader to decide whether DHP is a suitable model for lignin or not. Anyway, since in
the past DHP has been assumed to be identical to lignin, it is now important to make it
clear that even if they are similar, they are not the same thing. DHP is obtained after
radical oxidation of monolignols, just like lignin, what differs are the other reaction
conditions. The dehydrogenation theory was presented by Erdtman in 1933 [168], when he
found out that reaction of monolignols with ferric chloride (FeCl3), or mushroom oxidases,
gave phenylcoumaran (36) (β-5) as product. Since phenylcoumaran structures had earlier
been found in lignin, Erdtman proposed that lignin was also formed by dehydrogenation.
More convincing evidence to back up the dehydrogenation theory was found and reported
over the years. Some years later, further degradation studies were performed on coniferyl
alcohol (29) reacted with FeCl3. Treatment with hot alkali followed by methylation and
permanganate oxidation produced the same degraded molecules as lignin [169]. Finally,
reaction of coniferyl alcohol with enzymes such as oxygenases, laccases and peroxidases
produced a polymer which showed some similarities with Björkman lignin [170,171]. This
polymer was called dehydrogenation polymer, DHP. In early work, DHP was prepared
with what is called the Zulauf method; all the reagents are put together in a batch and then
reacted. The outcome is a DHP with very few similarities with lignin, the most abundant

60
linkage is β-5, β-O-4 (34) concentration is very low and some bonds are not present at all.
The reason is that monomers concentration favors monomer-monomer coupling, while
monomer-polymer addition is thought to be the main phenomenon in lignin constitution.
Therefore DHP is nowadays synthesized with the Zutprof method, which consists in slow
addition of monomers into a solution containing enzymes and oxidants. With this method
β-O-4 concentration rises, but the linkages ratios are still different from the ones in lignin
[172]. In recent years more sophisticated synthesis procedures have been proposed. In
order to achieve the high dilution assumed for in vivo process, coniferyl alcohol has been
diffused in the reaction mixture through a membrane. With this method monomer
dimerization has been drastically reduced and similarity to lignin improved. Once again,
even with this method, DHP and natural lignin are very similar but not identical [150].
Apparently the choice of oxidant does not strongly affect the outcome of the reaction. DHP
has been obtained with inorganic oxidants, such as FeCl3 or MnO2 and different enzymes,
such as Oxidases and laccases with oxygen, or peroxidases with H2O2. Currently
Horseradish peroxidase (HRP) is perhaps the most employed enzyme. Another factor that
is currently under investigation is the influence of carbohydrate presence on DHP (and
lignin) growth, as has been discussed in (p. 31 section 1.2.2). Also monolignols oxidation
potentials have been researched [173]. Each monolignol has a different oxidation potential,
which varies with pH and with the linkages formed. It is believed that the oxidation
potentials play a role in defining the structure of lignin, that it somehow helps regulating
the kind of bonds formed. No successful attempts to apply this knowledge to DHP
synthesis have been made, but it is possible that the control of this feature could allow
another improvement in DHP’s similarity to lignin.
Among other things, DHP helped scientists to understand how cell wall works [174], and
to study linkages between lignin and cellulose (4), along with the opportunity to break
them and degrade lignin [175,176]. Surprisingly in vitro DHP also shows some sort of long
range ordering, apparently macro aggregates of DHP are formed even without sugars or
other entities [177].
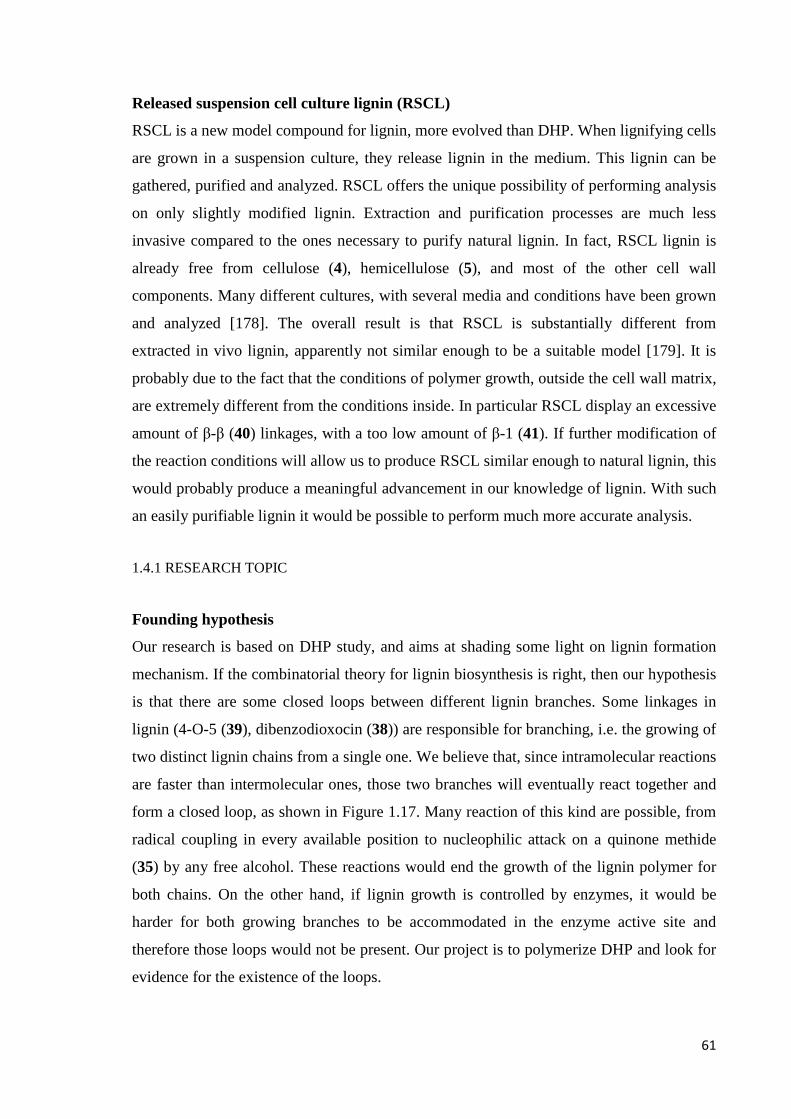
61
Released suspension cell culture lignin (RSCL)
RSCL is a new model compound for lignin, more evolved than DHP. When lignifying cells
are grown in a suspension culture, they release lignin in the medium. This lignin can be
gathered, purified and analyzed. RSCL offers the unique possibility of performing analysis
on only slightly modified lignin. Extraction and purification processes are much less
invasive compared to the ones necessary to purify natural lignin. In fact, RSCL lignin is
already free from cellulose (4), hemicellulose (5), and most of the other cell wall
components. Many different cultures, with several media and conditions have been grown
and analyzed [178]. The overall result is that RSCL is substantially different from
extracted in vivo lignin, apparently not similar enough to be a suitable model [179]. It is
probably due to the fact that the conditions of polymer growth, outside the cell wall matrix,
are extremely different from the conditions inside. In particular RSCL display an excessive
amount of β-β (40) linkages, with a too low amount of β-1 (41). If further modification of
the reaction conditions will allow us to produce RSCL similar enough to natural lignin, this
would probably produce a meaningful advancement in our knowledge of lignin. With such
an easily purifiable lignin it would be possible to perform much more accurate analysis.
1.4.1 RESEARCH TOPIC
Founding hypothesis
Our research is based on DHP study, and aims at shading some light on lignin formation
mechanism. If the combinatorial theory for lignin biosynthesis is right, then our hypothesis
is that there are some closed loops between different lignin branches. Some linkages in
lignin (4-O-5 (39), dibenzodioxocin (38)) are responsible for branching, i.e. the growing of
two distinct lignin chains from a single one. We believe that, since intramolecular reactions
are faster than intermolecular ones, those two branches will eventually react together and
form a closed loop, as shown in Figure 1.17. Many reaction of this kind are possible, from
radical coupling in every available position to nucleophilic attack on a quinone methide
(35) by any free alcohol. These reactions would end the growth of the lignin polymer for
both chains. On the other hand, if lignin growth is controlled by enzymes, it would be
harder for both growing branches to be accommodated in the enzyme active site and
therefore those loops would not be present. Our project is to polymerize DHP and look for
evidence for the existence of the loops.
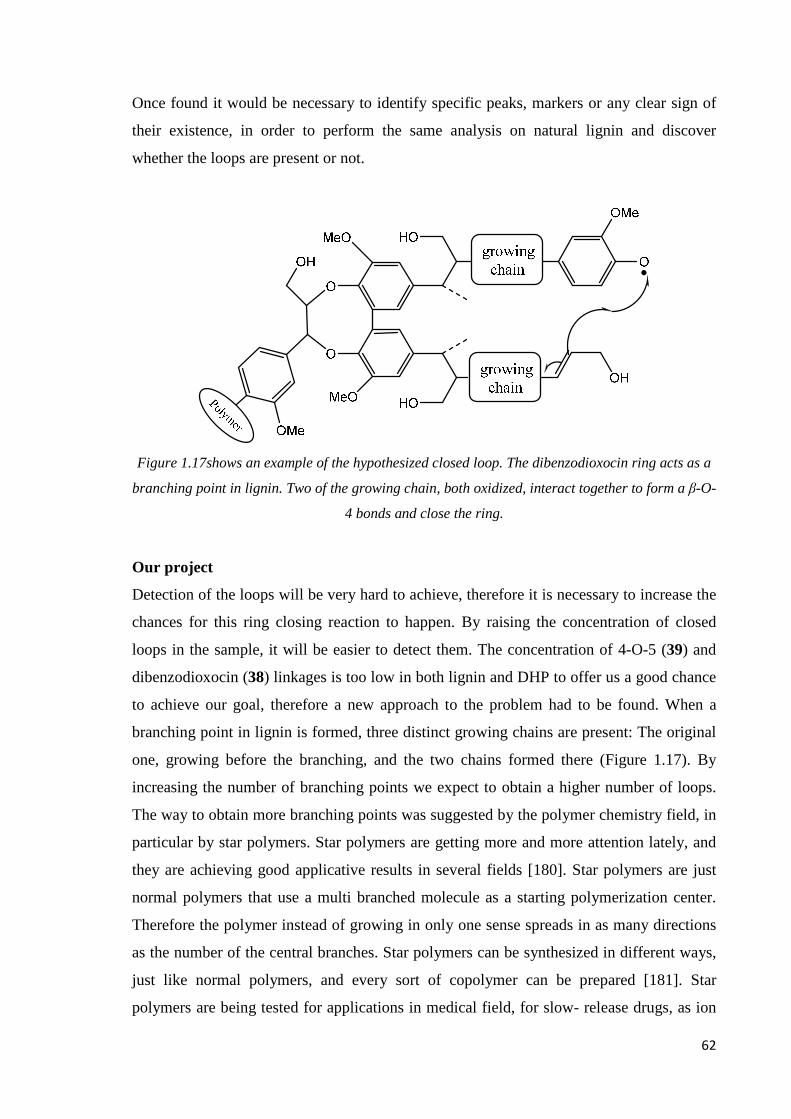
62
Once found it would be necessary to identify specific peaks, markers or any clear sign of
their existence, in order to perform the same analysis on natural lignin and discover
whether the loops are present or not.
Figure 1.17shows an example of the hypothesized closed loop. The dibenzodioxocin ring acts as a
branching point in lignin. Two of the growing chain, both oxidized, interact together to form a β-O-
4 bonds and close the ring.
Our project
Detection of the loops will be very hard to achieve, therefore it is necessary to increase the
chances for this ring closing reaction to happen. By raising the concentration of closed
loops in the sample, it will be easier to detect them. The concentration of 4-O-5 (39) and
dibenzodioxocin (38) linkages is too low in both lignin and DHP to offer us a good chance
to achieve our goal, therefore a new approach to the problem had to be found. When a
branching point in lignin is formed, three distinct growing chains are present: The original
one, growing before the branching, and the two chains formed there (Figure 1.17). By
increasing the number of branching points we expect to obtain a higher number of loops.
The way to obtain more branching points was suggested by the polymer chemistry field, in
particular by star polymers. Star polymers are getting more and more attention lately, and
they are achieving good applicative results in several fields [180]. Star polymers are just
normal polymers that use a multi branched molecule as a starting polymerization center.
Therefore the polymer instead of growing in only one sense spreads in as many directions
as the number of the central branches. Star polymers can be synthesized in different ways,
just like normal polymers, and every sort of copolymer can be prepared [181]. Star
polymers are being tested for applications in medical field, for slow- release drugs, as ion

63
traps, as flocculants for easier separation in industrial processes and in many other
applications [182-185].
With the same idea, we decided to synthesize a new, three branched, model compound for
lignin, and to use it as a polymerization center for DHP growth. Without a branched
polymerization center, lignin would mostly grow linearly, in the two opposed direction
senses. This would hardly lead to an intramolecular reaction. On the other hand three
growing branches, separated by a ≈120° angle, will more likely interact with each other.
The model compound we decided to synthesize and use for the following polymerization is
shown in Figure 1.18. To our knowledge, this molecule is new and it has never been
synthesized before. This molecule will be called model compound 3 (71) (MC3).
Figure 1.18 shows our target molecule, MC3. Our model is composed by three coniferyl alcohols
linked in a β-O-4 fashion to a central aromatic ring, the start of three lignin growing chains. A
three branched, star, lignin model compound.
Related research
It is possible that this new kind of model compounds will open new chances in lignin
research, for example in the study of the 3D spatial growth of the polymer. The
interactions between growing polymer chains could be studied in order to better understand
the relation and influence of lignin with itself. The increased amounts of branching point
will give a better understanding of how lignin actually develops in space, as opposed to the
almost linear filament that could be obtained with normal DHP synthesis. The study of 3D
lignin interaction might be helpful to prove the template polymerization hypothesis (p. 56).
Another interesting use for this new three branched polymer could be the growth of DHP
in thin layers. Attempts have already been made with classical model compounds, with not
71 Model compound 3
64
excellent results [186]. In fact DHP hardly grows in layers, the surface is not entirely
covered and a monolayer is not obtained. It is possible that our new model compounds will
provide a better surface coverage, which could allow the synthesis of a proper monolayer.
This would be a very interesting achievement for lignin chemistry. For starters it would be
possible to perform surface analysis on DHP, which would increase our knowledge of
linkages distribution and formation. In addition to that, a whole field of applications for
coniferyl alcohol (29) would be available. Modified layers of DHP could be very
interesting materials, derivatization of coniferyl alcohols and other monolignols might
allow the tailoring of the monolayer properties according to our needs. Of course, this is
just a prospect for future research, as it is unknown if it is even possible to grow DHP in
layers.
Project outline
Before moving on to the description of our work, it is appropriate to summarize what said
so far about our project and to draw a simple scheme of the purpose of the research.
1. Synthesis of new, three branched, lignin model compounds. The idea came from
star polymers. As this kind of molecules have never been synthesized the whole
process need to be tested and optimized.
2. Polymerization tests. It is necessary to prove that the synthesized model
compounds will act as polymerization centers.
3. Analysis on DHP, to possibly detect closed loop structures. Identification and
characterization.
4. Eventual further studies (3D growth or monolayer synthesis)

65
2 Experimental
This chapter is divided into three main parts. The first part is dedicated to the description
of the analytical tools employed. The following parts report the procedures employed
during the synthesis of the model compounds and the following polymerization,
respectively. Only the best procedure achieved for each step is reported here, leaving aside
all the attempts that were necessary to find it.
2.1 Analysis
Several analysis tools were employed during this project. The instrument employed and the
most important experimental procedures are reported here.
2.1.1 NUCLEAR MAGNETIC RESONANCE (NMR)
NMR spectra were recorded on Varian Inova 500, Varian Mercury Plus 300 and Varian
Unity-300 spectrometers (1H: 500 and 300 MHz, and 13C: 125 and 75 MHz, respectively)
using CDCl3, D2O, DMSO-d6 or acetone-d6 as solvents. The 300 MHz instruments were
normally employed for routine analysis, while the 500 MHz machine was used only on
relevant samples to obtain a better resolution. Two-dimensional NMR techniques (HSQC,
HSQC-TOCSY and HMBC) were used for the identification of products using standard
pulse sequences provided by the manufacturer for acquisition and data processing.
NMR samples preparation
Typically NMR samples were prepared by dissolving 20-30 mg of the sample in the
chosen deuterated solvent. The 2D and 13C experiments widely employed during the
project require a high amount of sample to be recorded in a reasonable time. Solubility was
a big issue for both analysis and synthesis; several deuterated solvents were employed for
NMR. The most employed were CDCl3, DMSO D6 and acetone D6. Sometimes, because of
the low solubility or low yield, small samples (<5mg) had to be analyzed.
66
2.1.2 SIZE EXCLUSION CHROMATOGRAPHY (SEC)
The molecular weight distribution analysis was performed using Waters 990 equipment
including degasser, auto sampler and column oven (Waters 717 plus Auto sampler, Waters
515 HPLC pump, Biotech Model 2003 Degasser) with 50 µL injection. Separation was
done using Waters Styragel HR1, HR2 and HR4 columns in 30 °C eluting with THF 0.8
mL/min with 1% toluene as internal standard. Waters 2487 Dual Absorbance Detector, at
UV wavelength of 254 nm and refractive index (RI) detector were used for detection. The
molecular mass was calibrated using polystyrene standards. Millennium 32 GPC software
(Waters) was used for data processing to obtain as numerical output Mn (number-average
molecular weight), and Mw (weight-average molecular weight). The polydispersity PDI
(Mw/Mn) has been calculated as well.
SEC samples preparation
For the preparation of SEC samples1-2 mg of product were dissolved in 1 mL dry THF,
with 1% of toluene as a reference. The solution was then filtered in the SEC vial using a
0.45 µm Acrodisc GHP Membrane HPLC filter.
2.1.3 HIGH PERFORMANCE LIQUID CHROMATOGRAPHY (HPLC)
HPLC was performed using an Agilent 1200 series HPLC machine on a C18 stationary-
phase column Zorbax Eclipse RP XDB-C18 (2,1×100 mm, 3,1 µm) at 40°C. The mobile
phase usually was water : methanol (50:50). Detection was via UV 7 spectrometry,
chromatograms were produced from 270 nm monitoring, with additional information
provided at 254 nm and 280 nm.
HPLC samples preparation
To prepare an HPLC sample, 1-2 mg of the desired product were dissolved in 1 mL of
dioxane or methanol, according to solubility. The solution was then diluted 1:10 with a
mixture MeOH/H2O, in order to obtain a final solution 1:1 organics/water. Then, 1 mL of
the sample was filtered with a 0.45 µm Acrodisc GHP Membrane HPLC filter and put in a
HPLC vial.
67
2.1.4 THIN LAYER CHROMATOGRAPHY (TLC)
TLC was performed on Merck silica gel 60 F254 plates, in various solvent systems. Due to
the high aromaticity of the reactants, the spots were visualized with ultraviolet light only.
The solvent system varied depending on the separation desired and on the molecules
solubility. TLC has been employed to test the best eluent for each chromatographic
column, and to follow each reaction. Reaction times for routine operations were decided
according to TLC results.
2.1.5 BIOTAGE SEPARATION
When the solvents employed allowed it, Biotage separation was used instead of column
chromatography. It was performed on a BiotageIsoleraSpektra 4 using a 10g SNAP Ultra
cartridge. The collection wavelength was 280 nm and the monitoring wavelength 254 nm.
Because of the employed wavelengths, this instrument could only be used when toluene
was not present in the eluent mixture. The parameters (solvent gradients, eluent amount,
flow rate, etc.) were suggested by the instrument on the basis of the TLC results. Biotage
separation was mostly used during MC3 synthesis, for purification after the first reaction
step. The products fractions were collected automatically according to the UV peaks
detected.
2.2 Synthesis
The synthesis of three model compounds for lignin, with increasing complexity and
similarity to lignin structures, was attempted in this project. Each one will be discussed
individually. Detailed discussion and analysis of each compound will be given in the
results and discussion chapter. Even if these compounds have never been synthesized
before, the reactions employed are commonly performed in organic chemistry and in lignin
model compounds synthesis [60,187-191]. The reaction steps needed to be tested for
results and optimized. The synthesis pathway was based on former work in lignin model
compounds chemistry and on our laboratory experience.
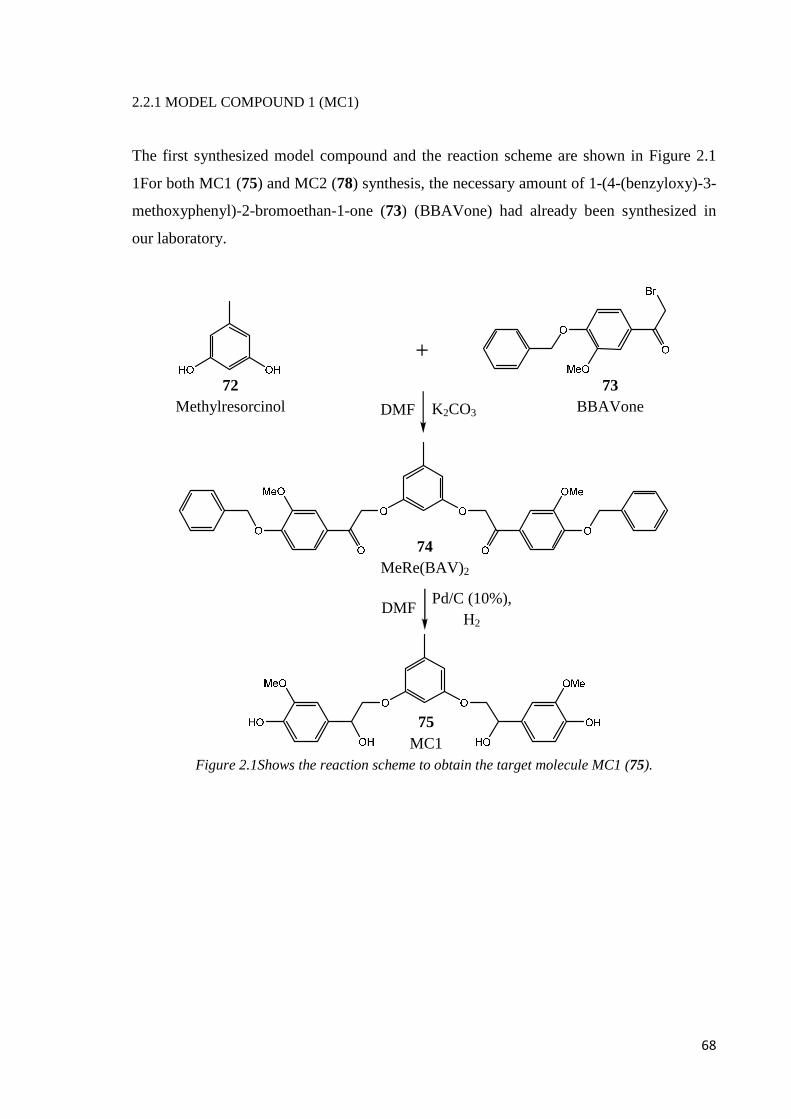
68
2.2.1 MODEL COMPOUND 1 (MC1)
The first synthesized model compound and the reaction scheme are shown in Figure 2.1
1For both MC1 (75) and MC2 (78) synthesis, the necessary amount of 1-(4-(benzyloxy)-3-
methoxyphenyl)-2-bromoethan-1-one (73) (BBAVone) had already been synthesized in
our laboratory.
Figure 2.1Shows the reaction scheme to obtain the target molecule MC1 (75).
72 Methylresorcinol
74 MeRe(BAV)2
73 BBAVone
75 MC1
+
DMF Pd/C (10%),
H2
DMF K2CO3
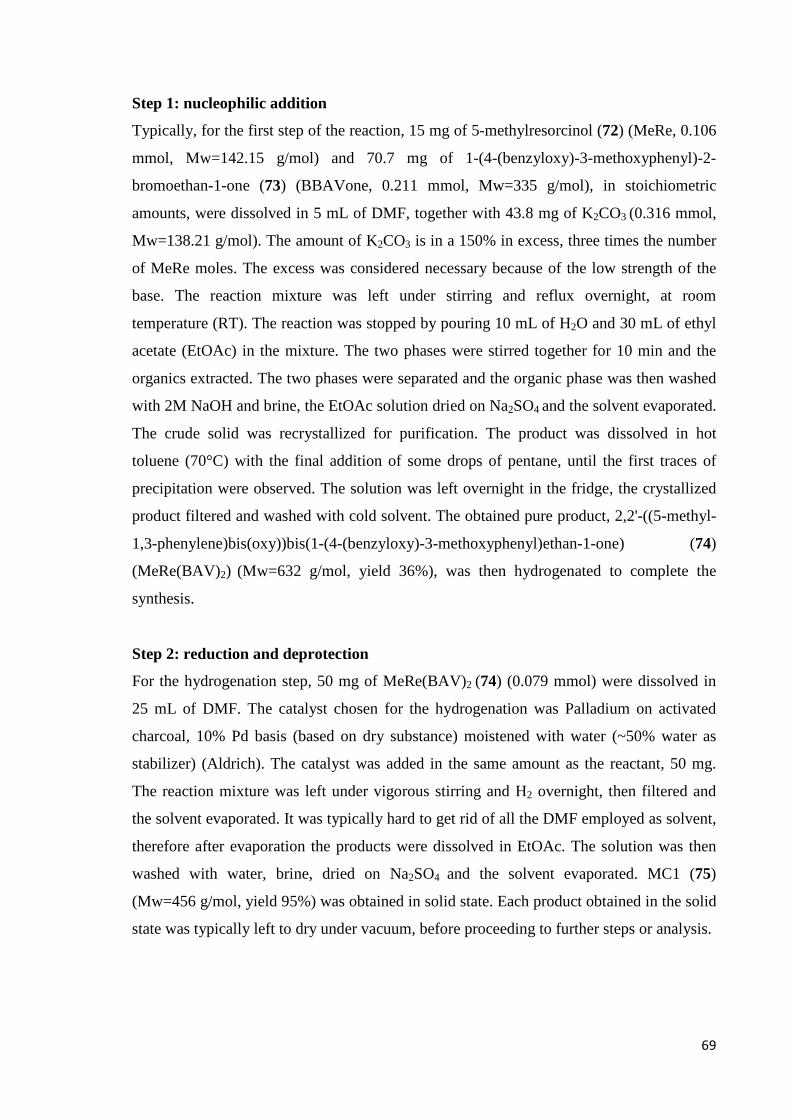
69
Step 1: nucleophilic addition
Typically, for the first step of the reaction, 15 mg of 5-methylresorcinol (72) (MeRe, 0.106
mmol, Mw=142.15 g/mol) and 70.7 mg of 1-(4-(benzyloxy)-3-methoxyphenyl)-2-
bromoethan-1-one (73) (BBAVone, 0.211 mmol, Mw=335 g/mol), in stoichiometric
amounts, were dissolved in 5 mL of DMF, together with 43.8 mg of K2CO3 (0.316 mmol,
Mw=138.21 g/mol). The amount of K2CO3 is in a 150% in excess, three times the number
of MeRe moles. The excess was considered necessary because of the low strength of the
base. The reaction mixture was left under stirring and reflux overnight, at room
temperature (RT). The reaction was stopped by pouring 10 mL of H2O and 30 mL of ethyl
acetate (EtOAc) in the mixture. The two phases were stirred together for 10 min and the
organics extracted. The two phases were separated and the organic phase was then washed
with 2M NaOH and brine, the EtOAc solution dried on Na2SO4 and the solvent evaporated.
The crude solid was recrystallized for purification. The product was dissolved in hot
toluene (70°C) with the final addition of some drops of pentane, until the first traces of
precipitation were observed. The solution was left overnight in the fridge, the crystallized
product filtered and washed with cold solvent. The obtained pure product, 2,2'-((5-methyl-
1,3-phenylene)bis(oxy))bis(1-(4-(benzyloxy)-3-methoxyphenyl)ethan-1-one) (74)
(MeRe(BAV)2) (Mw=632 g/mol, yield 36%), was then hydrogenated to complete the
synthesis.
Step 2: reduction and deprotection
For the hydrogenation step, 50 mg of MeRe(BAV)2 (74) (0.079 mmol) were dissolved in
25 mL of DMF. The catalyst chosen for the hydrogenation was Palladium on activated
charcoal, 10% Pd basis (based on dry substance) moistened with water (~50% water as
stabilizer) (Aldrich). The catalyst was added in the same amount as the reactant, 50 mg.
The reaction mixture was left under vigorous stirring and H2 overnight, then filtered and
the solvent evaporated. It was typically hard to get rid of all the DMF employed as solvent,
therefore after evaporation the products were dissolved in EtOAc. The solution was then
washed with water, brine, dried on Na2SO4 and the solvent evaporated. MC1 (75)
(Mw=456 g/mol, yield 95%) was obtained in solid state. Each product obtained in the solid
state was typically left to dry under vacuum, before proceeding to further steps or analysis.
70
2.2.2 MODEL COMPOUND 2 (MC2)
The second model compound is shown in Figure 2.2 along with the reaction scheme.
OH
OHHO
O
Br
MeO
O
O
O
O
OO
O
O
MeO
O
O
OMe
MeO
HO
O
OH
OO
HO
OH
MeO
HO
OH
OMe
MeO
Figure 2.2 Shows the reaction scheme to obtain the target molecule MC2 (78).
76 Phloroglucinol
73 BBAVone
77 (Ph(OBAVone)3
78 MC2
Pd/C (10%), H2
DMF ∆
+
KOH
THF
71
Step 1: nucleophilic addition
For the first step of this synthesis 61.4 mg of phloroglucinol (76) (Ph(OH)3, 0.487 mmol,
Mw= 126.11 g/mol) and 83.7 mg of ground KOH (0.149 mmol, Mw=56.11), in
stoichiometric amount, were dissolved in 1.5 mL of DMF. They were left to react under
reflux at 40°C for 30 min. Then 500 mg of BBAVone (73) (0.149 mmol, Mw=335 g/mol),
dissolved in 2 mL of DMF, were slowly added over 30 min. The reaction was left under
reflux and stirring at 40°C overnight. The reaction produced a solid and a liquid phase.
After filtration the liquid phase was discarded (more details at p. 71 section.2.2.2 ), and the
solid phase washed with H2O, 2M HCl, and EtOAc. This phase was insoluble in most
solvents. The solid phase (yield 21.3%), containing 2,2',2''-(benzene-1,3,5-
triyltris(oxy))tris(1-(4-(benzyloxy)-3-methoxyphenyl)ethan-1-one) (77), (Ph(OBAVone)3,
Mw= 888 g/mol) was dried in the vacuum pump before moving to the hydrogenation step.
Step 2: reduction and deprotection
For the hydrogenation step, 100 mg of Ph(OBAVone)3 (77) (0.113 mmol, Mw= 888
g/mol) were partially dissolved in 100 mL of THF. To the suspension were added 200mg
of Pd/C (10%) catalyst. The reaction was left overnight under H2 flow and vigorous
stirring. After the reaction, almost all the starting Ph(OBAVone)3 was hydrogenated and
the alcohols deprotected. The product was soluble in THF; it was therefore safe to filter out
the mixture to eliminate the catalyst. After filtration THF was evaporated, and a solid
mixture obtained. The solid was washed with toluene and CHCl3 to remove impurities, and
then dissolved in EtOAc. The solution was washed with water and brine, dried over
Na2SO4 and the solvent evaporated. Pure MC2 (78) (Mw= 624 g/mol, yield 33.5%) was
obtained at the end of the procedure.
2.2.3 MODEL COMPOUND 3 (MC3)
The third synthesized model compound and its reaction scheme are shown in Figure 2.3.
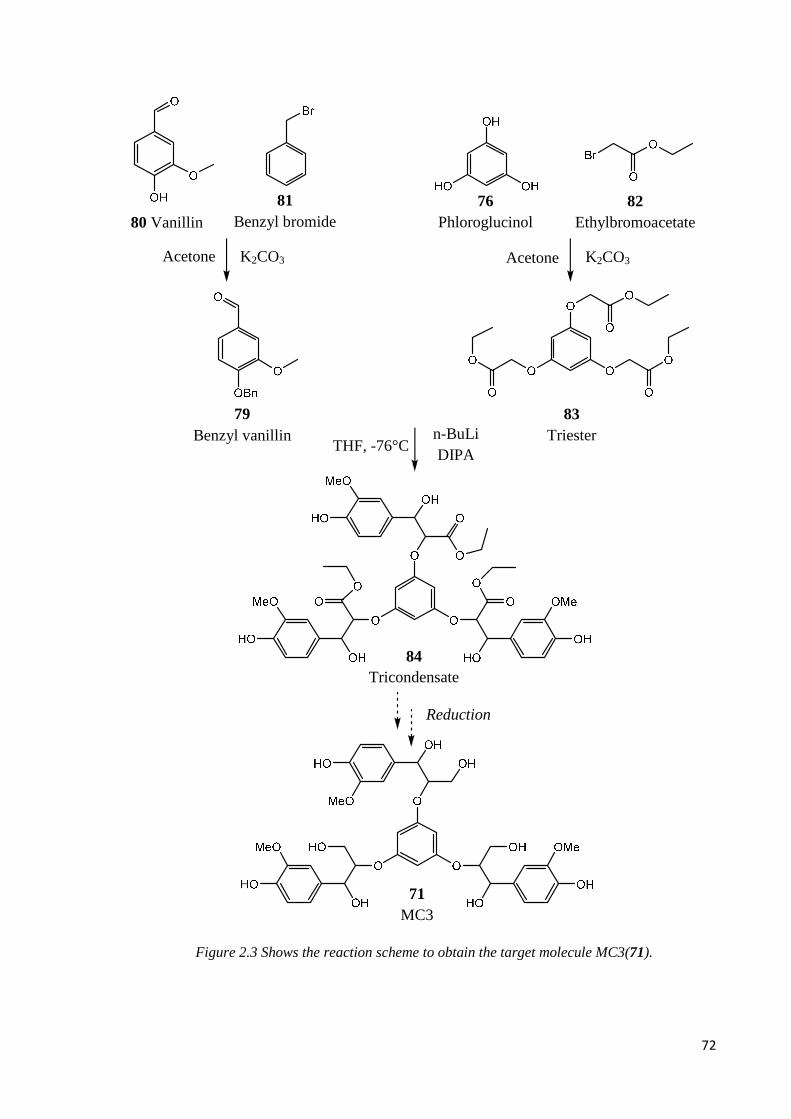
72
Figure 2.3 Shows the reaction scheme to obtain the target molecule MC3(71).
76 Phloroglucinol
80 Vanillin
81 Benzyl bromide
82 Ethylbromoacetate
79 Benzyl vanillin
83 Triester
84 Tricondensate
71 MC3
Acetone
K2CO3 Acetone
K2CO3
THF, -76°C n-BuLi DIPA
Reduction
73
Step 1: Benzyl vanillin synthesis
The synthesis procedure of benzyl vanillin (79) (Mw= 242 g/mol) was already established
and therefore has only been performed once. 26 g of vanillin (80) (0.171 mol, Mw= 152.15
g/mol) were dissolved in 125 mL of EtOH and 20 mL of benzyl bromide (81) (0.168 mol,
Mw= 171.03 g/mol, ρ= 1.438 g/cm3). 24 g of K2CO3 (0.174 mol, Mw=138.21 g/mol) were
added to the mixture. The reaction was left under reflux for 3 h. The warm mixture was
poured into 1 L of NaOH 0.5 M, the solids were filtered and recrystallized from EtOH.
Step 2: nucleophilic addition
Typically, for the synthesis of MC3 (71), 2 g of phloroglucinol (76) (0.016 mol, Mw=
126.11 g/mol) and 8g of ethyl bromoacetate (82) (0.069 mol, Mw= 176 g/mol, ρ= 1.51
g/cm3) were reacted in 50 mL of acetone with 6.6 g of K2CO3 (0.047 mol, Mw=138.21
g/mol). The reaction was left under reflux overnight at 90°C. After cooling, the solid was
filtered and washed with acetone to extract the product from the solid waste. The combined
organic solution was evaporated, and the obtained organic solid dissolved in 50 mLof
EtOAc. The organic phase was washed with 2M NaOH and brine, dried over Na2SO4 and
the solvent evaporated. The residual benzyl vanillin present in the solid was eliminated by
silica flash column chromatography, with a 5:2 pentane/EtOAc mixture as eluent. Because
of the low solubility the solid was first dissolved in a 1:1 pentane/EtOAc mixture, then
dried and adsorbed on silica. The impregnated silica was then added at the top of the
chromatographic column. The pure product of interest, triethyl 2,2',2''-(benzene-1,3,5-
triyltris(oxy))triacetate (83), (triester, Mw= 384 g/mol yield 46.8%) was collected and the
solvent evaporated.
Step 3: aldol condensation
The following step consisted in the condensation of the obtained triester (83) with the
previously synthesized benzyl vanillin (79). 1.68 mL of diisopropylamine (DIPA, 12
mmol, Mw= 101.19 g/mol, ρ= 0.722 g/cm3) were diluted in 5 mL of dry THF under argon
and cooled to 0°C in an ice/salted water bath. Then 6.25 mL of n-butyl lithium in hexane
(n-BuLi, 10 mmol, 1.6 mol/L) were slowly added to the reaction mixture over 15 min. The
mixture was left to react for 30 min, always at the same temperature and under inert
atmosphere. The reaction mixture was then cooled in an ethanol-dry ice cooling bath.
When the reaction reached -70°C, 1 g of triester (2.6 mmol, Mw= 384 g/mol) dissolved in
5 mL of dry THF, was slowly added over 40 min. the temperature was kept stable during
74
the addition. Without delay, 1.94 g of benzyl vanillin (8 mmol, 242 g/mol) in 15 mL of dry
THF were added to the reaction over a period of 1h. After the end of the addition the
reaction was left to stir for ≈2h, always under argon. The mixture was then quenched in a
saturated NH4Cl solution and neutralized with 2M HCl. 30 mL of EtOAc were added to the
reaction mixture to extract the organics. The EtOAc solution was then separated and
washed with 2M HCl, a saturated solution of NaHCO3 and brine, dried over Na2SO4 and
the solvent evaporated. The obtained solid contained a high amount of impurities.
Purification has been attempted and partially achieved with a silica flash chromatographic
column, using a mixture 2:1 toluene/EtOAc as eluent. The purification of the product,
triethyl-2,2',2''(benzene-1,3,5-triyltris(oxy))tris(3-hydroxy-3-(4-hydroxy-3-
methoxyphenyl)propanoate) (84), (tricondensate, Mw=1110 g/mol) was only partial, and
the yield extremely low ( 1-4%), therefore the synthesis of MC3 (71) has been abandoned.
2.2 Polymerization
DHP polymerization has been conducted under a variety of conditions. All variables are
reported in table 2.1. The general procedure for each step is described below.
Buffer preparation
A buffer at pH 6 of citric acid and Na2HPO4 was required for the polymerization. A
solution of citric acid, 100 mL 0.1M (Mw= 210.14 g/mol) and 100 mL of Na2HPO4
solution 0.2M (Mw=177.99 g/mol) were prepared. 63.15 mL of Na2HPO4 solution and
36.85 mL of citric acid solution were mixed together. The pH was measured with a pH
meter and adjusted to 6 by slow addition of the same solutions. The same procedure, with
61.45 mL of citric acid and 38.53 mL of Na2HPO4 as starting amounts, was performed to
obtain a pH 4 buffer.
Model compounds and coniferyl alcohol
Three model compounds were used as starting polymerization centers: MC1 (75), 5-
methylresorcinol (72) and phloroglucinol (76). Even if MC2 (78) was synthesized and
purified, the yield of the reaction was too low to obtain a proper amount of the molecule,
especially if a series of tests had to be performed. The coniferyl alcohol (29) (Mw= 180.2
g/mol) employed had already been synthesized in our laboratory.
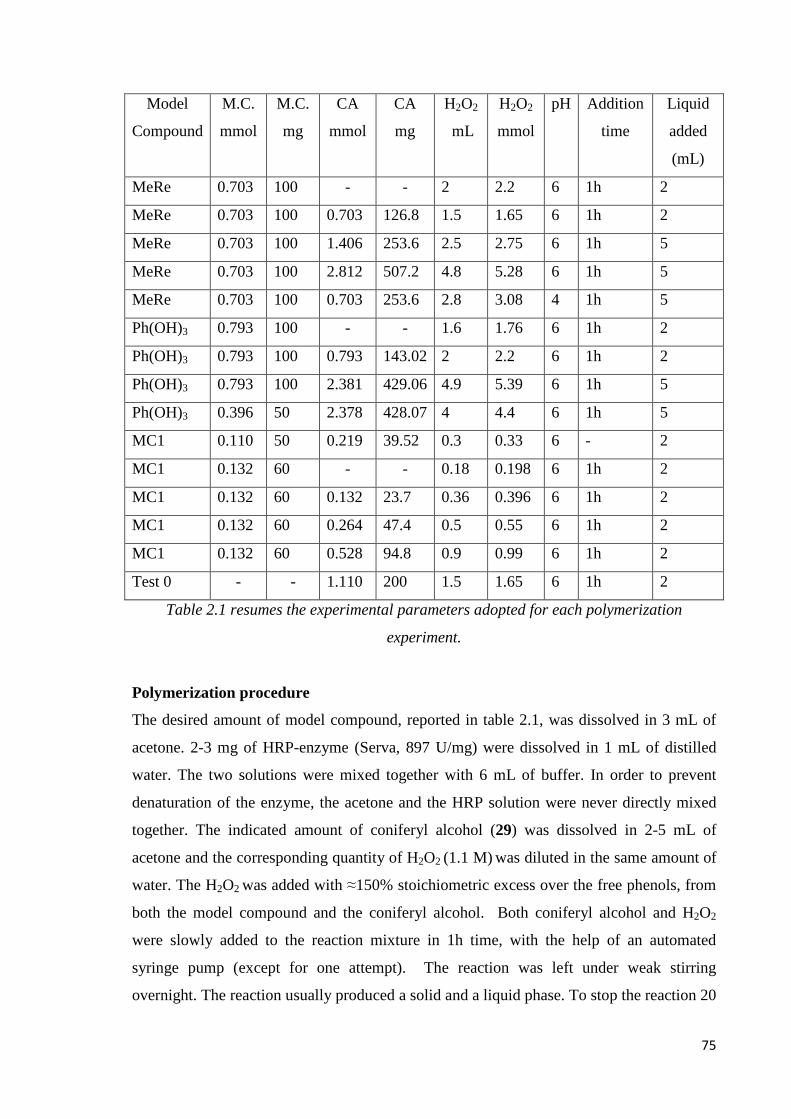
75
Model
Compound
M.C.
mmol
M.C.
mg
CA
mmol
CA
mg
H2O2
mL
H2O2
mmol
pH Addition
time
Liquid
added
(mL)
MeRe 0.703 100 - - 2 2.2 6 1h 2
MeRe 0.703 100 0.703 126.8 1.5 1.65 6 1h 2
MeRe 0.703 100 1.406 253.6 2.5 2.75 6 1h 5
MeRe 0.703 100 2.812 507.2 4.8 5.28 6 1h 5
MeRe 0.703 100 0.703 253.6 2.8 3.08 4 1h 5
Ph(OH)3 0.793 100 - - 1.6 1.76 6 1h 2
Ph(OH)3 0.793 100 0.793 143.02 2 2.2 6 1h 2
Ph(OH)3 0.793 100 2.381 429.06 4.9 5.39 6 1h 5
Ph(OH)3 0.396 50 2.378 428.07 4 4.4 6 1h 5
MC1 0.110 50 0.219 39.52 0.3 0.33 6 - 2
MC1 0.132 60 - - 0.18 0.198 6 1h 2
MC1 0.132 60 0.132 23.7 0.36 0.396 6 1h 2
MC1 0.132 60 0.264 47.4 0.5 0.55 6 1h 2
MC1 0.132 60 0.528 94.8 0.9 0.99 6 1h 2
Test 0 - - 1.110 200 1.5 1.65 6 1h 2
Table 2.1 resumes the experimental parameters adopted for each polymerization
experiment.
Polymerization procedure
The desired amount of model compound, reported in table 2.1, was dissolved in 3 mL of
acetone. 2-3 mg of HRP-enzyme (Serva, 897 U/mg) were dissolved in 1 mL of distilled
water. The two solutions were mixed together with 6 mL of buffer. In order to prevent
denaturation of the enzyme, the acetone and the HRP solution were never directly mixed
together. The indicated amount of coniferyl alcohol (29) was dissolved in 2-5 mL of
acetone and the corresponding quantity of H2O2 (1.1 M) was diluted in the same amount of
water. The H2O2 was added with ≈150% stoichiometric excess over the free phenols, from
both the model compound and the coniferyl alcohol. Both coniferyl alcohol and H2O2
were slowly added to the reaction mixture in 1h time, with the help of an automated
syringe pump (except for one attempt). The reaction was left under weak stirring
overnight. The reaction usually produced a solid and a liquid phase. To stop the reaction 20

76
mL of EtOAc were poured in, and the low molecular weight fraction of DHP was
extracted. The mixture was filtered and the solid heavy fraction collected, washed with
water and dried under vacuum. The organic phase, where the light fraction was dissolved,
was washed with water and brine, dried over Na2SO4 and the solvent evaporated. After
drying, both fractions were acetylated individually. Typically the whole amount of DHP
gathered was acetylated, with few exceptions. The employed acetylation reaction
conditions were harsher than necessary to assure complete acetylation in every case. The
obtained DHP was dissolved in 2 mL of pyridine and 2 mL of acetic anhydride, and left
under reflux overnight at 50°C. The reaction was quenched in EtOH and the solvent
evaporated, for three times. In order to completely remove pyridine as azeotrope the same
procedure was conducted using toluene as cosolvent and finally with CHCl3. The product
was then dried under vacuum.
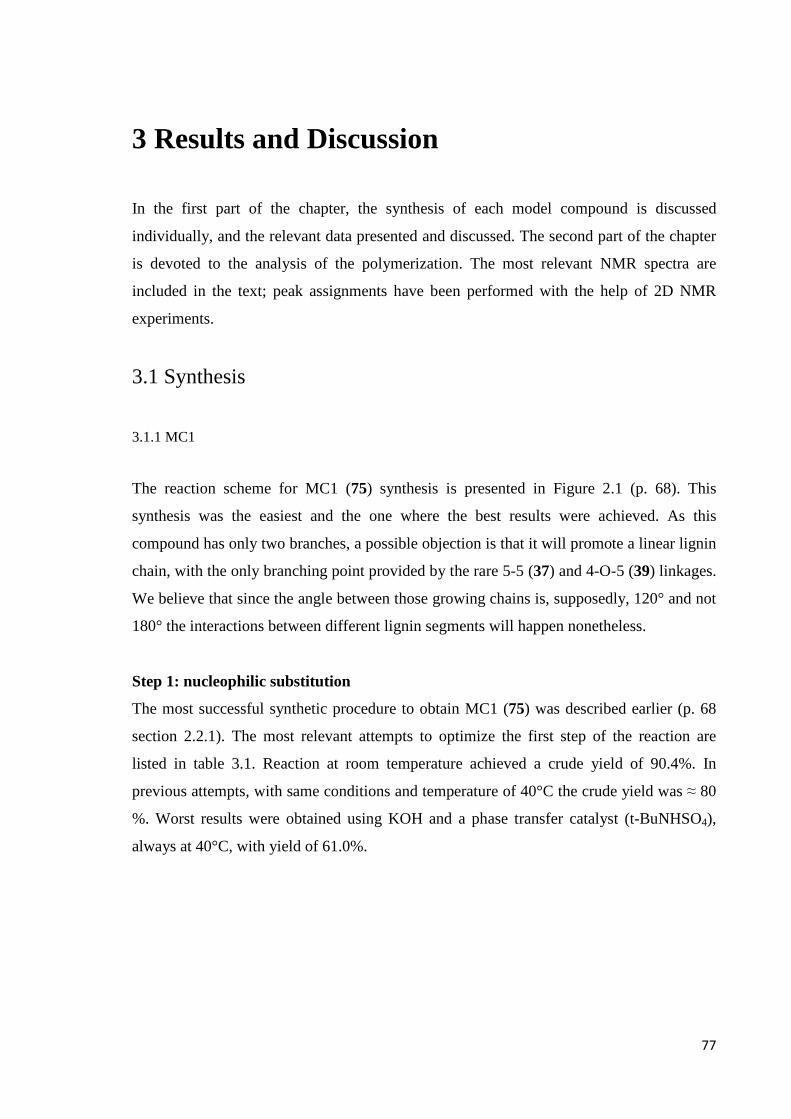
77
3 Results and Discussion
In the first part of the chapter, the synthesis of each model compound is discussed
individually, and the relevant data presented and discussed. The second part of the chapter
is devoted to the analysis of the polymerization. The most relevant NMR spectra are
included in the text; peak assignments have been performed with the help of 2D NMR
experiments.
3.1 Synthesis
3.1.1 MC1
The reaction scheme for MC1 (75) synthesis is presented in Figure 2.1 (p. 68). This
synthesis was the easiest and the one where the best results were achieved. As this
compound has only two branches, a possible objection is that it will promote a linear lignin
chain, with the only branching point provided by the rare 5-5 (37) and 4-O-5 (39) linkages.
We believe that since the angle between those growing chains is, supposedly, 120° and not
180° the interactions between different lignin segments will happen nonetheless.
Step 1: nucleophilic substitution
The most successful synthetic procedure to obtain MC1 (75) was described earlier (p. 68
section 2.2.1). The most relevant attempts to optimize the first step of the reaction are
listed in table 3.1. Reaction at room temperature achieved a crude yield of 90.4%. In
previous attempts, with same conditions and temperature of 40°C the crude yield was ≈ 80
%. Worst results were obtained using KOH and a phase transfer catalyst (t-BuNHSO4),
always at 40°C, with yield of 61.0%.
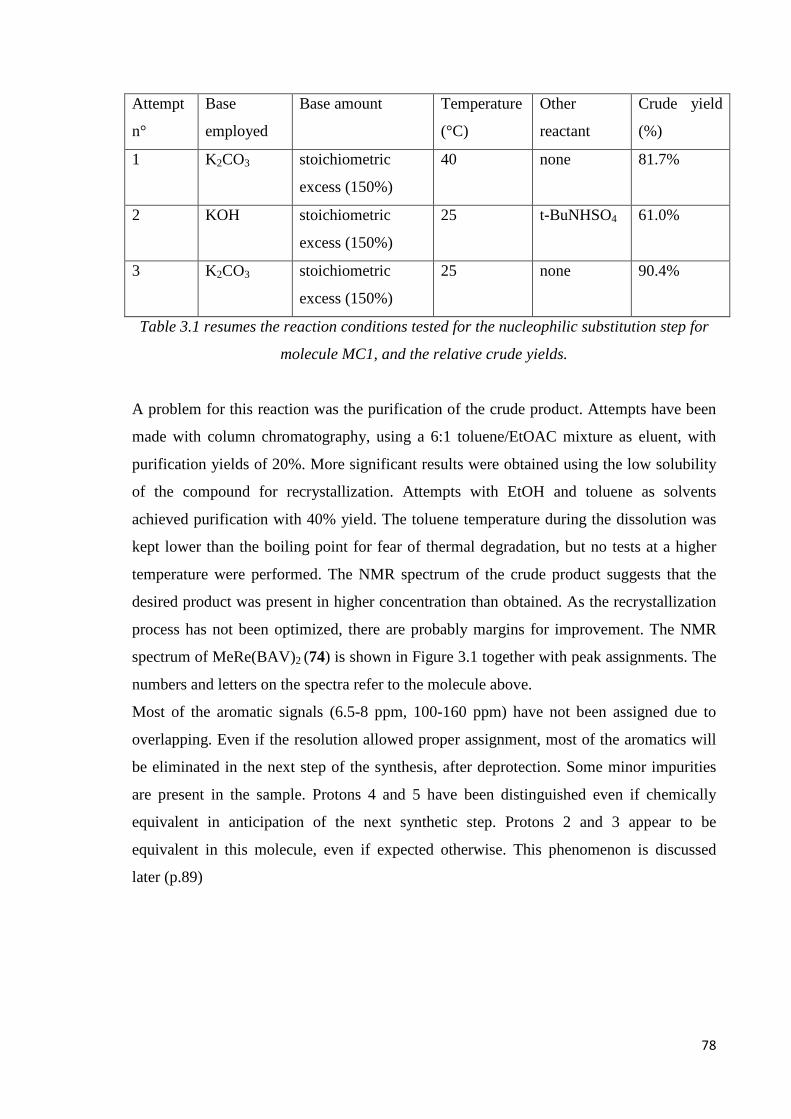
78
Attempt
n°
Base
employed
Base amount Temperature
(°C)
Other
reactant
Crude yield
(%)
1 K2CO3 stoichiometric
excess (150%)
40 none 81.7%
2 KOH stoichiometric
excess (150%)
25 t-BuNHSO4 61.0%
3 K2CO3 stoichiometric
excess (150%)
25 none 90.4%
Table 3.1 resumes the reaction conditions tested for the nucleophilic substitution step for
molecule MC1, and the relative crude yields.
A problem for this reaction was the purification of the crude product. Attempts have been
made with column chromatography, using a 6:1 toluene/EtOAC mixture as eluent, with
purification yields of 20%. More significant results were obtained using the low solubility
of the compound for recrystallization. Attempts with EtOH and toluene as solvents
achieved purification with 40% yield. The toluene temperature during the dissolution was
kept lower than the boiling point for fear of thermal degradation, but no tests at a higher
temperature were performed. The NMR spectrum of the crude product suggests that the
desired product was present in higher concentration than obtained. As the recrystallization
process has not been optimized, there are probably margins for improvement. The NMR
spectrum of MeRe(BAV)2 (74) is shown in Figure 3.1 together with peak assignments. The
numbers and letters on the spectra refer to the molecule above.
Most of the aromatic signals (6.5-8 ppm, 100-160 ppm) have not been assigned due to
overlapping. Even if the resolution allowed proper assignment, most of the aromatics will
be eliminated in the next step of the synthesis, after deprotection. Some minor impurities
are present in the sample. Protons 4 and 5 have been distinguished even if chemically
equivalent in anticipation of the next synthetic step. Protons 2 and 3 appear to be
equivalent in this molecule, even if expected otherwise. This phenomenon is discussed
later (p.89)

79
a)
Figure 3.1 a) 1H NMR spectrum of MeRe(BAV)2 inCDCl3+1%TMS
0.01.02.03.04.05.06.07.08.09.010.5f1 (ppm)
-500
0
500
1000
1500
2000
2500
3000
3500
4000
4500
5000
5500
3.38
9.00
4.63
5.45
3.54
2.82
24.16
4-5
2-3 1
6
7
Imp Imp
Aromatics
8-15

80
b)
Figure 3.1 b) 13C NMR spectrum of MeRe(BAV)2 inCDCl3+1%TMS
E
F,H
A
I
G C
Aromatics
J-V
B D
CDCl3
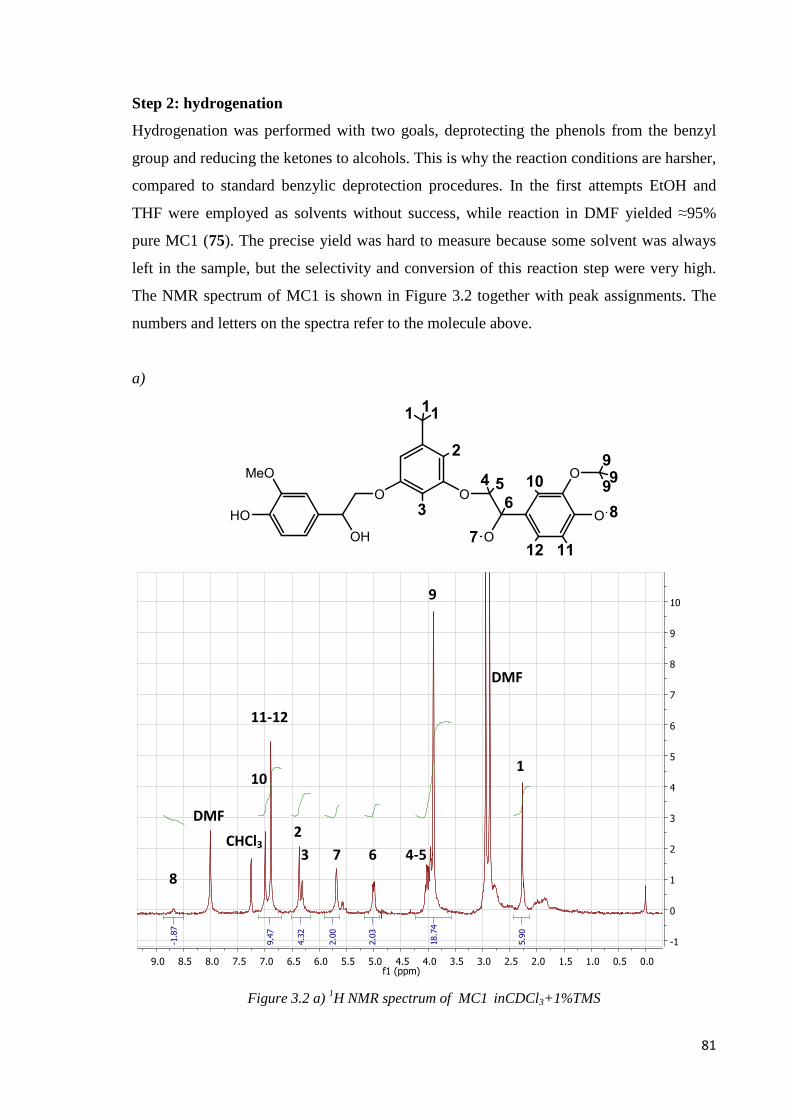
81
Step 2: hydrogenation
Hydrogenation was performed with two goals, deprotecting the phenols from the benzyl
group and reducing the ketones to alcohols. This is why the reaction conditions are harsher,
compared to standard benzylic deprotection procedures. In the first attempts EtOH and
THF were employed as solvents without success, while reaction in DMF yielded ≈95%
pure MC1 (75). The precise yield was hard to measure because some solvent was always
left in the sample, but the selectivity and conversion of this reaction step were very high.
The NMR spectrum of MC1 is shown in Figure 3.2 together with peak assignments. The
numbers and letters on the spectra refer to the molecule above.
a)
OO
HO
OH
MeO
O
O
O
111
2
3
4 5
7
8
9
9910
1112
6
Figure 3.2 a) 1H NMR spectrum of MC1 inCDCl3+1%TMS
0.00.51.01.52.02.53.03.54.04.55.05.56.06.57.07.58.08.59.0f1 (ppm)
-1
0
1
2
3
4
5
6
7
8
9
10
5.90
18.74
2.03
2.00
4.32
9.47
-1.87
CHCl3 4-5
DMF
11-12
10
3
2
7 6
8
9
1
DMF
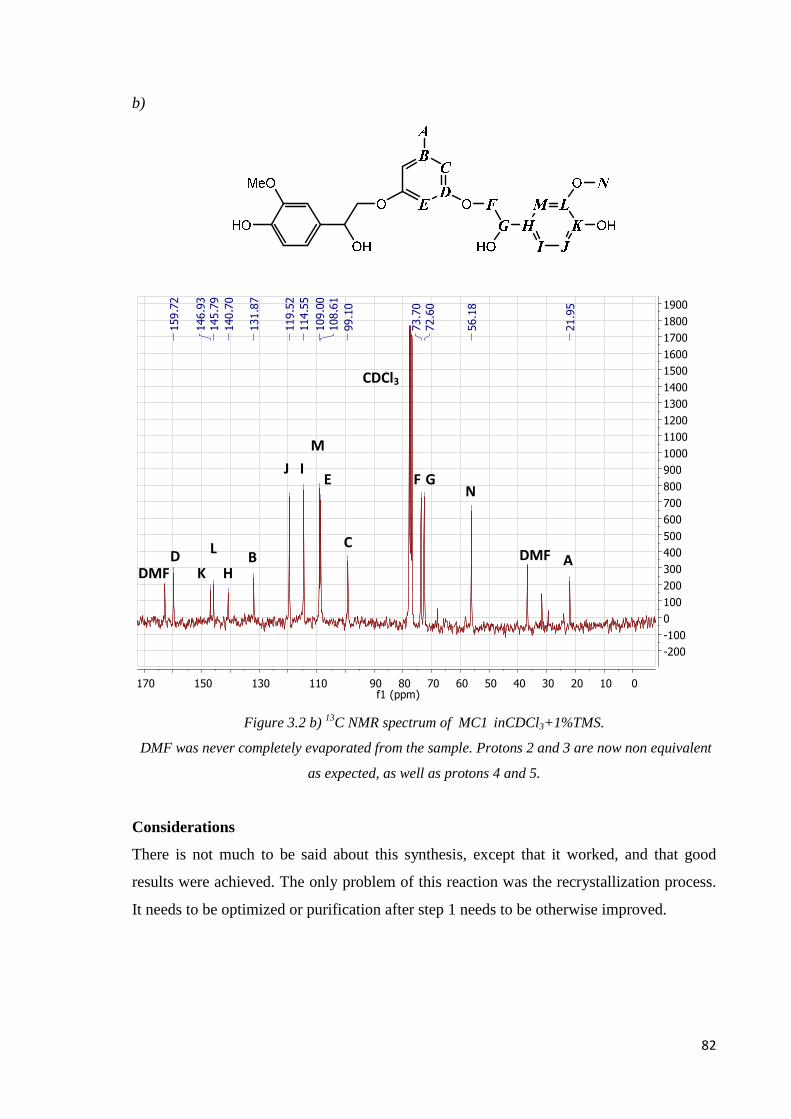
82
b)
Figure 3.2 b) 13C NMR spectrum of MC1 inCDCl3+1%TMS.
DMF was never completely evaporated from the sample. Protons 2 and 3 are now non equivalent
as expected, as well as protons 4 and 5.
Considerations
There is not much to be said about this synthesis, except that it worked, and that good
results were achieved. The only problem of this reaction was the recrystallization process.
It needs to be optimized or purification after step 1 needs to be otherwise improved.
0102030405060708090110130150170f1 (ppm)
-200
-100
0
100
200
300
400
500
600
700
800
900
1000
1100
1200
1300
1400
1500
1600
1700
1800
1900
21.95
56.18
72.60
73.70
99.10
108.61
109.00
114.55
119.52
131.87
140.70
145.79
146.93
159.72
A
F E
C D B DMF
DMF
G
K
N
L
H
J I
CDCl3
M

83
3.1.2 MC2
The reaction scheme for MC2 (78) is presented in Figure 2.2 (p. 70). The main obstacle for
this synthesis was the low solubility of MC2 and its precursors. The reaction was further
complicated by a misinterpretation of the data, which will be discussed.
Step 1: nucleophilic substitution
The first attempt for this synthesis was conducted at 40°C using KOH as base, as described
in the previous chapter (p.70 section 2.2.2). The reaction produced both, a liquid and a
solid phase, with 46.5% and 21.3% crude yield, respectively. Analysis of the liquid phase
revealed the presence of Ph(OBAVone)3 (77), our target molecule, together with several
other impurities. Attempts of purification were made by silica column chromatography and
Biotage separation, with several eluents. The results obtained were not encouraging, with
low purification yield and incomplete purification. Meanwhile the solid fraction was
analyzed. The solid was insoluble in most solvents, and only slightly dissolved in the
others. The IR analysis didn’t give any useful information, therefore a small amount of the
sample (<1mg) was partially dissolved in DMSO D6 to record a NMR spectrum. The
results were surprisingly good, apparently the solid fraction was composed by pure
Ph(OBAVone)3. The NMR spectrum is reported in Figure 3.3, together with peak
assignments. The numbers and letters on the spectra refer to the molecule above. The same
consideration about aromatic signals and equivalent protons made for MeRe(BAV)2 (74)
are valid for Ph(OBAVone)3.
The next step was naturally to optimize the reaction to increase the yield of the solid
product. Table 3.2 reports the most significant attempts and their reaction conditions. The
conditions used in attempt n° 4 produced satisfactory results.

84
Attempt
n°
Base
employed
Base addition
conditions
Temperature
(°C)
Liquid crude
yield (%)
Solid crude
yield (%)
1 KOH Slow addition 40 46.5 21.3
2 K2CO3 Excess (130%) 40 38.8 29.7
3 K2CO3 Excess (130%) 90 43.3 26.3
4 K2CO3 Excess (130%) 25 Discarded 51.2
5 KOH Slow addition 25 71.9 13.1
Table 3.2 resumes the reaction conditions, and the relative yields, tested for the
nucleophilic substitution step of MC2 synthesis.
a)
Figure 3.3 a) 1H NMR spectrum of Ph(OBAVone)3 in DMSO
Aromatics
6-13
1
2-3
5
4 H2O
DMSO
Imp

85
b)
Figure 3.3 b) 1H NMR spectrum of Ph(OBAVone)3 in DMSO. The low solubility is responsible
for the poor quality of the spectra, expecially the 13C.
Step 2: hydrogenation
The low solubility of Ph(OBAVone)3 (77) has been an issue in its hydrogenation. THF
was used as solvent because it partially dissolved our solid. The hydrogenation still had to
be performed on a suspension of both the catalyst and Ph(OBAVone)3, with only small
amounts of reactant in solution. Harsh reaction conditions were needed to reduce the
carbonyls to alcohols. The raw product of the hydrogenation was an oily mixture, partially
soluble in most solvents but hardly completely soluble. It was impossible to measure the
crude yield, despite several attempts relevant amounts of solvent always remained in the
020406080100120140160180200f1 (ppm)
-100
0
100
200
300
400
500
600
700
800
900
1000
1100
1200
1300
56.36
70.64
95.40
111.12
113.10
123.14
128.58
129.18
193.36
Aromatics
G-S
A B
C,F
E
DMSO
D
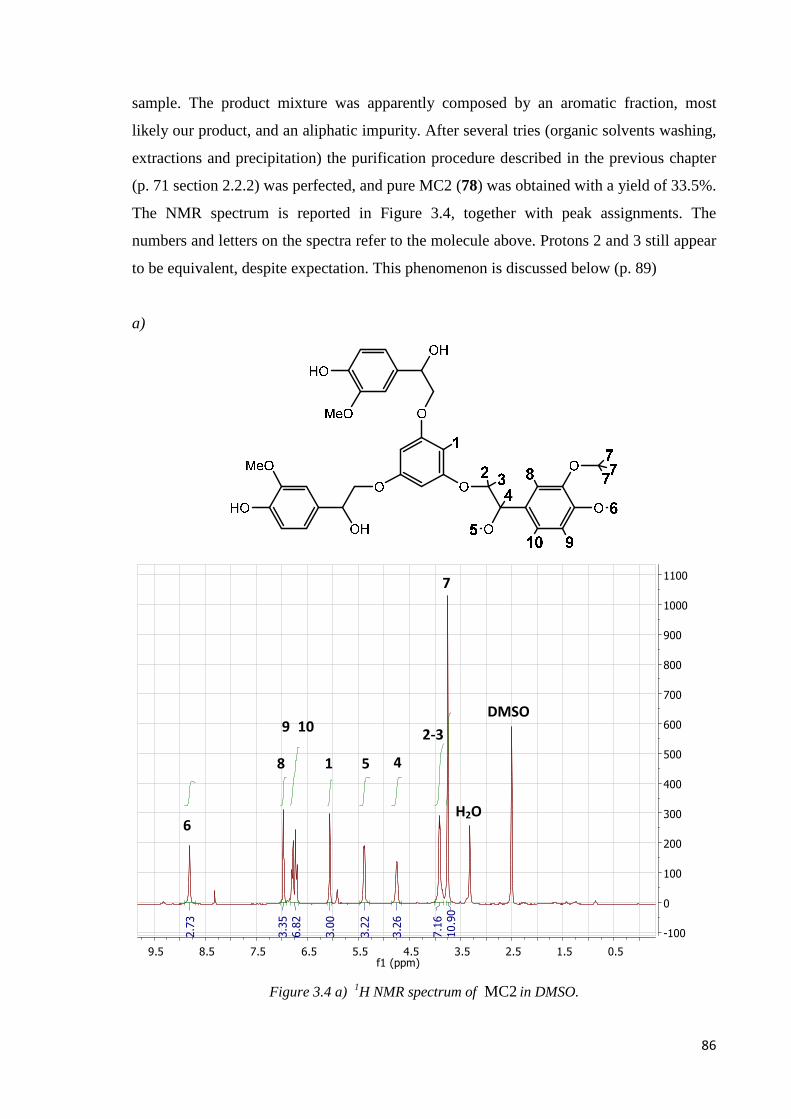
86
sample. The product mixture was apparently composed by an aromatic fraction, most
likely our product, and an aliphatic impurity. After several tries (organic solvents washing,
extractions and precipitation) the purification procedure described in the previous chapter
(p. 71 section 2.2.2) was perfected, and pure MC2 (78) was obtained with a yield of 33.5%.
The NMR spectrum is reported in Figure 3.4, together with peak assignments. The
numbers and letters on the spectra refer to the molecule above. Protons 2 and 3 still appear
to be equivalent, despite expectation. This phenomenon is discussed below (p. 89)
a)
Figure 3.4 a) 1H NMR spectrum of MC2 in DMSO.
0.51.52.53.54.55.56.57.58.59.5f1 (ppm)
-100
0
100
200
300
400
500
600
700
800
900
1000
1100
10.90
7.16
3.26
3.22
3.00
6.82
3.35
2.73
1
2-3
6 H2O
DMSO
4
7
8 5
9 10
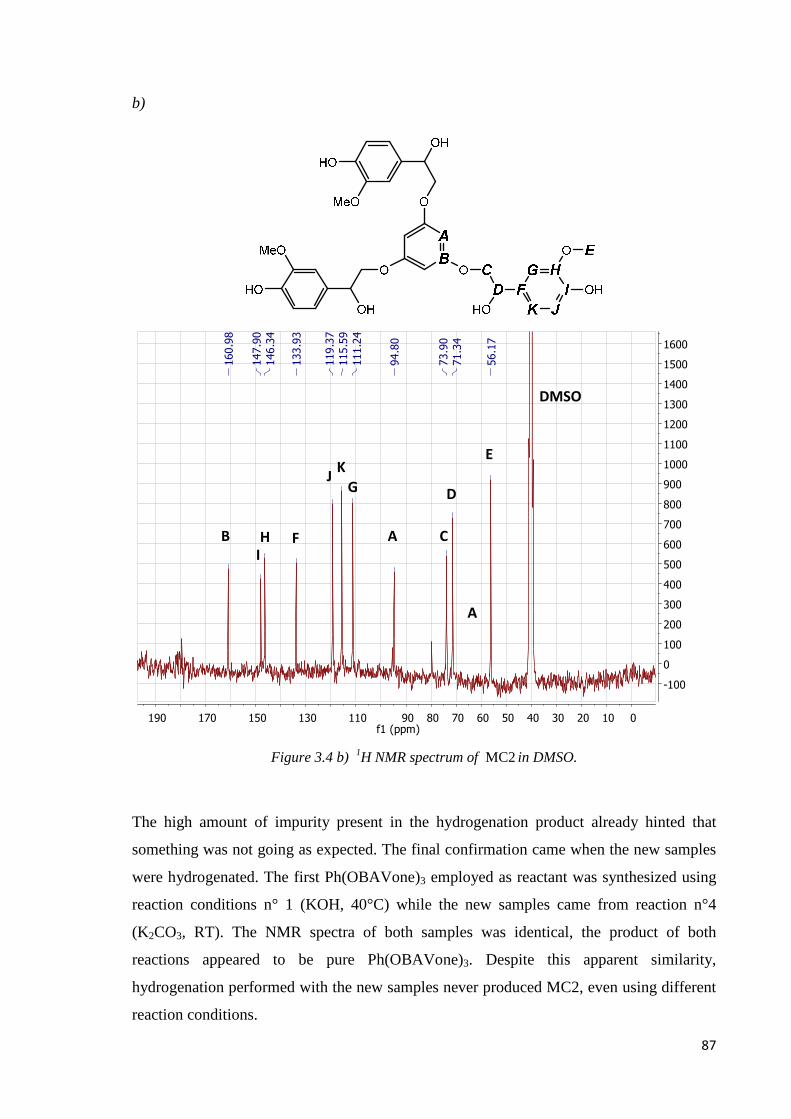
87
b)
Figure 3.4 b) 1H NMR spectrum of MC2 in DMSO.
The high amount of impurity present in the hydrogenation product already hinted that
something was not going as expected. The final confirmation came when the new samples
were hydrogenated. The first Ph(OBAVone)3 employed as reactant was synthesized using
reaction conditions n° 1 (KOH, 40°C) while the new samples came from reaction n°4
(K2CO3, RT). The NMR spectra of both samples was identical, the product of both
reactions appeared to be pure Ph(OBAVone)3. Despite this apparent similarity,
hydrogenation performed with the new samples never produced MC2, even using different
reaction conditions.
0102030405060708090110130150170190f1 (ppm)
-100
0
100
200
300
400
500
600
700
800
900
1000
1100
1200
1300
1400
1500
1600
56.17
71.34
73.90
94.80
111.24
115.59
119.37
133.93
146.34
147.90
160.98
A B
D
C
A
E
I
H F
J K
G
DMSO
88
MC2 synthesis: misinterpretation
The data provided by hydrogenation of the K2CO3 synthesized solid, led us to formulate a
hypothesis. Unfortunately, it has not been confirmed experimentally for lack of time. We
believe that Ph(OBAVone)3(77), the target molecule of the nucleophilic substitution step,
is mostly found in the liquid fraction, together with other impurities in significant amount.
During the reaction, a fraction of Ph(OBAVone)3 is trapped in the solid phase. The
structure of the solid phase is unknown, but it is most likely an insoluble polymer.
Apparently, the other impurities present in the liquid phase are not trapped in the solid
phase. The difference between K2CO3 and KOH reactions is Ph(OBAVone)3
concentration. In the first, a high amount of solid polymer is produced, which traps the low
quantity of Ph(OBAVone)3 present in solution. In the second, the small amount of solid
produced is saturated with the target molecule. The NMR spectra of the two compounds
are identical; since the solid is insoluble, the only thing that gets analyzed is the
Ph(OBAVone)3 trapped inside. When the product is hydrogenated, the difference becomes
clear. In the KOH case, Ph(OBAVone)3 is present in high concentration in the solid
(hypothesis: 40%). During hydrogenation both the solid polymer and Ph(OBAVone)3 react,
yielding MC2 (78) and the aliphatic impurities as product. MC2 can be then purified and
gathered. In the K2CO3 case, the concentration of Ph(OBAVone)3 is too low (hypothesis 1-
5%) and hydrogenation yields almost exclusively aliphatic impurities. This hypothesis fits
the experimental data, but it has to be proven experimentally. To resume:
1. nucleophilic substitution reaction (step 1) with both K2CO3 and KOH produces a
liquid and a solid fraction. The yields of the two fractions are considerably different
and most likely their composition as well.
2. Ph(OBAVone)3 appears to be present in the liquid fraction, but the purification is
complicated.
3. The NMR spectra of the solid fraction from both reactions are identical, and appear
to be pure Ph(OBAVone)3.
4. Hydrogenation reaction performed on the solid obtained from KOH reaction
produces MC2, hydrogenation on K2CO3 solid does not.
5. Our hypothesis is that the solid is an insoluble polymer, which somehow traps
Ph(OBAVone)3, and reacts with H2 to produce an aliphatic impurity.
89
Considerations
The target molecule MC2 (78) has been synthesized, which is a good result, but the overall
10% yield is a major drawback of this synthesis. Unfortunately most of the work devoted
to this synthesis was useless, because of the solid fraction data misinterpretation. Most
likely, there are many chances to significantly improve the reaction yield, once the correct
parameters will be optimized. To this end some preliminary experiments have been
performed. For example attempt n° 5 (Table 3.2 p.84), significantly increased the liquid
fraction yield. Reaction of Ph(OBAVone)3 (77) with even stronger bases might further
improve the process.
MC1 and MC2 comparison
The aim of this paragraph is to discuss an interesting difference between MC1 (75) and
MC2 (78), which should be, in principle, very similar. Figure 3.5 shows the H1 spectra of
both compounds, between 3.5 and 4.5 ppm. The interested part of the molecule is nearly
identical in both molecules, and yet a difference in the two spectra is observable. The ≈0.2
ppm difference between the two samples can be explained by the different solvents, CDCl3
for MC1 and deuterated DMSO for MC2. The interesting part is the difference in the
resonance pattern of protons 4, 5 and 6 for MC1 and 2, 3 and 4 for MC2. MC1 behaves as
expected, the chiral center on carbon G makes the two protons on carbon F magnetically
different. Therefore, as expected, a doublet of doublets is present at 5 ppm, generated by
proton 6 coupling with the both proton 4 and 5. Three distinct signals are present at 4 ppm,
the one at lower ppm belongs to the methyl protons 9 and is not interesting. The two
remaining signals form a multiplet, consistent with two overlapping doublets of doublets.
Each proton, 4 and 5, couples with the other and with proton 6, theoretically producing 8
signals. The assignment is confirmed by 2D spectra. On the other hand, the spectrum
produced by MC2 is much simpler. Despite the presence of the same chiral center, on the
same carbon, protons 2 and 3 behave as magnetically equivalent. In fact only two doublets
are visible in the spectrum, one at 4.7 ppm and one of double intensity at 3.8 ppm. They
are originated by the single proton 4 and the two equivalent protons 2 and 3, coupling with
each other.
It is possible that some steric effects are responsible for this anomaly, but we don’t have
any convincing explanation for this phenomenon. Only another unusual behavior displayed
by those molecules can be offered. Methylresorcinol (72) H1 spectrum shows only 3 peaks,
one for the two alcoholic groups, one for the three methyl protons and one for the three
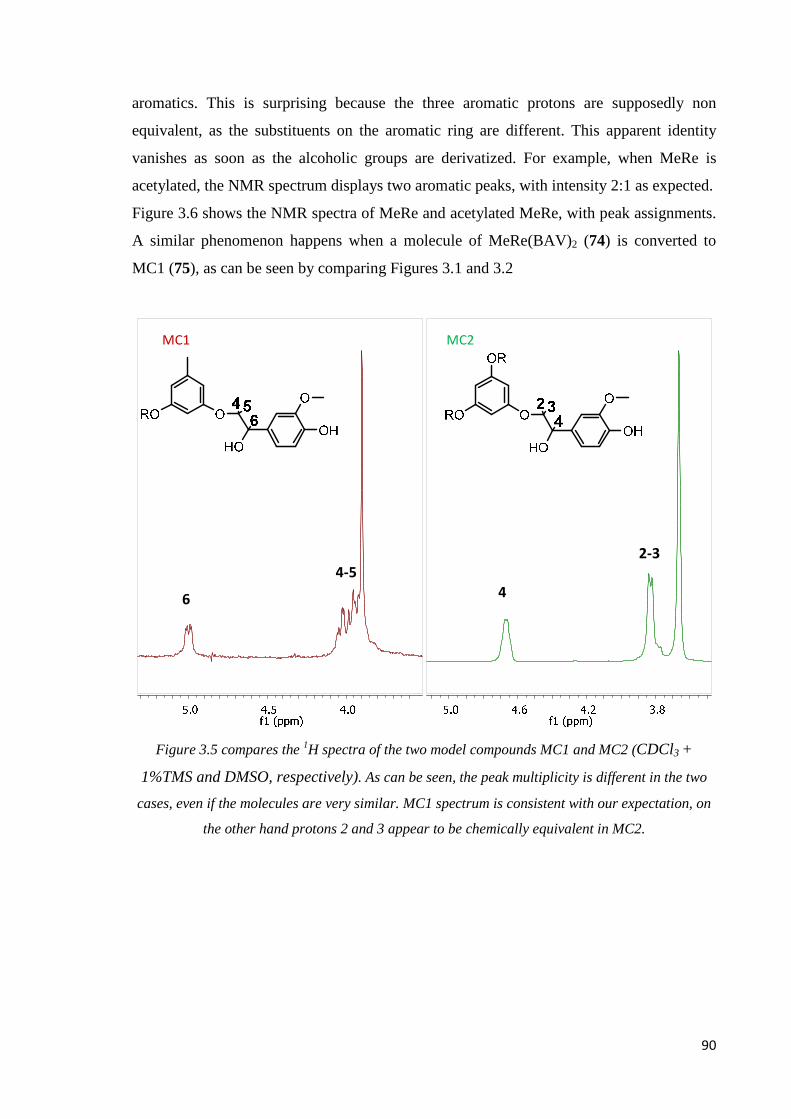
90
aromatics. This is surprising because the three aromatic protons are supposedly non
equivalent, as the substituents on the aromatic ring are different. This apparent identity
vanishes as soon as the alcoholic groups are derivatized. For example, when MeRe is
acetylated, the NMR spectrum displays two aromatic peaks, with intensity 2:1 as expected.
Figure 3.6 shows the NMR spectra of MeRe and acetylated MeRe, with peak assignments.
A similar phenomenon happens when a molecule of MeRe(BAV)2 (74) is converted to
MC1 (75), as can be seen by comparing Figures 3.1 and 3.2
Figure 3.5 compares the 1H spectra of the two model compounds MC1 and MC2 (CDCl3 +
1%TMS and DMSO, respectively). As can be seen, the peak multiplicity is different in the two
cases, even if the molecules are very similar. MC1 spectrum is consistent with our expectation, on
the other hand protons 2 and 3 appear to be chemically equivalent in MC2.
MC2 MC1
4-5
6
2-3
4
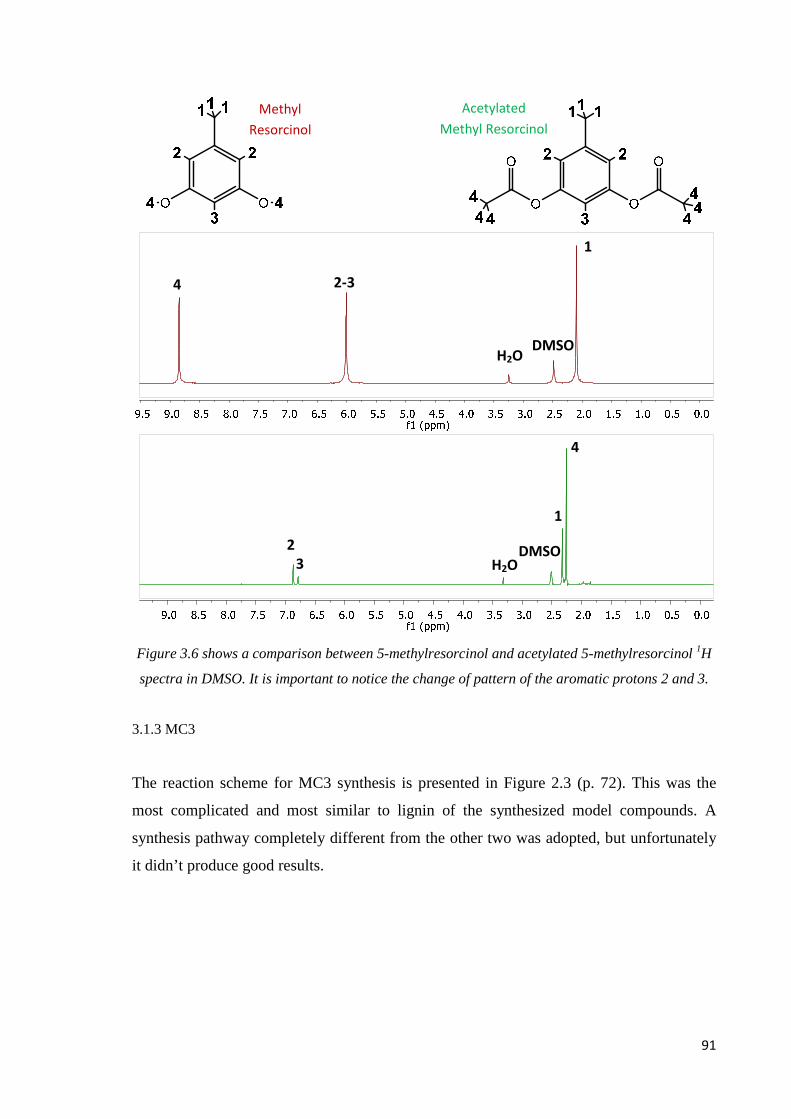
91
Figure 3.6 shows a comparison between 5-methylresorcinol and acetylated 5-methylresorcinol 1H
spectra in DMSO. It is important to notice the change of pattern of the aromatic protons 2 and 3.
3.1.3 MC3
The reaction scheme for MC3 synthesis is presented in Figure 2.3 (p. 72). This was the
most complicated and most similar to lignin of the synthesized model compounds. A
synthesis pathway completely different from the other two was adopted, but unfortunately
it didn’t produce good results.
Methyl
Resorcinol
Acetylated
Methyl Resorcinol
4
1
2-3
4
1
2
3
DMSO
H2O
H2O
DMSO

92
Benzyl vanillin synthesis
There is not much to say about this synthesis. As reported in the Experimental chapter (p.
73 section 2.2.3) an optimized procedure for the process was available. All the benzyl
vanillin (79) required for the project was synthesized in a single attempt, without problems.
The overall yield was 79.2%.
Step 1: nucleophilic substitution
The first step of this reaction did not present any particular problem. The reaction was
performed since the first attempt as described in the previous chapter (p. 73 section 2.2.3).
The desired product, triester (83), was obtained with a yield of 46.8% on the best attempt.
The NMR spectrum is reported in Figure 3.7, together with peak assignments. The
numbers and letters present of the spectra refer to the molecule above.
a)
Figure 3.7 a) 1H NMR spectrum of triester in CDCl3+1%TMS.
0.00.51.01.52.02.53.03.54.04.55.05.56.06.57.0f1 (ppm)
-10
0
10
20
30
40
50
60
70
80
90
100
9.00
6.27
5.71
2.69
1
2
3
4
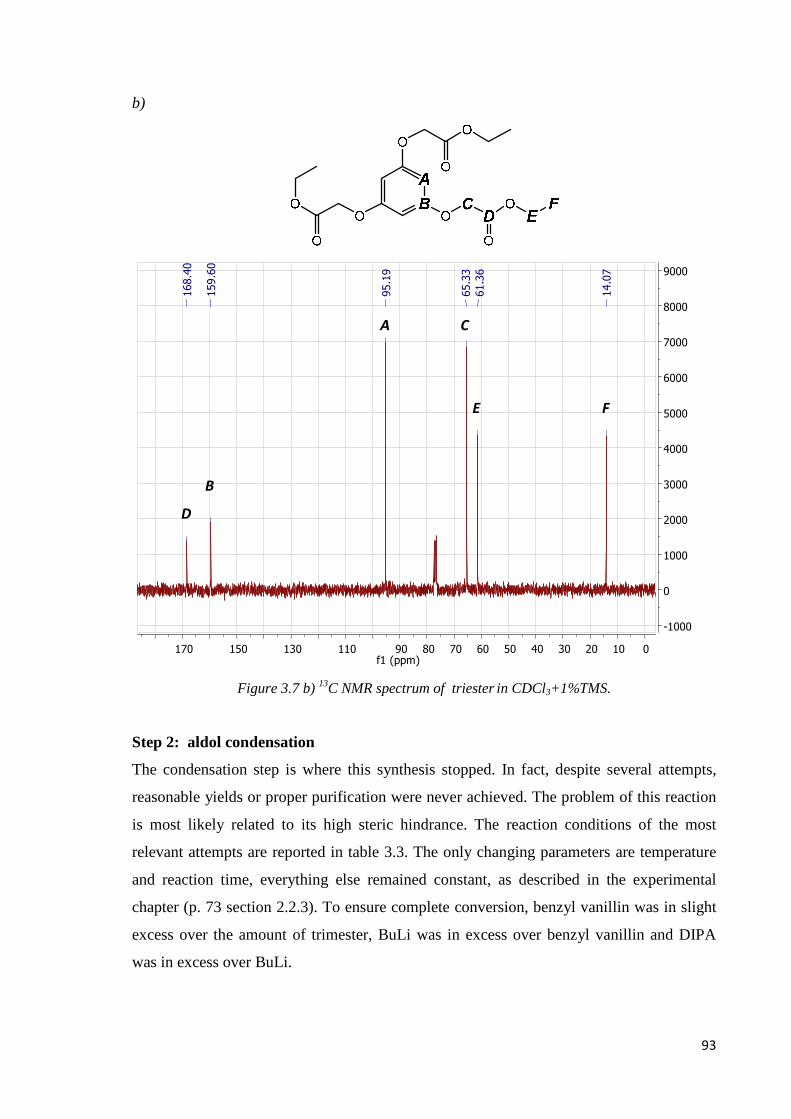
93
b)
Figure 3.7 b) 13C NMR spectrum of triester in CDCl3+1%TMS.
Step 2: aldol condensation
The condensation step is where this synthesis stopped. In fact, despite several attempts,
reasonable yields or proper purification were never achieved. The problem of this reaction
is most likely related to its high steric hindrance. The reaction conditions of the most
relevant attempts are reported in table 3.3. The only changing parameters are temperature
and reaction time, everything else remained constant, as described in the experimental
chapter (p. 73 section 2.2.3). To ensure complete conversion, benzyl vanillin was in slight
excess over the amount of trimester, BuLi was in excess over benzyl vanillin and DIPA
was in excess over BuLi.
0102030405060708090110130150170f1 (ppm)
-1000
0
1000
2000
3000
4000
5000
6000
7000
8000
9000
14.07
61.36
65.33
95.19
159.60
168.40
A
B
D
C
E F
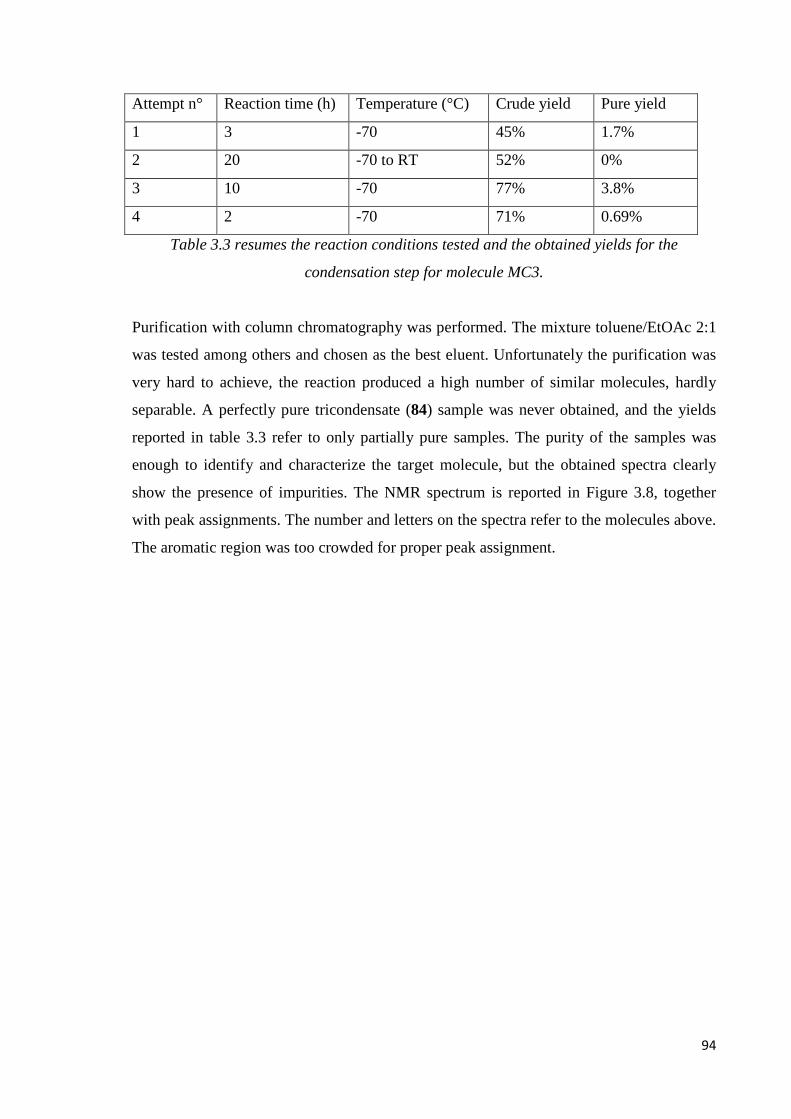
94
Attempt n° Reaction time (h) Temperature (°C) Crude yield Pure yield
1 3 -70 45% 1.7%
2 20 -70 to RT 52% 0%
3 10 -70 77% 3.8%
4 2 -70 71% 0.69%
Table 3.3 resumes the reaction conditions tested and the obtained yields for the
condensation step for molecule MC3.
Purification with column chromatography was performed. The mixture toluene/EtOAc 2:1
was tested among others and chosen as the best eluent. Unfortunately the purification was
very hard to achieve, the reaction produced a high number of similar molecules, hardly
separable. A perfectly pure tricondensate (84) sample was never obtained, and the yields
reported in table 3.3 refer to only partially pure samples. The purity of the samples was
enough to identify and characterize the target molecule, but the obtained spectra clearly
show the presence of impurities. The NMR spectrum is reported in Figure 3.8, together
with peak assignments. The number and letters on the spectra refer to the molecules above.
The aromatic region was too crowded for proper peak assignment.
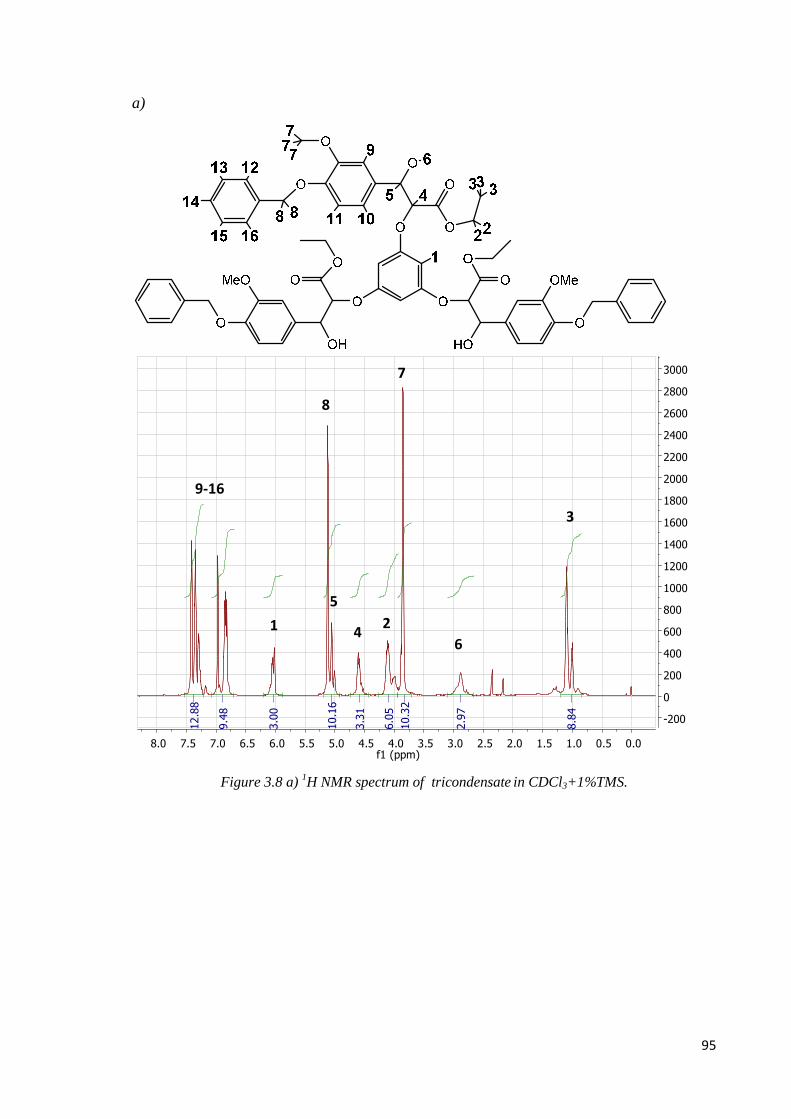
95
a)
Figure 3.8 a) 1H NMR spectrum of tricondensate in CDCl3+1%TMS.
0.00.51.01.52.02.53.03.54.04.55.05.56.06.57.07.58.0f1 (ppm)
-200
0
200
400
600
800
1000
1200
1400
1600
1800
2000
2200
2400
2600
2800
3000
8.84
2.97
10.32
6.05
3.31
10.16
3.00
9.48
12.88
1 2
3
4
9-16
8
7
6
5
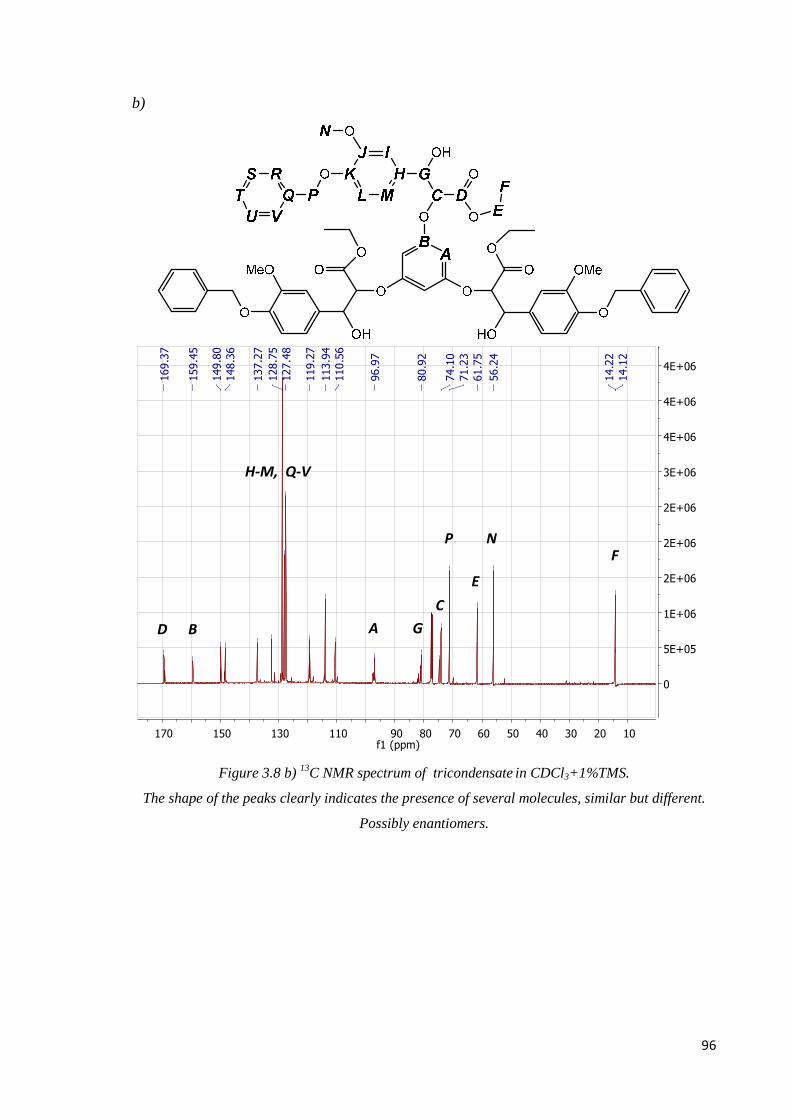
96
b)
Figure 3.8 b) 13C NMR spectrum of tricondensate in CDCl3+1%TMS.
The shape of the peaks clearly indicates the presence of several molecules, similar but different.
Possibly enantiomers.
102030405060708090110130150170f1 (ppm)
0
5E+05
1E+06
2E+06
2E+06
2E+06
3E+06
4E+06
4E+06
4E+06
14.12
14.22
56.24
61.75
71.23
74.10
80.92
96.97
110.56
113.94
119.27
127.48
128.75
137.27
148.36
149.80
159.45
169.37
H-M, Q-V
P N
F
E
G
C
D B A

97
As can be seen from table 3.3 the amount of product obtained was too low, and since this
synthetic route did not look promising, the synthesis has been abandoned. It is still possible
to draw some conclusion from the results obtained. Attempts to increase the yield by
increasing the temperature failed, as shown by attempt n° 2. After a couple of hours at -
70°C the reaction temperature was allowed to rise to RT, and the reaction left overnight.
This attempt did not generate the desired product, which suggests that the reaction has to
be left at -70°C for its entire course. By comparing attempts 1, 3 and 4, and considering the
amount of unreacted benzyl vanillin (79) found in each experiment, it is clear that the
reaction time is crucial for the reaction yield, but since the yield remained extremely low
even after 10h of reaction the process was considered too expensive and unproductive, and
the synthesis abandoned. It is to be said that with such low yields, the small amounts of
material involved and the hard purification, the data reported might not be accurate.
Considerations
The synthesis of MC3 (71) and its polymerization study were more or less the main
objective of our project in the beginning. The difficult synthesis convinced us to focus on
easier molecules first, and possibly return on MC3 later on. The synthesis of MC3 needs
to be improved, but it is hard to tell if it is better to optimize the reaction proposed or to try
new synthetic routes. For the first hypothesis, the most obvious attempt is to increase even
more the reaction time. To do that it would be necessary either to add dry ice to the ethanol
bath every few hours for days, or to find a better way to cool the system at -70°C. As a
more suitable alternative, a new synthetic route could be based on MC2 (78) synthesis.
Ph(OBAVone)3 (77) is the product of the first nucleophilic addition step, and could be
considered as the starting point of the new synthesis. The protons in α to the carbonyl are
reactive, and can be removed with a strong base. The carbanion could then be reacted with
protected chloromethanol, to introduce the missing methanol in the molecule. The only
difference between MC2 and MC3 is the extra carbon and hydroxyl group that could be
added with chloromethanol. Therefore, after reduction of the carbonyl and deprotection,
MC3 could be obtained. MC3 is the more similar to lignin of the three proposed model
compounds and it would be very important to test its reactivity during polymerization.
Future research might need to find a proper way to synthesize MC3, if the study of the
other molecules will give encouraging results.
98
3.1.4 CONCLUDING REMARKS
To summarize all what was accomplished in a few lines, the synthesis of two of the three
target lignin model compounds was accomplished. The synthesis of the first and easiest of
the molecules, MC1 (75), was achieved without major troubles and acceptable yield, only
one problem remains on a purification step. The second molecule, MC2 (78), was
obtained, purified and characterized. The reaction yield was too low to study MC2
polymerization, but a proper optimization will probably give good results. It is important to
mention that this was the first synthesized tridentate model compound for lignin. MC3 (71)
was the most complicated and similar to lignin of the proposed model compounds, and
unfortunately its synthesis was never achieved. A different synthetic route, compared to the
other two, was tested, but despite the several attempts, the purification after the
condensation step was never satisfactory. Some alternative routes to obtain MC3 have
been proposed, as well as some possible developments of future work.
3.2 Polymerization
The study of DHP polymerization was the initial purpose of our research. Coniferyl
alcohol (29) was polymerized in presence of another molecule, the lignin model
compound. The aim was to analyze the obtained DHP, in order to understand the effects of
the MC on coniferyl alcohol polymerization. Our hypothesis, proposed in the introduction
(p. 61 section 1.4.1), is that using a tridentate MC, the presence of coniferyl alcohol
“closed loops” in DHP will be increased. Hopefully it will be possible to identify and
measure them; and once this is accomplished, to detect their presence, or lack of it, also in
natural lignin. Positive results might be helpful for the understanding of the mechanisms of
lignin biosynthesis. On the more practical side, a working polymerization between our
MCs and coniferyl alcohol might have some useful applications. The starting aim of our
research was to perform CA polymerization with the three MCs described previously
(MC1 (75), MC2 (78), MC3 (71)). Unfortunately only MC1 was available for the
polymerization study, therefore MC1, 5-methylresorcinol (72) and phloroglucinol (76)
were used as central molecules (CMs). Even without using MC2 and MC3 as central
molecules, this study can lead to useful results. MeRe and Ph(OH)3 are the precursors of
our synthesized MCs and therefore they will provide useful information and background

99
for the future analysis of our model compounds. Even if their structure is not similar to
lignin, they will most likely couple with coniferyl alcohol. And since their geometry is the
same as the MCs, hopefully they will have similar effects on lignin polymerization.
Investigation of MeRe and Ph(OH)3 DHP has to be considered as a preliminary study for
the research on the synthesized MCs.
General considerations
Most of the time, the polymerization reaction yielded both a solid and a liquid fraction, the
heavy and light fraction of DHP, respectively. The light fraction was extracted from the
reaction mixture by an organic solvent, while the heavy one was simply filtered out and
washed. In order to obtain a closed loop, a good number of CA molecules have to be
connected to the CM, forming a molecule with a high Mw. Because of the increased
weight and the low solubility of our molecules, the product of interest is more likely found
in the heavy fraction. On the other hand, the first signs of the closed loops formation, i.e.
CM-CA cross-coupling product, will be found in the light fraction. It was decided to focus
on the light fraction for two reasons. The first is that we don’t know what kind of signal is
produced by the “closed loops”, the second is that the heavy fraction is more complicate to
analyze. The higher Mw of the heavy fraction causes both, a lower solubility and a lower
analysis resolution, especially for NMR. Analysis of a high Mw DHP sample produces a
low intensity and unresolved NMR spectrum. Starting the study from the light fraction is
the solution to both problems: the analysis is clearer and more interpretable, making it
easier to identify the traces of CM-CA cross-coupling. Using these traces as starting point
it will be possible to detect the “closed loops”. Analysis of the light fraction will provide
the background information necessary to analyze the heavy fraction and achieve our goal.
This is why the next paragraphs will be focused on light fraction analysis and CM-CA
cross coupling, even if the initial aim of this research was the discovery of “closed loops”.
In order to produce a wide NMR database and increase our chances to detect the unknown
signal of closed loops and CM-CA cross coupling, it was decided to proceed progressively,
by steps. Each CM was polymerized with gradually increasing amount of coniferyl
alcohol. As reported in table 3.4, each CM was first reacted without coniferyl alcohol, to
make a blank reference. Then the CMs were reacted with CA in a 1:1 ratio, followed by
a1:1 and 1:2 CM free alcohols/CA polymerization. Coniferyl alcohol without any CM was
polymerized to produce a normal DHP. This sample was then used as a reference for the
detection of CM-CA cross coupling. Interactions between CMs and CA are different from

100
CA-CA interaction, and produce a distinct signal in the 13C NMR spectrum. After analysis
of the blank DHP spectra and assignment of as many peak as possible, the normal DHP
spectra were matched against the CM DHP’s ones, looking for differences. Those
differences were then further studied, to understand if they are originated by interactions
between CM and CA. Our research was based on NMR and SEC analysis, the two
available methods most suited for the kind of work. SEC provides immediate and simple
information about the samples mass, while NMR provided more precise structural
information. Some of the heavy fractions were not analyzed by SEC for solubility issues.
HPLC was performed on most of the samples, but when used for simple comparison its
results were similar to SEC’s. Of course if HPLC was used as a separation technique, and
each fraction analyzed, it would provide much more useful information, but this research is
at a too early stage to justify such a long procedure. It is better to rely on simpler analysis
until more encouraging results are found. Table 3.4 resumes the performed experiments,
together with some relevant information.
3.2.1 CONIFERYL ALCOHOL
As said before, the pure coniferyl alcohol DHP, synthesized without CM, is the base for
our data interpretation. It will be analyzed in detail. A polymerization of 200mg of
coniferyl alcohol (29) yielded 33 mg of heavy and 83 mg of light fraction. The overall
yield, calculated using the reactant and product masses, is 58%, with the light and heavy
fractions yield being 41.5% and 16.5%, respectively. Those fractions were acetylated and
analyzed, according to the procedure described in the experimental chapter (p. 75)
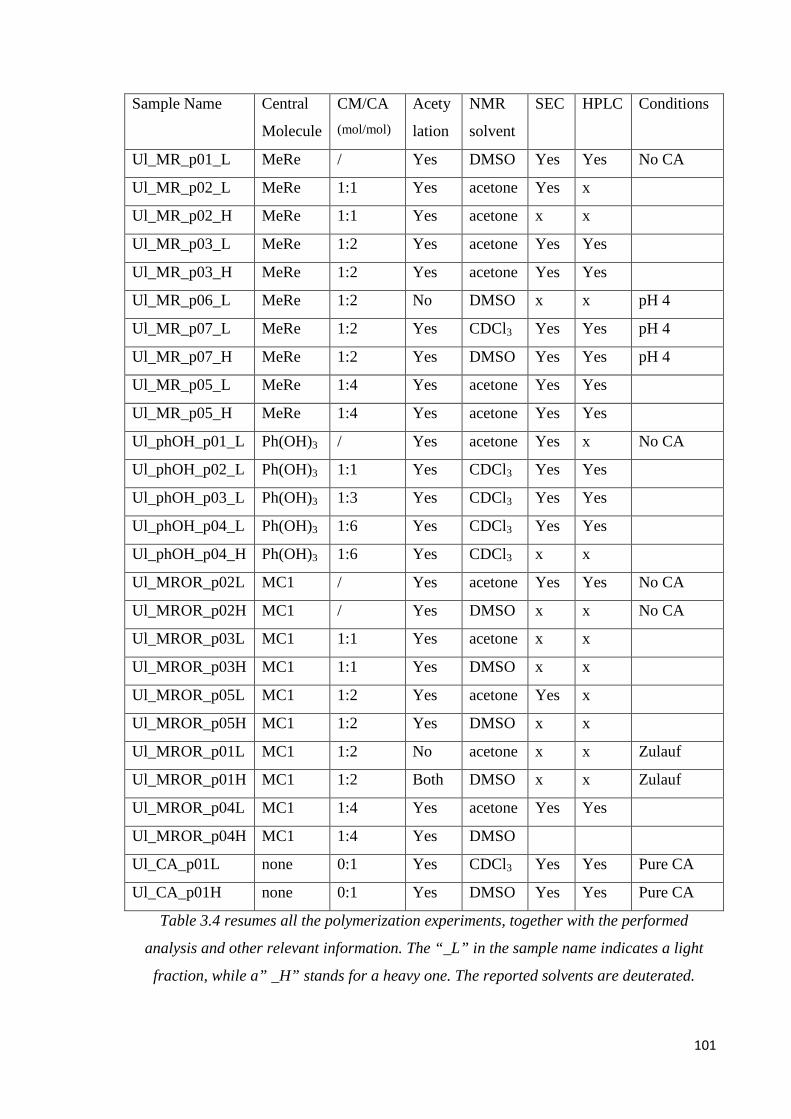
101
Sample Name Central
Molecule
CM/CA
(mol/mol)
Acety
lation
NMR
solvent
SEC HPLC Conditions
Ul_MR_p01_L MeRe / Yes DMSO Yes Yes No CA
Ul_MR_p02_L MeRe 1:1 Yes acetone Yes x
Ul_MR_p02_H MeRe 1:1 Yes acetone x x
Ul_MR_p03_L MeRe 1:2 Yes acetone Yes Yes
Ul_MR_p03_H MeRe 1:2 Yes acetone Yes Yes
Ul_MR_p06_L MeRe 1:2 No DMSO x x pH 4
Ul_MR_p07_L MeRe 1:2 Yes CDCl3 Yes Yes pH 4
Ul_MR_p07_H MeRe 1:2 Yes DMSO Yes Yes pH 4
Ul_MR_p05_L MeRe 1:4 Yes acetone Yes Yes
Ul_MR_p05_H MeRe 1:4 Yes acetone Yes Yes
Ul_phOH_p01_L Ph(OH)3 / Yes acetone Yes x No CA
Ul_phOH_p02_L Ph(OH)3 1:1 Yes CDCl3 Yes Yes
Ul_phOH_p03_L Ph(OH)3 1:3 Yes CDCl3 Yes Yes
Ul_phOH_p04_L Ph(OH)3 1:6 Yes CDCl3 Yes Yes
Ul_phOH_p04_H Ph(OH)3 1:6 Yes CDCl3 x x
Ul_MROR_p02L MC1 / Yes acetone Yes Yes No CA
Ul_MROR_p02H MC1 / Yes DMSO x x No CA
Ul_MROR_p03L MC1 1:1 Yes acetone x x
Ul_MROR_p03H MC1 1:1 Yes DMSO x x
Ul_MROR_p05L MC1 1:2 Yes acetone Yes x
Ul_MROR_p05H MC1 1:2 Yes DMSO x x
Ul_MROR_p01L MC1 1:2 No acetone x x Zulauf
Ul_MROR_p01H MC1 1:2 Both DMSO x x Zulauf
Ul_MROR_p04L MC1 1:4 Yes acetone Yes Yes
Ul_MROR_p04H MC1 1:4 Yes DMSO
Ul_CA_p01L none 0:1 Yes CDCl3 Yes Yes Pure CA
Ul_CA_p01H none 0:1 Yes DMSO Yes Yes Pure CA
Table 3.4 resumes all the polymerization experiments, together with the performed
analysis and other relevant information. The “_L” in the sample name indicates a light
fraction, while a” _H” stands for a heavy one. The reported solvents are deuterated.

102
SEC data analysis
Figure 3.9 shows the SEC chromatogram of the CA DHP light fraction. The features of the
chromatogram are not surprising, in fact the peaks at 28.7, 27.2 and 25.5 mL, are clearly
visible. They are sign of the presence of coniferyl alcohol dimer, trimer and tetramer
respectively. A small amount of free CA (29) is probably responsible for the peak at 29.8
mL. As SEC measures the hydrodynamic value of the molecules, the two shoulders 26.1
and 26.9 mL are probably caused by tetramers and trimers, respectively, with a different
shape or somehow differently diffused through the column. Finally the big blob between
22 and 25 mL is caused by the high Mw (>1000 g/mol) molecules, which are out of the
instrument’s range. At that point the molecules can no longer be properly separated, but
they still represent the weight distribution of the sample. As reported in the experimental
chapter (p. 66 section 2.1.2), SEC calibration was attempted using polystyrene as standard.
Unfortunately, not enough low Mw standards were available during the calibration, and the
calibration curve ended up being imprecise. Therefore the precise value of retention
volume is shown on the x axis of the chromatograms, instead of the unreliable Mw value.
In order to give a rough evaluation of the involved Mw, we report the series of expected
weights for CA polymerization. It is almost certain that the outcome of the performed
reaction is CA polymerization and the data collected from SEC, even without a proper
calibration, are consistent with this hypothesis. Therefore the proposed Mw values, which
correspond to CA dimer, trimer and tetramers, should be reliable enough to function as a
calibration. A coniferyl alcohol monomer weights 180 g/mol, when it couples with another
monomer the weight increases depending on the formed bond. When a water molecule
participates in the bond formation, as in a β-O-4 bonds (34), the weight increases of 196
g/mol. On the other hand, when two CA molecules react by themselves, the weight
increases by 178 g/mol, as in a β-5 bond (36). Even if quantitative experiments haven’t
been performed, it appears from the NMR analysis that β-O-4 is not so abundant.
Therefore the average of both values was used to calculate the Mw series, and the
monomer addition was considered to be 187 g/mol. Of course, this is a simplification of
the problem, but the values reported represent just a rough evaluation. The oligomer Mw
series was calculated and it is reported in table 3.5, together with the assumed
corresponding retention volume.
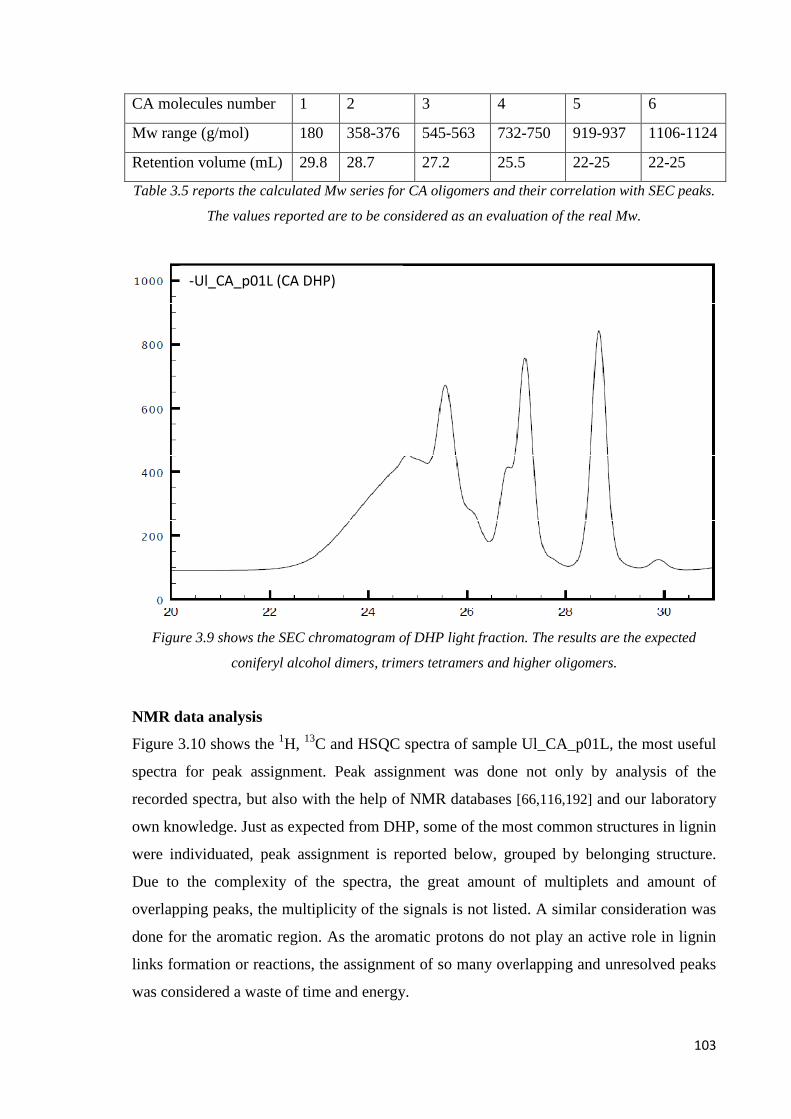
103
CA molecules number 1 2 3 4 5 6
Mw range (g/mol) 180 358-376 545-563 732-750 919-937 1106-1124
Retention volume (mL) 29.8 28.7 27.2 25.5 22-25 22-25
Table 3.5 reports the calculated Mw series for CA oligomers and their correlation with SEC peaks.
The values reported are to be considered as an evaluation of the real Mw.
Figure 3.9 shows the SEC chromatogram of DHP light fraction. The results are the expected
coniferyl alcohol dimers, trimers tetramers and higher oligomers.
NMR data analysis
Figure 3.10 shows the 1H, 13C and HSQC spectra of sample Ul_CA_p01L, the most useful
spectra for peak assignment. Peak assignment was done not only by analysis of the
recorded spectra, but also with the help of NMR databases [66,116,192] and our laboratory
own knowledge. Just as expected from DHP, some of the most common structures in lignin
were individuated, peak assignment is reported below, grouped by belonging structure.
Due to the complexity of the spectra, the great amount of multiplets and amount of
overlapping peaks, the multiplicity of the signals is not listed. A similar consideration was
done for the aromatic region. As the aromatic protons do not play an active role in lignin
links formation or reactions, the assignment of so many overlapping and unresolved peaks
was considered a waste of time and energy.
-Ul_CA_p01L (CA DHP)

104
a)
b)
Figure 3.10 NMR spectra of CA DHP in CDCl3+1%TMS: a) 1H NMR b) 13C NMR
0102030405060708090110130150170190f1 (ppm)
-4000
-2000
0
2000
4000
6000
8000
10000
12000
14000
16000
18000
20000
22000
24000
26000
28000
30000
32000
34000

105
c)
Figure 3.10 c) HSQC spectrum of CA DHP in CDCl3+1%TMS:
α-O-4 β-5
- 1H NMR : δ=5.5 ppm Hα, δ= 3.75 ppm Hβ, δ=4.28/4.45 ppm Hγ
-13C NMR : δ=88.0 ppm Cα, δ= 50.47 PPM Cβ, δ= 65.15 ppm Cγ
β-β
- 1H NMR : δ=4.70 ppm Hα, δ=3.09 ppm Hβ, δ=3.91/4.25 ppm Hγ
- 13C NMR : δ=85.6 ppm Cα, δ=54.33 ppm Cβ, δ=71.85 ppm Cγ
β-O-4 α-O-4 trimer
-1H NMR : δ=4.68 ppm Hβ, δ=4.54/4.62 ppm Hγ
- 13C NMR : δ=82.0 ppm Cβ, δ=62.9 ppm Cγ
β-O-4 threo. Chirality was assigned based on previous study.
-1H NMR : δ= 6.09 ppm Hα, δ= 4.63 ppm Hβ, δ= 4.04 (HSQC visible)/ ≈4.3 ppm Hγ
- 13C NMR : δ=73.53 ppm Cα, δ=80.3 ppm Cβ, δ= 62.9 ppm Cγ
106
Free coniferyl alcohol propanoid end (unlinked/unreacted)
-1H NMR : δ= 6.60 ppm Hα, δ= 6.15 ppm Hβ, δ=4.71 ppm Hγ
- 13C NMR : δ= 133.7 Cα, δ= 121.22 Cβ, δ=65.32 ppm Cγ
Other relevant peaks
-metoxy groups: 1Hδ= 3.6-3.9 ppm, 13Cδ = 55.6
-methyl: 1Hδ = 2.4-1.9 ppm, 13Cδ= 20.9
-aromatics: 1 Hδ= 6.5-7.3 ppm, 13Cδ= 109-150
-carbonyl: 13Cδ= 170 ppm
-chloroform: 1Hδ= 7.25 ppm, 13Cδ= 77.0 ppm
This list includes most of the peaks present in the three proposed spectra. It is important to
notice that the synthesized DHP is not very similar to lignin. Even if some of lignin’s
typical structures are present, many other are absent and the relative amount of each
linkage is very different from in vivo lignin. Just to name a few examples, there is no trace
of dibenzodioxocin rings (38) and β-O-4 (34) is present in low quantity. The obtained DHP
is a satisfactory model for lignin for the current analysis.
Comparison strategy
Before moving on to the CM DHP data analysis, it is important to explain how the data
was interpreted. Comparison of two SEC spectra is pretty straight forward, using one as a
reference is it fairly easy to spot extra or missing peaks. Peaks shift was considered at first,
but the Mw values obtained from calibration and the relation between Mw and retention
volume are too unreliable too rely on this phenomenon. On the other hand, NMR was more
complicated. In fact, due to the low solubility of the molecules, the solvent had to be
changed for some of the samples. The different solvent causes some minor changes in the
chemical shifts. Another problem is the great number of overlapping peaks. It is
impossible to notice a difference between two spectra in the methyl or methoxy group
region (1Hδ = 2.4-1.9 ppm, 1Hδ= 3.6-3.9 ppm). There are simply too many peaks, without
a specific and fixed pattern, since the synthesis reaction is statistical. The same problem is
present in the aromatic region, with the addiction of the central molecule. Whether the CM
interacts with CA or not, it is still present in the reaction mixture and produces a signal,
which needs to be taken into account. The CM signals are usually detectable, but in the
aromatic region, where they overlap with all the CA (29) peaks, things can get
107
complicated. Mostly 13C spectra were used for comparison, in order to overcome, or at
least minimize, the resolution problem. The region between 60 and 100 ppm was analyzed
with particular care. In this area are located all the carbons of CA propanoid chain, which
are the most reactive and the ones most likely involved in bonds formation.
3.2.2 METHYLRESORCINOL
Table 3.6 summarizes the mass yields of light and heavy fractions obtained from the 5-
methylresorcinol (72) experiments.
Sample name CM/CA
(mol/mol)
Yield
(%)
Light fraction
yield (%)
Heavy fraction
yield (%)
Ul_MR_p01 1:0 130 130 0
Ul_MR_p02 1:1 63.93 50.44 13.49
Ul_MR_p03 1:2 73.89 63.57 10.32
Ul_MR_p06 (pH 4) 1:2 67.67 66.17 1.49
Ul_MR_p05 1:4 64.98 59.56 5.41
Table 3.6 resumes the yield obtained in the polymerization experiments using 5-methylresorcinol
as a central molecule
The yield measured for sample Ul_MR_p01 is unreliable, most likely because not all the
solvent was properly evaporated. This problem was encountered in every experiment
without coniferyl alcohol, as can be seen in table 3.7 and 3.8 (pp. 113,117) from samples
Ul_MROR_p02 and Ul_phOH_p01. The heavy fraction yield decreases with the CM/CA
ratio. Changing the pH dramatically drops the yield of the solid fraction. Even without
considering the heavy fraction data, MeRe experiments produced a high amount of spectra,
too many to be individually discussed here. Therefore it was decided first to match each
MeRe spectrum against the others, to see if they are all similar, and only after to compare
one of them with the CA DHP analyzed above.

108
Methylresorcinol, internal comparison
Figure 3.11 shows the SEC runs of every MeRe (72) experiment. All runs appear to be
similar, each chromatogram shows the same peaks without relevant shifts, even if with
different ratios and intensities. As expected, these data suggests that the different reaction
conditions did not strongly affect the outcome. The predictable result is that increasing the
amount of CA (29) does not produce new bonds, but just increases the amount of the
present structures.
Figure 3.11 compares all the SEC runs obtained from the 5-methylresorcinol experiments. The
only remarkable differences are in peak intensity, but all the peaks are always present and in the
same position. This is a good indication that all the samples are very similar.
-Ul_MR_p05L (1:4)
-Ul_MR_p03L (1:2)
-Ul_MR_p07L (1:2, pH 4)
-Ul_MR_p02L (1:1)
-Ul_MR_p01 (no CA)
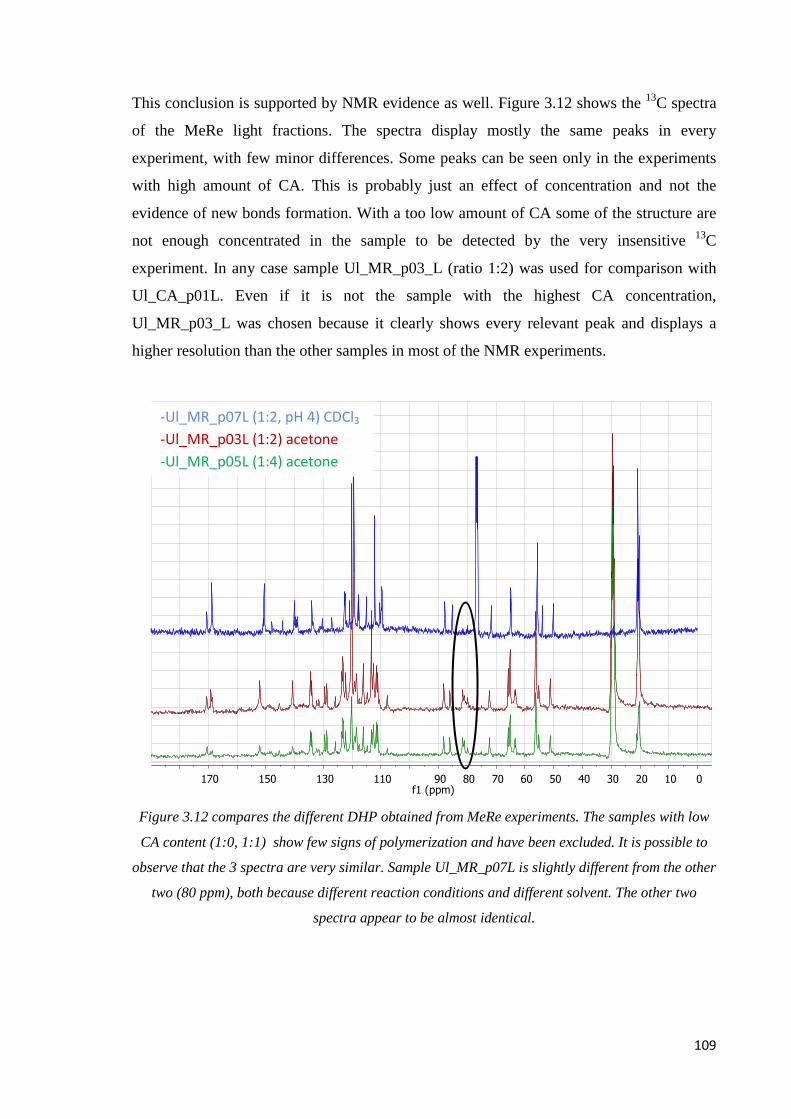
109
This conclusion is supported by NMR evidence as well. Figure 3.12 shows the 13C spectra
of the MeRe light fractions. The spectra display mostly the same peaks in every
experiment, with few minor differences. Some peaks can be seen only in the experiments
with high amount of CA. This is probably just an effect of concentration and not the
evidence of new bonds formation. With a too low amount of CA some of the structure are
not enough concentrated in the sample to be detected by the very insensitive 13C
experiment. In any case sample Ul_MR_p03_L (ratio 1:2) was used for comparison with
Ul_CA_p01L. Even if it is not the sample with the highest CA concentration,
Ul_MR_p03_L was chosen because it clearly shows every relevant peak and displays a
higher resolution than the other samples in most of the NMR experiments.
Figure 3.12 compares the different DHP obtained from MeRe experiments. The samples with low
CA content (1:0, 1:1) show few signs of polymerization and have been excluded. It is possible to
observe that the 3 spectra are very similar. Sample Ul_MR_p07L is slightly different from the other
two (80 ppm), both because different reaction conditions and different solvent. The other two
spectra appear to be almost identical.
0102030405060708090110130150170f1 (ppm)
-Ul_MR_p07L (1:2, pH 4) CDCl3
-Ul_MR_p03L (1:2) acetone
-Ul_MR_p05L (1:4) acetone

110
Methylresorcinol, CA DHP comparison
Ul_MR_p03_L, representative of every MeRe (72) experiment, and Ul_CA_p01L, our
DHP reference, are compared here. Figure 3.13 shows the SEC chromatograms of the two
samples. The two spectra appear to be quite similar, as expected, but with some relevant
differences: a peak at 29.2 mL and another at 26.3 mL. It is also remarkable the difference
in intensity of the peak at 28.7. The first peak at 29.2 mL is most likely caused by the
unreacted CM, as shown by the CA free sample Ul_MR_p01_L. On the other hand, the
peak at 26.3 mL is probably caused by a CM-CA compound. The decrease in intensity of
the CA dimer peak (29.2 mL) could also point in the direction of a reaction involving CA.
Figure 3.13 compares the SEC chromatogram of regular DHP and MeRe DHP. There are
some relevant differences, first of all an extra peak at 26.2 mL, which could be the sign of
CM-CA coupling.
-Ul_CA_p01 (CA DHP)
-Ul_MR_p03L (1:2)

111
Figure 3.14 compares the relevant NMR spectra, in particular 1H, 13C, and HSQC. Even if
the spectra look fairly different there are two important considerations to be done. The first
is the difference in solvent. Ul_CA_p01L is recorded in CDCl3, while Ul_MR_p03_L was
dissolved in acetone (d6). It is therefore necessary to ignore the solvent peaks when
comparing the two spectra, and take into account a little chemical shift difference for some
peaks. The second big difference, resolution, is caused by the equipment employed to
record the spectra, 500 MHz for the CA DHP and 300 MHz for the MeRe DHP. Most of
the differences in peak shape are just an effect of low resolution.
Comparison of the two 1H spectra reveals few differences if the peak positions are
considered instead of peak shapes, and the few visible extra peaks do not belong to CM-
CA product. The differences in the methyl and aromatic region (2 and 7 ppm) are caused
by the different solvents and by the central molecule. The two small peaks at 1 ppm,
present in both samples, belong to some non influent impurity. Finally, the extra peak at
2.6 ppm might appear promising, but it is just another acetylated alcohol, as suggested by
the HSQC spectrum. The peak positions between 3 and 6.5 ppm appear well matched, but
even if an extra peak was present it would be impossible to notice it because of the low
resolution. The overall analysis of the 1H spectrum is inconclusive, as expected. In the 13C
spectra four remarkable differences are found, three of them in the aromatic region.
Compared to the CA DHP, sample Ul_MR_p03_L displays two extra peaks at 120 and 108
ppm, together with a difference in the peak at 113 ppm. The extra peaks at 120 and 113 are
explainable by the presence of 5-methylresorcinol, as can be seen in Figure 3.14. On the
other hand, the origin of the peak at 108 ppm is unknown. The resolution of the HSQC
spectrum is too low to enable investigation of the overcrowded aromatic area. Finally, the
last difference between the two spectra is a small extra peak at 65.8 ppm. This is exactly
the region where evidence of a CA-CM link was expected. Unluckily, the origins of this
peak cannot be further investigated, because of the HSQC spectrum bad resolution. In fact
many peaks of γ carbons overlap in that area, and it is hard to tell which proton signal
correlates with our extra peak. Few others minor differences are present in the spectra
(small ppm shifts or peak shaper difference), but the HSQC spectrum does not show
anything out of place in the corresponding positions.
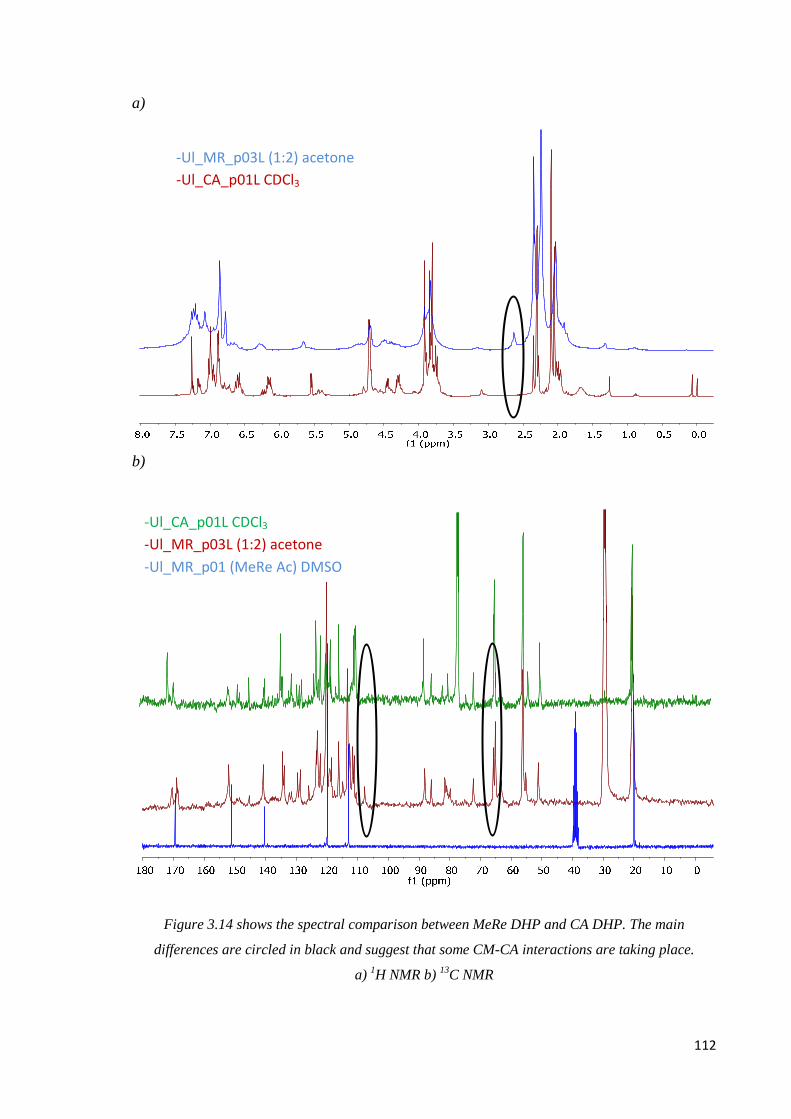
112
a)
b)
Figure 3.14 shows the spectral comparison between MeRe DHP and CA DHP. The main
differences are circled in black and suggest that some CM-CA interactions are taking place.
a) 1H NMR b) 13C NMR
-Ul_MR_p03L (1:2) acetone
-Ul_CA_p01L CDCl3
-Ul_CA_p01L CDCl3
-Ul_MR_p03L (1:2) acetone
-Ul_MR_p01 (MeRe Ac) DMSO
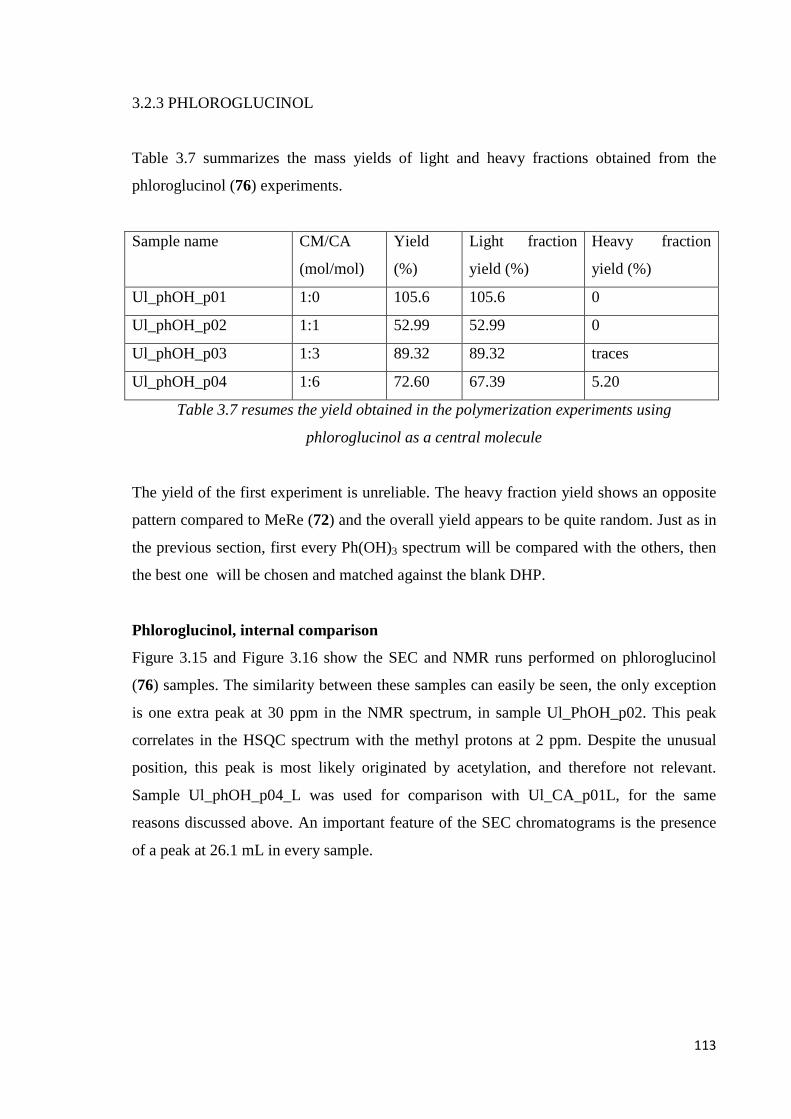
113
3.2.3 PHLOROGLUCINOL
Table 3.7 summarizes the mass yields of light and heavy fractions obtained from the
phloroglucinol (76) experiments.
Sample name CM/CA
(mol/mol)
Yield
(%)
Light fraction
yield (%)
Heavy fraction
yield (%)
Ul_phOH_p01 1:0 105.6 105.6 0
Ul_phOH_p02 1:1 52.99 52.99 0
Ul_phOH_p03 1:3 89.32 89.32 traces
Ul_phOH_p04 1:6 72.60 67.39 5.20
Table 3.7 resumes the yield obtained in the polymerization experiments using
phloroglucinol as a central molecule
The yield of the first experiment is unreliable. The heavy fraction yield shows an opposite
pattern compared to MeRe (72) and the overall yield appears to be quite random. Just as in
the previous section, first every Ph(OH)3 spectrum will be compared with the others, then
the best one will be chosen and matched against the blank DHP.
Phloroglucinol, internal comparison
Figure 3.15 and Figure 3.16 show the SEC and NMR runs performed on phloroglucinol
(76) samples. The similarity between these samples can easily be seen, the only exception
is one extra peak at 30 ppm in the NMR spectrum, in sample Ul_PhOH_p02. This peak
correlates in the HSQC spectrum with the methyl protons at 2 ppm. Despite the unusual
position, this peak is most likely originated by acetylation, and therefore not relevant.
Sample Ul_phOH_p04_L was used for comparison with Ul_CA_p01L, for the same
reasons discussed above. An important feature of the SEC chromatograms is the presence
of a peak at 26.1 mL in every sample.
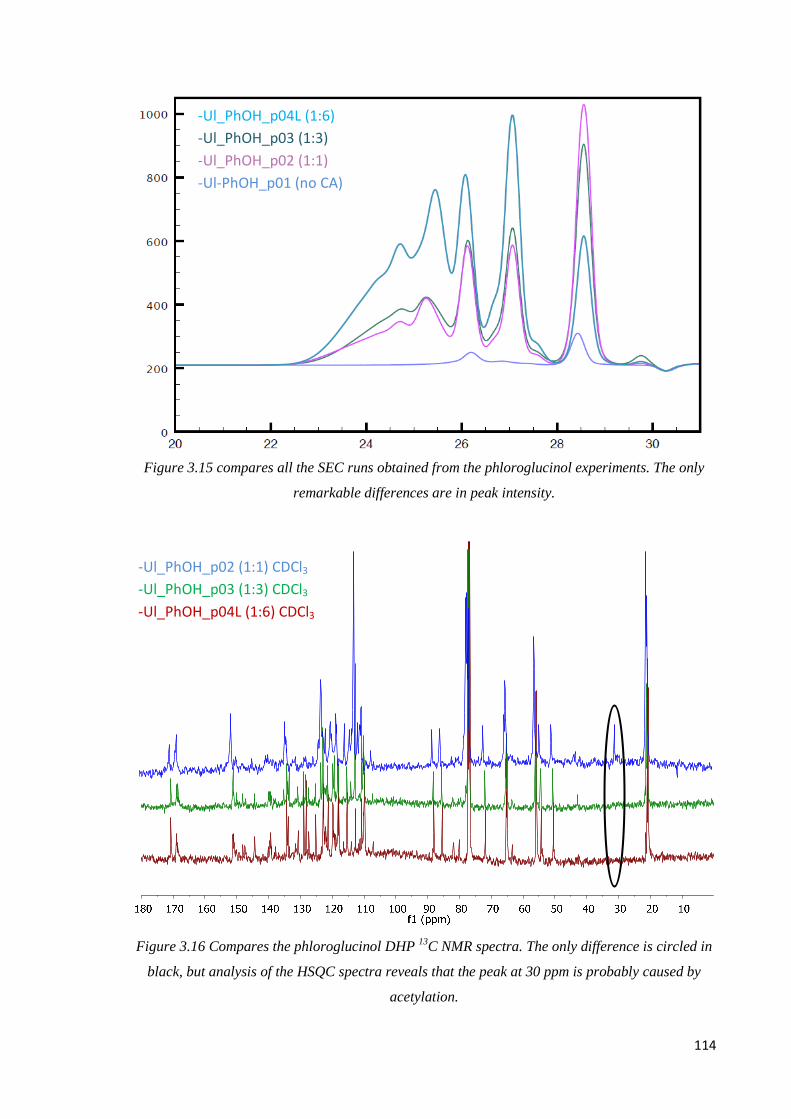
114
Figure 3.15 compares all the SEC runs obtained from the phloroglucinol experiments. The only
remarkable differences are in peak intensity.
Figure 3.16 Compares the phloroglucinol DHP 13C NMR spectra. The only difference is circled in
black, but analysis of the HSQC spectra reveals that the peak at 30 ppm is probably caused by
acetylation.
-Ul_PhOH_p02 (1:1) CDCl3
-Ul_PhOH_p03 (1:3) CDCl3
-Ul_PhOH_p04L (1:6) CDCl3
-Ul_PhOH_p04L (1:6)
-Ul_PhOH_p03 (1:3)
-Ul_PhOH_p02 (1:1)
-Ul-PhOH_p01 (no CA)

115
Phloroglucinol, CA DHP comparison
Figure 3.17 compares the SEC chromatogram of samples Ul_phOH_p04_L and
Ul_CA_p01L, the only noticeable difference is the peak at 26.1 mL and its origin is
uncertain. On one side, the presence of the same peak in the CA free experiment is a hint
that this peak should not be considered. On the other hand, the peak intensity increases
with the amount of CA (29), which is possibly a proof of CA involvement. Also the
position of the peak (26.1 mL, similar to the assumed CA-MeRe cross coupling product)
points in the same direction. Finally, a retention volume of 26.1 mL is too low for a simple
acetylated Ph(OH)3, the peak might belong to a dimer or formed by other side reactions,
but there is no evidence of it in the NMR.
Figure 3.17 compares the SEC chromatogram of regular DHP and Ph(OH)3 DHP. The
origin of the peak at 26.1 mL is uncertain.
As the SEC data cannot provide a clear answer, it is important to analyze the relevant
NMR spectra, shown in Figure 3.18.
-Ul_PhOH_p04L (1:6)
-Ul_CA_p01 (CA DHP)
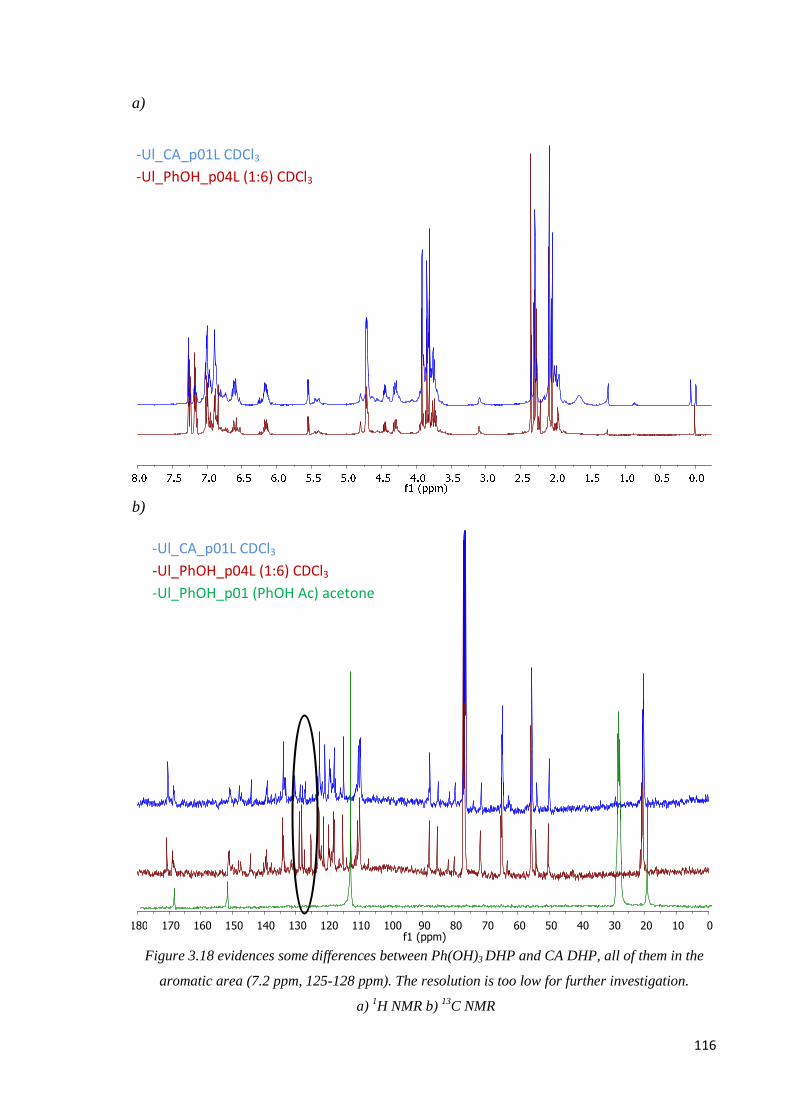
116
a)
b)
Figure 3.18 evidences some differences between Ph(OH)3 DHP and CA DHP, all of them in the
aromatic area (7.2 ppm, 125-128 ppm). The resolution is too low for further investigation.
a) 1H NMR b) 13C NMR
0102030405060708090100110120130140150160170180f1 (ppm)
-Ul_CA_p01L CDCl3
-Ul_PhOH_p04L (1:6) CDCl3
-Ul_CA_p01L CDCl3
-Ul_PhOH_p04L (1:6) CDCl3
-Ul_PhOH_p01 (PhOH Ac) acetone
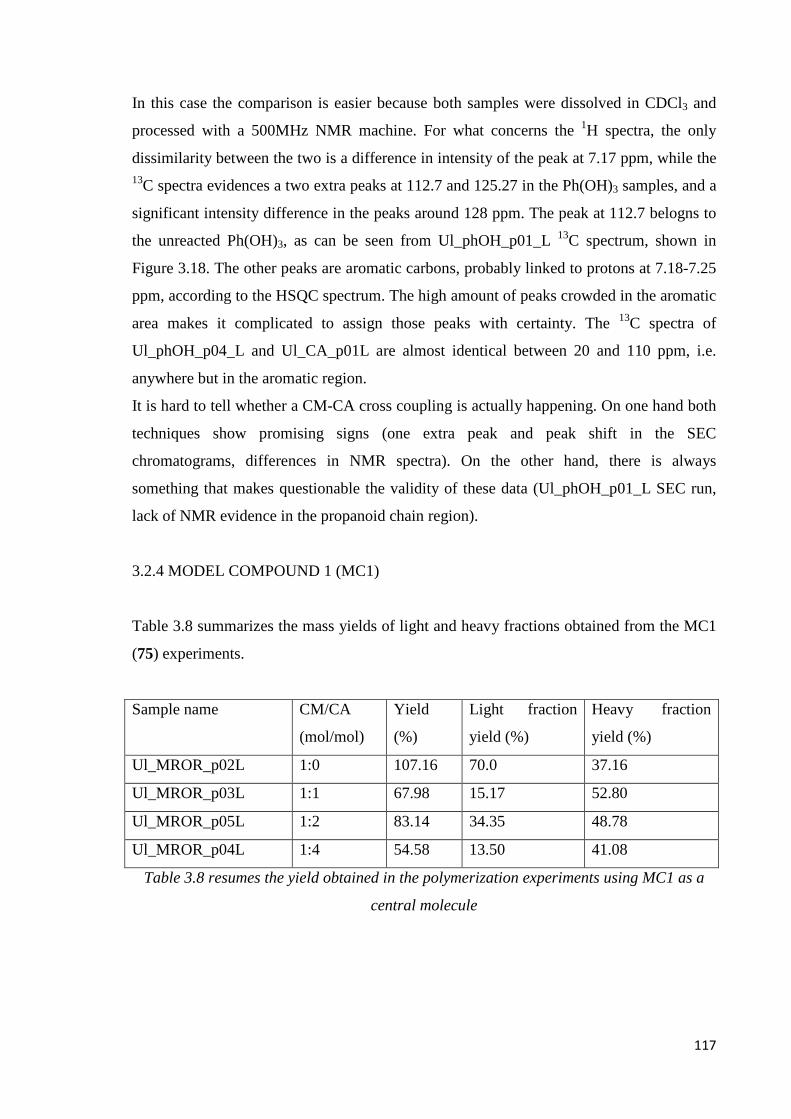
117
In this case the comparison is easier because both samples were dissolved in CDCl3 and
processed with a 500MHz NMR machine. For what concerns the 1H spectra, the only
dissimilarity between the two is a difference in intensity of the peak at 7.17 ppm, while the 13C spectra evidences a two extra peaks at 112.7 and 125.27 in the Ph(OH)3 samples, and a
significant intensity difference in the peaks around 128 ppm. The peak at 112.7 belogns to
the unreacted Ph(OH)3, as can be seen from Ul_phOH_p01_L 13C spectrum, shown in
Figure 3.18. The other peaks are aromatic carbons, probably linked to protons at 7.18-7.25
ppm, according to the HSQC spectrum. The high amount of peaks crowded in the aromatic
area makes it complicated to assign those peaks with certainty. The 13C spectra of
Ul_phOH_p04_L and Ul_CA_p01L are almost identical between 20 and 110 ppm, i.e.
anywhere but in the aromatic region.
It is hard to tell whether a CM-CA cross coupling is actually happening. On one hand both
techniques show promising signs (one extra peak and peak shift in the SEC
chromatograms, differences in NMR spectra). On the other hand, there is always
something that makes questionable the validity of these data (Ul_phOH_p01_L SEC run,
lack of NMR evidence in the propanoid chain region).
3.2.4 MODEL COMPOUND 1 (MC1)
Table 3.8 summarizes the mass yields of light and heavy fractions obtained from the MC1
(75) experiments.
Sample name CM/CA
(mol/mol)
Yield
(%)
Light fraction
yield (%)
Heavy fraction
yield (%)
Ul_MROR_p02L 1:0 107.16 70.0 37.16
Ul_MROR_p03L 1:1 67.98 15.17 52.80
Ul_MROR_p05L 1:2 83.14 34.35 48.78
Ul_MROR_p04L 1:4 54.58 13.50 41.08
Table 3.8 resumes the yield obtained in the polymerization experiments using MC1 as a
central molecule
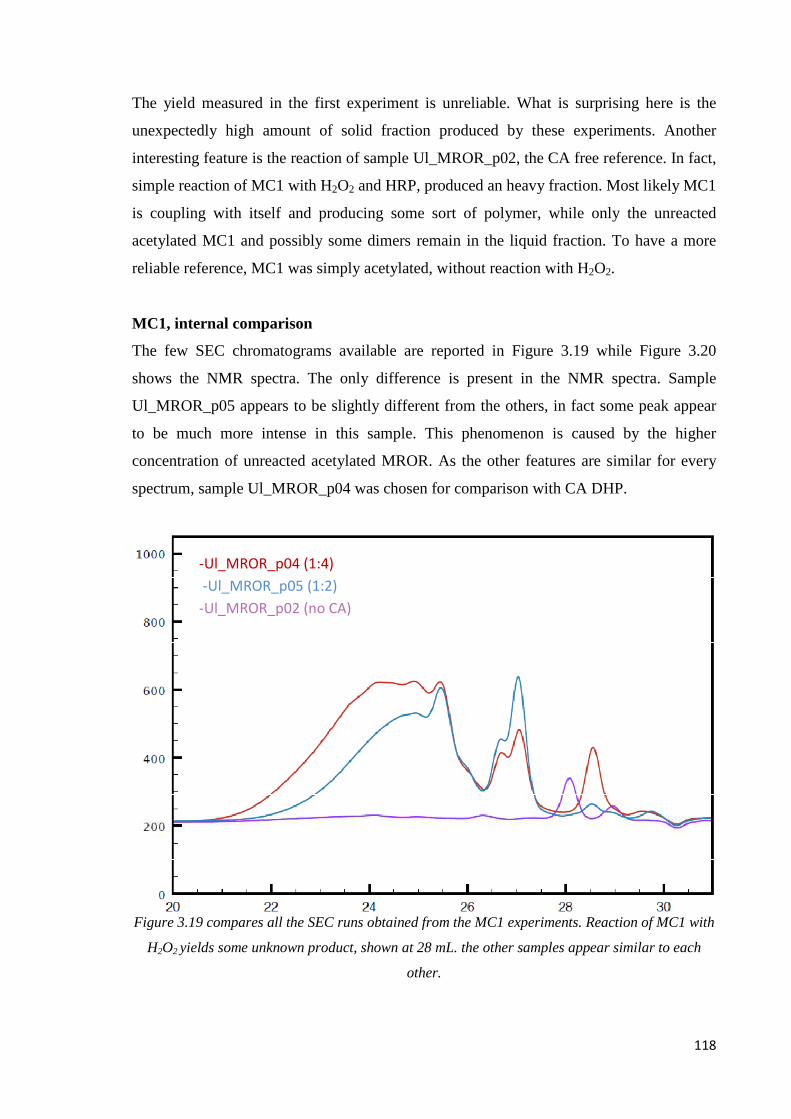
118
The yield measured in the first experiment is unreliable. What is surprising here is the
unexpectedly high amount of solid fraction produced by these experiments. Another
interesting feature is the reaction of sample Ul_MROR_p02, the CA free reference. In fact,
simple reaction of MC1 with H2O2 and HRP, produced an heavy fraction. Most likely MC1
is coupling with itself and producing some sort of polymer, while only the unreacted
acetylated MC1 and possibly some dimers remain in the liquid fraction. To have a more
reliable reference, MC1 was simply acetylated, without reaction with H2O2.
MC1, internal comparison
The few SEC chromatograms available are reported in Figure 3.19 while Figure 3.20
shows the NMR spectra. The only difference is present in the NMR spectra. Sample
Ul_MROR_p05 appears to be slightly different from the others, in fact some peak appear
to be much more intense in this sample. This phenomenon is caused by the higher
concentration of unreacted acetylated MROR. As the other features are similar for every
spectrum, sample Ul_MROR_p04 was chosen for comparison with CA DHP.
Figure 3.19 compares all the SEC runs obtained from the MC1 experiments. Reaction of MC1 with
H2O2 yields some unknown product, shown at 28 mL. the other samples appear similar to each
other.
-Ul_MROR_p04 (1:4)
-Ul_MROR_p05 (1:2)
-Ul_MROR_p02 (no CA)
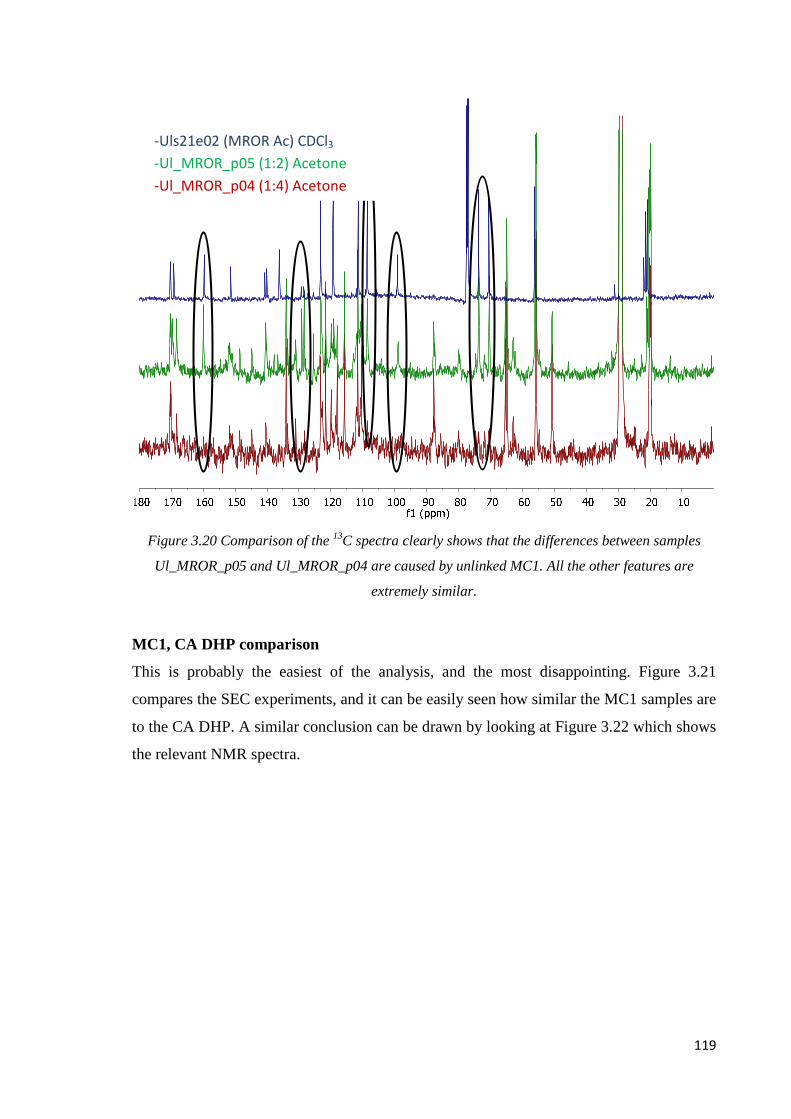
119
Figure 3.20 Comparison of the 13C spectra clearly shows that the differences between samples
Ul_MROR_p05 and Ul_MROR_p04 are caused by unlinked MC1. All the other features are
extremely similar.
MC1, CA DHP comparison
This is probably the easiest of the analysis, and the most disappointing. Figure 3.21
compares the SEC experiments, and it can be easily seen how similar the MC1 samples are
to the CA DHP. A similar conclusion can be drawn by looking at Figure 3.22 which shows
the relevant NMR spectra.
-Uls21e02 (MROR Ac) CDCl3
-Ul_MROR_p05 (1:2) Acetone
-Ul_MROR_p04 (1:4) Acetone
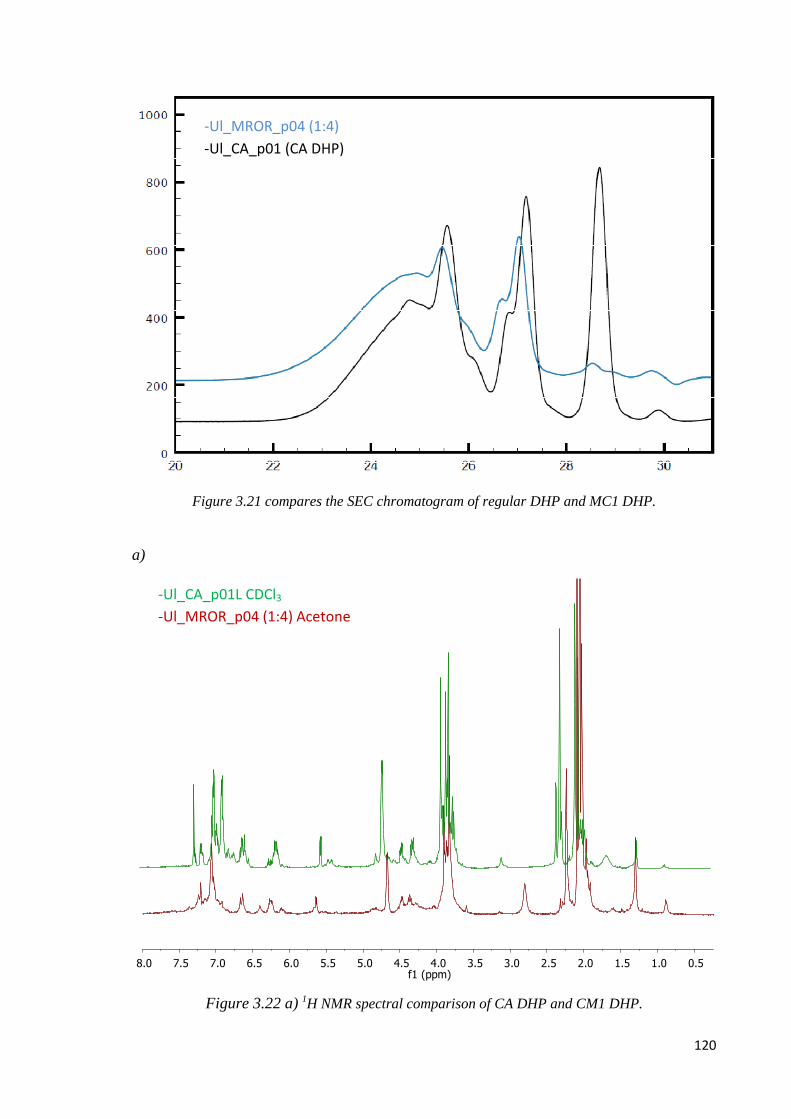
120
Figure 3.21 compares the SEC chromatogram of regular DHP and MC1 DHP.
a)
Figure 3.22 a) 1H NMR spectral comparison of CA DHP and CM1 DHP.
0.51.01.52.02.53.03.54.04.55.05.56.06.57.07.58.0f1 (ppm)
-Ul_CA_p01L CDCl3
-Ul_MROR_p04 (1:4) Acetone
-Ul_MROR_p04 (1:4)
-Ul_CA_p01 (CA DHP)
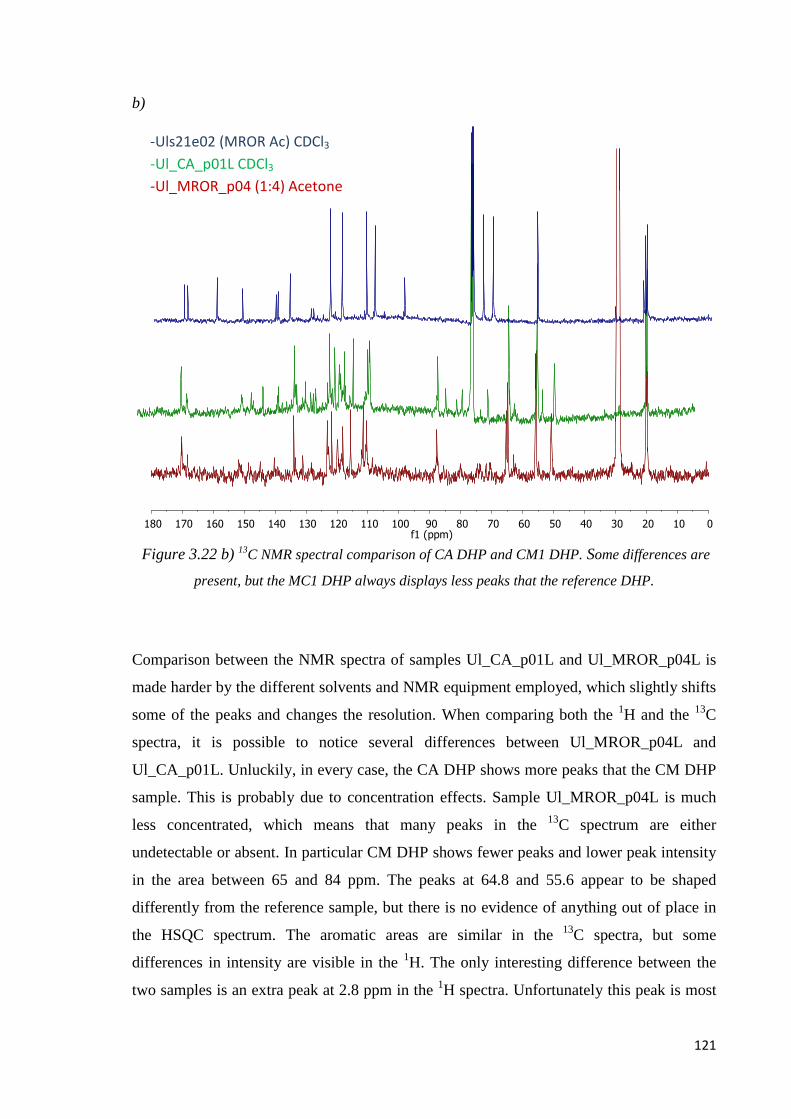
121
b)
Figure 3.22 b) 13C NMR spectral comparison of CA DHP and CM1 DHP. Some differences are
present, but the MC1 DHP always displays less peaks that the reference DHP.
Comparison between the NMR spectra of samples Ul_CA_p01L and Ul_MROR_p04L is
made harder by the different solvents and NMR equipment employed, which slightly shifts
some of the peaks and changes the resolution. When comparing both the 1H and the 13C
spectra, it is possible to notice several differences between Ul_MROR_p04L and
Ul_CA_p01L. Unluckily, in every case, the CA DHP shows more peaks that the CM DHP
sample. This is probably due to concentration effects. Sample Ul_MROR_p04L is much
less concentrated, which means that many peaks in the 13C spectrum are either
undetectable or absent. In particular CM DHP shows fewer peaks and lower peak intensity
in the area between 65 and 84 ppm. The peaks at 64.8 and 55.6 appear to be shaped
differently from the reference sample, but there is no evidence of anything out of place in
the HSQC spectrum. The aromatic areas are similar in the 13C spectra, but some
differences in intensity are visible in the 1H. The only interesting difference between the
two samples is an extra peak at 2.8 ppm in the 1H spectra. Unfortunately this peak is most
0102030405060708090100110120130140150160170180f1 (ppm)
-Uls21e02 (MROR Ac) CDCl3
-Ul_CA_p01L CDCl3
-Ul_MROR_p04 (1:4) Acetone

122
likely caused by water impurity, as it doesn’t correlate to any carbon in the HSQC
spectrum. The NMR and SEC data combined suggest that no cross coupling is happening
in the light fraction of these experiments. Due to the high yield of the heavy fraction it is
possible that some more interesting features could be discovered there, but a more
complete understanding of the reaction and of the NMR spectra is needed before it will be
possible to properly investigate it.
3.2.5 CONCLUDING REMARKS
To analyze the huge amount of data produced by the polymerization experiments, it was
decided to proceed by comparison. A pure coniferyl alcohol DHP was synthesized, using
the same reaction condition as every other polymerization. Then it was thoroughly
analyzed and most of the peaks were assigned. Finally, this CA DHP was used as a
reference to analyze the DHP synthesized in presence of a central molecule. This way it
was possible to simply look for differences instead of reassigning every peak each time.
Different results were obtained with the three central molecules. Experiments with MeRe
(72) were pretty satisfactory, both SEC and NMR evidence support the presence of a CM-
CA product. Unfortunately the resolution of our analysis was not enough to get a definitive
proof. The situation is different for the DHP obtained with phloroglucinol (76). The data
suggest that something is happening, an extra peak is definitely present in the SEC run and
some relevant differences are visible in the NMR spectra. Because of some contradiction in
the obtained data, it is uncertain whether these features are produced by CM-CA cross
coupling or by some other side reaction. Finally, MC1 (75) was the central molecule on
which rested the highest expectations and turned out to be the most disappointing.
Apparently both SEC and NMR indicate that our CM and CA are not interacting. The only
hope is the high amount of heavy fraction produced, a different behavior compared with
the other experiments. It is possible that cross coupling between CM3 (the heavier of the
CMs) and CA produces an insoluble molecule, but for now it is only speculation. Only the
light fractions were examined during this study, because of the technical problems
connected with analyzing the heavy insoluble part of DHP. As the study of these molecules
is just beginning, we decided to focus on something that could be handled and treated
properly, instead of going in over our heads with unknown and hardly analyzable samples.
Only with a proper purification strategy or a specific analysis method it will be possible to
accomplish something in the study of the heavy fractions, but it will be possible to do it
123
only once the light fractions are better understood and with the help of a more complete
NMR database.
Finally it is necessary to discuss the polymerization yields. In the previous paragraphs
only a little time was devoted to this topic, because a valid hypothesis which could explain
their behavior was not found. The overall yield appears to behave very randomly, with
some relation with the central molecule or the amount of CA (29). The light or heavy
fractions show some signs of a pattern, but really vague and hardly identifiable. They
appear to be definitely connected to the central molecule, but it is hard to tell why or how,
and they do not seem to be dependent on anything else. The most logical explanation for
this phenomenon is a poor experimental procedure. The small amount of matter involved,
the low solubility and stickiness of the heavy fraction made the complete recovery of the
products complicate, and therefore the yield data less reliable. This is probably the main
reason behind the random yield values obtained and therefore the data was used with
caution.
124
4 Conclusions It is hard to write a proper conclusion for this thesis, because many things changed from
the beginning to the end of the work. Objectives and expectations, results and goals have
been reconsidered along the way. The conclusion usually answers to the questions posed in
the beginning, but it is impossible to do it here. Every initial question is still without an
answer, this research only produced some preliminary results.
4.1 Summary
Every result has already been presented, resumed and discussed. They will just be
summarized in here once more.
The aim of the work was to synthesize three new model compounds for lignin, MC1 (75),
MC2 (78) and MC3 (71). Once synthesized, they were to be used as central molecules to
start coniferyl alcohol (29) polymerization, to produce DHP. The aim was to investigate
how the presence of these CMs would influence DHP growth, specifically if it would
generate a closed ring, formed by the junction of two polymer growing chain.
Identification and characterization of the closed loops could help understanding the growth
mechanism of natural lignin.
4.1.1 SYNTHESIS
The synthesis of the proposed model compounds yielded different degrees of success:
1. MC1 (75) was successfully synthesized with an overall yield of 35%. The
performances of the reaction could be greatly improved by optimizing the
recrystallization purification step.
2. MC2 (78) was synthesized, purified and characterized, but with a yield too low to
be employed in further experiments. Because of data misinterpretation most of the
optimization work conducted on this reaction was useless. Therefore, some work
performed in the right direction would most likely improve this reaction’s
performances.

125
3. MC3 (71) was never synthesized. Probably because of steric hindrance, the
condensation step of the reaction never worked properly and the reaction was
abandoned. Some alternative reaction routes have been proposed.
More details and a deeper discussion are found in the appropriate sections.
4.1.2 POLYMERIZATION
Because of the troubles encountered in the synthesis of MC2 (78) and MC3 (71), the initial
plans had to be changed. It was decided to use MeRe (72), Ph(OH)3 (76) and MC1 (75) as
central molecules for DHP polymerization instead. Most of the experiments produced both
a soluble and insoluble fraction of DHP (light and heavy). Because of the technical
difficulties connected to the heavy fraction, only the light fraction was considered and
analyzed in this study. Due to the complexity of the collected data, the purpose of the work
became looking for signs of CM-CA cross coupling more than evidence of “closed loops”.
The results obtained by the polymerizations depend on the employed central molecule:
1. MeRe DHP (CM1 DHP) showed encouraging results. Both NMR and SEC data
support the existence of CM1-CA cross coupling, but the low resolution of the
NMR spectra does not allow further investigation.
2. Ph(OH)3 DHP (CM2 DHP) shows similar signs, but the data is a bit more
controversial. Some reaction other than CA coupling is surely happening during the
polymerization, it is hard to tell whether it is CM2-CA cross coupling or some
other side reaction.
3. MC1 DHP (CM3 DHP) is the least interesting. No signs of cross coupling appear in
the light fraction, but the high yield of the heavy fraction might be a hint that some
reaction is taking place there.

126
4.2 A Preliminary Work
Since the beginning of the project it was not clear what kind of signal the closed loops
would produce, or how to detect and analyze them. There was so much work to be done
before the polymerization experiments could even be started, that detection of the closed
loops was not a great concern. It was uncertain whether a viable model compound could be
synthesized, the initial plan was just to try some polymerization experiments and see what
happened. In the end, detection of the closed loops was an objective too ambitious for the
time at our disposal, and the aims of the project stopped at the cross coupling step. It is
important to be sure that the model compound and CA interact together, before analyzing
what the interaction produces. Moreover, the detection of cross coupling and the
identification of the related peaks is the first step to detect the more complex structures of
the closed loops.
It is possible that our project was too ambitious in the first place, that even in the best
condition it would require more time than available, but the lack of the expected results
was also caused by the unexpected problems that were faced. It is possible to divide the
obstacles encountered in this project between expected and unexpected. The lack of results
in MC3 condensation step was somehow expected. The high steric hindrance present in the
condensation step was an obvious obstacle from the start, even if it was unknown whether
it could be overcome or not. Another totally foreseeable difficulty was the low resolution
of the NMR spectra. Even without knowing what kind of signal the closed loops would
produce, it was predictable that the great number of peaks and the high Mw of the
molecules would complicate the work. On the other hand, the probably biggest problem of
the whole project was almost completely unforeseen. Because of the size of the molecules
involved, it was expected that solubility could cause some troubles. In hindsight, it is
obvious that the problem was deeply underestimated. Solubility, instead of being a minor
issue, ended up being a constant trouble. During the synthesis, each step required more
time than expected because the right solvent had to be found, and some of the molecules
were never completely soluble. This forced us to go to longer reaction times and harsher
condition than usually employed. Another synthesis problem was linked to the use of TLC,
it’s hard to properly follow a reaction when half of the reaction mixture is not soluble in
any eluent. The same problem is relevant for separation techniques, like chromatographic
columns, extractions and sometimes even recrystallization. Our work would have been
127
much easier if the heavy DHP fraction could have been dissolved and separated by HPLC.
The low solubility heavily influences the samples analysis as well. Probably the whole
MC2 misinterpretation (p. 88) wouldn’t have happened with a completely soluble sample,
and 13C NMR analysis would have been much faster and useful with higher amount of
product dissolved in the sample. Solving or finding a way around the solubility problem
will be a key step for the further development of this research.
4.3 Future Work
Most of the proposals for the future work will be a simple repetition of our initial aims.
This study has to be considered as a preliminary work, the gathering of the first data
necessary to achieve the initial goals. The search of the same results is just the natural
continuation of this project.
4.3.1 SYNTHESIS
The future prospects for the synthetic work have already been discussed in the results and
discussion chapter. For what concerns the proposed molecules MC1 (75), MC2 (78), and
MC3 (71) the results are encouraging and a little work would probably produce good
results. Most likely the employment of a stronger base in the synthesis of MC2 would be
enough to remarkably improve the reaction yield. A good result in MC2 synthesis would
also open new synthetic routes for MC3, as the two molecules are very similar and could
be synthesized from the same precursor. Further attempts could be made to optimize the
proposed synthesis of MC3. The extension of the reaction time for the condensation step
looks like the most promising direction to investigate. A completely new option could be
to synthesize different model compounds, always tridentate to maintain the purpose of the
research, but with different structures and based on other synthetic routes. One option
could be to synthesize dibenzodioxocine rings or 4-O-5 bonds based molecules, and use
them as central molecules for DHP polymerization. These naturally occurring unit linkages
are natural branching points in in vivo lignin, and are exactly what our model compounds
try to emulate. Once a proper synthetic pathway is found, it should be possible to mark or
functionalize them in order to have distinguishable central molecules. Any tridentate
molecule which cross couples with CA, in principle, could be a suitable model compound

128
for this research. The synthesis of these molecules would not only be relevant for this
study: each tridentate model compound which positively interacts with CA could also be
tested for DHP thin layers growth. As already said, a DHP thin layer could be very
interesting from both a theoretical and an applicative point of view. Surface analysis of
DHP could produce very meaningful information about its growth, while its modification
could produce very useful materials, with tailored properties.
4.3.2 POLYMERIZATION
The purpose and goal of this research, instead of finding evidence for polymer chain loops,
as expected, ended up being looking only for sign of CM-CA cross coupling. This change
of goal caused some problems, because the experiments performed were designed for one
purpose and used for another. For the future, we propose to proceed in a different way.
Once a new CM will be ready for DHP polymerization, it is probably best to test its
reactivity to CA (29), and only then to proceed with the proper DHP polymerization.
This could be accomplished with two experiments, differently designed, each for its
purpose. During the first experiment, the CM in excess should be reacted with low
amounts of CA, very diluted and very slowly added to the reaction mixture. These reaction
conditions will maximize the CA-CM cross coupling and reduce the CA-CA coupling.
Analysis of the CM-CA product will provide a reference and a starting point for the second
polymerization experiment. This last should be performed with higher amounts of CA, in
order to detect the closed loops. After the first reaction, it would be immediately
understandable whether the tested molecule is worth the second step of the analysis or not.
If the CM doesn’t interact with CA, or if some other side reactions takes place, there will
be no need to continue with the long, time and resources consuming series of
polymerization experiments. With or without this procedure, future research will have to
focus on the heavy fraction of CM DHP, and therefore face the problems of solubility and
analysis resolution. The possibility to use other separation techniques, more reliable and
precise than SEC, should be seriously investigated. The chance to perform HPLC or MS on
both light and heavy samples could provide fundamental information. HPLC could
separate simple CA coupling products from our products of interest, allowing us to analyze
a purer sample. MS analysis of a pure sample could be precise enough to detect the
presence of loops in the molecule, as two separate polymer chains will have a different Mw
if they are linked together. Naturally, even a SEC experiment calibrated for higher Mw will

129
provide better information than the ones we gathered in this study. Another analytical tool
that could be employed is solid state NMR. Even if the heavy fraction is usually at least
partially soluble in DMSO, it is possible that this technique will produce more interesting
results that the regular liquid phase NMR. Most of these techniques are delicate, and can
produce results only under specific circumstances and conditions. It will be necessary to
test if the machine requirements can be fulfilled by the samples. Once again the main
obstacle will most likely be solubility.
Leaving the analytical problems aside, there is still much left to be done in the study of CM
DHP. Two of the three model compound that were to be tested still have to be tried, the
results produced by the MeRe (72) and Ph(OH)3 (76) run need to be further investigated
and maybe experiments with higher amounts of CA performed. There is a lot more to be
done, but before moving forward with anything, it would be necessary to decide a strategy
based on the information gathered by this study.

130
5 Acknowledgments
I would like to express my deepest gratitude to my supervisor prof. Sipilä and to my
advisor Dr. Nousiainen, who helped and tought me a lot during during this project. They
were present when I needed advise and they always supported me.
I would also like to thank the University of Helsinki, which hosted me during this project.
A special thank goes to everyone from the ASC program, who made this whole experience
possible. They are too many to be named, but they were always helpful and kind, no matter
how ridiculous my issue was.
Finally I have to thank everybody that helped me during the years of my Master. All the
friends that beared my constant complaining about how much I had to study, that gave my
useful advices during the lunch breaks or simply made my life much funnier during these
years of travelling. The list of names would be too long and I would defenetely end up
forgetting someone. You know me, I’m too absent-minded and lazy to write the list of all
of you. I am really gratefull for everything you gave me.
Now that I think of it, I should also thank my family, but this thesis is in english so they
probably won’t read it. Thank you guys, just in case, you know I love you.
131
6 References
1. Sheehan J, Cambreco V, Duffield J, Garboski M, Shapouri H. A report by US
Department of Agriculture and Energy, 1998. p. 1–35.
2. Türe S, Uzun D, Ture IE. Energy 1997;22: 17–9.
3. World Population Prospects: The 2012 Revision, Highlights and Advance Tables.
United Nations Department of Economic and Social Affairs/Population Division.
http://esa.un.org/wpp/Documentation/pdf/WPP2012_HIGHLIGHTS.pdf.
4. http://en.wikipedia.org/wiki/Biomass
5. Mc Kendry P. Biores Technol 2002;83: 37–46.
6. Bridgwater AV. Chem Eng J 2003;91: 87–102.
7. Huber GW, Iborra S, Corma A. Chem. Rev 2006;106: 4044– 4098.
8. Czernik S, Bridgwater AV. Energy Fuels 2004;18: 590 –598.
9. Putun A, Ozbay N, Putun E. Energy Sources Part A 2006;28: 253–62.
10. Suarez JA, Beaton PA, Zanzi R, Grimm A. Energy Sources Part A 2006;28: 695–
704.
11. Haryanto A, Fernando S, Murali N, Adhikari S. Energy Fuels 2005;19: 2098–2106.
12. Santos DCRM, Lisboa JS, Passos FB, Noronha FB. Braz J Chem Eng 2004;21:
203–9.
13. Demirbas A. Progress in Energy and Combustion Science 2007;33: 1–18.
14. Dong Y, Steinberg M. Int J Hydrogen Energy 1997;22: 971–7.
15. Rao VUS, Stiegel GJ, Cinquergrane GJ, Srivastava RD. Fuel Process Technol
1992;30: 83–107.
16. Dry ME. Appl Catal A 1999;189: 185–90.
17. Jun KW, Roh HS, Kim KS, Ryu JS, Lee KW. Appl Catal A 2004;259: 221–6.
18. Dry ME. J Chem Technol Biotechnol 2002;77: 43–50.
19. Van der Laan GP, Beenackers AACM. Catalysis Reviews: Science and
Engineering 1999;41: 255-318.
20. Lynd LR, Cushman JH, Nichols RJ, Wyman CE. Science 1991;251: 1318-1323
21. Demirbas A. Energy Conversion and Management 2009;50: 2239–2249
22. Sun Y, Cheng J. Bioresource Technology 2002;83: 1-11.
23. Manzer LE. Top Catal 2010;53: 1193–1196
24. Grassi G. Renew Energy 1999;16: 985–90.
132
25. Meher LC, Vidya Sagar D, Naik SN. Renew. Sust. Energy Rev. 2006;10: 248.
26. Gallezot P, Kiennemann A. In Ertl G, Knözinger H, Schuth F, Weitkamp J, eds,
Handbook of Heterogeneous Catalysis. Wiley 2008;11: 2447–2476.
27. Fukuda H, Kondo A, Noda H. J. Biosci. Bioeng. 2001; 92: 405
28. Schuchardt U, Vargas RM, Gelbard G. J. Mol. Catal. A: Chemical 1996; 109: 37.
29. R. Sercheli, R. M. Vargas, U. Schuchardt, J. Am. Oil Chem. Soc. 1999; 76: 1207.
30. Bournay L, Casenave D, Delfort B, Hillion G, Chodorge JA. Catal. Today 2005;
106: 190.
31. Hill J, Nelson E, Tilman D, Polasky S, Tiffany D. PNAS 2006;103: 11206–11210
32. Xi J, Ding D, Shao Y, Liu X, Lu G, Wang Y. ACS Sustainable Chem. Eng.
2014;10: 2355–2362.
33. Santhanaraj D, Rover MR, Resasco DE, Brown RC, Crossley S. ChemSusChem
2014;7: 3132–3137.
34. Perlack RD, Wright LL, Turhollow AF, Graham RL, Stokes BJ, Erbach DC.
Biomass as a feedstock for a bioenergy and bioproducts industry: the technical
feasibility of a billion-ton annual supply. USDA 2005.
http://feedstockreview.ornl.gov/pdf/billion_ton_vision.pdf
35. P. A. Jacobs, H. Hinnekens, EP 0 329 923 assigned to Synfina-Oleofina, 1989.
36. Heinen AW, Peter JA, van Bekkum H. Carbohydr. Res. 2001;330: 381.
37. Ribeiro ML, Schuchardt U. Catal. Commun. 2003;4: 83.
38. Bruggink A, Schoevaart R, Kieboom T. Org. Proc. Res. Dev.2003; 622/ Schoevaart
R, Kieboom T. Top. Catal. 2004; 27: 3.
39. Guidotti M, Ravasio N, Psaro R, Gianotti E, Marchese L, Coluccia S. Green
Chemistry 2003;5: 421.
40. Rios LA, Weckes P, Schuster H, Hölderich WF. J. Catal. 2005;232: 19.
41. Hölderich WF, Rios LA, Werke PP, Schuster H. J. Synthetic Lubrication 2004;20:
289.
42. Otto RT, Scheib H, Bornscheuer UT, Pleiss J, Syldatk C, Schmid RD. J. Mol.
Catal. B: Enzymatic 2000;8: 201.
43. Hill K. Pure Appl. Chem. 2000;72: 1255
44. Besson M, Gallezot P. Catal. Today 2000, 57, 127.
45. Garcia R, Besson M, Gallezot P. Appl. Catal. A: General 1995;127: 165.
46. van Bekkum H, Besemer AC. Chem. Sustain. Dev. 2003;11: 11.
47. Nicolaus N, Gallezot P, Perrard A. J. Catal. 1998;180: 51.
133
48. Haas T, Burkhardt O, Morawietz M, Vanheertum A, Bourrel A. DE 19749202,
assigned to Degussa, 1999.
49. Bragd PL, van Bekkum H, Besemer AC, Top. Catal. 2003;27: 49.
50. Gruber PR, Proceedings 2nd International Conference on Green and Sustainable
Chemistry, Washington, June 20–24, 2005, Abstract 149.
51. Cameron DC. NSF workshop, June 23N24, Washington, 2005;
http://www.cbe.iastate.edu/nsfbioren/presentations/Cameron Cargill.pdf.
52. Manzer L. in Feedstocks for the Future, J. Bozell (Ed.), ACS Symposium Series
2005;921: 40.
53. http://en.wikipedia.org/wiki/Terpene
54. Taarning E, Osmundsen CM, Yang X, Voss B, Andersen SI, Christensen CH.
Energy Environ. Sci. 2011;4: 793–804.
55. Vanholme R, Demedts B, Morreel K, Ralph J, Boerjan W. Plant Physiology
2010;153: 895–905.
56. Rencoret J, Gutiérrez A, Nieto L, Jiménez-Barbero J, Faulds CB, Kim H, Ralph J,
Martinez AT, del Rio JC. Plant Physiology 2011;155: 667–682.
57. Brunow G, Karlsson O, Lundquist K, Sipilä J. Wood Sci. Technol.1993;27: 281–
286.
58. Bardet M, Robert D, Lundquist K ,von Unge S. Magn. Reson. Chem. 1998;36:
597–600.
59. Lundquist K, Stomberg R. Holzforschung 1998;42: 375–384.
60. Karhunen P, Rummakko P, Sipilä J, Brunow G. Tetrahedron Letters1995;36: 4501-
4504.
61. Lapierre C, Pollet B, Monties B, Rolando C. Holzforschung 1991;45: 61–68.
62. Jacquet G, Pollet B, Lapierre C, Francesch C, Rolando C, Faix O. Holzforschung
1997;51: 349–354.
63. Peng J, Lu F & Ralph J. J. Agric. Food Chem. 1998;46: 553–560.
64. Önnerud H & Gellerstedt G. Holzforschung 2003;57: 255–265.
65. Ralph J, Lundquist K, Brunow G, Lu F, Kim H, Schatz1 PF, Marita JM, Hatfield
RD, Ralph SA, Christensen JH, Boerjan W. Phytochemistry Reviews 2004;3: 29–
60.
66. Ämmälahti E, Brunow G. J. Agric. Food Chem. 1998;45: 5113-5117.
134
67. Lam TB-T, Iiyama K, Stone BA . In Akin DE, Ljundahl MG, Wilson RJ, Hams PJ,
eds, Microbial and Plant Opportunities to Improve Lignocellulose Utilization by
Ruminants. Elsevier, New York, 1990: 43-69
68. Lam TB-T, Iiyama K, Stone BA. Phytochemistry 1992;31: 1179-1183.
69. Ralph J, Helm RF, Quideau S, Hatfield RD. J. Chem. Soc. Perkin Trans.1 1992:
2961-2968.
70. Donaldson LA. Phytochemistry 2001;57: 859–873.
71. Timell TE. In, CompressionWood in Gymnosperms, Vol. 1: Bibliography,
Historical Background, Determination, Structure, Chemistry, Topochemistry,
Physical Properties, Origin, and Formation of CompressionWood. Springer-Verlag,
Berlin,1986: 706.
72. Taylor JG, Owen TP Jr, Koonce LT, Haigler CH. The Plant Journal 1992; 2: 959-
970.
73. Donaldson LA, Knox JP. Plant Physiology 2012;158: 642–653.
74. Donaldson LA. Wood Sci. Technol.1994;28: 111-118.
75. Campbell MM, Sederof RR. Plant Physiol. 1996;110: 3-13.
76. Deighton N, Richardson A, Stewart D, McDougall GJ. Holzforschung 1999;53:
503–510.
77. Davin LB, Lewis NG. Plant Physiology 2000;123: 453–461.
78. Ralph J, Grabber JH, Hatfield RD. Carbohydr. Res. 1995;275: 167–78.
79. Harkin JM, Obst JR. Science 1973;180: 296-298.
80. Sarkanen S,Razals RA, Piccariellos T, Yamamotoa E, Lewiss NG. J. Biol.
Chem.1991;266: 3636-3643.
81. Whetten R, Sederoff R. The Plant Cell 1995;7: 1001-1013.
82. Boudet AM, Lapierre C, Grima-Pettenati J. New Phytol. 1995;129: 203-236.
83. Gierer J. Wood Sci. Technol. 1985;19: 289-312
84. Wanat EC, Venkataraman K, Schmidt LD. Appl. Catal. A: General 2004;276: 155.
85. van de Pas D, Hickson A, Donaldson L, Lloyd-Jones G, Tamminen T, Fernyhough
A, Mattinen ML. BioResources 2011;6: 1105-1121.
86. Hatakeyamaa H, Nakayachia A, Hatakeyama T. Composites: Part A 2005;36: 698–
704
87. Klason P. Bericht tiber die Hauptversammlung des Vereins der ZeUstoff- und
Papierchemiker, 1908: 52.
88. Willstätter R. Zechmeister L. Bet. Deutsch. Chem. Ges. 1913 46:2405
135
89. Björkman A. Svensk Papperstidn. 1956;59: 477
90. Lundquist K, Ohlson B, Simonson R. Svensk Papperstidn. 1977;80: 143
91. Pew, J. C. Tappi 1957;40: 553.
92. Eriksson I, Lidbrandt O, Westermark U. Wood Sci. Technol.1988;22: 251-257.
93. Adler E. Wood Sci. Technol.1997;11: 169-218.
94. Pepper JM, Baylis PET, Adler E. Can. J. Chem. 1959;37: 1241.
95. Lundquist K. Acta Chem. Scand. 1970;24: 889
96. Lundquist, K. Acta Chem. Scand. 1973; 27: 2597
97. Nimz H. Chem. Bet. 1969;102: 799
98. Nimz H. Angew. Chem. Int. Ed. Engk 1974;13: 313
99. Lu F, Ralph J. J. Agric. Food Chem. 1997;45: 4655-4660.
100. Carretta P, Lascialfari A, eds . NMR-MRI, µSR and Mossbauer Spectroscopies in
Molecular Magnets. Sprenger-Verlag, Italy 2007.
101. Hoallas JM, ed. Modern Spectroscopy. Wiley, England 2004.
102. Ruel K, Barnoud F, Goring DAI. Wood Sci. Technol.1978;12: 287-291.
103. Joseleau JP, Imai T, Kuroda K, Ruel K. Planta 2004;219: 338–345.
104. Koch G, Kleist G. Holzforschung 2001;55: 563–567.
105. Gierlinger N, Schwanninger M. Plant Physiology 2006;140: 1246–1254.
106. Donaldson L, Radotic K, Kalauzi A, Djikanovic D, Jeremic M. J. of Structural
Biology 2010;169: 106–115.
107. Agarwal UP, Atalla RH. Planta 1986;169: 325-332.
108. Leclerc DF. In Encyclopedia of Analytical Chemistry 2006, John Wiley & Sons,
Ltd.
109. Donaldson LA, Radotic K. Journal ofMicroscopy 2013; 251: 178–187.
110. Morreel K, Dima O, Kim H, Lu F, Niculaes C, Vanholme R, Dauwe R, Goeminne
G, Inze´ D, Messens E, Ralph J, Boerjan W. Plant Physiology 2010;153: 1464–
1478.
111. Keeler J, ed. Understanding NMR Spectroscopy. Wiley, England 2002.
112. Ralph J, Landucci LL. In Lignin and Lignans: Advances in Chemistry. Heitner C,
Dimmel DR, Schmidt JA,(eds) New York 2010: 137–234.
113. Hauteville M, Lundquist K, von Unge S. Acta Chem. Scand.B 1986;40: 31.35
114. Lundquist K. Acta Chem. Scand.B 1979;33: 418-420.
115. Capanema A, Balakshin MY, Kadla JF. J. Agric. Food Chem. 2005;53: 9639-9649
136
116. Brunow G, Ämmälahti E, Niemi T, Sipilä J, Simola LK, Kilpeläinen I.
Phvtochemistry 1998;47: 1495-15011.
117. Ede RM, Brunow G, Simola LK, Lemmetyinen J Holzforschung 1990;44: 95-101.
118. Hedenström M, Wiklund-Lindström S, Ömana T, Lub F, Gerberc L, Schatzd P,
Sundberg B, Ralph J. Molecular Plant 2009;5: 933–942.
119. Kim H, Ralph J, Akiyama T. Bioenerg. Res. 2008;1: 56–66.
120. Kim H, Ralph J. Org. Biomol. Chem.2010; 8: 576–591.
121. Sarkanen KV, Ludwig CH. In Lignins, occurrence, formation, structure and
reactions, Wiley-Interscience, New York 1971.
122. Singh S, Lewis NG, Towers GHN. J. Plant Physiol. 1998;153: 316–323.
123. Edwards K, Cramer CL, Bolwell GP, Dixon RA, Schuch W, Lamb CJ. Proc. Natl.
Acad. Sci. U. S. A.1985;82: 6731–6735.
124. Humphreys JM, Hemm MR, Chapple C. Proc. Natl. Acad. Sci. USA 1999;96:
10045–10050.
125. Russell DW, Conn EE. Arch. Biochem. Biophys. 1967;122: 256–258.
126. Grand C. FEBS Lett. 1984;169: 7–11.
127. Heller W, Kühnl T. Arch. Biochem. Biophys.,1985; 241: 453–460.
128. Schoch G, Goepfert S, Morant M, Hehn A, Meyer D, Ullmann P, Werck-Reichhart
D. J. Biol. Chem. 2001; 276: 36566–36574.
129. Douglas C, Hoffmann H, Schulz W, Hahlbrock K. EMBO J. 1987;6: 1189–1195.
130. Costa MA, Bedgar DL, Moinuddin SGA, Kim KW, Cardenas CL, Cochrane FC,
Shockey JM, Helms GL, Amakura Y, Takahashi H, Milhollan JK, Davin LB,
Browse J, Lewis NG. Phytochemistry 2005;66: 2072–2091.
131. Finkle BJ, Nelson RF, Biochim. Biophys. Acta 1963;78: 747–749.
132. Guo D, Chen F, Inoue K, Blount JW, Dixon RA. Plant Cell 2001;13: 73–88.
133. Jouanin L, Goujon T, de Nadaï V, Martin MT, Mila I, Vallet C, Pollet B,
Yoshinaga A, Chabbert B, Petit-Conil M, Lapierre C. Plant Physiol. 2000;123:
1363–1373.
134. Lacombe E, Hawkins S, Van Doorsselaere J, Piquemal J, Goffner D, Poeydomenge
O, Boudet AM, Grima Pettenati J. Plant J. 1997;11: 429–441.
135. Lauvergeat V, Lacomme C, Lacombe E, Lasserre E, Roby D, Grima-Pettenati J.
Phytochemistry 2001;57: 1187–1195.
136. Knight ME, Halpin C, Schuch W. Plant Mol. Biol. 1992;19: 793–801.
137
137. Kim SJ, Kim MR, Bedgar DL, Moinuddin SGA, Cardenas CL, Davin LB, Kang C,
Lewis NG. Proc. Natl. Acad. Sci. U. S. A. 2004;101: 1455–1460.
138. Bao W, O’Malley DM, Whetten R, Sederoff RR. Science 1993;260: 672–74
139. Dixon RA, Chen F, Guo D, Parvathi K. Phytochemistry 2001;57: 1069–84
140. Kajita S, Hishiyama S, Tomimura Y, Katayama Y, Omori S. Plant Physiol.
1997;114: 871–79
141. Hu WJ, Harding SA, Lung J, Popko JL, Ralph J. Nat. Biotechnol. 1999;17: 808–12
142. Franke R, Hemm MR, Denault JW, Ruegger MO, Humphreys JM, Chapple C.
Plant J. 2002;30: 47–59
143. Guo D, Chen F, Inoue K, Blount JW, Dixon RA. Plant Cell 2001;13: 73–88.
144. Piquemal J, Lapierre C, Myton K, O’Connell A, Schuch W. Plant J. 1998;13: 71–
83.
145. Ralph J, Lapierre C, Marita JM, Kim H, Lu F. Phytochemistry 2001;57: 993–1003.
146. Davin LB, Jourdes M, Patten AM, Kim KW, Vassaõ DG, Lewis NG. Nat. Prod.
Rep. 2008;25: 1015–1090.
147. Freudenberg K. Nature 1959;183: 1152–1155.
148. Erdtman H. Ind. Eng. Chem. 1957;49: 1385–1386.
149. Gang DR, Costa MA, Fujital M, Dinkova-Kostova AT, Wang HB, Burlat V, Mart
W, Sarkanen S, Davin LB, Lewis NG. Chemistry & Biology 1999;6: 143-l 51.
150. Syrjänen K, Brunow G. J. Chem. Soc., Perkin Trans. 1 2000: 183–187.
151. Davin LB, Wang HB, Crowell AL, Bedgar DL, Martin DM, Sarkanen S, Lewis
NG. Science 1997;275: 362-366.
152. Ralph J, Hatfield RD, Piquemal J,Yahiaoui N, Pean M. Proc. Natl. Acad. Sci. USA
1998;95: 12803–12808.
153. Morreel K, Ralph J, Kim H, Lu F, Goeminne G, Ralph S, MessensE, Boerjan W.
Plant Physiology 2004;136: 3537–3549.
154. Chen YR, Sarkanen S. Phytochemistry 2010;71: 453–462.
155. Davin LB Lewis NG. Current Opinion in Biotechnology 2005;16: 407–415.
156. Vanholme R, Morreel K, Ralph J, Boerjan W. Current opinion in plant biology
2008;11: 278-285
157. Marita JM, Ralph J, Hatfield RD, Chapple C. PNAS 1999;96: 12328–12332.
158. Huntley SK, Ellis D, Gilbert M, Chapple C, Mansfield SD. J. Agric. Food Chem.
2003;51: 6178-6183

138
159. Stewart JJ, Akiyama T, Chapple C, Ralph J, Mansfield SD. Plant Physiology 2009;
150: 621–635,
160. Pilate G, Guiney E, Holt K, Petit-Conil M, Lapierre C, Leplé JC, Pollet B, Mila I,
Webster EA, Marstorp HG, Hopkins DW, Jouanin L, Boerjan W, Schuch W,
Cornu1 D, Halpin C. Nature Biotechnology 2002;20: 607-612.
161. Jung HG, Allen MS. J. Anim. Sci.1995;73: 2774-2790.
162. Wagner A, Donaldson L, Kim H, Phillips L, Flint H, Steward D, Torr K, Koch G,
Schmitt U, Ralph J. Plant Physiology 2009;149: 370–383.
163. Wagner A, Tobimatsu Y, Phillips L, Flint H, Torr K, Donaldson L, Pears L, Ralph
J. The Plant Journal 2011;67: 119–129.
164. Wagner A, Tobimatsu Y, Goeminne G, Phillips L, Flint H, Steward D, Torr K,
Donaldson L, Boerjan W, Ralph J. Plant Mol Biol 2013;81: 105–117.
165. Syrjänen K, Sipilä J, Björk H, Brunow G. J. Agric. Food Chem. 2000;48: 5211-
5215.
166. Ralph J, Hatfield RD, Quideau S, Helm RF, Grabber JH, Jung HJG. J. Am. Chem.
Soc. 1994;116: 9448-9456.
167. Ralph J, Helm RF, Quideau S. J. Chem. Soc. Perkin Trans.1 1992: 2971-2980.
168. Erdtman H. Biochem. Z 1933;258:117.
169. Freudenberg K. Fortschritte der Chem. org. Naturstoffe 1939; 2: 1.
170. Freudenberg IC, Grion G, Harkin JM. Angew. Chem. 1958;70: 743.
171. Freudenberg K, Jones K, Rermer H. Chem. Ber. 1963;96: 1844.
172. Freudenberg K. Angew. Chem.1956;68: 508–12.
173. Syrjänen K, Brunow G. J. Chem. Soc., Perkin Trans.1 1998: 3425–3429.
174. Grabber JH, Ralph J, Hatfield RD, Quideau S, Kuster T, Pell AN. J. Agric. Food
Chem. 1996;44: 1453-1459.
175. Grabber JH, Ralph J, Hatfield RD, Quideau S. J. Agric. Food Chem. 1997;45:
2530-2532.
176. Grabber JH, Ralph J, Hatfield RD. J. Agric. Food Chem. 1998;46: 2609-2614.
177. Radotic K,Simic-Krstic J, Jeremic M, Trifunovic M. Biophysical Journal 1994;66:
1763-1767.
178. Simola LK, Lemmetyinen J, Santiineii A. Physiologia Plantarum 1992;84: 374-
379.
179. Boudet AM, Lapierre C, Grima-Pettenati J. New Phytol. 1995;129: 203-236.
180. Aloorkar NH, Kulkarni AS, Patil RA, Inagle DJ. IJPSN 2012;5: 1675-1684.
139
181. Matyjaszewski K, Xia J. Chem. Rev. 2001;101: 2921-2990.
182. Duong HTT, Jung K, Kutty SK, Agustina S, Adnan NNM, Basuki JS, Kumar N,
Davis TP, Barraud N, Boyer C. Biomacromolecules 2014;15: 2583–2589.
183. Georgiou TK, Phylactou LA, Patrickios CS. Biomacromolecules 2006;7: 3505-
3512.
184. Kumar K, Adhikary P, Krishnamoorthi S. PolymInt 2014;63: 1842–1849.
185. Lin W, Nie S, Zhong Q, Yang Y, Cai C, Wang J, Zhang L. J. Mater. Chem. B
2014; 2: 4008-4020.
186. Wang C, Qian C, Roman M, Glasser WG, Esker AR. Biomacromolecules 2013;14:
3964−3972.
187. Karhunen P, Rummakko P, Pajunen A, Brunow G. J. Chem. Soc. Perkin Trans. 1
1996: 2302-2308.
188. Nakatsubo F,Higuchi T. Wood research : bulletin of the Wood Research Institute
Kyoto 1980;66: 23-29.
189. Lundquist K, Remmerth S. Acta Chem. Scand. B 1975;29: 276-278.
190. Pearl IA,Gratzl J. Lignin and Related Products 1962;27: 2111-2114.
191. Sipilä J, Syrjänen K. Holzforschung 1995;49: 325-331.
192. SDBS, Spectral Database for Organic Compounds.
http://sdbs.db.aist.go.jp/sdbs/cgi-bin/cre_index.cgi


![Synthesis of Lignin-based Epoxy Resin using Ionic Liquid [BMIm]Cl · Synthesis of Lignin-based Epoxy Resin using Ionic Liquid [BMIm]Cl Z.L. YANG1, R.F.ZHANG1, M.Q. CHEN1 & W.T. LI1](https://img.dokumen.tips/doc/110x75/612f89de1ecc5158694382fc/synthesis-of-lignin-based-epoxy-resin-using-ionic-liquid-bmimcl-synthesis-of-lignin-based.jpg)