Embed Size (px)
Citation preview
[논 문] 한국재료학회지 http://dx.doi.org/10.3740/MRSK.2012.22.7.352Kor. J. Mater. Res.Vol. 22, No. 7 (2012)
352
†Corresponding author
E-Mail : [email protected] (D. K. Kim)
Synthesis and Photocatalytic Properties of SnO2-Mixed and
Sn-Doped TiO2 Nanoparticles
Hong Goo Choi, Seok-Min Yong and Do Kyung Kim†
Department of Materials Science and Engineering, Korea Advanced Institute of Science and Technology
(KAIST), 291 Daehak-ro, Yuseong-gu, Daejeon 305-701, Korea
(Received June 11, 2012 : Received in revised form June 23, 2012 : Accepted June 28, 2012)
Abstract SnO2-mixed and Sn-doped TiO2 nanoparticles were synthesized via a hydrothermal process. SnO2-mixed TiO2
nanoparticles prepared in a neutral condition consisted of anatase TiO2 nanoparticles(diamond shape, ~25 nm) and cassiterite
SnO2 nanoparticles(spherical shape, ~10 nm). On the other hand, Sn-doped TiO2 nanoparticles obtained under a high acidic
condition showed a crystalline phase corresponding to rutile TiO2. As the Sn content increased, the particle shape changed from
rod-like(d~40 nm, l~200 nm) to spherical(18 nm) with a decrease in the particle size. The peak shift in the XRD results and
a change of the c-axis lattice parameter with the Sn content demonstrate that the TiO2 in the rutile phase was doped with Sn.
The photocatalytic activity of the SnO2-mixed TiO2 nanoparticles dramatically increased and then decreased when the SnO2
content exceeded 4%. The increased photocatalytic activity is mainly attributed to the improved charge separation of the TiO2
nanoparticles with the SnO2. In the case of Sn-doped TiO2 nanoparticles, the photocatalytic activity increased slightly with the
Sn content due most likely to the larger energy bandgap caused by Sn-doping and the decrease in the particle size. The SnO2-
mixed TiO2 nanoparticles generally exhibited higher photocatalytic activity than the Sn-doped TiO2 nanoparticles. This was
caused by the phase difference of TiO2.
Key words TiO2, SnO2, nanoparticles, hydrothermal process, photocatalytic activity.
1. Introduction
Various approaches, such as solar cells,1,2) secondary
batteries,3,4) fuel cells,5,6) etc, have been employed to solve
environmental problems. Among them, “photocatalysis”
offers great potential for the complete elimination of toxic
chemicals in the environment.7) Titanium dioxide(TiO2), a
semiconducting oxide, is a promising candidate material
for the photocatalysis due to its powerful oxidation
potential, high chemical inertness, low cost, high photo-
stability, and non-toxicity in water and air purification.8-10)
However, a large bandgap(3.2 eV) of TiO2 results in only
a narrow light-response range of ultraviolet(only about 3-
5% of solar light), which limits the application of TiO2
as a photocatalyst.10,11)
A variety of approaches has been considered to improve
the photocatalytic activity of TiO2. One interesting ap-
proach is to couple the TiO2 with other semiconductor
material with different energy levels, which suppresses
the recombination of photogenerated charge carriers in a
semiconductor system12,13) and thus improving the efficiency
of net charge transfer at the semiconductor/electrolyte
interface. One of the early demonstrations of this concept
came from Nozik et al.,14) who developed a simple photo-
chemical diode by sandwiching p- and n-type semicon-
ductors. Considerable interest has been focused on
studying coupled semiconductor systems including CdS-
TiO2, CdS-SnO, CdS-AgI, ZnO-ZnS, and ZnO-ZnSe.15-19)
Another route is the metal cation doping, which reduces
the absorption threshold of TiO2 and extends of its
optical absorption range from UV to visible region. J. Li
et al.20) reported that the incorporation of Mo ion into the
TiO2 lattice resulted in a noticeable red shift of the
absorption edge and a significant enhancement of photo-
catalytic activity. N. I. Al-Salim et al.21) modified the sol-
gel-prepared TiO2 with alkaline earth ions, which resulted
in approximately double the photocatalytic activity of
similarly prepared TiO2 without additive.
In this study, the SnO2-mixed and Sn-doped TiO2 nano-
particles were synthesized using hydrothermal treatment.
The photocatalytic activities of the prepared samples were
measured and compared. Also, the effect of Sn contents
on the photocatalytic activity was investigated.
2. Experimental Procedure
2.1 Preparation of TiO2 amorphous gel nanoparticles
Titanium tetrachloride(TiCl4, 98% Aldrich) was used as
a starting material. When TiCl4 was dissolved in water,
the exothermic reaction and hydrolysis reaction, which
generated Ti(OH)4, were occurred. To prevent the hy-
Synthesis and Photocatalytic Properties of SnO2-Mixed and Sn-Doped TiO2 Nanoparticles 353
drolysis reaction and reduce the exothermic reaction rate,
titanium tetrachloride was dissolved in ice water and
adjusted to 1 M titanium solution.
TiO2 amorphous particles were prepared by neutral pre-
cipitation of 0.5 M titanium tetrachloride aqueous solution
with ammonia aqueous solution as a neutral agent. The
white precipitate was washed with double distilled water
until Cl− and NH4+ ions were removed(usually 5 times
washing). The precipitates were dried by freeze dryer.
(Micromodulyo, ThermoSavant Co., USA). The final par-
ticles were amorphous in nature and their average particle
size was around 5 nm.
2.2 Synthesis of SnO2-mixed TiO2 nanoparticles
TiO2 and SnO2 gel nanoparticles were dispersed in 70 mL
of double distilled water(SnO2 content = 0~10 atomic %).
The SnO2 gel nanoparticles were prepared by same syn-
thesis method of TiO2 gel nanoparticles. The final solution
(pH = 7) was transferred to the Teflon lined hydrothermal
bomb. The hydrothermal condition was 220oC for 10
hours. After hydrothermal treatment, the obtained product
was washed with double distilled water and then dried by
freeze dryer.
2.2 Synthesis of Sn-doped TiO2 nanoparticles
TiO2 gel nanoparticles were dispersed in SnCl4 aqueous
solution(Sn content = 0~10 atomic %). Next, pH of the
solution was adjusted to 0.1 by using HCl aqueous solu-
tion. The final solution(70 mL) was transferred to the
Teflon lined hydrothermal bomb. The hydrothermal condi-
tion was 220oC for 10 hours. After hydrothermal treat-
ment, the obtained product was washed with double
distilled water and then dried by freeze dryer.
2.3 Powder properties
The structural and chemical properties of the final
particles were studied using X-ray diffraction(XRD, D/
MAX-IIIC, Rigaku, Japan), scanning electron microscopy
(SEM, XL30 FEG, Philips, Netherlands), transmission
electron microscopy(TEM, JEM 3010, Jeol, Japan) and
energy dispersive X-ray spectroscopy(EDS) attached to
scanning electron microscopy and transmission electron
microscopy. TEM samples were prepared by dispersing
the powders in double distilled water by ultrasonic treat-
ment and dipping the carbon coated copper grid in the
solution and then drying.
The primary nanoparticle size was calculated with the
Scherrer formula using the x-ray diffraction peak of
anatase TiO2 (101) plane and rutile TiO2 (110) plane.
2.4 Photocatalytic activity
Photo-catalytic activity was measured by monitoring
chloride ions generated during photo-catalysis of chloro-
form(CHCl3), a representative chlorinated hydrocarbon.
The schematic illustration of the experimental set up used
in this study for measuring photo-catalytic activity is
presented in Fig. 1.
2CHCl3 + 2H2O + O2hv
⎯⎯→ 2CO2 + 6HCl (1)
As shown in equation (1), chloroform does not have any
intermediate product, and the concentration of generated
chlorine ions, which were evolved during photocataylsis,
can be directly correlated to concentration of chloroform.
Photo-catalytic activity (γ) is defined in the following
equation;
(2)
where C is the concentration of chlorine ions(moles/L),
t is the irradiation time of UV light, m is the concentra-
tion of the nanoparticles(g/L), and I is the intensity of
adsorbed UV light. In the present study, the initial con-
centration of chloroform was 0.019 mol/L, C was evaluated
by using a chlorine ion selective electrode(96-17B, Orion
Research Inc., Beverly, MA), t was 20 minutes, and m
was 0.62 g/L. An UV black light lamp(15W, F15T8/BLB,
GE, Columbus, OH) was used as an UV light source and
irradiated photons were not able to directly decompose
chloroform without aids of TiO2 photocatalyst.
γC
3tmI------------=
Fig. 1. Schematic drawing of photocatalytic reactor. Photo-catalytic
activity was measured by monitoring chloride ions generated during
photocatalysis of chloroform(CHCl3), a representative chlorinated
hydrocarbon.
354 Hong Goo Choi, Seok-Min Yong and Do Kyung Kim
3. Results and Discussion
3.1 Characterization of SnO2-mixed TiO2 nanopar-
ticles
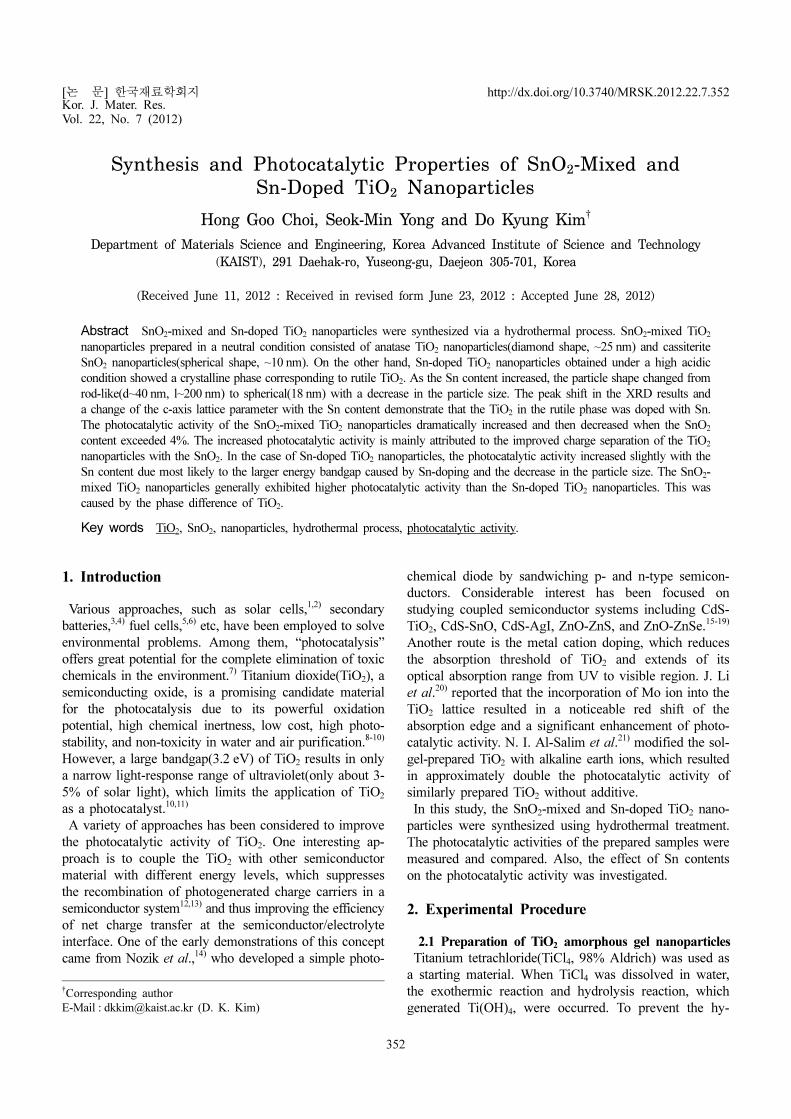
Fig. 2 shows the TEM micrographs of pure TiO2 nano-
particles and pure SnO2 nanoparticles which were synthe-
sized by hydrothermal treatment at 220oC for 10 hours.
The size and morphology of TiO2 particles were around
25 nm and diamond shape, respectively. On the other
hand, SnO2 particles have a size of around 10 nm and
spherical in shape.
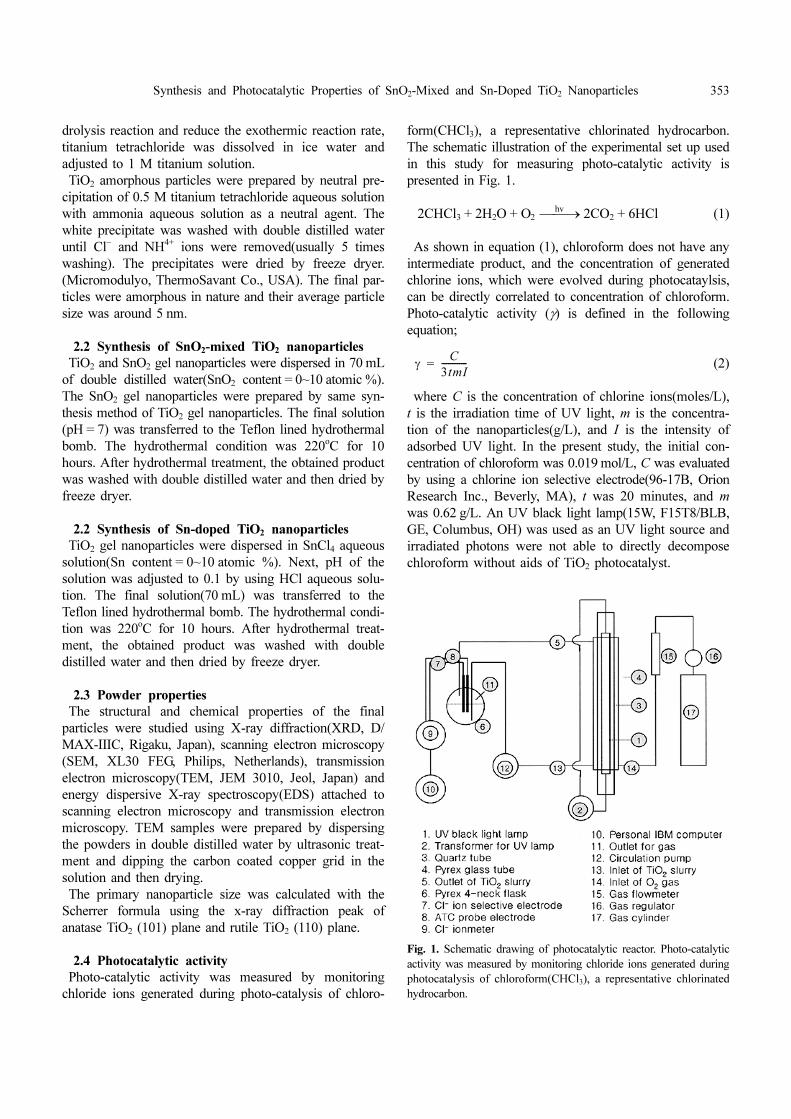
Fig. 3 shows the XRD patterns of the synthesized SnO2-
mixed nanoparticles synthesized at different content of
SnO2 at pH 7. There were two crystal phases, TiO2
anatase phase and SnO2 cassiterite phase. The XRD peak
intensity of SnO2 cassiterite phase(2θ = 26.6o) increased
with Sn content.
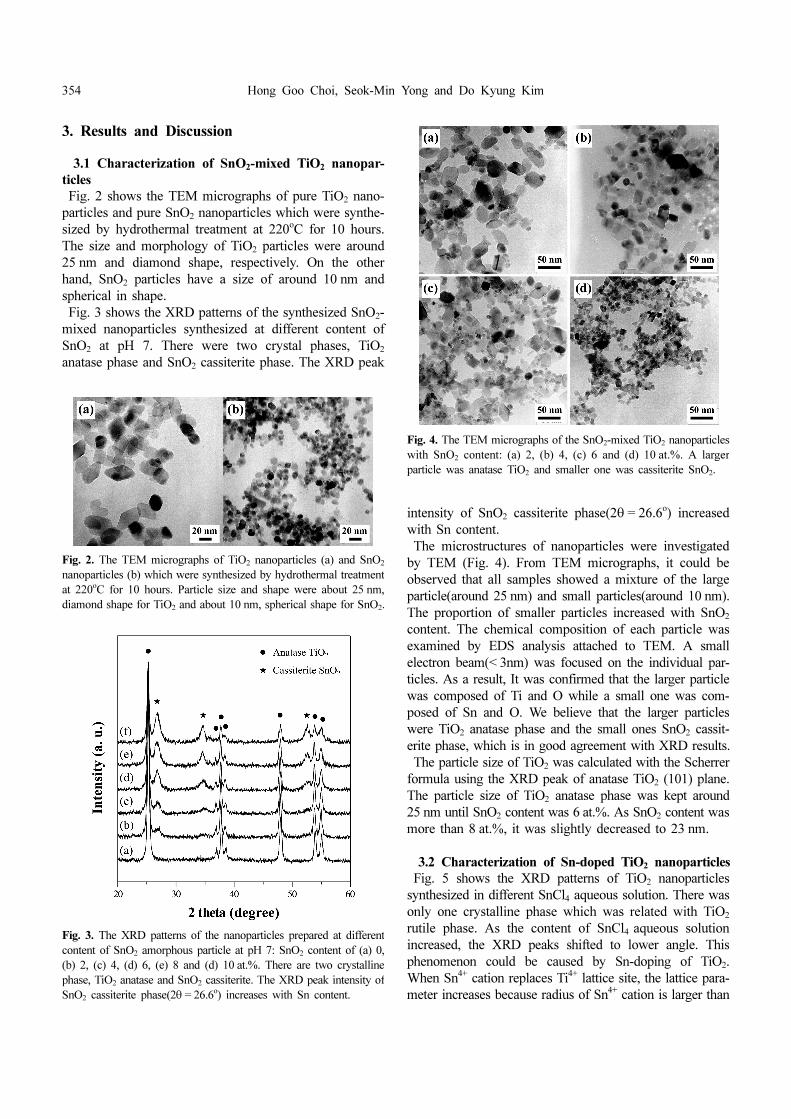
The microstructures of nanoparticles were investigated
by TEM (Fig. 4). From TEM micrographs, it could be
observed that all samples showed a mixture of the large
particle(around 25 nm) and small particles(around 10 nm).
The proportion of smaller particles increased with SnO2
content. The chemical composition of each particle was
examined by EDS analysis attached to TEM. A small
electron beam(< 3nm) was focused on the individual par-
ticles. As a result, It was confirmed that the larger particle
was composed of Ti and O while a small one was com-
posed of Sn and O. We believe that the larger particles
were TiO2 anatase phase and the small ones SnO2 cassit-
erite phase, which is in good agreement with XRD results.
The particle size of TiO2 was calculated with the Scherrer
formula using the XRD peak of anatase TiO2 (101) plane.
The particle size of TiO2 anatase phase was kept around
25 nm until SnO2 content was 6 at.%. As SnO2 content was
more than 8 at.%, it was slightly decreased to 23 nm.
3.2 Characterization of Sn-doped TiO2 nanoparticles
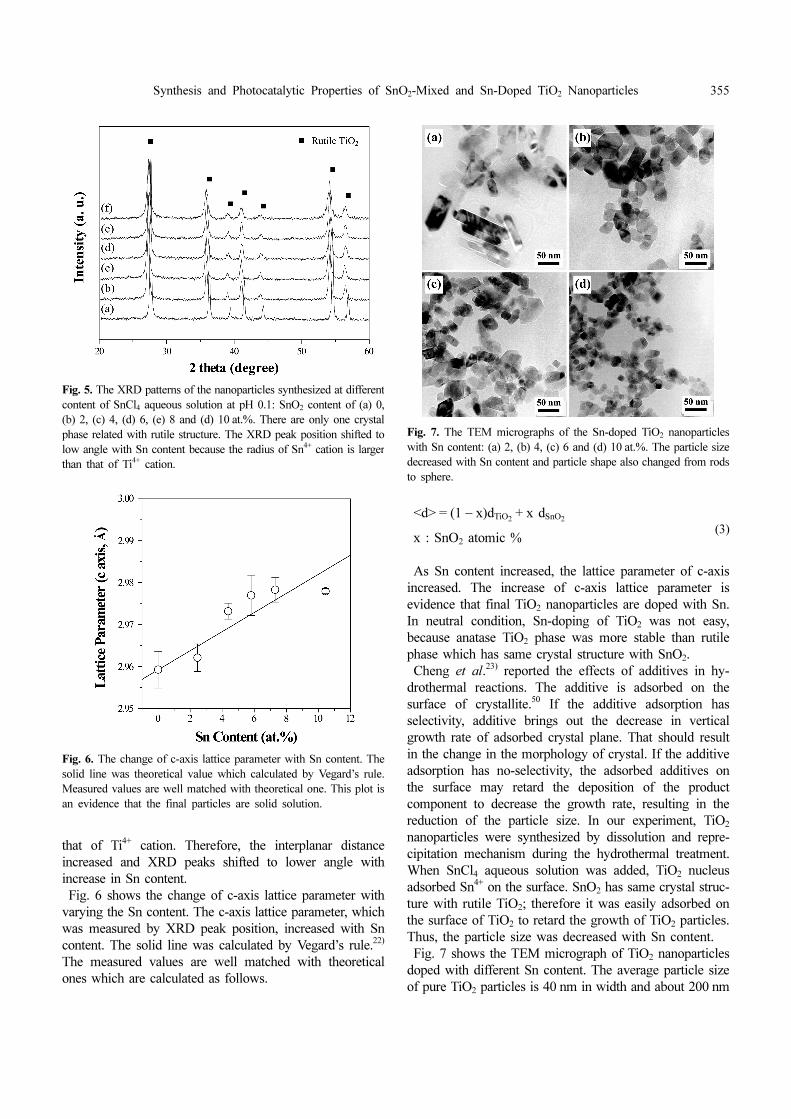
Fig. 5 shows the XRD patterns of TiO2 nanoparticles
synthesized in different SnCl4 aqueous solution. There was
only one crystalline phase which was related with TiO2
rutile phase. As the content of SnCl4 aqueous solution
increased, the XRD peaks shifted to lower angle. This
phenomenon could be caused by Sn-doping of TiO2.
When Sn4+ cation replaces Ti4+ lattice site, the lattice para-
meter increases because radius of Sn4+ cation is larger than
Fig. 2. The TEM micrographs of TiO2 nanoparticles (a) and SnO2
nanoparticles (b) which were synthesized by hydrothermal treatment
at 220oC for 10 hours. Particle size and shape were about 25 nm,
diamond shape for TiO2 and about 10 nm, spherical shape for SnO2.
Fig. 3. The XRD patterns of the nanoparticles prepared at different
content of SnO2 amorphous particle at pH 7: SnO2 content of (a) 0,
(b) 2, (c) 4, (d) 6, (e) 8 and (d) 10 at.%. There are two crystalline
phase, TiO2 anatase and SnO2 cassiterite. The XRD peak intensity of
SnO2 cassiterite phase(2θ = 26.6o) increases with Sn content.
Fig. 4. The TEM micrographs of the SnO2-mixed TiO2 nanoparticles
with SnO2 content: (a) 2, (b) 4, (c) 6 and (d) 10 at.%. A larger
particle was anatase TiO2 and smaller one was cassiterite SnO2.
Synthesis and Photocatalytic Properties of SnO2-Mixed and Sn-Doped TiO2 Nanoparticles 355
that of Ti4+ cation. Therefore, the interplanar distance
increased and XRD peaks shifted to lower angle with
increase in Sn content.
Fig. 6 shows the change of c-axis lattice parameter with
varying the Sn content. The c-axis lattice parameter, which
was measured by XRD peak position, increased with Sn
content. The solid line was calculated by Vegard’s rule.22)
The measured values are well matched with theoretical
ones which are calculated as follows.
<d> = (1 − x)dTiO2+ x dSnO2
(3)x : SnO2 atomic %
As Sn content increased, the lattice parameter of c-axis
increased. The increase of c-axis lattice parameter is
evidence that final TiO2 nanoparticles are doped with Sn.
In neutral condition, Sn-doping of TiO2 was not easy,
because anatase TiO2 phase was more stable than rutile
phase which has same crystal structure with SnO2.
Cheng et al.23) reported the effects of additives in hy-
drothermal reactions. The additive is adsorbed on the
surface of crystallite.50 If the additive adsorption has
selectivity, additive brings out the decrease in vertical
growth rate of adsorbed crystal plane. That should result
in the change in the morphology of crystal. If the additive
adsorption has no-selectivity, the adsorbed additives on
the surface may retard the deposition of the product
component to decrease the growth rate, resulting in the
reduction of the particle size. In our experiment, TiO2
nanoparticles were synthesized by dissolution and repre-
cipitation mechanism during the hydrothermal treatment.
When SnCl4 aqueous solution was added, TiO2 nucleus
adsorbed Sn4+ on the surface. SnO2 has same crystal struc-
ture with rutile TiO2; therefore it was easily adsorbed on
the surface of TiO2 to retard the growth of TiO2 particles.
Thus, the particle size was decreased with Sn content.
Fig. 7 shows the TEM micrograph of TiO2 nanoparticles
doped with different Sn content. The average particle size
of pure TiO2 particles is 40 nm in width and about 200 nm
Fig. 5. The XRD patterns of the nanoparticles synthesized at different
content of SnCl4 aqueous solution at pH 0.1: SnO2 content of (a) 0,
(b) 2, (c) 4, (d) 6, (e) 8 and (d) 10 at.%. There are only one crystal
phase related with rutile structure. The XRD peak position shifted to
low angle with Sn content because the radius of Sn4+ cation is larger
than that of Ti4+ cation.
Fig. 6. The change of c-axis lattice parameter with Sn content. The
solid line was theoretical value which calculated by Vegard’s rule.
Measured values are well matched with theoretical one. This plot is
an evidence that the final particles are solid solution.
Fig. 7. The TEM micrographs of the Sn-doped TiO2 nanoparticles
with Sn content: (a) 2, (b) 4, (c) 6 and (d) 10 at.%. The particle size
decreased with Sn content and particle shape also changed from rods
to sphere.
356 Hong Goo Choi, Seok-Min Yong and Do Kyung Kim
in length. The Sn-doping affected the particle shape as
well as the particle size. The rod-like shaped particle
slowly and steadily disappeared, and spherical and square
particles(18 nm at 10 at.% of Sn) were evolved as the Sn
content increased from 0 to 10 at.%.
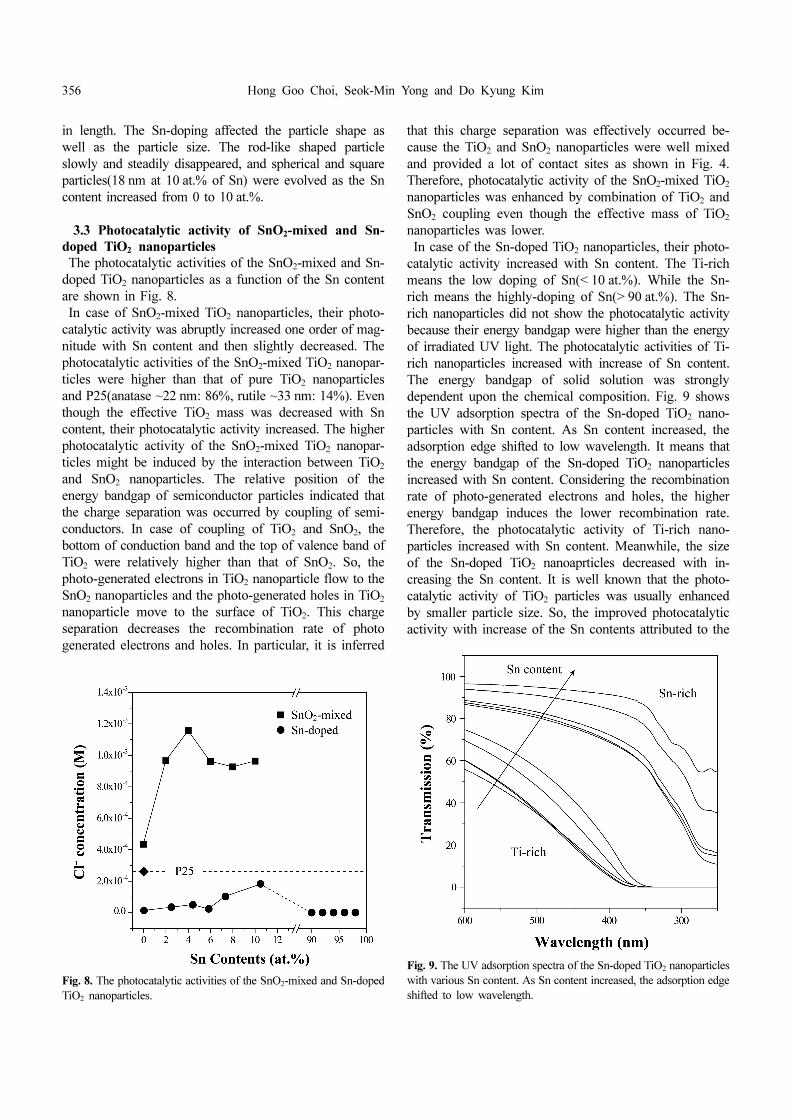
3.3 Photocatalytic activity of SnO2-mixed and Sn-
doped TiO2 nanoparticles
The photocatalytic activities of the SnO2-mixed and Sn-
doped TiO2 nanoparticles as a function of the Sn content
are shown in Fig. 8.
In case of SnO2-mixed TiO2 nanoparticles, their photo-
catalytic activity was abruptly increased one order of mag-
nitude with Sn content and then slightly decreased. The
photocatalytic activities of the SnO2-mixed TiO2 nanopar-
ticles were higher than that of pure TiO2 nanoparticles
and P25(anatase ~22 nm: 86%, rutile ~33 nm: 14%). Even
though the effective TiO2 mass was decreased with Sn
content, their photocatalytic activity increased. The higher
photocatalytic activity of the SnO2-mixed TiO2 nanopar-
ticles might be induced by the interaction between TiO2
and SnO2 nanoparticles. The relative position of the
energy bandgap of semiconductor particles indicated that
the charge separation was occurred by coupling of semi-
conductors. In case of coupling of TiO2 and SnO2, the
bottom of conduction band and the top of valence band of
TiO2 were relatively higher than that of SnO2. So, the
photo-generated electrons in TiO2 nanoparticle flow to the
SnO2 nanoparticles and the photo-generated holes in TiO2
nanoparticle move to the surface of TiO2. This charge
separation decreases the recombination rate of photo
generated electrons and holes. In particular, it is inferred
that this charge separation was effectively occurred be-
cause the TiO2 and SnO2 nanoparticles were well mixed
and provided a lot of contact sites as shown in Fig. 4.
Therefore, photocatalytic activity of the SnO2-mixed TiO2
nanoparticles was enhanced by combination of TiO2 and
SnO2 coupling even though the effective mass of TiO2
nanoparticles was lower.
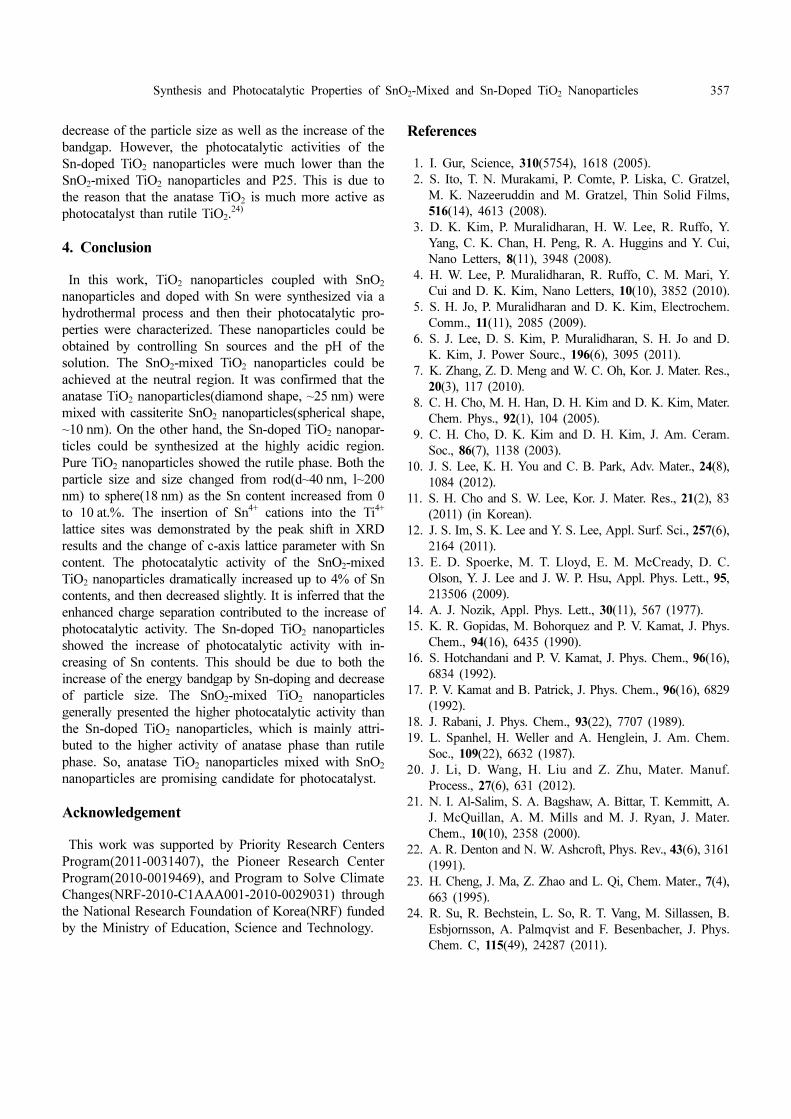
In case of the Sn-doped TiO2 nanoparticles, their photo-
catalytic activity increased with Sn content. The Ti-rich
means the low doping of Sn(< 10 at.%). While the Sn-
rich means the highly-doping of Sn(> 90 at.%). The Sn-
rich nanoparticles did not show the photocatalytic activity
because their energy bandgap were higher than the energy
of irradiated UV light. The photocatalytic activities of Ti-
rich nanoparticles increased with increase of Sn content.
The energy bandgap of solid solution was strongly
dependent upon the chemical composition. Fig. 9 shows
the UV adsorption spectra of the Sn-doped TiO2 nano-
particles with Sn content. As Sn content increased, the
adsorption edge shifted to low wavelength. It means that
the energy bandgap of the Sn-doped TiO2 nanoparticles
increased with Sn content. Considering the recombination
rate of photo-generated electrons and holes, the higher
energy bandgap induces the lower recombination rate.
Therefore, the photocatalytic activity of Ti-rich nano-
particles increased with Sn content. Meanwhile, the size
of the Sn-doped TiO2 nanoaprticles decreased with in-
creasing the Sn content. It is well known that the photo-
catalytic activity of TiO2 particles was usually enhanced
by smaller particle size. So, the improved photocatalytic
activity with increase of the Sn contents attributed to the
Fig. 9. The UV adsorption spectra of the Sn-doped TiO2 nanoparticles
with various Sn content. As Sn content increased, the adsorption edge
shifted to low wavelength.
Fig. 8. The photocatalytic activities of the SnO2-mixed and Sn-doped
TiO2 nanoparticles.
Synthesis and Photocatalytic Properties of SnO2-Mixed and Sn-Doped TiO2 Nanoparticles 357
decrease of the particle size as well as the increase of the
bandgap. However, the photocatalytic activities of the
Sn-doped TiO2 nanoparticles were much lower than the
SnO2-mixed TiO2 nanoparticles and P25. This is due to
the reason that the anatase TiO2 is much more active as
photocatalyst than rutile TiO2.24)
4. Conclusion
In this work, TiO2 nanoparticles coupled with SnO2
nanoparticles and doped with Sn were synthesized via a
hydrothermal process and then their photocatalytic pro-
perties were characterized. These nanoparticles could be
obtained by controlling Sn sources and the pH of the
solution. The SnO2-mixed TiO2 nanoparticles could be
achieved at the neutral region. It was confirmed that the
anatase TiO2 nanoparticles(diamond shape, ~25 nm) were
mixed with cassiterite SnO2 nanoparticles(spherical shape,
~10 nm). On the other hand, the Sn-doped TiO2 nanopar-
ticles could be synthesized at the highly acidic region.
Pure TiO2 nanoparticles showed the rutile phase. Both the
particle size and size changed from rod(d~40 nm, l~200
nm) to sphere(18 nm) as the Sn content increased from 0
to 10 at.%. The insertion of Sn4+ cations into the Ti4+
lattice sites was demonstrated by the peak shift in XRD
results and the change of c-axis lattice parameter with Sn
content. The photocatalytic activity of the SnO2-mixed
TiO2 nanoparticles dramatically increased up to 4% of Sn
contents, and then decreased slightly. It is inferred that the
enhanced charge separation contributed to the increase of
photocatalytic activity. The Sn-doped TiO2 nanoparticles
showed the increase of photocatalytic activity with in-
creasing of Sn contents. This should be due to both the
increase of the energy bandgap by Sn-doping and decrease
of particle size. The SnO2-mixed TiO2 nanoparticles
generally presented the higher photocatalytic activity than
the Sn-doped TiO2 nanoparticles, which is mainly attri-
buted to the higher activity of anatase phase than rutile
phase. So, anatase TiO2 nanoparticles mixed with SnO2
nanoparticles are promising candidate for photocatalyst.
Acknowledgement
This work was supported by Priority Research Centers
Program(2011-0031407), the Pioneer Research Center
Program(2010-0019469), and Program to Solve Climate
Changes(NRF-2010-C1AAA001-2010-0029031) through
the National Research Foundation of Korea(NRF) funded
by the Ministry of Education, Science and Technology.
References
1. I. Gur, Science, 310(5754), 1618 (2005).
2. S. Ito, T. N. Murakami, P. Comte, P. Liska, C. Gratzel,
M. K. Nazeeruddin and M. Gratzel, Thin Solid Films,
516(14), 4613 (2008).
3. D. K. Kim, P. Muralidharan, H. W. Lee, R. Ruffo, Y.
Yang, C. K. Chan, H. Peng, R. A. Huggins and Y. Cui,
Nano Letters, 8(11), 3948 (2008).
4. H. W. Lee, P. Muralidharan, R. Ruffo, C. M. Mari, Y.
Cui and D. K. Kim, Nano Letters, 10(10), 3852 (2010).
5. S. H. Jo, P. Muralidharan and D. K. Kim, Electrochem.
Comm., 11(11), 2085 (2009).
6. S. J. Lee, D. S. Kim, P. Muralidharan, S. H. Jo and D.
K. Kim, J. Power Sourc., 196(6), 3095 (2011).
7. K. Zhang, Z. D. Meng and W. C. Oh, Kor. J. Mater. Res.,
20(3), 117 (2010).
8. C. H. Cho, M. H. Han, D. H. Kim and D. K. Kim, Mater.
Chem. Phys., 92(1), 104 (2005).
9. C. H. Cho, D. K. Kim and D. H. Kim, J. Am. Ceram.
Soc., 86(7), 1138 (2003).
10. J. S. Lee, K. H. You and C. B. Park, Adv. Mater., 24(8),
1084 (2012).
11. S. H. Cho and S. W. Lee, Kor. J. Mater. Res., 21(2), 83
(2011) (in Korean).
12. J. S. Im, S. K. Lee and Y. S. Lee, Appl. Surf. Sci., 257(6),
2164 (2011).
13. E. D. Spoerke, M. T. Lloyd, E. M. McCready, D. C.
Olson, Y. J. Lee and J. W. P. Hsu, Appl. Phys. Lett., 95,
213506 (2009).
14. A. J. Nozik, Appl. Phys. Lett., 30(11), 567 (1977).
15. K. R. Gopidas, M. Bohorquez and P. V. Kamat, J. Phys.
Chem., 94(16), 6435 (1990).
16. S. Hotchandani and P. V. Kamat, J. Phys. Chem., 96(16),
6834 (1992).
17. P. V. Kamat and B. Patrick, J. Phys. Chem., 96(16), 6829
(1992).
18. J. Rabani, J. Phys. Chem., 93(22), 7707 (1989).
19. L. Spanhel, H. Weller and A. Henglein, J. Am. Chem.
Soc., 109(22), 6632 (1987).
20. J. Li, D. Wang, H. Liu and Z. Zhu, Mater. Manuf.
Process., 27(6), 631 (2012).
21. N. I. Al-Salim, S. A. Bagshaw, A. Bittar, T. Kemmitt, A.
J. McQuillan, A. M. Mills and M. J. Ryan, J. Mater.
Chem., 10(10), 2358 (2000).
22. A. R. Denton and N. W. Ashcroft, Phys. Rev., 43(6), 3161
(1991).
23. H. Cheng, J. Ma, Z. Zhao and L. Qi, Chem. Mater., 7(4),
663 (1995).
24. R. Su, R. Bechstein, L. So, R. T. Vang, M. Sillassen, B.
Esbjornsson, A. Palmqvist and F. Besenbacher, J. Phys.
Chem. C, 115(49), 24287 (2011).