Embed Size (px)
Citation preview

Syntaxin-4 Defines a Domainfor Activity-Dependent Exocytosisin Dendritic SpinesMatthew J. Kennedy,1 Ian G. Davison,1,2 Camenzind G. Robinson,1,2 and Michael D. Ehlers1,2,*1Department of Neurobiology2Howard Hughes Medical Institute
Duke University Medical Center, Durham, NC 27710, USA
*Correspondence: [email protected] 10.1016/j.cell.2010.02.042
SUMMARY
Changes in postsynaptic membrane compositionunderlie many forms of learning-related synapticplasticity in the brain. At excitatory glutamatergicsynapses, fusion of intracellular vesicles at or nearthe postsynaptic plasma membrane is critical fordendritic spine morphology, retrograde synapticsignaling, and long-term synaptic plasticity. Whereasthe molecular machinery for exocytosis in presyn-aptic terminals has been defined in detail, little isknown about the location, kinetics, regulation, ormolecules involved in postsynaptic exocytosis.Here, we show that an exocytic domain adjacent tothe postsynaptic density (PSD) enables fusion oflarge, AMPA receptor-containing recycling compart-ments during elevated synaptic activity. Exocytosisoccurs at microdomains enriched in the plasmamembrane t-SNARE syntaxin 4 (Stx4), and disruptionof Stx4 impairs both spine exocytosis and long-termpotentiation (LTP) at hippocampal synapses. Thus,Stx4 defines an exocytic zone that directs membranefusion for postsynaptic plasticity, revealing a novelspecialization for local membrane traffic in dendriticspines.
INTRODUCTION
Rapid changes in membrane composition modify synapses
during brain development and learning-related plasticity (New-
pher and Ehlers, 2008; Shepherd and Huganir, 2007). At excit-
atory glutamatergic synapses in the mammalian brain, activity-
dependent trafficking to and from the postsynaptic membrane
controls synaptic strength and dendritic spine growth, and
may mediate retrograde signaling (Kopec et al., 2007; Lledo
et al., 1998; Luscher et al., 1999; Park et al., 2004, 2006; Tanaka
et al., 2008; Yang et al., 2008b). Formative electrophysiological
and imaging studies have found that exocytosis of internal
membrane stores in dendrites is coupled to synaptic activity
524 Cell 141, 524–535, April 30, 2010 ª2010 Elsevier Inc.
within minutes and is required for synaptic plasticity (Lledo
et al., 1998; Maletic-Savatic and Malinow, 1998). However, the
source of membrane, the site of membrane insertion, and the
molecules involved are only beginning to emerge (Kennedy
and Ehlers, 2006).
Principal among the molecules mediating membrane fusion
are the soluble NSF-attachment protein receptor (SNARE)
proteins, which attach intracellular vesicles to their target mem-
branes and drive membrane fusion. Comprised of the syntaxin,
SNAP-23/25, and synaptobrevin/VAMP protein families, SNARE
proteins are essential for diverse forms of membrane fusion
events in all eukaryotic cells (Jahn and Scheller, 2006; Martens
and McMahon, 2008), and play a well known role in neurotrans-
mitter release from presynaptic terminals (Sollner et al., 1993).
Interestingly, Clostridia neurotoxins that cleave VAMP, SNAP-
23/25, or syntaxin disrupt postsynaptic plasticity at excitatory
synapses (Lledo et al., 1998; Lu et al., 2001), suggesting the
presence of postsynaptic SNAREs. However, the SNARE mole-
cules that mediate activity-dependent membrane trafficking in
postsynaptic compartments remain unidentified.
In mammalian cells, four of the 15 members of the syntaxin
family, Stx1-4, localize to the plasma membrane (PM), where
they form small (50–60 nm) homotypic clusters of approximately
70 molecules that are thought to mark sites of exocytosis on the
cell surface (Lang et al., 2001; Low et al., 2006; Ohara-Imaizumi
et al., 2004; Sieber et al., 2006, 2007). Whereas Stx1 is localized
to presynaptic terminals and mediates synaptic vesicle exocy-
tosis, the roles of other syntaxins at synapses have not been
defined.
In addition to a lack of information about relevant fusion
machinery, the location of activity-driven postsynaptic exocy-
tosis is controversial (Adesnik et al., 2005; Ashby et al., 2006;
Kopec et al., 2007; Makino and Malinow, 2009; Park et al.,
2006; Passafaro et al., 2001; Yudowski et al., 2007). Studies
using an expressed GluR1 AMPA receptor subunit fused to the
pH-sensitive GFP variant superecliptic pHluorin (SEP) revealed
activity-dependent insertion of SEP-GluR1 at the soma and
dendritic shaft, but failed to observe exocytosis directly within
dendritic spines, the micron-sized membranous protrusions
originating from the dendritic shaft that are the sites of excitatory
synaptic contact (Makino and Malinow, 2009; Yudowski et al.,
2007). Other studies demonstrated that both SEP-GluR1 and

transferrin receptor (TfR), a marker for recycling endosomal
cargo, accumulate selectively on the spine PM following syn-
aptic stimulation, suggesting that exocytosis takes place within
or near spines (Kopec et al., 2006; Park et al., 2006). For
membrane internalization in spines, dedicated zones of cla-
thrin-mediated endocytosis positioned just lateral to the PSD
have been identified (Blanpied et al., 2002; Lu et al., 2007;
Racz et al., 2004). Thus, the presence of a spine exocytic zone
would complete a micron-scale trafficking circuit that could set
the composition of membrane proteins at individual synapses.
In the present study, we engineered an optical reporter for
visualizing exocytosis and demonstrate that activity triggers
abrupt, massive, all-or-none exocytosis of glutamate receptor-
containing recycling endosomes (REs) in dendritic spines.
High-resolution live cell imaging revealed that exocytosis occurs
at discrete spine domains lateral to the postsynaptic density
(PSD). These points of exocytosis coincide with submicron
membrane clusters of Stx4, shown by immunogold electron
microscopy to lie at membrane domains immediately lateral
to the PSD. Further, both chronic and acute disruption of Stx4
inhibited activity-induced spine exocytosis and blocked long-
term potentiation (LTP) at hippocampal synapses. Taken
together, these results demonstrate activity-dependent exocy-
tosis of recycling cargo, including glutamate receptors, at exo-
cytic zones in spines, and they define Stx4 as a SNARE protein
that directs membrane fusion for activity-dependent spine
remodeling and synaptic plasticity. Establishment of a spine
exocytic domain reveals a novel physiological function for
Stx4 in coupling local signaling to spatially restricted membrane
trafficking in cells.
RESULTS
An Optical Sensor for Exocytosis in PostsynapticCompartmentsTo directly visualize postsynaptic exocytosis, we engineered
a dual-color reporter by fusing transferrin receptor (TfR), a classic
marker for recycling endosomal trafficking, to both mCherry
(mCh) and the pH-sensitive GFP variant superecliptic pHluorin
(SEP) (Miesenbock et al., 1998). This reporter, TfR-mCh-SEP, al-
lowed us to image the entire pool of TfR in the red (mCh) channel
and to selectively visualize only those TfR molecules at the PM in
the green (SEP) channel, thus allowing visualization of exocytic
cargo before, during, and following membrane fusion (Figure 1A
and Figure S1 available online).
When TfR-mCh-SEP was expressed in hippocampal neurons
(DIV17-20), we observed intracellular pools of TfR as large endo-
somal structures, typically 1–4 mm in length, in the dendritic shaft
(Figures 1A and Figure S1). We also commonly observed smaller
TfR-positive recycling endosomes (ranging in size from diffrac-
tion limited to �0.5 mm in diameter) within 56% of dendritic
spines (Figure 1B and Figure S1D). Spine endosomes labeled
by TfR-mCh-SEP were stable under basal conditions and
typically remained within the spine head for the length of our
imaging sessions, which lasted up to 40 min. To confirm that
the TfR-mCh-SEP spine compartments were functional, we
imaged live cells expressing TfR-mCh-SEP after a 30 min
saturating incubation with Alexa-647 conjugated transferrin
(Alexa-Tf). Every TfR-mCh-SEP-positive endosome in spines
became labeled with Alexa-Tf, indicating that intra-spine endo-
somes actively participate in ongoing recycling (Figure S1E).
These data demonstrate that a large population of dendritic
spines harbor one or more REs engaged in ongoing endocytic
membrane trafficking.
AMPA Receptors Traffic through Spine-LocalizedRecycling EndosomesTo establish whether endogenous postsynaptic membrane
proteins are trafficked through spine REs, we performed live-
cell antibody feeding with an antibody directed against an
N-terminal extracellular epitope of the GluR1 AMPA receptor.
Live hippocampal neurons cotransfected with GFP and TfR-
mCh (DIV 20-25) were incubated with anti-GluR1 for 3 hr at
37�C prior to fixation. Anti-GluR1 remaining at the cell surface
was blocked with an unlabeled secondary antibody prior to per-
meabilization and labeling with Alexa647-conjugated secondary
antibody to reveal internalized anti-GluR1 (Figure 1B). We
observed that 85 ± 2% of spines containing TfR-mCh-labeled
REs were also positive for internalized GluR1, while only 9 ± 4%
of spines lacking TfR-mCh were positive for internalized GluR1
(Figures S1H and S1I). These TfR-negative compartments may
represent GluR1-positive late endosomes (Ehlers, 2000).
We also tested whether exogenously expressed GluR1 was
trafficked through spine REs by cotransfecting hippocampal
neurons (DIV 20-25) with TfR-mCh and SEP-GluR1. Upon appli-
cation of 50 mM NH4Cl, we observed an increase in SEP-GluR1
signal that colocalized with spine REs in 42 ± 1% of endosome-
containing spines, indicating that exogenously expressed SEP-
GluR1 also traffics through spine REs, although much less effi-
ciently than endogenous GluR1 (Figures S1G and S1H). Only
8 ± 4% of spines lacking TfR-mCh displayed an NH4Cl-depen-
dent increase in SEP-GluR1 (Figure S1I). Together, these find-
ings demonstrate that internalized AMPA receptors are actively
transported through spine REs.
Activity Triggers Exocytosis of Spine EndosomesAdjacent to the Postsynaptic DensityTo assay whether endosomal compartments in spines are
responsive to neuronal activity, we bathed neurons in Mg2+-
free solution containing 200 mM glycine, 30 mM bicuculline (Bic/
Gly solution) for 5 min to increase total network activity. During
and following incubation in Bic/Gly solution, intra-spine endo-
somes fused with the spine PM in large, dramatic exocytic
events (Figure 1C and Movie S1). Exocytic events were charac-
terized by a burst of SEP fluorescence indicating fusion, followed
by a decline of SEP fluorescence with concomitant decay of
mCh signal, interpreted as diffusion of newly inserted material
away from the site of exocytosis (Figure 1C and Figure 2 and
Movie S2). The frequency of spontaneous spine fusion events
in the absence of Bic/Gly was low and increased several
fold during and in the minutes following Bic/Gly exposure (Fig-
ure 1D). Nearly one third of dendritic spines containing a RE
exhibited exocytosis following stimulation (30 ± 6%). To deter-
mine where exocytosis occurs in relation to the synapse, we
performed high resolution imaging of neurons expressing
TfR-SEP along with PSD-95-mCh to mark the location of the
Cell 141, 524–535, April 30, 2010 ª2010 Elsevier Inc. 525
A B
mChSEP
extracellular (pH 7.4)
cytoplasmic
lumenal (pH~5.5)
mCh
SEPTfR-mCh-SEP
SEP mCh
0 10 200
4
8
time (min)
stneve cityc
oxe fo #
D TfR-mCh-SEP
PSD95-mCh TfR-SEP
iii
-1:00-2:30 -1:30 0:30-0:30 0:00-2:00 1:00 1:30 2:00
0:00 0:12 0:24 0:36 0:48 1:00 1:12-0:12-0:24
C
s021
E F
TfR-mCh-SEP
TfR-mCh intGluR1 merge
Figure 1. Activity Triggers Exocytic Fusion of Spine Endosomes at Sites Lateral to the PSD
(A) Schematic diagram of a dual color reporter for postsynaptic exocytosis. Transferrin receptor fused to mCherry (mCh) and superecliptic pHluorin (SEP) allows
simultaneous visualization of total (mCh) and plasma membrane (SEP) TfR molecules. The lower panel shows a single confocal plane of a stretch of dendrite from
a hippocampal neuron expressing TfR-mCh-SEP. Note the plasma membrane localization of the SEP signal (arrows) and the endosomal compartments in the red
channel (arrowheads). The scale bar represents 4 mm.
(B) Spines harbor AMPA receptor-containing recycling endosomes (RE). Endosomes were observed in 56% of spines visualized with TfR-mCh-SEP (top panel).
Live-cell antibody feeding with anti-GluR1 for 3 hr revealed internalized endogenous GluR1 (intGluR1) in 85 ± 2% of spine REs (bottom panels). The scale bar
represents 1 mm.
(C) Intra-spine recycling endosomes visualized with TfR-mCh-SEP fuse with the spine PM (arrows) following stimulation with Bic/Gly. Two examples are shown.
Two-color z stacks were acquired every 30 s and projected in 2 dimensions with the first frame of exocytosis assigned t = 0. Time is in min:sec. The scale bar
represents 1 mm.
(D) Frequency of spine exocytosis increases with activity. Histogram analysis of spine exocytic events before, during, and following a 5 min treatment with Bic/Gly
solution (horizontal bar). Data is binned in 30 s intervals. n = 160 spine exocytic events from 22 cells.
(E) Exocytosis occurs adjacent to the PSD. Cells expressing TfR-SEP (green) and the postsynaptic density marker PSD-95-mCh (red) were imaged following
stimulation with Bic/Gly. Discrete spine exocytic events (white arrows) occurred adjacent to, but not directly overlapping, the PSD. Three representative events
are shown. Time is in min:sec. The scale bar represents 1 mm.
(F) Kymograph analysis of TfR-SEP insertion adjacent to the PSD. Pixel intensity for the red (PSD95-mCh) and green channels (TfR-SEP) was measured along the
line shown in (E) (last frame, top row). See also Figure S1 and Movie S1.
PSD. Nearly all spine fusion events (97%, n = 42) occurred within
300 nm of the edge of the PSD with little overlap between newly
inserted TfR-SEP and PSD-95-mCh signal (Figures 1E and 1F
and Movie S1). The average center-to-center distance between
newly inserted TfR-SEP and PSD95-mCh was 361 ± 46 nm.
Together, these findings demonstrate that stable REs in spines
undergo abrupt, activity-dependent fusion that delivers exocytic
cargo, including AMPA receptors, to the spine PM in close prox-
imity to the PSD.
526 Cell 141, 524–535, April 30, 2010 ª2010 Elsevier Inc.
Recycling Endosomes Fuse with the Spine PlasmaMembrane in an All-or-None MannerSince exocytosis occurs at domains lateral to the PSD, we
wondered how fast newly inserted molecules could become
available to the synapse, and what fraction of endosomal cargo
is inserted into the spine PM. To address these questions, we
performed rapid time-lapse imaging of spine RE exocytosis in
neurons expressing TfR-mCh-SEP following stimulation with
Bic/Gly. In the first frame when fusion was detected by a burst

-0.4 sec 0 0.4 0.8 1.2 1.6 2.0 2.4A
spin
e m
Cher
ry/S
EP ra
tio
2.0
1.5
1.0
0.5
0 10 20 30time (s)
C
0 15 30time (s)
1
1
2
SEP
mCh
SEP
B
0.4
0.8
1.2
0
spin
e m
Cher
ry/S
EP ra
tio
Pre
Post
60s
D1.0
0.2
0.6
0 2010 30
norm
aliz
ed in
tens
ity
time (s)
E
1
2
mCh
SEP
merge
TfR-mCh-SEP
2
1
0 2010 30time (s)
PSD PSD
norm
aliz
ed in
tens
ity 1.0
0
0.5
spine
shaft
τ =0.6 s1
τ =14 s2
F
Figure 2. Spine Exocytosis Occurs In an All-or-None Manner
(A) Rapid two-color imaging of TfR-mCh-SEP showing stimulus-induced fusion of a recycling endosome at the spine PM (arrowheads). The scale bar represents
1 mm.
(B) Kinetics of TfR-mCh-SEP signal decay and diffusional loss following exocytosis in spines. The integrated fluorescence intensity was measured for mCh
(red trace) and SEP (green trace) at the site of membrane fusion (inset, circle 1) and at a nonoverlapping region adjacent to the initial fusion site in the same spine
(inset, circle 2; lower green trace). The scale bar represents 0.5 mm.
(C) The average SEP signal (red trace) for several exocytic events was fit with a double exponential function to yield the time constant for cargo release from the
exocytic site (t1 = 0.6 ± 0.2 s) and subsequent exit from the spine head (t2 = 14 ± 2 s). A model for spine exocytosis is shown in the inset.
(D) Newly inserted cargo diffuses out of the spine head. TfR-SEP intensity was monitored in the spine head (red) and in the dendritic shaft (blue) immediately
adjacent to the spine neck. The traces represent the average of 5 spine exocytic events.
(E) The ratio of mCh intensity to SEP intensity (mCh/SEP) was measured before and after spine exocytosis at region 1 (inset). The mCh/SEP ratio abruptly
decreases upon exocytosis and remains near the empirically measured mCh/SEPneut (dashed blue line). The red trace represents mCh/SEP at region 2 away
from the fusion site (inset).
(F) The value of mCh/SEP before, immediately after, and 60 s after membrane fusion compared to mCh/SEPneut (dashed blue line) for several exocytic events.
See also Movie S2.
in SEP signal, the mCh signal remained unchanged compared
to its pre-exocytosis value indicating that spine endosomes
do not immediately collapse into the spine PM, but rather
release cargo from the site of insertion over a period of several
hundred milliseconds (Figures 2A–2C and Movie S2). As signal
decayed from the original site of exocytosis, SEP and mCh
intensity increased at adjacent sites within the spine head,
suggesting that the initial, fast phase of fluorescence decay
(t1 = 0.6 ± 0.2 s) represents cargo escape from the insertion
domain (Figures 2B and 2C). At later time points, SEP and
mCh fluorescence intensity decayed with identical kinetics
(t2 = 14 ± 2 s) at both the fusion site and adjacent membrane
domains, consistent with diffusion of TfR-mCh-SEP out of the
spine head (Figure 2B). Following spine exocytosis we observed
a delayed accumulation of SEP signal in the adjacent dendritic
shaft (Figure 2D).
To determine the fraction of RE cargo that is released to
the PM upon exocytosis, we took advantage of the intrinsic
mCh/SEP fluorescence ratio of our reporter at neutral pH
(mCh/SEPneut) (Figure S1C). If a fraction of the reporter remains
within endosomes, the mCh/SEP ratio will be greater than the
ratio measured at neutral pH (mCh/SEPneut), since the low pH
environment of the endosome quenches SEP fluorescence
with little effect on mCh fluorescence. Under our specific
imaging conditions (laser intensities, EM-CCD gain and integra-
tion times) we determined mCh/SEPneut to be 0.42 ± 0.02 (Fig-
ure S1C, see Experimental Procedures for details). To measure
the fractional release of RE cargo, we thus monitored mCh/
SEP ratio at the site of endosomal fusion. Prior to exocytosis,
mCh/SEP was much greater than mCh/SEPneut, but abruptly
dropped to a value very near mCh/SEPneut upon membrane
fusion (Figure 2E), indicating that the entire complement of
Cell 141, 524–535, April 30, 2010 ª2010 Elsevier Inc. 527
1.0
0
-1.0
-10 0 20 3010time (s)
B
C D
N
orm
aliz
ed s
pine
int
ensi
ty
SEP-GluR1
TfR-mCh
merge
-1.5 sec -1.0 -0.5 0 0.5 1.0 1.5 2.0
SEP-GluR1
TfR-mCh
time (s)
SEP-GluR1
TfR-mCh
mChSEP
A 165.5
-10 0 20 3010Pre-exocytosis
-NH C
l4
+NH C
l4
1.0
-1.0
0
SEP-GluR1TfR-mCh
TfR-mCh-SEP
Post-exocytosis
Pre-exoctosis
Post-exocytosis
N
orm
aliz
ed
spin
e in
tens
ity
-NH Cl4 +NH Cl4
-NH C
l4
+NH C
l4
0
1
2
Spin
e in
tens
ity (n
orm
aliz
ed)
0.5
1.5
0
1
2
Spin
e in
tens
ity (n
orm
aliz
ed)
0.5
1.5
TfR-mCh
SEP-GluR1 TfR-mChSEP-GluR1
5s
E*
Retained
Non-retained
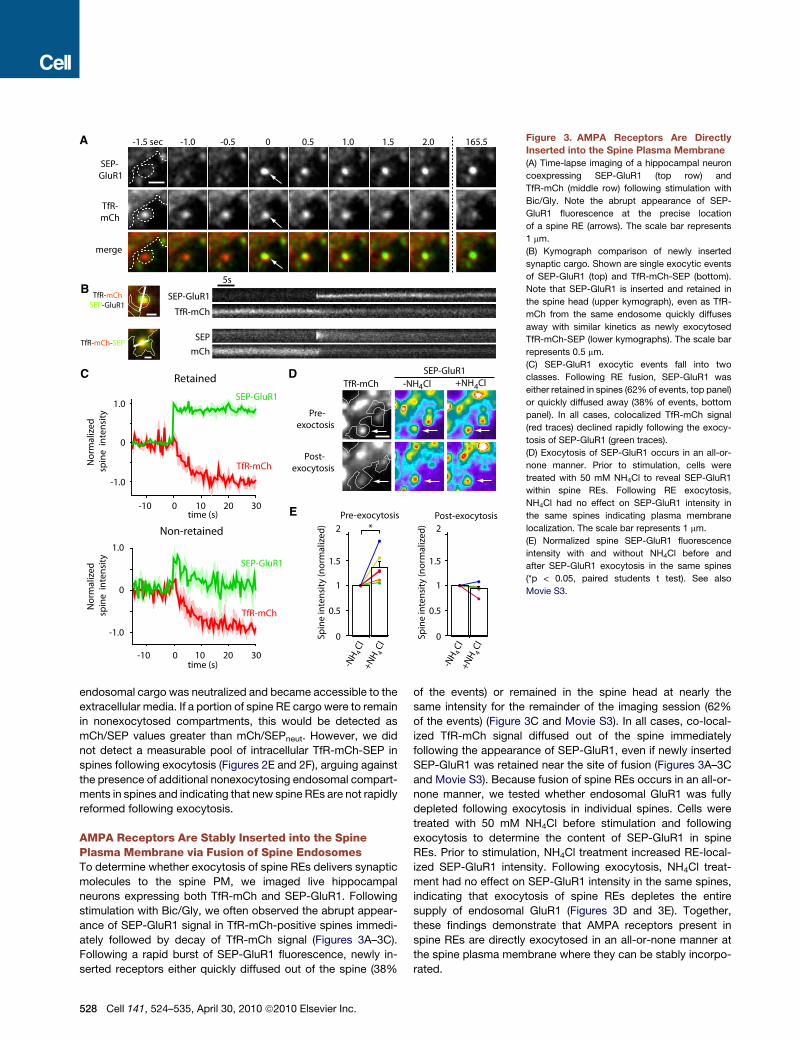
Figure 3. AMPA Receptors Are Directly
Inserted into the Spine Plasma Membrane
(A) Time-lapse imaging of a hippocampal neuron
coexpressing SEP-GluR1 (top row) and
TfR-mCh (middle row) following stimulation with
Bic/Gly. Note the abrupt appearance of SEP-
GluR1 fluorescence at the precise location
of a spine RE (arrows). The scale bar represents
1 mm.
(B) Kymograph comparison of newly inserted
synaptic cargo. Shown are single exocytic events
of SEP-GluR1 (top) and TfR-mCh-SEP (bottom).
Note that SEP-GluR1 is inserted and retained in
the spine head (upper kymograph), even as TfR-
mCh from the same endosome quickly diffuses
away with similar kinetics as newly exocytosed
TfR-mCh-SEP (lower kymographs). The scale bar
represents 0.5 mm.
(C) SEP-GluR1 exocytic events fall into two
classes. Following RE fusion, SEP-GluR1 was
either retained in spines (62% of events, top panel)
or quickly diffused away (38% of events, bottom
panel). In all cases, colocalized TfR-mCh signal
(red traces) declined rapidly following the exocy-
tosis of SEP-GluR1 (green traces).
(D) Exocytosis of SEP-GluR1 occurs in an all-or-
none manner. Prior to stimulation, cells were
treated with 50 mM NH4Cl to reveal SEP-GluR1
within spine REs. Following RE exocytosis,
NH4Cl had no effect on SEP-GluR1 intensity in
the same spines indicating plasma membrane
localization. The scale bar represents 1 mm.
(E) Normalized spine SEP-GluR1 fluorescence
intensity with and without NH4Cl before and
after SEP-GluR1 exocytosis in the same spines
(*p < 0.05, paired students t test). See also
Movie S3.
endosomal cargo was neutralized and became accessible to the
extracellular media. If a portion of spine RE cargo were to remain
in nonexocytosed compartments, this would be detected as
mCh/SEP values greater than mCh/SEPneut. However, we did
not detect a measurable pool of intracellular TfR-mCh-SEP in
spines following exocytosis (Figures 2E and 2F), arguing against
the presence of additional nonexocytosing endosomal compart-
ments in spines and indicating that new spine REs are not rapidly
reformed following exocytosis.
AMPA Receptors Are Stably Inserted into the SpinePlasma Membrane via Fusion of Spine EndosomesTo determine whether exocytosis of spine REs delivers synaptic
molecules to the spine PM, we imaged live hippocampal
neurons expressing both TfR-mCh and SEP-GluR1. Following
stimulation with Bic/Gly, we often observed the abrupt appear-
ance of SEP-GluR1 signal in TfR-mCh-positive spines immedi-
ately followed by decay of TfR-mCh signal (Figures 3A–3C).
Following a rapid burst of SEP-GluR1 fluorescence, newly in-
serted receptors either quickly diffused out of the spine (38%
528 Cell 141, 524–535, April 30, 2010 ª2010 Elsevier Inc.
of the events) or remained in the spine head at nearly the
same intensity for the remainder of the imaging session (62%
of the events) (Figure 3C and Movie S3). In all cases, co-local-
ized TfR-mCh signal diffused out of the spine immediately
following the appearance of SEP-GluR1, even if newly inserted
SEP-GluR1 was retained near the site of fusion (Figures 3A–3C
and Movie S3). Because fusion of spine REs occurs in an all-or-
none manner, we tested whether endosomal GluR1 was fully
depleted following exocytosis in individual spines. Cells were
treated with 50 mM NH4Cl before stimulation and following
exocytosis to determine the content of SEP-GluR1 in spine
REs. Prior to stimulation, NH4Cl treatment increased RE-local-
ized SEP-GluR1 intensity. Following exocytosis, NH4Cl treat-
ment had no effect on SEP-GluR1 intensity in the same spines,
indicating that exocytosis of spine REs depletes the entire
supply of endosomal GluR1 (Figures 3D and 3E). Together,
these findings demonstrate that AMPA receptors present in
spine REs are directly exocytosed in an all-or-none manner at
the spine plasma membrane where they can be stably incorpo-
rated.

A BGFP GFP-homer-1c + Surface Stx4-HAanti-Stx4 GFP anti-Stx4
0 0.4 0.8-0.4
distance from cleft (μm)
)selcitrap t necr ep( yti s ned gnil ebal
F
normalized tangential distance
0 0.5 1.00
0.4
)dezilamr on( ycneuqerf gnil ebal
0.8
1.2PSD
0
1
tang. distance
E
20
Stx4 Stx1
10
S
P
S
P
PS
S
P
P S
PS
CTfR-SEPStx1Stx2Stx3Stx4
DStx1 Stx2
Stx3 Stx4
G
Stx1
Stx2
Stx3
Stx4
oitar er p/ts oP
H
1
2
3
4
5
0 0.5 1.0 1.5 2.0
1.0
0.6
0.2Cum
ulat
ive
frac
tion
Spine/shaft intensity
0.4
0.8
Pre Post
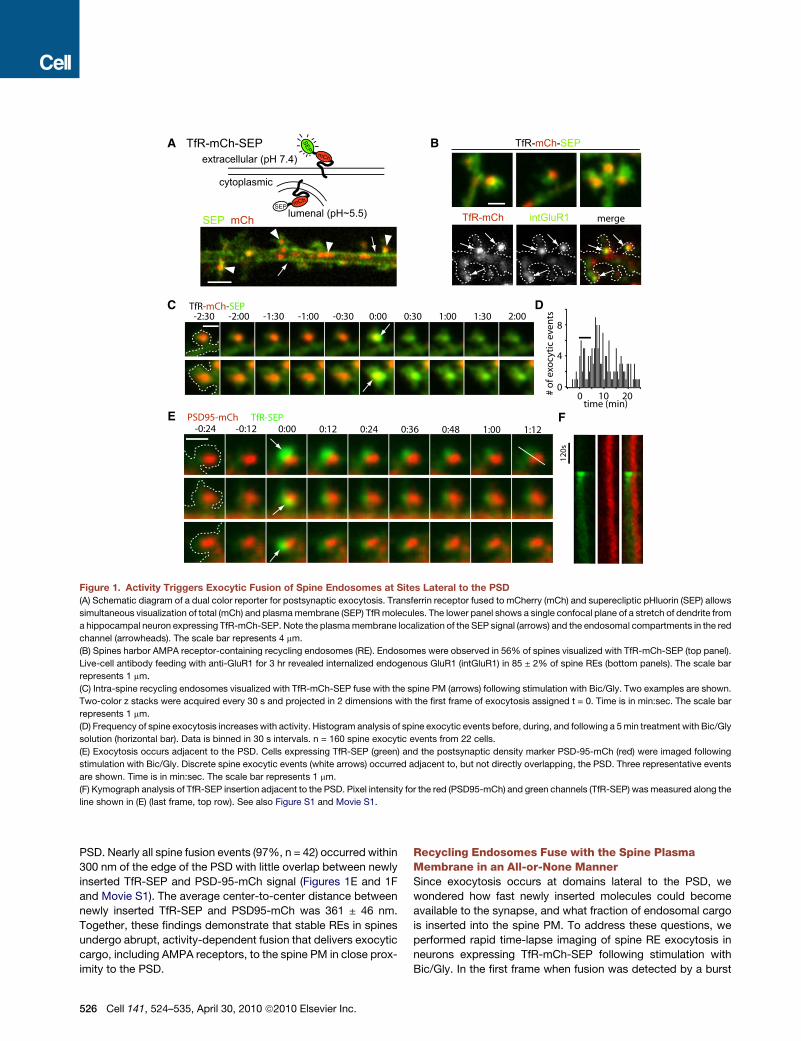
Figure 4. Syntaxin 4 Localizes to Lateral
Spine Domains
(A) Subcellular localization of Stx4 in neurons.
Hippocampal neurons (DIV18) expressing GFP
as a cell fill (green) were stained with an antibody
against Stx4 (red). Right panels show several
examples of Stx4 label in dendritic spines. The
scale bars represent 5 mm, left panel; 1 mm, right
panels.
(B) Surface labeling of Stx4-HA. Hippocampal
neurons expressing GFP-homer1c (green) and
Stx4-HA (red) were fixed and incubated with anti-
HA under nonpermeabilizing conditions to label
surface Stx4. The scale bar represents 1 mm.
(C) Stx4 is enriched in spines. Neurons expressing
HA-tagged Stx1-4 were surface labeled with anti-
HA antibody. Arrows indicate spine-enriched
Stx4-HA. Dashed lines indicate the cell outline.
The scale bar represents 1 mm.
(D) Cumulative distribution of spine/shaft ratios for
surface labeled syntaxins 1-4. TfR-SEP served
as a control for an evenly distributed membrane
protein. (n = 160, 122, 130, 210 spine/dendrite
pairs from at least 5 different cells for Stx1-4,
respectively).
(E) Pre-embedding immunogold labeling of adult
rat hippocampus with anti-Stx4 and anti-Stx1.
Representative examples of Stx4 (left) and Stx1
(right) labeling (arrows) are shown. Abbreviations:
p, presynaptic terminal; s, spine. The scale bars
represent 200 nm.
(F) Quantitative analysis of Stx4 distribution at
asymmetric synapses. The distance of individual
gold particles from the synaptic cleft was
measured with negative and positive values repre-
senting particles at presynaptic and postsynaptic
sites, respectively. n = 115 particles.
(G) Postsynaptic-to-presynaptic ratios of endoge-
nous plasma membrane syntaxins at asymmetric
synapses determined by immunogold labeling. The total number of postsynaptic gold particles was divided by the total number of presynaptic gold particles.
(n = 97, 70, 95, 115 synaptic particles for syntaxins 1–4 respectively).
(H) Stx4 concentrates at lateral spine domains. Shown is the normalized tangential distance of postsynaptic Stx4 labeling along the plasma membrane from the
edge of the PSD (0) to the most distant point from the PSD along the spine plasma membrane (1). See also Figure S2.
Syntaxin 4 Is a Postsynaptic t-SNARE at GlutamatergicSynapsesTo identify the molecular basis for postsynaptic membrane
fusion, we searched for SNARE proteins expressed in brain that
localize near the postsynaptic PM. Of the four PM syntaxins,
Stx1 and Stx4 are expressed at high levels in the brain (Allen Brain
Atlas, http://www.brain-map.org). Stx1 localizes presynaptically
where it mediates synaptic vesicle exocytosis. The function(s)
of Stx4 in brain is unknown. Immunolabeling of rat brain sections
with antibodies against Stx4 revealed widespread Stx4 protein
expression throughout the brain including hippocampus and
neocortex (Figure S2A). Biochemical fractionation revealed both
Stx1 and Stx4 in synaptosome fractions from adult mouse brain
(Figure S2B). Consistent with previous studies (Takamori et al.,
2006), Stx1 was abundant in synaptic vesicle fractions, while
Stx4 was largely absent from this fraction (Figure S2B). Thus,
Stx4 is present in synaptic fractions but not synaptic vesicles.
To examine the subcellular distribution of Stx4 in neurons,
we performed immunocytochemical labeling of hippocampal
neurons, which revealed a punctate distribution of Stx4
throughout the somatodendritic compartment (Figure 4A) in
agreement with previous studies in nonneuronal cells (Low
et al., 2006; Sieber et al., 2007). Stx4 clusters often localized to
dendritic spines (Figure 4A), and most dendritic spines contained
at least one punctate spot of Stx4 in the spine head or spine
neck. To allow selective visualization of Stx4 at the plasma
membrane, we expressed Stx4 fused to an extracellular HA tag.
Surface labeling revealed that Stx4-HA puncta were in close
proximity, but seldom overlapped with the PSD marker homer1c
(Figure 4B). Centroid analysis revealed an average separation of
356 ± 41 nm between spine Stx4 clusters and the center of the
PSD, a value nearly identical to the distance between newly
inserted TfR-SEP and the center of the PSD (361 ± 46 nm). Out
of all PM syntaxins, only Stx4-HA was enriched in spines with
clusters at the PM of nearly every dendritic spine (95 ± 4%)
(Figures 4C and 4D).
To determine whether endogenous Stx4 resides postsynapti-
cally in vivo, we performed immunogold electron microscopy
Cell 141, 524–535, April 30, 2010 ª2010 Elsevier Inc. 529

A
Stx4-HATfR-SEP
-3 0 3 6 9-6-9 sec 12E
i
0-0.3-0.6-0.9 0.3 0.6 0.9 1.2 1.5
Stx4
-HA
TfR-
SEP
F -labeled anti-HA
SNARE complex
TfR-SEP
F
TfR-SEP
Stx4-HA
Stx4-HA
TfR-SEP
C Raw
100nm
Stx4
TfR-SEP
D
500 nm
merge
G
TfR-SEP
Stx4-HA
B
HA
HA
fusion
0 15-6sec 120
merge
ab
30s
Figure 5. Stx4 Marks Sites of Exocytosis at
the Spine Membrane
(A) Schematic diagram illustrating the method of
labeling surface Stx-HA using anti-HA antibody
and Cy3-conjugated monovalent anti-mouse Fab
fragments together with visualization of exocytic
events using TfR-SEP.
(B) Exocytosis of RE cargo occurs at Stx4 clusters.
TfR-SEP (top row) and surface Stx4-HA (middle
row) signals were imaged during spontaneous
TfR-SEP exocytic events in COS7 cells. The scale
bar represents 500 nm.
(C) Stx4 clusters and TfR-SEP signal were fit with
a 2-dimensional Gaussian function to determine
their relative centroid positions. Raw data (left)
and 2-D Gaussian fits (right) are shown. Scale
bar, 500 nm. The graph plots the centroid separa-
tion for each paired TfR-SEP/Stx4 event (asterisks)
with the Stx4 cluster held as the origin for 14
different exocytic events. The mean centroid sepa-
ration was 83 ± 11 nm.
(D) Labeled Stx4 clusters are mobile. Trajectories
of four different surface labeled Stx4 clusters
preceding (red), during (filled green circle) and
following (blue) TfR-SEP exocytosis over 7.6, 7.6,
5.6, and 14.4 s intervals (from left to right).
(E) Newly inserted TfR-SEP colocalizes with Stx4
clusters in spines. Hippocampal neurons express-
ing TfR-SEP (top row) and Stx4-HA were labeled
with anti-HA antibody and Cy3-conjugated anti-
mouse Fab fragments to mark surface clusters of
Stx4 (middle row) as in (B). Discrete exocytic
events occur at pre-existing clusters of surface
Stx4 (arrows). The scale bar represents 1 mm.
(F) Spatial distribution of surface Stx4 and newly
inserted TfR-SEP in dendritic spines. Signals for
TfR-SEP (green) and Stx4 (red) were binarized by
thresholding the images at 20%–30% above back-
ground for 10 different spine exocytic events. The
scale bar represents 1 mm.
(G) Kymograph analysis of TfR-SEP insertion
(green) at the labeled Stx4 cluster (red) shown in
the top panels. Note the coalescence of the Stx4
cluster (bracket, top kymograph) preceding
exocytosis. See also Figure S3 and Movie S4.
(EM) focusing on stratum radiatum of area CA1 of rat hippo-
campus, using antibodies against all plasma membrane syntax-
ins (1–4). Stx4 label was often found near the spine membrane at
sites lateral to the PSD (Figures 4E and 4F). Occasional labeling
was observed presynaptically, but quantitative analysis revealed
a 4-fold postsynaptic enrichment of Stx4 (Figures 4F and 4G). In
contrast, Stx1 immunogold labeling was enriched 2-fold in
presynaptic compartments, while Stx2 and Stx3 were evenly
distributed between the pre and postsynaptic compartments
(Figure 4G and Figure S2C). Analysis of the tangential distribution
of postsynaptic Stx4 signal along the spine PM revealed a strong
peak of labeling in lateral domains (Figure 4H) consistent with
Stx4 enrichment just outside of the PSD.
Spine Exocytosis Occurs at Syntaxin-4 ClustersTo assess whether exocytosis of recycling cargo occurs at Stx4
clusters, we labeled surface Stx4-HA and monitored insertion
of TfR-SEP in COS7 cells. Surface Stx4-HA was visualized by
530 Cell 141, 524–535, April 30, 2010 ª2010 Elsevier Inc.
sequential incubation with anti-HA and a monovalent goat
anti-mouse Fab conjugated to Cy3 (Figure 5A). Surface-labeled
Stx4 appeared as small mobile clusters (Figure S3 and Movie
S5) that recovered rapidly when a small region of the cell was
photobleached (Figure S4E). When we used Cy3-conjugated
whole IgG to label surface Stx4 in live cells, we observed large,
immobile aggregates that failed to recover when a small region
of the cell was photobleached (Figures S4D and S4E and Movie
S5) due to crosslinking induced by the bivalent IgG.
To test if exocytosis occurs directly at Stx4 clusters, we coex-
pressed Stx4-HA with TfR-SEP in COS7 cells and visualized
surface Stx4 while monitoring spontaneous delivery of TfR-
SEP to the PM (Figures 5B–5D). For the majority of exocytic
events observed (16/26), newly appearing TfR-SEP signal tightly
colocalized with Stx4 clusters (Figures 5B and 5C and Movie S4).
These events were rapid, small, and occurred either directly at or
within diffraction-limited proximity to Stx4-HA. High-resolution
analysis revealed an average centroid separation of newly

appearing TfR-SEP spots and Stx4-HA clusters of 83 ± 11 nm
(Figure 5C). Interestingly, Stx4-HA clusters exhibited small
lateral displacements in the membrane that slowed or ceased
immediately prior to an exocytic event (Figure S3 and Movie
S4), consistent with a physical association with v-SNAREs on
the incoming endosome immediately prior to fusion. Further-
more, Stx4 cluster intensity increased in the seconds preceding
exocytosis, likely indicating local recruitment of Stx4 molecules
and engagement of the SNARE complex (Figure S3).
Given that Stx4 is present in spines near glutamatergic
synapses (Figure 4), we asked whether spine exocytic events
occur at dedicated domains containing Stx4. To this end, we
performed two-color time-lapse imaging of hippocampal
neurons expressing Stx4-HA and TfR-SEP, visualizing surface
Stx4 labeled using anti-HA antibody and exocytic events by
SEP fluorescence. During live imaging, we observed the sudden
appearance of bright TfR-SEP puncta that overlapped with
labeled Stx4 in individual spines (Figures 5E–5G and Movie
S4). These events were intermittent, rapid, and occurred within
diffraction-limited proximity to Stx4-HA (Figures 5F and 5G).
High-resolution analysis revealed an average centroid separa-
tion of newly appearing TfR-SEP spots and Stx4-HA clusters
of 158 ± 31 nm at the time of membrane fusion. Following the
sudden appearance of TfR-SEP spots, the bright fluorescence
dispersed away from Stx4-HA clusters, diffusing out of the spine
(Figure 5G and Movie S4). In many cases we observed coales-
cence of the Stx4 signal a few seconds before exocytosis (Fig-
ure 5G and Figures S3B and S3C). Together, these results
demonstrate that recycling endosome fusion occurs at concen-
trated zones of Stx4 in dendritic spines, indicating that Stx4
defines a SNARE-based exocytic domain for rapid modification
of the spine membrane.
Syntaxin 4 Mediates Activity-Triggered Exocytosisin Dendrites and SpinesTo test whether Stx4 is required for activity-triggered postsyn-
aptic exocytosis, we first knocked down endogenous Stx4 using
shRNA (Figures S4A–S4C) and measured activity triggered
exocytosis. Hippocampal neurons were transfected with Stx4
shRNA or a scrambled shRNA control along with TfR-SEP as a
reporter for exocytosis for 72–96 hr, a time when Stx4 has been
reduced to 25%–30% of its original level (Figure S4). For neurons
expressing scrambled shRNA, stimulation with Bic/Gly trigged
a robust increase in surface TfR-SEP signal on dendrites and
spines that was blocked by the NMDA receptor antagonist APV
(Figures 6A and 6B). The activity-induced increase in surface
TfR-SEP was nearly completely blocked in cells expressing either
one of two shRNA constructs directed against Stx4 (Figure 6A).
As an alternative strategy, we used a dominant negative
approach to disrupt Stx4 function by expressing a soluble frag-
ment of Stx4 consisting of its cytoplasmic domain (amino acids
1–273) but lacking the transmembrane domain (Stx4DTM).
Soluble Stx4DTM forms cognate SNARE complexes but is not
associated with the membrane, and thus disrupts Stx4-depen-
dent trafficking (Olson et al., 1997). We expressed either mCh
alone or mCh fused to Stx4DTM along with TfR-SEP as a reporter
for exocytosis in dendrites and spines for 24–48 hr. When
mCh-Stx4DTM was coexpressed with TfR-SEP, we observed a
much slower, smaller, and delayed accumulation of TfR-SEP on
the PM, reaching a maximum steady state level of approximately
20% over initial surface TfR-SEP prior to stimulation (Figure 6B).
Quantitative analysis revealed an 85 ± 6% inhibition of TfR-SEP
surface accumulation at 3 min following stimulation and
62 ± 7% at 15 min following stimulation. The effect of Stx4DTM
was specific, as expression of a soluble fragment of the related
PM syntaxins, Stx1 and Stx3 (Stx1DTM and Stx3DTM), had no
effect on activity-induced TfR-SEP insertion (Figure 6C).
Because knocking down Stx4 with shRNA or overexpressing
mCh-Stx4DTM for extended times could have unanticipated
secondary effects, we developed a method to selectively and
rapidly disrupt Stx4 on the PM using IgG-induced crosslinking
(Figures S4D and S4E, Movie S5). Whereas Bic/Gly induced
exocytosis from recycling endosomes in neurons expressing
Stx4-HA, acute application of anti-HA antibody followed by anti-
mouse IgG 5 min prior to stimulation significantly reduced post-
synaptic exocytosis (Figure 6D). This effect was selective in that
application of control anti-Myc antibodies followed by anti-mouse
IgG had no effect on activity-induced exocytosis (Figure 6D).
Since most Stx4 on the cell surface is complexed in small
homo-oligomeric clusters, it is likely that this method disrupts
both exogenous Stx4-HA and endogenous Stx4 co-mingled in
oligomeric clusters (Low et al., 2006; Sieber et al., 2006). Thus,
as with more prolonged manipulations, acute disruption of Stx4
blocks activity-induced exocytosis in dendrites and spines.
We tested if Stx4 mediates the discrete exocytic events we
observed in spines by counting the number of spine events
over a 20 min time window upon stimulation with Bic/Gly. Dis-
rupting Stx4 function by either expressing Stx4DTM or by Stx4
shRNA decreased the number of spine exocytic events nearly
three-fold (Figure 6E). Moreover, in accordance with a role in
spine RE fusion, blocking Stx4 function led to an accumulation
of endosomes in spines (Figures 6F and 6G). These results
demonstrate that Stx4 is a central component of the SNARE
machinery that mediates rapid, activity-dependent fusion of
REs in dendritic spines.
Stx4 Is Required for Long-Term Potentiationin CA1 HippocampusTo test the physiological consequences of Stx4-dependent
cargo insertion on synaptic plasticity, we performed whole cell
voltage-clamp recordings of evoked synaptic currents in CA1
pyramidal neurons in acute hippocampal slices. Recombinantly
expressed and purified Stx4DTM or Stx3DTM protein (Figure S5)
was acutely introduced into neurons via the recording pipette,
and allowed to diffuse into the cytoplasm for 8–10 min following
break-in and establishment of whole cell mode. Synaptic
strength was monitored every 10 s during this baseline period
by recording Schaffer collateral-evoked excitatory postsynaptic
currents (EPSCs), after which LTP was induced by depolarizing
the cell to 0 mV and delivering 200 stimuli at 2 Hz. Using standard
intracellular solution, this induction protocol reliably triggered
robust sustained potentiation of EPSC amplitudes to 172 ±
18% of baseline (Figure 7A). However, LTP was almost
completely abolished (EPSC amplitudes 111 ± 19% of baseline)
when purified Stx4DTM (2.5 mM) was included in the recording
solution (Figure 7). In contrast, LTP was unaffected (174 ± 15%
Cell 141, 524–535, April 30, 2010 ª2010 Elsevier Inc. 531

0
0.10.2
0.3
0.4
0 10 20time (min)
A B C
D
0
5
10
% s
pin
es w
ith
dis
cret
e ev
ent
0.1
0
0.2
0.3
0.4
E
% s
pin
es w
ith
RE
0
20
40
60
F
mits ts
op
nim 5
GFP TfR-mCh
GFP-Stx4ΔTM TfR-mCh
mChmCh-Stx4ΔTMmCh+ APV
ΔF/
F 0
ΔF/
F 0
Stx4
ΔTMGFPSt
x3ΔTM
Stx1
ΔTM
0.10
0.15
0.05
0
-Ab
+HA Ab
0.20
0.25
+Myc
Ab
ΔF/
F 05
min
po
st s
tim
15
Stx4
ΔTM
mCh
Stx3
ΔTM
Stx1
ΔTM
Stx4
ΔTM
mCh
Stx3
ΔTM
Stx1
ΔTM
*
*
**
*
**
*
Scr
shRN
A#1sh
RNA#3
**
ScrStx4 shRNA#1Stx4 shRNA#3
0
0.1
0.2
0.3Δ
F/F 0
0 10 20time (min)
G
Scr
shRN
A#1sh
RNA#3
**
**
*
Figure 6. Disrupting Stx4 Inhibits Activity-Triggered Postsynaptic Exocytosis
(A) Stx4 knock down blocks TfR-SEP insertion following stimulation with Bic/Gly. The fractional increase in TfR-SEP fluorescence (DF/F0) was monitored in
hippocampal neurons expressing two different shRNAs against Stx4 (shRNA#1, shRNA#3) or a scrambled control shRNA (Scr) along with TfR-SEP. Bic/Gly
treatment is indicated by the horizontal bar. Error bars represent SEM. n = 6, 9, 10 for shRNA#1, shRNA#3, and Scr, respectively.
(B) Soluble Stx4 blocks TfR-SEP insertion following stimulation with Bic/Gly. Total TfR-SEP fluorescence was monitored in hippocampal neurons expressing mCh
or mCh-Stx4DTM. Bic/Gly treatment is indicated by the horizontal bar. Error bars represent SEM. n = 9 cells for each condition.
(C) Postsynaptic exocytosis is blocked by Stx4DTM. TfR-SEP insertion was measured on the dendrites of cells expressing mCh, mCh-Stx1DTM, mCh-Stx3DTM,
or mCh-Stx4DTM five minutes following stimulation with Bic/Gly. Error bars represent SEM. n = 6, 8, 9, 9 cells respectively, *p < 0.05 Student’s t test.
(D) Acute disruption of Stx4 blocks postsynaptic exocytosis. Hippocampal neurons expressing Stx4-HA were incubated with either mouse anti-HA or control
anti-Myc antibodies, followed by anti-mouse IgG to acutely crosslink and aggregate Stx4-HA. Error bars represent SEM. n = 7, 6, 9 cells respectively;
*p < 0.05, Student’s t test.
(E) Stx4 mediates exocytosis in dendritic spines. The total number of TfR-SEP exocytic events in dendritic spines was quantified in hippocampal neurons
expressing mCh, mCh-Stx1DTM, mCh-Stx3DTM, mCh-Stx4DTM, Scr shRNA control, Stx4 shRNA#1 or Stx4 shRNA#3 during and 10 min following exposure
to Bic/Gly. The total number of spine exocytic events observed during this time period was divided by the total number of spines in the imaged field for each
cell. Error bars represent SEM. *p < 0.05, Student’s t test, n = 6, 5, 5, 6, 8, 6, 6, cells respectively.
(F) Blocking Stx4 function leads toaccumulation of REs inspines. GFP (top panel) orGFP-Stx4DTM(bottom panel) was expressed for 48hralongwith TfR-mCh tomark
REs in hippocampal neurons. Arrowheads designate RE-positive spines. Asterisks denote endosome-negative spines. The scale bar represents 5 mm; inset, 1 mm.
(G) Quantification of data from (F). Data represent means ± SEM of the percent spines containing a TfR-positive RE in cells expressing GFP, Stx1DTM, Stx3DTM,
Stx4DTM, scr shRNA, Stx4 shRNA#1 or Stx4 shRNA#3. *p < 0.05, Student’s t test, n = 9, 6, 6, 9, 6, 6, 6, cells respectively. See also Figure S4 and Movie S5.
of baseline) by introduction of purified Stx3DTM at an identical
concentration, confirming the specificity of the effect. The
complete block of LTP (Figure 7) but only partial block of TfR-
SEP trafficking (Figure 6B) by Stx4DTM may indicate that the
early trafficking events (<5 min poststimulation) are more impor-
tant for LTP since this phase of trafficking was nearly completely
blocked by Stx4DTM (Figure 6B). These data provide strong
evidence that acute postsynaptic block of Stx4 function is suffi-
cient to prevent LTP.
DISCUSSION
In the present study, we employed a novel sensor of postsyn-
aptic membrane trafficking that allowed us to simultaneously
visualize the location of exocytosis and the behavior of exocytic
532 Cell 141, 524–535, April 30, 2010 ª2010 Elsevier Inc.
cargo prior to, during, and following synaptic activity. We have
demonstrated that synaptic activation triggers fusion of large
AMPA receptor-containing recycling compartments to the PM
of dendritic spines in an all-or-none manner. Spine exocytosis
occurs at sites enriched for the SNARE protein Stx4 immediately
lateral to the PSD. Accordingly, disruption of Stx4 either acutely
or chronically blocks membrane fusion and cargo delivery
triggered by synaptic activation and acute inhibition of Stx4 abol-
ishes LTP. Stx4 thus defines a SNARE-based exocytic zone for
activity-dependent spine modification required for synaptic
plasticity.
A Spine Exocytic DomainAlthough a crucial role for postsynaptic exocytosis in synaptic
plasticity has long been appreciated (Lledo et al., 1998;

Figure 7. Disrupting Stx4 Blocks LTP
(A) LTP of Schaffer collateral-CA1 synapses was induced by pairing depolarization of the postsynaptic cell to 0 mV with 200 pulses delivered at 2 Hz (arrowhead)
with control recording solution (black) or with recording solution containing either 2.5 mm Stx3DTM (blue) or Stx4DTM (red). Error bars represent SEM n = 7, 8,
8 cells, respectively.
(B) Average of 10 individual EPSCs from representative recordings before pairing (light traces) and 25 min after LTP induction (dark traces) for control, Stx4DTM,
and Stx3DTM conditions. The scale bar represents 50 pA, 25 msec.
(C) Bar graph summarizing the effect of StxDTM peptides on the magnitude of LTP at 25-30 min. LTP was nearly abolished by Stx4DTM (*p < 0.05 relative to
control), but was unaffected by Stx3DTM (p > 0.9 relative to control). See also Figure S5.
Lu et al., 2001; Luscher et al., 1999; Yoshihara et al., 2005), the
site(s) of membrane insertion has been unknown and controver-
sial. Recent studies have suggested that activity stimulates
exocytosis of synaptic cargo exclusively in the soma and
dendritic shafts (Adesnik et al., 2005; Makino and Malinow,
2009; Yudowski et al., 2007), while others support a more local
trafficking pathway within activated dendritic spines (Gerges
et al., 2006; Kopec et al., 2006; Park et al., 2006). Here, we
provide direct evidence for activity-regulated exocytic trafficking
within dendritic spines. Upon stimulation, intra-spine endo-
somes undergo abrupt fusion with the spine PM. Prior to fusion,
spine-localized endosomes load with endogenous GluR1 and
exogenous transferrin, indicating that these structures partici-
pate in ongoing recycling of plasma membrane proteins, in-
cluding neurotransmitter receptors. Importantly, we show that,
relative to endogenous GluR1, exogenously expressed SEP-
GluR1 traffics less efficiently through spine REs. Specifically,
less than half of spine REs contain SEP-GluR1 compared to
nearly complete labeling of spine REs after endogenous GluR1
antibody feeding. This could be due to incomplete stoichiometric
association with AMPA receptor regulatory subunits (e.g.,
TARPS), and may explain differences between our results and
studies that failed to observe spine exocytosis using SEP-
GluR1 (Makino and Malinow, 2009; Yudowski et al., 2007).
Our results indicate that spine-localized recycling endosomes
sense synaptic activity and rapidly alter the composition of the
spine PM in dramatic, presumably single-step exocytic events
at sites adjacent to the PSD. The location of exocytosis adjacent
to the PSD indicates that incorporation of newly exocytosed
membrane proteins into the PSD will be limited by escape and
lateral diffusion from the initial site of fusion. The spine neck
sequesters newly inserted material within the spine head for
tens of seconds, increasing the likelihood of synaptic incorpora-
tion and perhaps shielding unstimulated neighboring synapses
from newly inserted plasticity factors. Thus, while exocytic traf-
ficking may be necessary for synaptic plasticity, short-range
diffusion to the PSD within the confines of the spine head will
likewise limit the rate and range of cargo incorporation into the
synapse (Holcman and Triller, 2006; Newpher and Ehlers,
2008; Triller and Choquet, 2008; Yang et al., 2008a). Intriguingly,
at many spines, the fraction of newly inserted SEP-GluR1
remains nearly constant for several minutes following exocy-
tosis, even though co-exocytosed TfR-mCh quickly diffuse
away. Although measuring spine exocytosis following more
refined activity manipulations will be required to directly link
spine exocytosis with homosynaptic LTP, this quantal mode of
incorporation of AMPA receptors mirrors the single-step poten-
tiation of AMPA receptor currents reported at individual syn-
apses following local glutamate uncaging or weak afferent
stimulation (Bagal et al., 2005; Makino and Malinow, 2009;
Matsuzaki et al., 2004; O’Connor et al., 2005; Petersen et al.,
1998). In particular, both events are NMDA receptor-dependent,
occur in a ‘‘digital’’ all-or-none fashion, and are refractory to
further stimulation. A possible mechanism that could set the
refractory period for additional potentiation is the genesis of
new spine REs or the mobilization existing REs into spines, the
latter of which involves myosin Vb-mediated translocation of
dendritic endosomes into spines (Wang et al., 2008).
A Postsynaptic SyntaxinWe have found that Stx4, a PM SNARE protein expressed in
brain, mediates a majority of activity-triggered membrane traf-
ficking events from postsynaptic recycling compartments. Stx4
localizes to dendritic spines where it marks sites where spine
Cell 141, 524–535, April 30, 2010 ª2010 Elsevier Inc. 533
endosomes fuse with the spine PM, thus enabling synapse-spe-
cific membrane delivery. In concert with previously described
endocytic zones (Blanpied et al., 2002; Lu et al., 2007; Racz
et al., 2004), the discovery of spine exocytic machinery raises
the intriguing possibility of a micron-scale membrane trafficking
circuit that determines the unique properties of individual
synapses. Indeed, disrupting this circuit by eliminating postsyn-
aptic endocytic zones results in loss of synaptic AMPA recep-
tors, loss of local AMPA receptor recycling, and impaired
synaptic potentiation (Lu et al., 2007; Petrini et al., 2009). Here
we have shown that recycling cargo, including AMPA receptors
can be exocytosed directly in spines, indicating that both exocy-
tosis and endocytosis can be spatially restricted on a micron
scale. In addition to AMPA receptors, many other postsynaptic
membrane proteins are known to traffic through recycling
endosomal compartments, including N-cadherin, L-type volt-
age-gated calcium channels, A-type potassium channels and
metabotropic glutamate receptors. Likewise, soluble factors,
including neurotrophins, may also be released via spine exocy-
tosis (Dean et al., 2009). Although further experiments are
needed to reveal the complete array of factors trafficked through
spine endosomes and exocytosed at Stx4 exocytic domains, we
speculate that these organelles act as input-specific, activity-
triggered plasticity modules that harbor and deliver a variety of
membrane and secreted factors that modify diverse features of
glutamatergic synapses. Further, it is interesting to note that
unlike the classic presynaptic syntaxin Stx1, Stx4 associates
with and is tightly regulated by the actin cytoskeleton (Jewell
et al., 2008; Low et al., 2006), an adaptation particularly suited
for actin-rich dendritic spines. Ultimately, spatially directed
exocytosis together with retention of receptors and other exo-
cytic cargo in the PSD, could both acutely augment and persis-
tently confine new components of a given synapse for enduring
changes in synaptic strength. More broadly, localized Stx4
exocytic domains may provide a general paradigm for stim-
ulus-dependent regulation of local membrane composition on a
micron scale.
EXPERIMENTAL PROCEDURES
Cell Culture and Transfection
Hippocampal neuron cultures were prepared from E18 rat embryos and grown
on 18 mm poly-D-lysine coated coverslips as previously described (Ehlers,
2000). COS7 cells were grown in DMEM supplemented with 10% fetal bovine
serum. Cells were transfected using Lipofectamine 2000 (Invitrogen) accord-
ing to the manufacturer’s recommendations.
Live Cell Imaging
Live cell imaging was performed on a custom built spinning disc confocal
microscope with a Yokogawa CSU10 scan head mounted on a Nikon TE300
inverted stand. Excitation was provided by a 2.5W KrAr laser (SpectraPhysics).
Antibody and Transferrin Labeling of Live Cells
For live-cell surface labeling of Stx4-HA, cells were washed with imaging buffer
and incubated for 3 min with mouse monoclonal anti-HA.11 antibody (Covance
16B12) at 32�C. For live-cell antibody feeding experiments, hippocampal
neurons (DIV 20-25) transfected with GFP and TfR-mCh were incubated for
3 hr at 37�C with 0.75 mg/mL affinity-purified anti-GluR1 antibody directed
against the extracellular N-terminal domain. For transferrin loading experi-
ments, cells were incubated for 30 min in serum free media supplemented
with 50 mg/mL Alexa 647-conjugated transferrin (Molecular Probes/Invitrogen).
534 Cell 141, 524–535, April 30, 2010 ª2010 Elsevier Inc.
Immunogold Electron Microscopy
Immunogold electron microscopy was performed on ultramicrotome sections
of adult rat CA1 hippocampus as previously described (Park et al., 2006; Racz
et al., 2004).
Generation of Recombinant Stx3DTM and Stx4DTM
Recombinant Stx4DTM and Stx3DTM were generated as N-terminal GST
fusion proteins by cloning sequences corresponding to amino acids 2–273
of human Stx4 and amino acids 2-262 of Stx3 into pGEX-6P-3 (Amersham
Biosciences). GST-StxDTM proteins were produced in E. coli strain
BL21(DE3) pLysS after a 4 hr induction with 1 mM IPTG at room temperature
and purified over glutathione sepharose 4B resin. To prepare recording solu-
tions containing Stx protein, 1 ml of recombinantly expressed StxDTM protein
was dialyzed overnight against 2 3 1L of (in mM): 115 cesium methane sulfo-
nate, 20 CsCl2, 10 HEPES (pH 7.3).
Electrophysiology
LTP experiments were performed using transverse hippocampal slices cut
from C57Bl/6 mice (350 mm, �3 weeks of age, Charles River). Whole cell
voltage clamp recordings were made from CA1 pyramidal neurons using
IR-DIC optics with internal solutions supplemented with 2.5 mM Stx4DTM or
Stx3DTM. All recordings were blind with respect to the identity of the recombi-
nant protein. Schaffer collaterals were activated at 0.1 Hz using a bipolar
stainless steel stimulating electrode (50–200 mA, 100 msec) and monosynaptic
EPSCs were measured at �70 mV. Cells were dialyzed for 9–10 min to allow
peptide diffusion, before inducing LTP by pairing depolarization to 0 mV with
200 stimuli at 2 Hz.
SUPPLEMENTAL INFORMATION
Supplemental Information includes Extended Experimental Procedures, five
figures, and five movies and can be found with this article online at doi:10.
1016/j.cell.2010.02.042.
ACKNOWLEDGMENTS
We thank Marguerita Klein, Irina Lebedeva, and Haiwei Zhang for excellent
technical assistance. We thank Ben Arenkiel, Cyril Hanus, Juliet Hernandez,
Tom Newpher, Michael Patterson, Joel Schwartz, Chandra Tucker, Ryohei
Yasuda, and Richard Weinberg for critical discussion and review of this
manuscript. This work was supported by grants from NIMH, NINDS, and NIA
to M.D.E. M.D.E. is an Investigator of the Howard Hughes Medical Institute.
Received: March 2, 2009
Revised: December 10, 2009
Accepted: February 22, 2010
Published: April 29, 2010
REFERENCES
Adesnik, H., Nicoll, R.A., and England, P.M. (2005). Photoinactivation of native
AMPA receptors reveals their real-time trafficking. Neuron 48, 977–985.
Ashby, M.C., Maier, S.R., Nishimune, A., and Henley, J.M. (2006). Lateral
diffusion drives constitutive exchange of AMPA receptors at dendritic spines
and is regulated by spine morphology. J. Neurosci. 26, 7046–7055.
Bagal, A.A., Kao, J.P., Tang, C.M., and Thompson, S.M. (2005). Long-term
potentiation of exogenous glutamate responses at single dendritic spines.
Proc. Natl. Acad. Sci. USA 102, 14434–14439.
Blanpied, T.A., Scott, D.B., and Ehlers, M.D. (2002). Dynamics and regulation
of clathrin coats at specialized endocytic zones of dendrites and spines.
Neuron 36, 435–449.
Dean, C., Liu, H., Dunning, F.M., Chang, P.Y., Jackson, M.B., and Chapman,
E.R. (2009). Synaptotagmin-IV modulates synaptic function and long-term
potentiation by regulating BDNF release. Nat. Neurosci. 12, 767–776.

Ehlers, M.D. (2000). Reinsertion or degradation of AMPA receptors determined
by activity-dependent endocytic sorting. Neuron 28, 511–525.
Gerges, N.Z., Backos, D.S., Rupasinghe, C.N., Spaller, M.R., and Esteban,
J.A. (2006). Dual role of the exocyst in AMPA receptor targeting and insertion
into the postsynaptic membrane. EMBO J. 25, 1623–1634.
Holcman, D., and Triller, A. (2006). Modeling synaptic dynamics driven by
receptor lateral diffusion. Biophys. J. 91, 2405–2415.
Jahn, R., and Scheller, R.H. (2006). SNAREs–engines for membrane fusion.
Nat. Rev. Mol. Cell Biol. 7, 631–643.
Jewell, J.L., Luo, W., Oh, E., Wang, Z., and Thurmond, D.C. (2008). Filamen-
tous actin regulates insulin exocytosis through direct interaction with Syntaxin
4. J. Biol. Chem. 283, 10716–10726.
Kennedy, M.J., and Ehlers, M.D. (2006). Organelles and trafficking machinery
for postsynaptic plasticity. Annu. Rev. Neurosci. 29, 325–362.
Kopec, C.D., Li, B., Wei, W., Boehm, J., and Malinow, R. (2006). Glutamate
receptor exocytosis and spine enlargement during chemically induced long-
term potentiation. J. Neurosci. 26, 2000–2009.
Kopec, C.D., Real, E., Kessels, H.W., and Malinow, R. (2007). GluR1 links
structural and functional plasticity at excitatory synapses. J. Neurosci. 27,
13706–13718.
Lang, T., Bruns, D., Wenzel, D., Riedel, D., Holroyd, P., Thiele, C., and Jahn, R.
(2001). SNAREs are concentrated in cholesterol-dependent clusters that
define docking and fusion sites for exocytosis. EMBO J. 20, 2202–2213.
Lledo, P.M., Zhang, X., Sudhof, T.C., Malenka, R.C., and Nicoll, R.A. (1998).
Postsynaptic membrane fusion and long-term potentiation. Science 279,
399–403.
Low, S.H., Vasanji, A., Nanduri, J., He, M., Sharma, N., Koo, M., Drazba, J.,
and Weimbs, T. (2006). Syntaxins 3 and 4 are concentrated in separate
clusters on the plasma membrane before the establishment of cell polarity.
Mol. Biol. Cell 17, 977–989.
Lu, J., Helton, T.D., Blanpied, T.A., Racz, B., Newpher, T.M., Weinberg, R.J.,
and Ehlers, M.D. (2007). Postsynaptic positioning of endocytic zones and
AMPA receptor cycling by physical coupling of dynamin-3 to Homer. Neuron
55, 874–889.
Lu, W., Man, H., Ju, W., Trimble, W.S., MacDonald, J.F., and Wang, Y.T.
(2001). Activation of synaptic NMDA receptors induces membrane insertion
of new AMPA receptors and LTP in cultured hippocampal neurons. Neuron
29, 243–254.
Luscher, C., Xia, H., Beattie, E.C., Carroll, R.C., von Zastrow, M., Malenka,
R.C., and Nicoll, R.A. (1999). Role of AMPA receptor cycling in synaptic trans-
mission and plasticity. Neuron 24, 649–658.
Makino, H., and Malinow, R. (2009). AMPA receptor incorporation into
synapses during LTP: the role of lateral movement and exocytosis. Neuron
64, 381–390.
Maletic-Savatic, M., and Malinow, R. (1998). Calcium-evoked dendritic exocy-
tosis in cultured hippocampal neurons. Part I: trans-Golgi network-derived
organelles undergo regulated exocytosis. J. Neurosci. 18, 6803–6813.
Martens, S., and McMahon, H.T. (2008). Mechanisms of membrane fusion:
disparate players and common principles. Nat. Rev. Mol. Cell Biol. 9, 543–556.
Matsuzaki, M., Honkura, N., Ellis-Davies, G.C., and Kasai, H. (2004). Structural
basis of long-term potentiation in single dendritic spines. Nature 429, 761–766.
Miesenbock, G., De Angelis, D.A., and Rothman, J.E. (1998). Visualizing secre-
tion and synaptic transmission with pH-sensitive green fluorescent proteins.
Nature 394, 192–195.
Newpher, T.M., and Ehlers, M.D. (2008). Glutamate receptor dynamics in
dendritic microdomains. Neuron 58, 472–497.
O’Connor, D.H., Wittenberg, G.M., and Wang, S.S. (2005). Graded bidirec-
tional synaptic plasticity is composed of switch-like unitary events. Proc.
Natl. Acad. Sci. USA 102, 9679–9684.
Ohara-Imaizumi, M., Nishiwaki, C., Kikuta, T., Kumakura, K., Nakamichi, Y.,
and Nagamatsu, S. (2004). Site of docking and fusion of insulin secretory
granules in live MIN6 beta cells analyzed by TAT-conjugated anti-syntaxin 1
antibody and total internal reflection fluorescence microscopy. J. Biol.
Chem. 279, 8403–8408.
Olson, A.L., Knight, J.B., and Pessin, J.E. (1997). Syntaxin 4, VAMP2, and/or
VAMP3/cellubrevin are functional target membrane and vesicle SNAP recep-
tors for insulin-stimulated GLUT4 translocation in adipocytes. Mol. Cell. Biol.
17, 2425–2435.
Park, M., Penick, E.C., Edwards, J.G., Kauer, J.A., and Ehlers, M.D. (2004).
Recycling endosomes supply AMPA receptors for LTP. Science 305, 1972–
1975.
Park, M., Salgado, J.M., Ostroff, L., Helton, T.D., Robinson, C.G., Harris, K.M.,
and Ehlers, M.D. (2006). Plasticity-induced growth of dendritic spines by
exocytic trafficking from recycling endosomes. Neuron 52, 817–830.
Passafaro, M., Piech, V., and Sheng, M. (2001). Subunit-specific temporal and
spatial patterns of AMPA receptor exocytosis in hippocampal neurons. Nat.
Neurosci. 4, 917–926.
Petersen, C.C., Malenka, R.C., Nicoll, R.A., and Hopfield, J.J. (1998). All-or-
none potentiation at CA3-CA1 synapses. Proc. Natl. Acad. Sci. USA 95,
4732–4737.
Petrini, E.M., Lu, J., Cognet, L., Lounis, B., Ehlers, M.D., and Choquet, D.
(2009). Endocytic trafficking and recycling maintain a pool of mobile surface
AMPA receptors required for synaptic potentiation. Neuron 63, 92–105.
Racz, B., Blanpied, T.A., Ehlers, M.D., and Weinberg, R.J. (2004). Lateral
organization of endocytic machinery in dendritic spines. Nat. Neurosci. 7,
917–918.
Shepherd, J.D., and Huganir, R.L. (2007). The cell biology of synaptic plas-
ticity: AMPA receptor trafficking. Annu. Rev. Cell Dev. Biol. 23, 613–643.
Sieber, J.J., Willig, K.I., Heintzmann, R., Hell, S.W., and Lang, T. (2006). The
SNARE motif is essential for the formation of syntaxin clusters in the plasma
membrane. Biophys. J. 90, 2843–2851.
Sieber, J.J., Willig, K.I., Kutzner, C., Gerding-Reimers, C., Harke, B., Donnert,
G., Rammner, B., Eggeling, C., Hell, S.W., Grubmuller, H., et al. (2007).
Anatomy and dynamics of a supramolecular membrane protein cluster.
Science 317, 1072–1076.
Sollner, T., Bennett, M.K., Whiteheart, S.W., Scheller, R.H., and Rothman, J.E.
(1993). A protein assembly-disassembly pathway in vitro that may correspond
to sequential steps of synaptic vesicle docking, activation, and fusion. Cell 75,
409–418.
Takamori, S., Holt, M., Stenius, K., Lemke, E.A., Gronborg, M., Riedel, D.,
Urlaub, H., Schenck, S., Brugger, B., Ringler, P., et al. (2006). Molecular
anatomy of a trafficking organelle. Cell 127, 831–846.
Tanaka, J., Horiike, Y., Matsuzaki, M., Miyazaki, T., Ellis-Davies, G.C., and
Kasai, H. (2008). Protein synthesis and neurotrophin-dependent structural
plasticity of single dendritic spines. Science 319, 1683–1687.
Triller, A., and Choquet, D. (2008). New concepts in synaptic biology derived
from single-molecule imaging. Neuron 59, 359–374.
Wang, Z., Edwards, J.G., Riley, N., Provance, D.W., Jr., Karcher, R., Li, X.D.,
Davison, I.G., Ikebe, M., Mercer, J.A., Kauer, J.A., et al. (2008). Myosin Vb
mobilizes recycling endosomes and AMPA receptors for postsynaptic plas-
ticity. Cell 135, 535–548.
Yang, Y., Wang, X.B., Frerking, M., and Zhou, Q. (2008a). Delivery of AMPA
receptors to perisynaptic sites precedes the full expression of long-term
potentiation. Proc. Natl. Acad. Sci. USA 105, 11388–11393.
Yang, Y., Wang, X.B., Frerking, M., and Zhou, Q. (2008b). Spine expansion
and stabilization associated with long-term potentiation. J. Neurosci. 28,
5740–5751.
Yoshihara, M., Adolfsen, B., Galle, K.T., and Littleton, J.T. (2005). Retrograde
signaling by Syt 4 induces presynaptic release and synapse-specific growth.
Science 310, 858–863.
Yudowski, G.A., Puthenveedu, M.A., Leonoudakis, D., Panicker, S., Thorn,
K.S., Beattie, E.C., and von Zastrow, M. (2007). Real-time imaging of discrete
exocytic events mediating surface delivery of AMPA receptors. J. Neurosci.
27, 11112–11121.
Cell 141, 524–535, April 30, 2010 ª2010 Elsevier Inc. 535

Supplemental Information
EXTENDED EXPERIMENTAL PROCEDURES
ConstructsTfR-SEP was previously described (Park et al., 2006). Human Stx4 and Stx3 clones were provided by Dr. Thomas Weimbs (University
of California, Santa Barbara). Stx1a was from Genecopoeia. Stx4-HA was generated by cloning the Stx4 coding sequence into
a custom mammalian expression vector containing CMV promoter elements and a C-terminal HA sequence. mCherry-Stx4DTM
and mCherry-Stx3DTM were generated by PCR amplification and subcloning of the sequences encoding amino acids 2–273
(Stx4), 2–263 (Stx3), and 2–265 (Stx1) into the mCherry-N1 vector, a gift from Dr. Roger Tsien (University of California, San Diego).
GST-Stx4DTM and GST-Stx3DTM were generated by PCR amplification and subcloning of the sequences encoding amino acids
2–273 (Stx4) or amino acids 2–263 (Stx3) into pGEX-6P-3. TfR-mCh-SEP was generated by cloning a PCR-generated mCh fragment
into an AgeI site in TfR-SEP (Park et al., 2006). GFP-homer1c was provided by Dr. Daniel Choquet (University of Bordeaux). SEP-
GluR1 was generated from a GFP-GluR1 construct provided by Dr. Richard Huganir (Johns Hopkins University).
shRNA Knockdown of Stx4For shRNA knockdown of Stx4, we used the following 19-mer target sequences: Stx4shRNA#1: AGACAATTCGGCAGACTAT;
Stx4shRNA#3: CCTGCGAGAGGAGATCAAA. The DNA oligonucleotides containing the shRNA target sequence, a 9 nucleotide
loop region (TTCAAGAGA), and the shRNA antisense sequence were ligated and cloned into pLentilox3.7 (a gift from Dr. Tyler Jacks)
modified to express tdTomato as a cell fill. pLentilox3.7 expressing a scrambled shRNA sequence was used as a negative control. To
verify the efficacy of our shRNA sequences, we infected NIH 3T3 cells or hippocampal neuron cultures at DIV 0-3 with lentivirus pack-
aged with pLentilox3.7 harboring either scrambled control shRNA or shRNA targeting Stx4. Cell lysates were collected 4–5 days later
for immunoblot analysis. For imaging TfR-SEP insertion, neurons were transfected with pLentilox3.7 plus TfR-SEP constructs at DIV
13 and imaged 4–5 days later (DIV 17-18).
Live Cell ImagingLive cell imaging was performed on a custom built spinning disc confocal microscope with a Yokogawa CSU10 scan head mounted
on a Nikon TE300 inverted stand. Excitation was provided by a 2.5W KrAr laser (SpectraPhysics) shuttered via an acousto-optical
tunable filter (AOTF) (Neos Technologies), with emission directed through a filter wheel (Applied Scientific Instrumentation) holding
either band pass or long pass filters (Chroma). Images were acquired using a 603 Plan Apochromat 1.4 NA objective. A 1.53 tube
lens between the filter wheel and camera focused light on the chip of a Hamamatsu C9100 EM-CCD camera giving a pixel size of 86 3
86 nm. The focal plane was controlled by a piezo-driven Z-stage (Applied Scientific Instruments). The EM-CCD Camera, filter wheel,
stage, and AOTF laser line switching were controlled by Metamorph software (Molecular Devices). Chromatic aberration between red
and green channels was evaluated by imaging dual color Focalcheck microspheres (Invitrogen) and was found to be minimal. An
environmental chamber (In Vivo Scientific) enclosing the microscope stand maintained the temperature at 37�C. In some experi-
ments, images were acquired on a Perkin Elmer Ultraview spinning disc system equipped with a 60x Plan Apochromat 1.4 NA objec-
tive.
Between 24–48 hr following transfection, coverslips (Deckglaser #1, 18 mm) with cultured hippocampal neurons were placed in
a live cell imaging chamber (Ludin) and perfused with media containing (in mM): 130 NaCl, 5 KCl, 2 CaCl2, 10 HEPES, 30 glucose,
and 1 MgCl2, (pH 7.4). Neurons were stimulated by exchanging the above solution to one that contained (in mM): 130 NaCl, 5 KCl, 10
HEPES, 30 glucose, 3 CaCl2, 0.03 (-) bicuculline methiodide (Tocris), 0.2 Glycine (Tocris), pH 7.4 (Bic/Gly solution). Neurons were
incubated in Bic/Gly solution for 5 min before being returned to extracellular solution. Stacks of images were acquired before, during,
and following stimulation with spacing of 0.5 mm in the z-axis, except in cases where rapid acquisition was necessary, in which case
images were captured in a single image plane.
For experiments monitoring the ratio of the mCh and SEP signal of TfR-mCh-SEP, the intrinsic ratio of mCh to SEP signal was
determined at neutral pH by incubating neurons in NH4Cl (50 mM) and acquiring red (mCh) and green (SEP) signal. The value obtained
(mCh/SEPneut) is an arbitrary constant that depends on imaging conditions (EM-CCD gain, laser intensity, integration time). Provided
imaging conditions are kept constant, mCh/SEP values provide a measure of the fraction of TfR-mCh-SEP molecules present in an
acidic endosomes. For timelapse imaging of mCh/SEPneut during exocytosis, we corrected for the pre-exocytosis bleaching of mCh
(during which time SEP was protected from bleaching in acidic endosomes) by fitting the total cellular mCh signal to a single expo-
nential and calculating the fractional mCh signal bleached during the pre-exocytosis imaging period. For visualization, some images
were low pass filtered and interpolated. Only raw data was used for quantification.
Antibody and Transferrin Labeling of Live CellsFor live-cell surface labeling of Stx4-HA, cells were washed with imaging buffer and incubated for 3 min with mouse monoclonal anti-
HA.11 antibody (Covance 16B12) at 32�C. Coverslips were then washed and incubated for 3-4 min with goat anti-mouse Fab conju-
gated to Cy3 (Jackson Immunologicals) or Alexa 647 (Molecular Probes/Invitrogen) at 32�C. Imaging commenced immediately
following washout of the dye-conjugated secondary antibody. Only cells with a minimal detectable level of surface labeling were
imaged as we observed very few exocytic events when Stx4 was expressed at high levels. As a control, cells were fixed prior to
labeling under nonpermeabilizing conditions to confirm that the punctate pattern of surface Stx4 was not a consequence of
Cell 141, 524–535, April 30, 2010 ª2010 Elsevier Inc. S1
antibody-induced clustering in live cells. For antibody-induced disruption of surface Stx4 in live cells, the same protocol outlined
above was followed except that anti-mouse whole IgG was used instead of anti-mouse Fab secondary antibodies. Labeling in this
manner rapidly (<5 min) induced large, immobile Stx4-HA aggregates at the PM.
For transferrin loading experiments, cells were incubated for 30 min in serum free media supplemented with 50 mg/mL Alexa 647-
conjugated transferrin (Molecular Probes/Invitrogen). Cells were washed with imaging buffer prior to visualization.
For live-cell antibody feeding experiments, hippocampal neurons (DIV 20-25) transfected with GFP and TfR-mCh were incubated
for 3 hr at 37�C with 0.75 mg/mL affinity-purified anti-GluR1 antibody directed against the extracellular N-terminal domain. Cells were
washed with PBS and fixed with 4% paraformaldehyde for 20 min at room temperature. Cells were blocked overnight with 0.5 mg/mL
anti-rabbit Fab (Jackson Immunologicals) in PBS. Following block, cells were permeabilized with 0.1% Triton X-100 and labeled with
Alexa 647-conjugated anti-rabbit secondary for 1 hr. Nonpermeabilized cells were used to control for surface anti-GluR1 blocking
efficiency. To control for nonspecific uptake of anti-GluR1, we preincubated the antibody with a 10-fold molar excess of the peptide
used to generate the antibody.
Image AnalysisTo quantify total TfR-SEP insertion into dendrites and spines, the initial fluorescence (F0) after background correction was subtracted
from the fluorescence at subsequent time points during and after Bic/Gly stimulation and divided by F0 to obtain the fractional
increase in TfR-SEP fluorescence according to the relation (Ft- F0)/F0. Quantification was performed on two-dimensional projections
of z-stacks acquired at each time point. Only dendrites and spines were included in the analysis. For centroid analysis, relevant
regions were fit using Igor Pro software (Wavemetrics) with the 2-dimensional Gaussian function
fðx; yÞ= z0 + Ae��ðx�x0Þ2
2s2x
+ðy�y0Þ2
2s2y
�
where z0 is the baseline offset, A is the maximum amplitude, x0 and y0 are the center in the x and y dimensions, and sx,y is the width of
the function in the x and y dimension. Cell boundaries were designated by thresholding the cell-fill (or in some cases TfR-SEP or TfR-
mCh) channel (typically at 10% over background), and outlining the cell.
ImmunohistochemistryFor syntaxin labeling in brain sections, C57BL/6 mice (P20-P30) were perfused with 10 ml PBS followed by 10 ml 4% PFA in PBS.
Brains were dissected and postfixed for 1 hr at 4�C in 4% PFA in PBS. Brains were frozen in O.C.T (Tissue-Tek) and 50 mm coronal
sections were cut on a Microm HM400 microtome. Sections were permeabilized and blocked in PBS containing 0.1% Triton X-100,
3% BSA, and 10% normal goat serum for 12 hr at 4�C. Sections were washed three times with PBS containing 0.1% Triton X-100
before application of antibodies. Primary antibodies were diluted in blocking solution and incubated with sections for at least 12 hr at
4�C before washing 3 times in PBS with 0.1% Triton X-100. Secondary antibodies were also diluted in the blocking solution and incu-
bated with sections for at least 6 hr. Following antibody application, slices were washed extensively prior to mounting onto micro-
scope slides using Vectashield mountant (Vector Laboratories).
For antibody staining of cultured neurons, cells grown on glass coverslips were fixed in 4% PFA in PBS for 20 min at room temper-
ature. Coverslips were then washed in PBS before permeabilizing and blocking for 1 hr at room temperature with PBS containing
0.1% Triton X-100, 3% BSA, and 10% normal goat serum. Primary antibodies were diluted in blocking solution and added to cover-
slips for at least 1 hr before washing three times in PBS with 0.1% Triton X-100. Secondary antibodies were also diluted in blocking
solution and added to coverslips for at least 1 hr. Following antibody application, cells were washed extensively prior to mounting
onto microscope slides using Permafluor mountant containing 50 mg/mL 1,4-diazabicyclo[2.2.2]octane (Sigma).
Two anti-Stx4 antibodies were used in this study: Chemicon AB5330 and Sigma S9924. Both antibodies were used at 1:400 for
brain sections and 1:250 for cultured hippocampal neurons. Alexa488, 568, or 647-conjugated goat anti-rabbit secondary antibodies
(Molecular Probes/Invitrogen) were used at 1:500 dilution. As a control for Stx4 antibody staining, we preincubated anti-Stx4 with
a 10-fold molar excess of the peptide antigen used to generate the antibody (amino acids 2-23) for 1 hr at room temperature prior
to staining. Preincubation with the antigenic peptide blocked all Stx4 staining in both cultured neurons and in brain slices.
Immunogold Electron MicroscopyDeeply anesthetized male Sprague-Dawley rats were perfused with saline followed by cold fixative, containing 4% paraformalde-
hyde and 0.1% glutaraldehyde in phosphate buffer (PB, 0.1M, [pH 7.4]). Brains were removed and postfixed in the same fixative
for 2 hr. Coronal sections (50 mm thick) were cut with a Vibratome, and then washed in PB. For pre-embedding immunolabeling,
floating sections were washed in phosphate buffered saline (PBS, 0.01 M, [pH 7.4]) and treated for 30 min in 1% sodium borohydride
in PBS, washed in PBS, treated with 3% H2O2 in PBS, and washed again in PBS. Sections were then incubated in 20% normal
donkey serum (NDS, Jackson ImmunoResearch) for 30 min, and overnight in rabbit anti-syntaxin 4 (Sigma), mouse anti-syntaxin
1 (Synaptic Systems), rabbit anti-syntaxin 2 (Synaptic Systems) or rabbit anti-syntaxin 3 (Synaptic Systems) in PBS containing
2% NDS. Following several washes in PBS and incubation in PBS containing 2% NDS, sections were incubated in biotinylated
S2 Cell 141, 524–535, April 30, 2010 ª2010 Elsevier Inc.

donkey anti-rabbit or mouse IgG (1:200, Jackson ImmunoResearch Laboratories Inc.) for 2 hr, washed with PBS, incubated with 1.4
nm gold particles conjugated to streptavidin (Nanoprobes) diluted 1:100 in PBS for 2 hr, and washed with PBS. Following gold
labeling, sections were fixed with 1% glutaraldehyde (Electron Microscopy Sciences) in PBS for 10 min and washed in PBS. Gold
particle labeling was enhanced using IntenseS-EM (Amersham) after washing in 0.05 M sodium acetate. Following enhancement,
sections were washed in sodium acetate and PB and were then postfixed with 1% OsO4 in PB for 45 min, washed in PB, washed
in maleate buffer (0.1 M), contrasted in 1% uranyl acetate in maleate buffer for 45 min, and washed in maleate buffer prior to dehy-
dration in a graded series of ethanol washes. Ethanol was replaced by propylene oxide (Electron Microscopy Sciences) and the tissue
was infiltrated with dilutions (50%–100%) of Epon-Spurr’s resin (6:4; Electron Microscopy Sciences) in propylene oxide over three
hours. For postembedding immunolabeling, tissue was prepared as in Phend et al., 1995 with minor modifications. Briefly, tissue
was washed in 0.1M sodium acetate, incubated in 1% tannic acid in sodium acetate, and washed again in sodium acetate. Following
incubation in 0.1% calcium chloride and 0.005% zinc acetate in sodium acetate, tissue was stained en bloc with 1% uranyl acetate in
sodium acetate. Sections were dehydrated in a graded series of ethanol washes and infiltrated with dilutions (50%–100%) of Spurr’s
resin in ethanol. For all tissues, sections were sandwiched between ACLAR films (Ted Pella) following infiltration, flattened between
microscope slides, and polymerized at 60�C for 48 hr. Samples from the area of interest (CA1) were removed and fixed to resin blocks
for thin sectioning. Thin sections (�60 nm) were cut on a Leica ultramicrotome and collected on copper grids. Grids were contrasted
with uranyl acetate and Sato’s lead and examined in a Philips Tecnai electron microscope at 80 kV. Digital micrographs were
acquired with a 16-bit FEI Eagle 2048 3 2048 CCD camera. Images were converted to 8-bit files and cropped using ImageJ (Ras-
band, W.S., ImageJ, U. S. National Institutes of Health, Bethesda, Maryland, USA, http://rsb.info.nih.gov/ij/, 1997–2008.)
For postembedding immunolabeling, thin sections on nickel grids were blocked in 50 mM glycine in 10 mM PBS and then in serum
blocking solution specific to the secondary antibody (Aurion/Electron Microscopy Sciences). Sections were equilibrated in 0.1%
BSA-c (Aurion/Electron Microscopy Sciences) and stained overnight with primary antibody at 4�C. Following primary antibody incu-
bation, sections were extensively washed with BSA-c/PBS buffer and incubated with 10 nm gold conjugated to F(ab0)2 fragments of
goat anti-rabbit antibodies (Aurion/Electron Microscopy Sciences) diluted in BSA-c/PBS for 2 hr at room temperature. Grids were
then extensively washed in BSA-c/PBS and PBS alone and then fixed in 2% glutaraldehyde in PBS. Following fixation, grids were
washed with PBS and water then contrasted and viewed as above.
For quantification, distance measurements were made perpendicular from the long axis of the PSD to a parallel plane bisecting the
immunogold label (Figure S4A). For normalized tangential distances, the distance around the periphery of the spine head was
measured from one side of the PSD to the immunogold label and from the immunogold label back to the second edge of the
PSD. Only immunogold labels that were touching the membrane were measured for tangential distance. When an open spine
neck was encountered in the peripheral distance measurement, the spine was ‘closed’ at the narrowest point of the neck, crossing
it in the manner most perpendicular to the membranes. The normalized tangential distance is expressed as a relative distance from
0 to 1 where 0 represents the edge of the PSD and 1 represents the point in the spine farthest from the PSD. The labeling frequency
was calculated as a 2-bin (100 nm bins) running average and then normalized. All measurements were taken using ImageJ.
Generation of Recombinant Stx3DTM and Stx4DTMRecombinant Stx4DTM and Stx3DTM were generated as N-terminal GST fusion proteins by cloning sequences corresponding to
amino acids 2–273 of human Stx4 and amino acids 2–262 of Stx3 into pGEX-6P-3 (Amersham Biosciences), which incorporates
a PreScission protease (Amersham Biosciences) site in frame between GST and the Stx inserts. GST-StxDTM proteins were
produced in E. coli strain BL21(DE3) pLysS after a 4 hr induction with 1 mM IPTG at room temperature. Cells were harvested by centri-
fugation and lysed by sonication in PBS containing protease inhibitor cocktail (Roche) and 1 mM PMSF. Bacterial lysate containing
GST fusion proteins were loaded by gravity onto a column containing 2 ml of packed glutathione sepharose 4B resin. Following
binding, the column was washed with 15–20 bed volumes of PBS containing Roche protease inhibitor cocktail and 1 mM PMSF. Re-
combinant protein was eluted by adding 0.5 ml of PreScission protease (Amersham, 300 units/mL) in 50 mM Tris-HCl, 150 mM NaCl,
1 mM EDTA, 1 mM dithiothreitol (pH 7.0) to the column and incubating overnight at 4�C. Following incubation with protease, the
column was washed with 5-10 ml of PBS containing 1 mM DTT to elute the liberated recombinant protein. The protein was purified
to > 95% homogeneity as evaluated by Coomassie blue staining. Typically �5 mg of recombinant protein was purified from a 0.5 L
culture. Recombinantly expressed Stx4DTM and Stx3DTM were soluble up to �0.4 mg/mL and 0.8 mg/mL, respectively, following
cleavage of the N-terminal GST tag. To prepare recording solutions containing Stx peptides, 1 ml of recombinantly expressed
StxDTM protein was dialyzed overnight against 2 3 1L of (in mM): 115 cesium methane sulfonate, 20 CsCl2, 10 HEPES, pH 7.3.
Stx3DTM and Stx4DTM recombinant proteins were diluted into the internal recording solution to a final concentration of 2.5 mM.
ElectrophysiologyTransverse hippocampal slices were cut from C57Bl/6 mice (350 mm, �3 weeks of age, Charles River) in ice cold ACSF (in mM: 87
NaCl, 25 NaHCO3, 2.5 KCl, 1.25 NaH2PO4, 0.5 CaCl2, 7 MgCl2, 10 glucose, 1.3 ascorbic acid, saturated with 95% O2 / 5% CO2) using
a vibratome (Leica VT1000S). Slices were transferred to recording ACSF at 34�C (in mM: 124 NaCl, 3 KCl, 26 NaHCO3, 1.25 NaH2PO4,
20 glucose, 2 CaCl2, 1.3 MgCl2) and allowed to return to room temperature for > 45 min. Recordings were made at 28�C in 100 mM
picrotoxin to block inhibitory synaptic inputs, and epileptiform bursting was minimized by severing connections between CA3 and
CA1 regions and by raising divalent ion concentrations. Whole cell voltage clamp recordings were made from CA1 pyramidal neurons
Cell 141, 524–535, April 30, 2010 ª2010 Elsevier Inc. S3

using IR-DIC optics (pipettes 3-5 MU; internal solution, in mM: 130 cesium methylsulfonate, 2.5 NaCl, 5 MgCl2, 0.5 CaCl2, 3 NaATP,
0.5 NaGTP, 0.5 EGTA, 10 phosphocreatine, and 10 HEPES, 0.1 leupeptin). For peptide experiments, internal solutions were supple-
mented with either Stx4DTM or Stx3DTM in cesium gluconate to a final concentration of 2.5 mM. Schaffer collaterals were activated at
0.1 Hz using a bipolar stainless steel stimulating electrode (50–200 mA, 100 msec) and monosynaptic EPSCs were measured at �70
mV with an Axoclamp 700B amplifier and Digidata 1440 digitizer (Molecular Devices). Initial EPSC amplitudes were adjusted to
between 75-200 pA. Cells were dialyzed for 9-10 min to allow peptide diffusion, before inducing LTP by pairing depolarization to
0 mV with 200 stimuli at 2 Hz. Recordings and analysis were performed blind to the identity of the peptide. Baseline EPSCs were
monitored for > 5 min before pairing and amplitudes were normalized to the baseline period for each experiment. LTP was assessed
as EPSC amplitudes 25–30 min after pairing.
S4 Cell 141, 524–535, April 30, 2010 ª2010 Elsevier Inc.
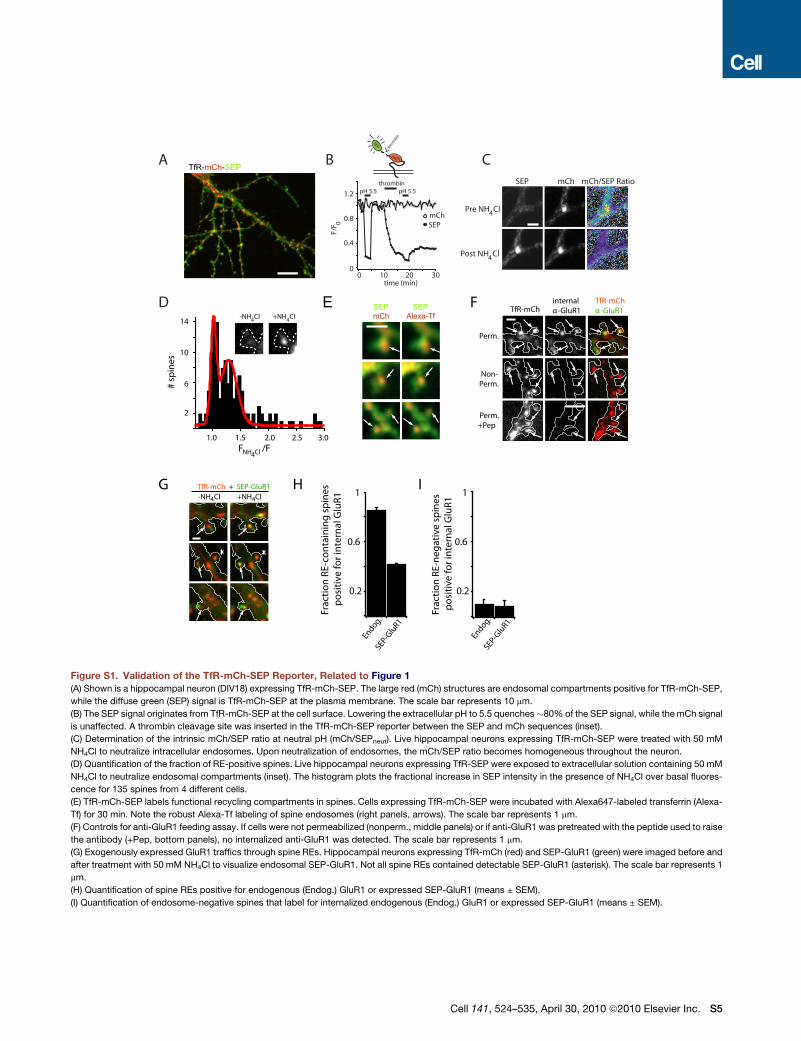
A mCh
SEP
thro
mbin
time (min)
pH 5.5 pH 5.5thrombin
0 10 20 30
1.2
0.8
0.4
0
SEP mCh
F/F 0
B
Pre NH Cl4
Post NH Cl4
SEP mCh mCh/SEP Ratio
TfR-mCh-SEP
D SEP mCh
SEP Alexa-Tf
1.0 1.5
# sp
ines
-NH Cl4 +NH Cl4
2.0 2.5 3.0
2
6
10
14TfR-mCh
internalα-GluR1
TfR-mChα-GluR1
Perm.
Non-Perm.
Perm.+Pep
+NH Cl4-NH Cl4
TfR-mCh + SEP-GluR1
Endog.
SEP-G
luR1
Endog.
SEP-G
luR1
1
0.2
0.6
Frac
tion
RE-c
onta
inin
g sp
ines
p
ositi
ve fo
r int
erna
l Glu
R1
Frac
tion
RE-n
egat
ive
spin
es p
ositi
ve fo
r int
erna
l Glu
R1
1
0.2
0.6
E
F /FNH Cl4
C
F
G H I
Figure S1. Validation of the TfR-mCh-SEP Reporter, Related to Figure 1
(A) Shown is a hippocampal neuron (DIV18) expressing TfR-mCh-SEP. The large red (mCh) structures are endosomal compartments positive for TfR-mCh-SEP,
while the diffuse green (SEP) signal is TfR-mCh-SEP at the plasma membrane. The scale bar represents 10 mm.
(B) The SEP signal originates from TfR-mCh-SEP at the cell surface. Lowering the extracellular pH to 5.5 quenches�80% of the SEP signal, while the mCh signal
is unaffected. A thrombin cleavage site was inserted in the TfR-mCh-SEP reporter between the SEP and mCh sequences (inset).
(C) Determination of the intrinsic mCh/SEP ratio at neutral pH (mCh/SEPneut). Live hippocampal neurons expressing TfR-mCh-SEP were treated with 50 mM
NH4Cl to neutralize intracellular endosomes. Upon neutralization of endosomes, the mCh/SEP ratio becomes homogeneous throughout the neuron.
(D) Quantification of the fraction of RE-positive spines. Live hippocampal neurons expressing TfR-SEP were exposed to extracellular solution containing 50 mM
NH4Cl to neutralize endosomal compartments (inset). The histogram plots the fractional increase in SEP intensity in the presence of NH4Cl over basal fluores-
cence for 135 spines from 4 different cells.
(E) TfR-mCh-SEP labels functional recycling compartments in spines. Cells expressing TfR-mCh-SEP were incubated with Alexa647-labeled transferrin (Alexa-
Tf) for 30 min. Note the robust Alexa-Tf labeling of spine endosomes (right panels, arrows). The scale bar represents 1 mm.
(F) Controls for anti-GluR1 feeding assay. If cells were not permeabilized (nonperm., middle panels) or if anti-GluR1 was pretreated with the peptide used to raise
the antibody (+Pep, bottom panels), no internalized anti-GluR1 was detected. The scale bar represents 1 mm.
(G) Exogenously expressed GluR1 traffics through spine REs. Hippocampal neurons expressing TfR-mCh (red) and SEP-GluR1 (green) were imaged before and
after treatment with 50 mM NH4Cl to visualize endosomal SEP-GluR1. Not all spine REs contained detectable SEP-GluR1 (asterisk). The scale bar represents 1
mm.
(H) Quantification of spine REs positive for endogenous (Endog.) GluR1 or expressed SEP-GluR1 (means ± SEM).
(I) Quantification of endosome-negative spines that label for internalized endogenous (Endog.) GluR1 or expressed SEP-GluR1 (means ± SEM).
Cell 141, 524–535, April 30, 2010 ª2010 Elsevier Inc. S5

PSD95
Stx1
Stx4
SV syn
(unb
oile
d)sy
n (b
oile
d)PS
D (sup
)PS
D pel
let
(0.5
x)
who
le b
rain
250150100
755037
150100
755037
anti-Stx4 TO-PRO merge
Cortex
sr
so
sr
so
CA1
CA1
anti-Stx4 TO-PRO merge
+Control Peptide
-Control Peptide
HippocampusA
B C
25
15
5
0 0.4 0.8-0.4
Pre Post
Distance from cleft (μm)
)selcitrap t necr ep( yti s ned gnil ebal
Stx1Stx2Stx3Stx4
S
P
ddd
Figure S2. Stx4 is Expressed in Brain and is Postsynaptically Enriched, Related to Figure 4(A) Immunohistochemical localization of syntaxin-4 (Stx4). Coronal mouse brain sections (50 mm thick) were stained with anti-Stx4 antibody (green) and the
nuclear stain TO-PRO (red). Representative labeling from CA1 hippocampus (left) and neocortex (right) are shown. Incubation of the primary antibody with
peptide antigen abolished the labeling (+ control peptide). Abbreviations: sr, stratum radiatum; so, stratum oriens. Scale bars, 60 mm.
(B) Immunoblot analysis of mouse brain fractions was performed with antibodies against Stx1 and Stx4. Equal amounts of total protein (12 mg) were loaded for
each fraction except for the PSD lane, which was loaded with half as much total protein (6 mg). Note that Stx1 was abundant in the crude synaptic vesicle fraction
indicating a large portion of Stx1 is present in presynaptic terminals. Stx4 is present in synaptic fractions but not synaptic vesicles. Unlike Stx1, Stx4 does not form
constitutive detergent insoluble high molecular weight complexes (arrows). Neither Stx1 nor Stx4 is strongly associated with the PSD fraction. Abbreviations: SV
(crude synaptic vesicles), syn (synaptosome fraction), PSD sup (supernatant from postsynaptic density fraction), PSD (postsynaptic density fraction). Molecular
mass markers are shown.
(C) Distribution of syntaxins 1-4 at asymmetric synapses determined by immunogold labeling. The distance (d) of individual gold particles was measured along an
axis perpendicular to the synaptic cleft with negative and positive values representing particles at presynaptic and postsynaptic sites, respectively (inset). Stx1
labeling was enriched 2-fold in presynaptic compartments while Stx4 was enriched 4-fold in postsynaptic compartments. Labeling for Stx2 and 3 was distributed
more evenly across pre and postsynaptic compartments. Inset scale bar represents 200 nm.
S6 Cell 141, 524–535, April 30, 2010 ª2010 Elsevier Inc.

B
Stx4
TfR-SEP
Dendritic spine
Stx4
TfR-SEP*
C
1.0
0.5
0
-2 0 2 4time (s)
inte
nsity
(nor
mal
ized
)
Stx4TfR-SEP
1.0
0.5
0
inte
nsity
(nor
mal
ized
)
-20 0 20 40time (s)
Stx4TfR-SEP
*
**
COS7
*
Aver
age
clus
ter
vel
ocity
(μm
/s)
0 1 2 3-1-2-3time (s)
0.4
0.8
0
Aver
age
clus
ter
vel
ocity
(μm
/s)
0.4
0.8
0
pre
post
D
*TfR-SEP
0.33s/frame
3s/frame
COS7 cells dendritic spines
A
E
Figure S3. Labeling and Cluster Dynamics of Surface Stx4, Related to Figure 5
(A) Stx4-HA clusters are not caused by antibody-induced cross-linking. COS7 cells expressing Stx4-HA were labeled with anti-HA antibodies and Cy3-conju-
gated anti-mouse Fab antibody either live (ab-fix), or following fixation (fix-ab). Note the identical clustered appearance of Stx4 in both cases. Arrows indicate
individual Stx4 clusters. The scale bar represents 5 mm; inset, 0.5 mm.
(B) Surface-labeled Stx4 cluster intensity was measured during TfR-SEP exocytosis in COS7 cells (top panel) and in dendritic spines (bottom panel). The gray
scale image of the first frame when exocytosis was detected (asterisk) is shown to the left.
(C) Surface labeled Stx4 cluster intensity was quantified during TfR-SEP exocytosis in COS7 cells (left panel; n = 6 events) and dendritic spines (right panel) (n = 6
events). Stx4 cluster intensity increased immediately prior to or concomitant with exocytosis. Error bars represent SEM.
(D) Quantification of Stx4 cluster velocity during exocytosis. Note the pausing of the Stx4 cluster immediately prior to exocytosis. Error bars represent SEM, n = 6
events.
(E) Average velocity over a two second time window before exocytosis (pre) and immediately following exocytosis (post).
Cell 141, 524–535, April 30, 2010 ª2010 Elsevier Inc. S7

mergeStx4
Scr
shRNA #3
3T3 cellsA B
C
Scr #1 #3
Stx4
Tubulin
Scr #1 #3
Stx4
Tubulin
Scr #1 #3
0.2
0.6
1.0
Aver
age
inte
nsity
(nor
mal
ized
)
0.4
0.8
Aver
age
inte
nsity
(nor
mal
ized
)
0.2
0.6
1.0
0.4
0.8
Scr #1 #3
hippocampal neurons
3T3 cells
hippocampal neurons3T3 cells
α-HA F 2˚
α-HA IgG 2˚
ab
0 40 80time (s)
F/F 0
0.2
0.6
1.0 FIgGab
D E
Figure S4. Chronic and Actute Disruption of Stx4 by shRNA and Antibody Crosslinking, Related to Figure 6(A) 3T3 cells were infected with lentivirus harboring mCherry (red) and Stx4 shRNA #3 or a scrambled control shRNA (Scr) and stained for endogenous Stx4
(green). Note the decrease in endogenous Stx4 labeling in cells expressing Stx4 shRNA (bottom), but not in cells expressing a scrambled control shRNA
(top). Scale bar, 5mm.
(B) Quantification of Stx4 staining in 3T3 cells (left) or hippocampal neurons (right) infected with virus expressing scrambled control shRNA (Scr) or two different
shRNAs directed against Stx4 (#1, #3).
(C) Immunoblot analysis of Stx4 from 3T3 cultures (top) or hippocampal neurons (bottom) infected with Stx4 shRNAs (#1, #3) or a scrambled control shRNA (Scr)
at 5 days postinfection. Tubulin served as a loading control.
(D) Crosslinking of surface Stx4 with IgG secondary. Live COS7 cells expressing Stx4-HA were incubated with mouse monoclonal anti-HA antibody followed by
either Cy3-conjugated anti-mouse Fab (upper panel) or Cy3-conjugated anti-mouse whole IgG (lower panel). Large aggregates of surface Stx4 quickly formed
upon incubation with bivalent IgG secondary antibody (lower panel) but not monovalent Fab fragments (upper panel). The dashed lines represent cell outlines.
Scale bar, 2.5 mm, inset 0.5 mm.
(E) Fluorescence recovery after photobleaching (FRAP) of surface labeled Stx4-HA labeled using Cy3-conjugated Fab or whole IgG anti-HA in COS7 cells. Mono-
valently labeled Stx4-HA recovered, whereas crosslinking with bivalent IgG severely reduced the mobility of Stx4-HA. Scale bar, 2.5 mm.
S8 Cell 141, 524–535, April 30, 2010 ª2010 Elsevier Inc.

250150100
75
50
37
25
20
Stx4
ΔTM
Stx3
ΔTM
Figure S5. Purity of Recombinant StxDTM Proteins, Related to Figure 7
Recombinant Stx4DTM and Stx3DTM were expressed and purified from E. coli. Coomassie staining of the purified protein fractions resolved by SDS-PAGE are
shown. Molecular mass markers are indicated.
Cell 141, 524–535, April 30, 2010 ª2010 Elsevier Inc. S9