Embed Size (px)
Citation preview

Synergistic impacts of small dams onSynergistic impacts of small dams onSouth African riversSouth African rivers
SukhmaniSukhmani Mantel, Denis Mantel, Denis Hughes, Hughes, NikiteNikite MullerMuller
Institute for Water Research Institute for Water Research Rhodes UniversityRhodes University

World Commission on Dams (2000)World Commission on Dams (2000)ImportanceImportance …… 3030--40% of40% of irrigated landirrigated landworldwide now relies on dams and that dams worldwide now relies on dams and that dams generate 19% of world generate 19% of world electricityelectricity
ImpactsImpacts ……loss of aquatic loss of aquatic biodiversitybiodiversity, of , of fisheriesfisheries, and of , and of ecosystem servicesecosystem services of of floodplains, wetlands, floodplains, wetlands, …… notnot possible to mitigate possible to mitigate many of the impacts of reservoir creation many of the impacts of reservoir creation
SolutionsSolutions …… environmental flow requirementsenvironmental flow requirementsto reduce impacts of changed to reduce impacts of changed streamflowstreamflow regimesregimes
OptionsOptions for meeting energy, water and food needs include for meeting energy, water and food needs include demanddemand--side managementside management, , supply efficiencysupply efficiency, and , and new new supply optionssupply options

Impacts of damsImpacts of dams
Nilsson et al. (2005) Fragmentation and flow regulation of the world’s large river systems. Science 308: 405-8.
Limpopo and Orange Rivers
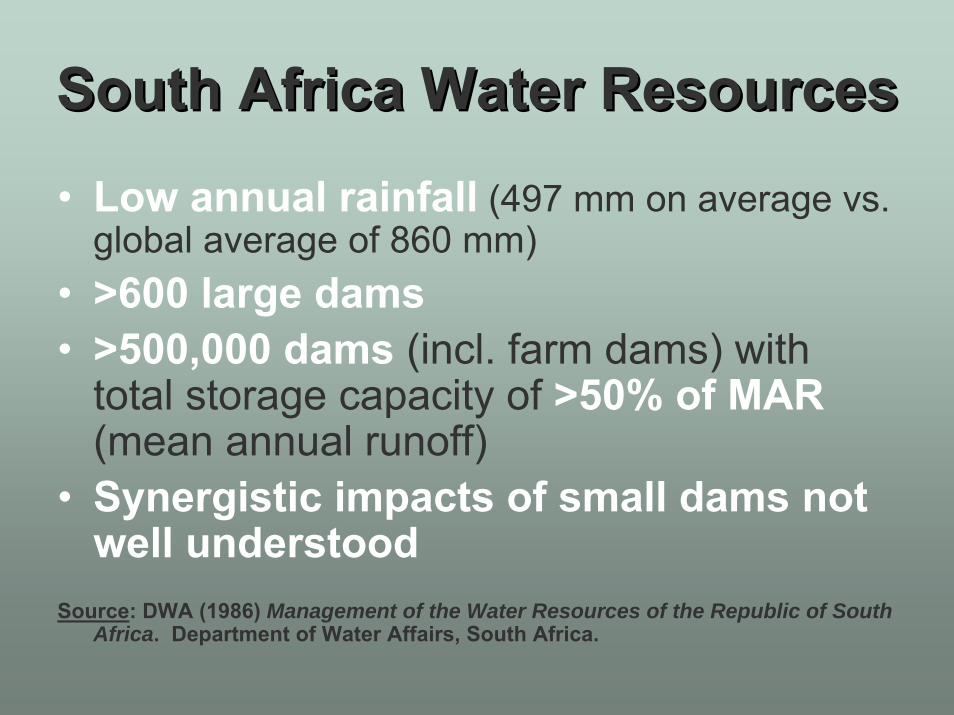
South Africa Water ResourcesSouth Africa Water Resources
• Low annual rainfall (497 mm on average vs. global average of 860 mm)
• >600 large dams• >500,000 dams (incl. farm dams) with
total storage capacity of >50% of MAR(mean annual runoff)
• Synergistic impacts of small dams not well understood
Source: DWA (1986) Management of the Water Resources of the Republic of South Africa. Department of Water Affairs, South Africa.

River Health River Health ProgrammeProgramme(Nat’l Biomonitoring Programme)
ASPT Average Score per Taxon - invertebrate river health indicator
Sub-region classification based on gradient / substrate
Water Chemistry
Stream GaugesStream GaugesDischarge (Q90, Q75, Q50, Q10, Mean Daily Flow)
National DatabasesNational Databases

Large Dam (>3x10Large Dam (>3x1066 mm33))Impact AssessmentImpact Assessment
Dam storage capacity vs. MAR Scale0-5% 0>5-10% 1>10-15% 2>15-20% 3>20-25% 4>25% 5

Small Dam Impact Assessment Small Dam Impact Assessment
Number of dams / √Catch. area Scale0-5 0>5-15 1>15-25 2>25-35 3>35-45 4>45 5

Water Management AreasWater Management Areas
Western Western CapeCape
MpumalangaMpumalanga
LOWER ORANGE
LOWER VAAL
LIMPOPO
UPPER ORANGE
GOURITZ
OLIFANTS
FISH TO TSITSIKAMMA
UPPER VAALMIDDLE VAAL
OLIFANTS/DOORN
THUKELA
INKOMATI
BREEDE
BERG
MZIMVUBU TO KIESKAMMA
USUTU TO MHLATHUZE
CROCODILE(WEST) AND MARICO
MVOTI TO UMZIMKULU
LUVUVHU AND LETABA

Western Cape dams and Western Cape dams and RHP sampling locationsRHP sampling locations
217 samples @ 92 sampling locations

Western Cape Land UseWestern Cape Land Use
Vineyards and cultivation near coastVineyards and cultivation near coast

File - WC AnalysisWithNumberOfSmallDamsNew.xls
Principal Components Analysis-1
0
1
-1 0 1
PCA axis 1 (48.8%)
PCA
axi
s 2
(16.
1%)
NO3-N
pH
TSS
ASPT
No. of families
Biodiversity measures
Water quality variables
Western CapeWestern Cape
-3
0
3
-4 2
PCA axis 1
PC
A a
xis
2
Sm Dam Impact 0Sm Dam Impact 1Sm Dam Impact 2Sm Dam Impact 3/4

WesternWesternCapeCape
Principal Components
Analysis
-3
0
3
-4 2
PCA axis 1
PC
A a
xis
2
Sm Dam Impact 0Sm Dam Impact 1Sm Dam Impact 2Sm Dam Impact 3/4
-1
0
1
-1 0 1
PCA axis 1 (48.8%)
PCA
axi
s 2
(16.
1%)
NO3-N
pH
TSS
ASPT
No. of families
Biodiversity measures
Water quality variables

Are differences significant?Are differences significant?
Separate t-tests on data from 3 subregions(geomorph. / longitudinal classification)
MountainFoothill-cobbleFoothill-gravel
…. as different substrates & inverts

Number of samples by Number of samples by SubregionSubregionWESTERN CAPEWESTERN CAPE
((Not includingNot including sites impacted by large dams)sites impacted by large dams)
Small Dam Impact = 0
Small Dam Impact > 0
Foothill-gravel
23 10
Foothill-cobble
55 17
Mountain 74 2Mountain streams with low # of impacted samples

TT--test test ((PP value)value)
ASPT ↓↓ (0.003)NO3-N ↑↑ (0.04)
GRAVEL GRAVEL STREAMSSTREAMS
Small Dam Impact = 0versus
Small Dam Impact > 0(> 5 dams / √catch area)
File - WC AnalysisWithNumberOfSmallDamsNew.xls
0
5
10
15
20
ASPT # Invert Taxa pH NO3-N TSS
Mea
n (S
D)
Small Dam Impact=0 (n = 23)Small Dam Impact>0 (n = 10)
WC Gravel Streams
**
*

TT--testtest ((PP value)value)
pH ↑↑ (0.01)
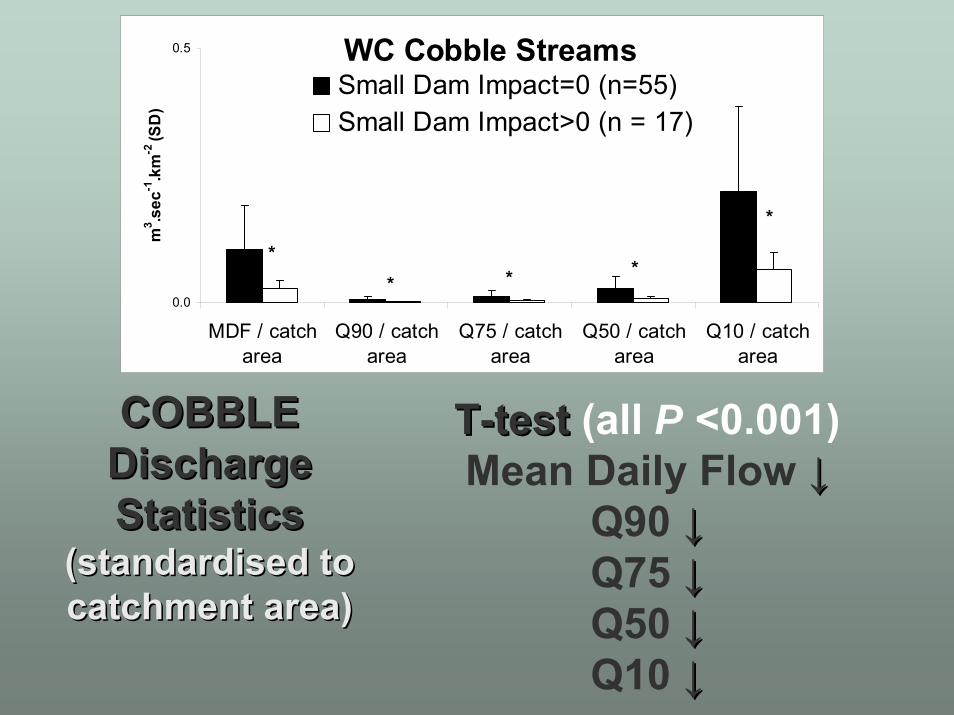
COBBLE COBBLE STREAMSSTREAMS
Small Dam Impact = 0versus
Small Dam Impact > 0(> 5 dams / √catch area)
File - WC AnalysisWithNumberOfSmallDamsNew.xls
0
5
10
15
20
ASPT # Invert Taxa pH NO3-N TSS
Mea
n (S
D)
Small Dam Impact=0 (n = 55)Small Dam Impact>0 (n = 17)
WC Cobble Streams
*

TT--test test (all P <0.001)Mean Daily Flow ↓↓
Q90 ↓↓Q75 ↓↓Q50 ↓↓Q10 ↓↓
GRAVEL GRAVEL Discharge Discharge StatisticsStatistics
((standardisedstandardised to to catchmentcatchment area)area)
0.0
0.5
1.0
MDF / catch area Q90 / catch area Q75 / catch area Q50 / catch area Q10 / catch area
m3 .s
ec-1
.km
-2 (S
D)
Small Dam Impact=0 (n=23)Small Dam Impact>0 (n = 10)
WC Gravel Streams
*
* * *
TT--test test (all P <0.001)Mean Daily Flow ↓↓
Q90 ↓↓Q75 ↓↓Q50 ↓↓Q10 ↓↓
COBBLE COBBLE Discharge Discharge StatisticsStatistics
((standardisedstandardised to to catchmentcatchment area)area)
0.0
0.5
MDF / catcharea
Q90 / catcharea
Q75 / catcharea
Q50 / catcharea
Q10 / catcharea
m3 .s
ec-1
.km
-2 (S
D)
Small Dam Impact=0 (n=55)Small Dam Impact>0 (n = 17)
WC Cobble Streams
*
*
* * *

Mpumalanga small dams andMpumalanga small dams andRHP sampling locationsRHP sampling locations
361 samples @ 127 sampling locations
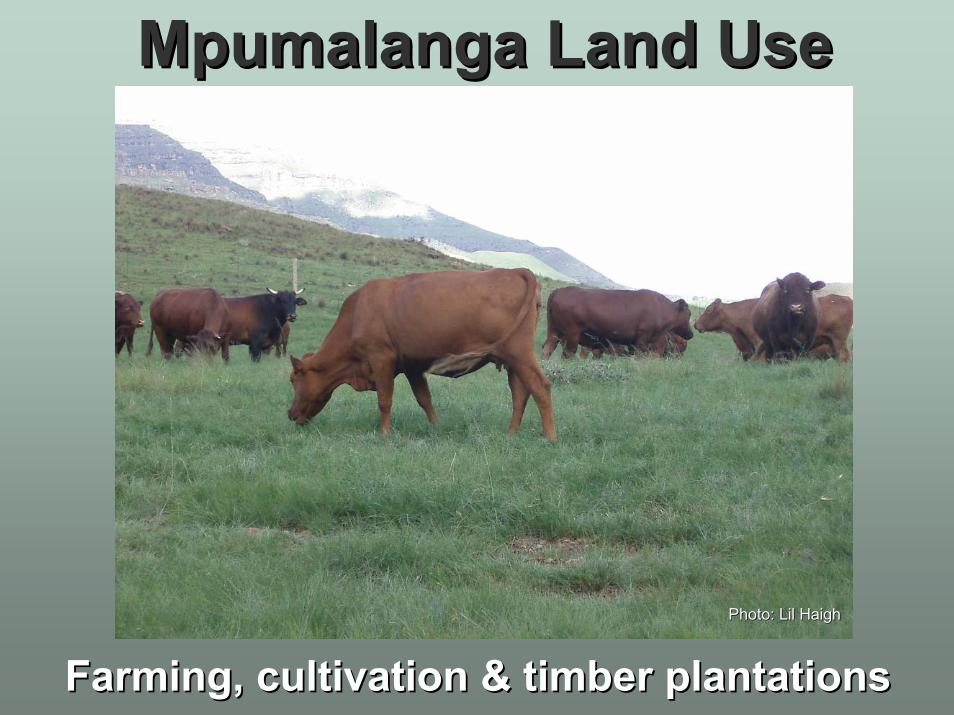
Mpumalanga Land UseMpumalanga Land Use
Farming, cultivation & timber plantationsFarming, cultivation & timber plantationsPhoto: Photo: LilLil HaighHaigh

MpumalangaMpumalanga
File MPUSubstrateAnlaysisWithNumberOfDamsNew.xls
Principal Components Analysis -1
0
1
-1 0 1
PCA axis 1 (39.2%)
PCA
axi
s 2
(21.
7%)
NO3 + NO2
pH
TDSASPT
No. of families
Water quality variables
Biodiversity measures
-5
-4
-3
-2
-1
0
1
2
3
4
-7 -6 -5 -4 -3 -2 -1 0 1 2 3
Sm Dam Impact =0
Sm Dam Impact =1
Sm Dam Impact =2
Sm Dam Impact =3

MpumalangaMpumalanga
File MPUSubstrateAnlaysisWithNumberOfDamsNew.xls
Principal Components Analysis
-5
-4
-3
-2
-1
0
1
2
3
4
-7 -6 -5 -4 -3 -2 -1 0 1 2 3
Sm Dam Impact =0
Sm Dam Impact =1
Sm Dam Impact =2
Sm Dam Impact =3
-1
0
1
-1 0 1
PCA axis 1 (39.2%)
PCA
axi
s 2
(21.
7%)
NO3 + NO2
pH
TDSASPT
No. of families
Water quality variables
Biodiversity measures

Number of samples by Number of samples by SubregionSubregionMPUMALANGAMPUMALANGA
((Not includingNot including sites impacted by large dams)sites impacted by large dams)
Small Dam Impact = 0
Small Dam Impact > 0
Foothill-gravel 42 32
Foothill-cobble 104 0
Mountain 100 0
Mountain and Cobble streams with no impacted samples

FOOTHILLFOOTHILL--GRAVELGRAVELSmall Dam Impact = 0
versusSmall Dam Impact > 0
(> 5 dams / √catch area)
TT--testtest ((PP value)value)ASPT ↓↓ (0.038)TDS ↑↑ (<0.001)
0
50
100
150
200
250
300
350
400
450
# Invert Taxa ASPT NO3+NO2 pH TDS
Small Dam Impact=0 (n = 42)Small Dam Impact>0 (n = 32)
MPL Gravel Streams
*
*

TT--testtest (all P <0.001)Mean Daily Flow ↓↓
Q90 ↓↓Q75 ↓↓Q50 ↓↓Q10 ↓↓
0.00
0.15
MDF/catch area Q90/catch area Q75/catch area Q50/catch area Q10/catch area
m3 .s
ec-1
.km
-2 (S
D)
Small Dam Impact=0 (n = 42)Small Dam Impact>0 (n = 32)
MPL Gravel
* * * **
GRAVEL GRAVEL Discharge Discharge StatisticsStatistics
((standardisedstandardised to to catchmentcatchment area)area)

SummarySummaryASPT pH NO3 TDS
WC Gravel ↓↓ ↑↑
WC Cobble ↑↑
MPL Gravel ↓↓ ↑↑
Changes associated with ↓ in discharge

Research ImplicationResearch ImplicationQuantity Quality
Limitation: threshold for small dam impacted /unimpacted sites assumed to be at arbitrary 5 small dams.km-1 => need field research to determine threshold of biological significance
Future work: • Need to determine “acceptable” decreases in
biodiversity and water chemistry variables that balance resource protection and sustainable use
• Other methods of classifying dam impact besides number of dams?

AcknowledgementsAcknowledgements
• International River Foundation
• Rhodes Postdoc Fellowship (Rhodes University, South Africa)
• Prof. Denis Hughes and Dr. Nikite Muller
• UCEWQ-IWR staff and students


Principal Components AnalysisLarge and Small
dams impact combinedWestern CapeWestern Cape
File - WC AnalysisWithNumberOfSmallDamsNew.xls
-3
0
3
-4 2
PCA axis 1
PC
A a
xis
2
Total Dam Impact 0Total Dam Impact 1Total Dam Impact 2/3Total Dam Impact 4-9

Principal Components AnalysisLarge and Small
dams impact combined
MpumalangaMpumalangaFile MPUSubstrateAnlaysisWithNumberOfDamsNew.xls
-5
-4
-3
-2
-1
0
1
2
3
4
-7 -6 -5 -4 -3 -2 -1 0 1 2 3
Total Dam Impact =0Total Dam Impact =1/2Total Dam Impact =3/4/5Total Dam Impact =6/7

Calculation of Anthropogenic Impacts
Large Dams Storage capacity / MAR
Urban Development
Runoff increase due to development relative to natural runoff
Irrigation Irrigation water demand estimated from % irrigation area
Forestry % reduction in MAR estimated from % area under forestry
Small Dams # dams / √catch area

Correlation of Impacts with Changes in WCCorrelation of Impacts with Changes in WC
-1
0
1
-1 0 1
PCA axis 1 (49.2%)
PCA
axi
s 2
(16.
1%)
NO3
pH
TSS
ASPT
No. of families
Forestry
Sm DamsLg Dams
IrrigationUrban Dev

Correlation of Impacts with Changes inCorrelation of Impacts with Changes in MPLMPL
-1
0
1
-1 0 1
PCA axis 1 (39.2%)
PCA
axi
s 2
(21.
7%)
NO2+NO3
pH
TDSASPT
No. of families
ForestrySm Dams
Lg Dams
Irrigation
Urban Dev

% small dam area relative to % small dam area relative to catchmentcatchment
Small Dam Impact = 0
Small Dam Impact > 0
WC Gravel 23 (0.02%) 10 (0.77%)
WC Cobble 55 (0.03%) 17 (1.03%)
MPL Gravel 42 (0.87%) 24 (3.1%)

Ecological ReserveEcological Reserve… relates to water required to protect the aquatic ecosystems of the water resource (National Water Act 1998)
… refers to both the quantity and quality of the water in the resource
Research gap: links between quantity and quality => present research looking at anthropogenic impacts on water quality