Embed Size (px)
Citation preview

SymposiumClousureNumbers

Registrations:192Participants166Frequent participants138

ARGENTINA 4 AUSTRALIA 1 BANGLADESH 2 BRAZIL 32 CANADA 7 CHINA 16 FINLAND 1 FRANCE 2 GERMANY 8 INDIA 1 JAPAN 8NETHERLANDS 1NEW ZEALAND 1SINGAPORE 2
SOUTH AFRICA 3 SPAIN 1 SWITZERLAND 1 TUNISIA 2 TURKEY 1 UNITED KINGDOM 12 UNITED STATES OF AMERICA 31

Evaluation Registration …………………………………. 3,8Location ……………….. ……………………. 4,5Grounds ………………………………….……. 4,3Coffee Breaks …………………………….…. 4,5Oral Session …………………………….……. 4,0Panel discussion …….. ……………………. 3,8Presentation …………………………………. 4,3Training ………………….……………….……. 4,5Staff ……………………….…………………….. 4,7Sound System Lights/Datashow …... 3,6Dinner ……………………………..……………
4,0
WSN12 Suggestion: Hong Kong and South Africa
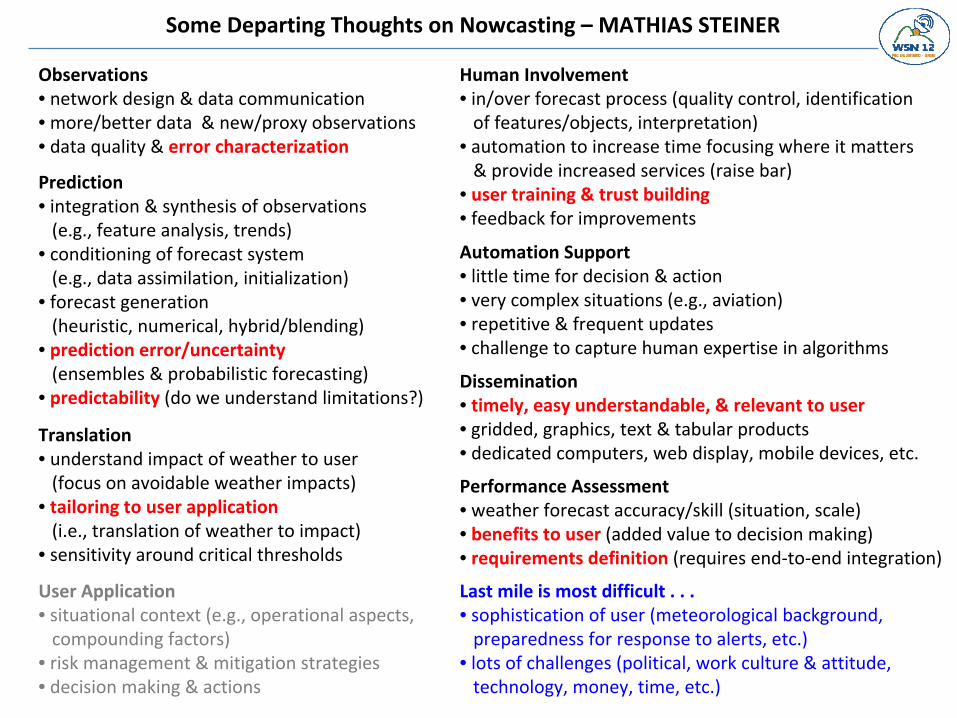
Observations• network design & data communication• more/better data & new/proxy observations• data quality & error characterization
Prediction• integration & synthesis of observations
(e.g., feature analysis, trends)
• conditioning of forecast system
(e.g., data assimilation, initialization)
• forecast generation
(heuristic, numerical, hybrid/blending)
• prediction error/uncertainty
(ensembles & probabilistic forecasting)
• predictability (do we understand limitations?)
Translation• understand impact of weather to user
(focus on avoidable weather impacts)
• tailoring to user application
(i.e., translation of weather to impact)
• sensitivity around critical thresholds
User Application• situational context (e.g., operational aspects,
compounding factors)
• risk management & mitigation strategies• decision making & actions
Automation Support• little time for decision & action• very complex situations (e.g., aviation)• repetitive & frequent updates• challenge to capture human expertise in algorithms
Human Involvement• in/over forecast process (quality control, identification
of features/objects, interpretation)
• automation to increase time focusing where it matters
& provide increased services (raise bar)
• user training & trust building• feedback for improvements
Performance Assessment• weather forecast accuracy/skill (situation, scale)• benefits to user (added value to decision making)• requirements definition
(requires end‐to‐end integration)
Some Departing Thoughts on Nowcasting –
MATHIAS STEINER
Dissemination• timely, easy understandable, & relevant to user• gridded, graphics, text & tabular products• dedicated computers, web display, mobile devices, etc.
Last mile is most difficult . . .• sophistication of user (meteorological background,
preparedness for response to alerts, etc.)
• lots of challenges (political, work culture & attitude,
technology, money, time, etc.)

WSN12

WSN12‐
TRAINING


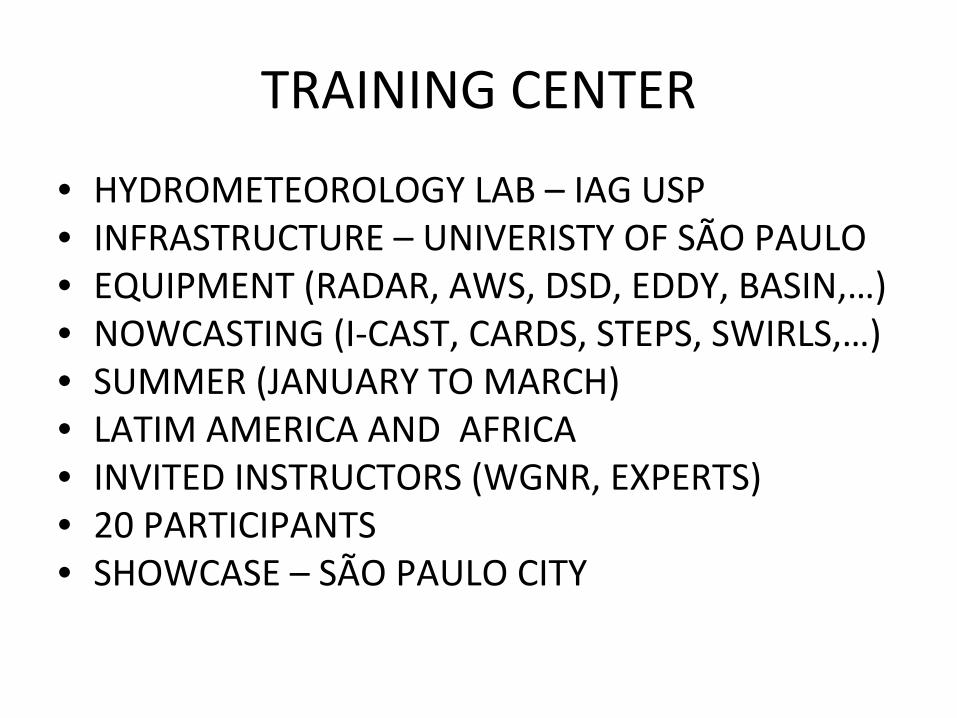
TRAINING CENTER
• HYDROMETEOROLOGY LAB – IAG USP• INFRASTRUCTURE –
UNIVERISTY OF SÃO PAULO
• EQUIPMENT (RADAR, AWS, DSD, EDDY, BASIN,…)• NOWCASTING (I‐CAST, CARDS, STEPS, SWIRLS,…)• SUMMER (JANUARY TO MARCH)• LATIM AMERICA AND AFRICA• INVITED INSTRUCTORS (WGNR, EXPERTS)• 20 PARTICIPANTS• SHOWCASE – SÃO PAULO CITY

CONTINENTAL SCALE

RAINFALL OVER SOUTH AMERICARAINFALL OVER SOUTH AMERICA
Augusto J. Pereira FilhoAugusto J. Pereira Filho11
Camila G. M. RamosCamila G. M. Ramos11
John E. JanowiakJohn E. Janowiak22
Viviane B. S. SilvaViviane B. S. Silva33
1DAC/IAG, University of São Paulo, Brazil 2ESSIC, University of Maryland, College Park, USA
3Climate Prediction Center/NOAA, USA
Four Workshop of the International Precipitation Working Group
October 13‐17, 2008 Beijing, China

<-La
Pla
ta
Amazon ->
S. F
ranc
isco
->

HOURLY ACCUMULATION2003 and 2004
(mm)
(Pereira et al., 2006)

TIME OF MAXIMUM RAINFALL
(mm)
(UTC)
2003 and 2004
(Pereira et al., 2006)


L
H
H
L
H
L
L
LL
H
HH

CONCLUSION• Rainfall Estimation Accumulation Time (worst -> best r2)
Daily (0.10) -> Monthly (0.58) -> Yearly (0.71);
• Rainfall Estimation Bias (worst -> best mm) SON (+80) -> JJA (-80) -> MAM (-20) -> DJF (0)Interior (+) -> Seashore (-)Convection (+) -> stratiform (-);
• CSI > 0.9 April -> September (>200 mm); • CSI < 0.8 January -> December (<150 mm);
• Water management of large watersheds of South America;
• Integration of CMORPH & raingauges;

MESOSCALE

Precipitation Climatology in São Paulo
Prado, Pereira Filho and Hallak (2006)

PRECIPITAÇÃO ANNUAL SP (mm)

FRAÇÃO DE DIAS CHUVOSOS


y = -0,0549Ln(x) + 0,9756ρ2 = 0,669
0,5
0,6
0,7
0,8
0,9
1
0 50 100 150 200 250 300 350 400 450 500
Distância (km)
ρ
micro meso macro

Evento
Anomalias El Niño La Niña Neutro
Positivas 19,6% 9,8% 23,5%
Negativas 11,8% 11,8% 23,5%
Freqüência de anomalias de precipitação média espacial para eventos de El Niño, La Niña e neutros entre 1947 e 1997.

CONCLUSION •
ANNUAL CYCLE;
•
Circulation (LOCAL <25 km and meso‐escala < 160 km) summer;
•
Synoptic Circulation (> 160 km) – winter;
•
El Niño (+), La Niña (‐) e neutros (+/‐) –
anomalies;

LOCAL SCALE

URBAM GROWTH IN MASP
2005
ESMPSP 11 e 12/08/2010

DAILY TEMPERATURE 1936 -2005

TEMPERATURE AND RU 1936 -2005
(Shein, 2006)

ANUAL GROUPING 1936-2005

DAILY GROUPING 1936-2005

IMPACTS
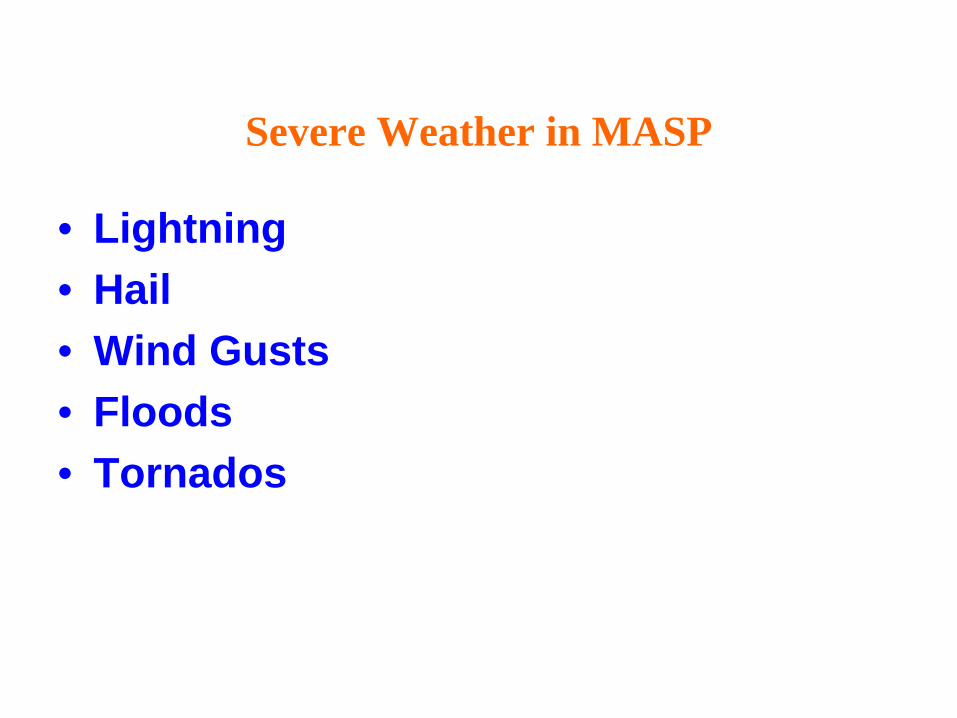
• Lightning• Hail• Wind Gusts• Floods• Tornados
Severe Weather in MASP

RMSP: dias 02 e 04 Fevereiro de 2004

Cidade de São Paulo 12/02/2004

GO
ES-
12 IR

ACQUA 20/06/ 2003
RSP - DAEE

(mm h-1)
ZONA SUL
ZONA LESTE

MORUMBI
02-02-2004
(mm)Fonte: OESP
Fonte: OESP

RIO ARICANDUVA
Fonte: OESP
Fonte: OESP

01/02 02/02 04/02
29/01 30/01 31/01
(mm)
PRECIPITAÇÃO DIÁRIA ESTIMADA COM RADAR METEOROLÓGICO
- 2004

SEA BREEZE 2002 -
2004


HEAT ISLAND –
MASP

(Pereira Filho et at., 2002)

# FLOODS

• MICRO CLIMATE CHANGES: -LESS VEGETATION+HORIZONTAL E VERTICAL URBANIZATION+AIR POLLUTION-NOT GLOBAL;
• TAR
+ 2,1O
C;• RAIN + 395 MM;• E + 0,5 M S-1;• S -
1,0 M S-1;
• RH -
7%.
CONCLUSION

MXPOL

Radar Meteorológico Móvel MXPOL – LabHidro.

MXPOL SYSTEM DESCRIPTION
REFLECTOR
Parabolic
Diameter 2.44 m
Antenna Gain 44 dB
HPBW @ 3dB < 1.0o
PEDESTAL
Azimuth scan o to 360o
Elevation scan 0 to 90o
Maximum scan 36º s-1
Pointing imprecision < 0.1o
TRANSMITTER
Magnetron
Frequency 9.3 to 9.5 GHz
Peak power 80 KW
Pulse modulation
PRF 500Hz to 5000Hz
Pulse width 0.2 μs to 2μs
Linear polarization (H,V) simultaneous
Solid state modulator
Duty cycle 0.001
RECEPTION
Two digital channels (H,V)
Radar Noise Figure < 2.5 dB
Dynamic range (H,V) > 80 dB
ADC 14 bits
Local oscillator DAFC
MDS (H,V) -113 dBm @ 2μs

PPI @ 0.6o of Kdp on 1831 UTC on 09 Feb 2007. Brown box with colored dots shows the location of lightning strikes every 5 min. from 1830 UTC to 1850 UTC (red, blue, pink and green).
X‐section of Kdp X‐section of Vr

MXPOL
PPI
of
Zh
@
1.0o
at
1608
UTC
on
16
February
2007
in
São
José
dos
Campos. site (23o11.7’; 45o57.9’)
X‐section of Zh
X‐section of Vr

PPI ‐
Zh PPI ‐
Vr
PPI ‐
ZdrPPI ‐
W
MXPOL PPIs at 0.6o
at 1528 UTC on 26 April 2007 in Barueri City,
São Paulo, Brazil (23o32.2’S; 46o52.8’
W).
ACQUA/MODIS ‐
Eastern São Paulo
State on 20 July 2003.

PMSP ‐CADES SP 20/01/2010
RURAL
URBANO
20 km


![Powerpoint presentatie finland[1]](https://img.dokumen.tips/doc/110x75/55b39b84bb61eb903d8b4712/powerpoint-presentatie-finland1.jpg)


