Embed Size (px)
Citation preview
Swisscom results:
“And the winner is: Q3 2010”
9 November 2010

2
1
3
4
5
And the winner is: Q3 2010
Q3 highlights
Segmental results 9 months
Group results
Outlook 2010
Carsten Schloter, CEO
Ueli Dietiker, CFO
6
Q&A
2
Offer to Fastweb minority shareholders
Agenda

3
And the winner is: Q3 2010
Financially, again a very strong quarter!
CHF mm
(a) Q1 2010 as reported(b) Q1 2010 excluding one-off provision of CHF 102mm for Fastweb VAT case
1

4
Trends have improved in 2010, with Q3 2010 the clear “winner”
Change YoY, total Swisscom Group in constant currency (@ CHF 1.40/€)
1And the winner is: all off 2010
Q3 2010
Revenue Growth YOY *)
EBITDA Growth YOY*)
5% -
4% -
3% -
2% -
1% -
-1% -
-2% -
-3% -
-4% -3% -2% -1% 1% 2% 3% 4% 5% 6%
Q2 2010Q1 2010
Q4 2009
Q3 2009
Q2 2009
Q1 2009
*) adjusted by M&A transactions, provisions and other one-off items
5
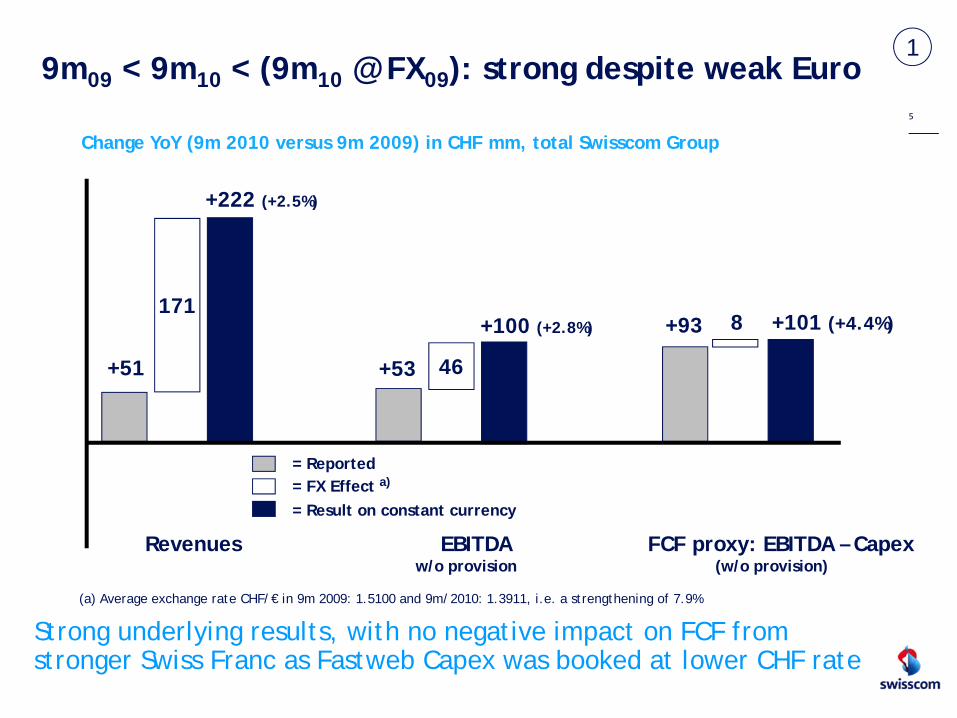
Strong underlying results, with no negative impact on FCF from stronger Swiss Franc as Fastweb Capex was booked at lower CHF rate
Change YoY (9m 2010 versus 9m 2009) in CHF mm, total Swisscom Group
19m09 < 9m10 < (9m10 @ FX09): strong despite weak Euro
171
+51
+222 (+2.5%)
Revenues EBITDA w/o provision
FCF proxy: EBITDA – Capex (w/o provision)
46
+100 (+2.8%)
+53
+101 (+4.4%)+93
= Reported= FX Effect a)
= Result on constant currency
8
(a) Average exchange rate CHF/€ in 9m 2009: 1.5100 and 9m/2010: 1.3911, i.e. a strengthening of 7.9%

6
Cockpit – customer trend over last 7 quarters
Up and downs, overall good market performance
45
31 3137
3121 23
0
10
20
30
40
Q1
09
Q2
09
Q3
09
Q4
09
Q1
10
Q2
10
Q3
10
Gross adds / cancellation rate wireless SCS
211 219 246 219 219256239
13.5%12.3%12.8%12.8%
12.6%12.3%12.3%
0
80
160
240
320
Q1
09
Q2
09
Q3
09
Q4
09
Q1
10
Q2
10
Q3
10
0%
4%
8%
12%
16%
Net adds xDSL retail SCS Net adds IPTV
2621
46 43 42 41
21
0
10
20
30
40
Q1
09
Q2
09
Q3
09
Q4
09
Q1
10
Q2
10
Q3
10
#k
3.9%3.9%3.8% 4.1%3.1%
4.0% 4.1%
0%
2%
4%
6%
8%
10%
Q1
09
Q2
09
Q3
09
Q4
09
Q1
10
Q2
10
Q3
10
3.7%3.8%3.9% 3.8% 3.8% 4.1% 4.7%
0%
2%
4%
6%
8%
10%
Q1
09
Q2
09
Q3
09
Q4
09
Q1
10
Q2
10
Q3
10
Readiness to change operator Readiness to change operator
2.6%3.7%3.1% 2.7% 3.1% 2.8% 3.4%
0%
2%
4%
6%
8%
10%
Q1
09
Q2
09
Q3
09
Q4
09
Q1
10
Q2
10
Q3
10
Wireline Voice Readiness to change operatorWireless
Churn #k #k
Broadband
5411 5472 5602 5650 5691 5761
1784 1825 1845 1863 1878 1906 19521564 1574 1573 1565 1567 1560 1571
5538
0
2
4
6
8
10
Q1
09
Q2
09
Q3
09
Q4
09
Q1
10
Q2
10
Q3
10
Subscribers Wireless Market Switzerland
Orange
Sunrise
#k 90958759 8871 8956 9030 Total
Subscribers Broadband Market Switzerland
others
SC:WHS
1379 1410 1478 1509 1530 1553
485 479485 485 485 487 493 496262 261 260 259 261 270
1441
478467 478472 484
501
0
1
2
3
Q1
09
Q2
09
Q3
09
Q4
09
Q1
10
Q2
10
Q3
10
#k 27482593 2628 2664 2708 Total
Cablecom
9284
SC: xDSL
?
?
Subs DigitalTV - Swisscom vs. Cablecom
359 357 379 397 415 432
275 317
362
232165 186139
358
0
200
400
600
800
Q1
09
Q2
09
Q3
09
Q4
09
Q1
10
Q2
10
Q3
10
Cablecom
Total611 672498 522 548 73227759157 790#k
1
FY 08
3m 09
HY 09
9m 09
FY 09
3m 10
HY 10
9m 10
7
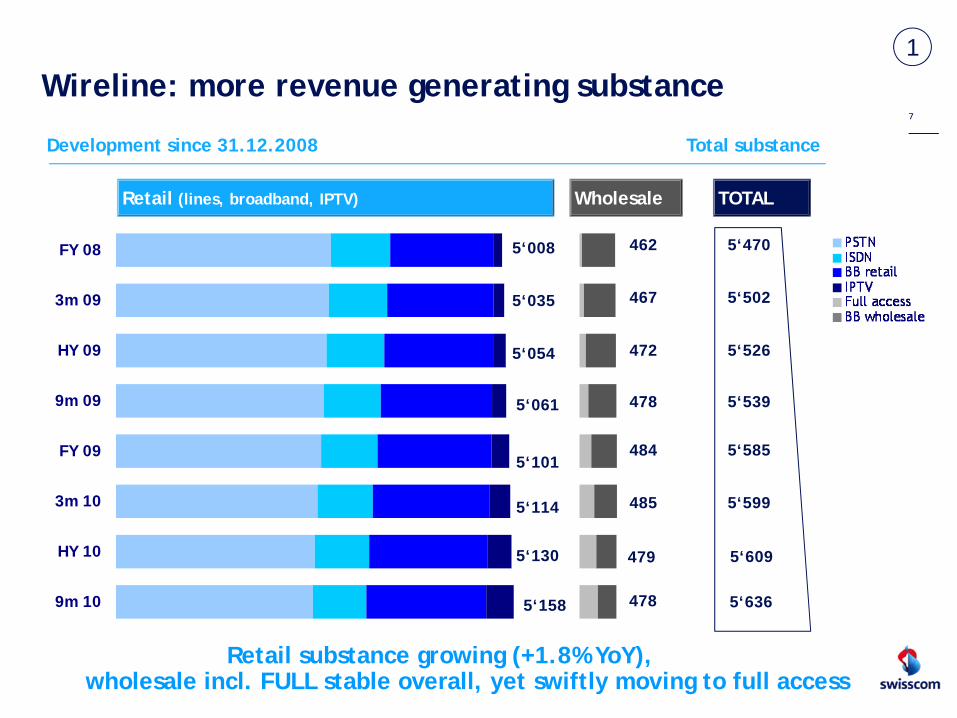
Total substanceDevelopment since 31.12.2008
Wireline: more revenue generating substance
5‘008
5‘035
5‘054
5‘061
5‘101
5‘114
5‘130 479
462
467
472
478
484
485
Retail (lines, broadband, IPTV) Wholesale
Retail substance growing (+1.8% YoY), wholesale incl. FULL stable overall, yet swiftly moving to full access
1
5‘158 478
5‘609
5‘470
5‘502
5‘526
5‘539
5‘585
5‘599
TOTAL
5‘636

8
Wireless: mobile new data revenues taking off
Mobile new data one of the most important growth drivers (+CHF 85mm or +36% YoY), helped by customer friendly devices such as iPhones and iPads
Quarterly revenues mobile new data (in CHF mm)
1N
umber of iPhones
(Swisscom
, thousands per end of each quarter)
iPhones: 6% of
contract customer
base
iPhones: 19% of
contract customer
base
(a) Consists of Data Traffic, domestic and outbound roaming from Swisscom customers. i.e. excl. SMS & MMS
SIM cards sold for use in iPad

Highlights Q3
Mobile Termination Rates (MTRs) adapted
• Symmetrical MTR cuts agreed with competitors from Oct 2010: CHF 80mm lower revenues p.a. (from 2011), no EBITDA impact
• Extension of MTR cuts to retail F2M tariffs to have CHF 50 mm impact on revenues and EBITDA in 2011 (assuming no elasticity)
9
Rp /
min
2

Highlights Q310
2
Swisscom MTR’s now on European average *
Avg rate: 6.9 Rp/Minute
Swed
en
Aust
ria
Fran
ce
Finl
and
Nor
way
Spai
n
UK
Swis
scom
Gre
ece
Port
ugal
Ger
man
y
Net
herla
nds
Den
mar
k
Italy
Irela
nd
Belg
ium
Rp/M
inut
e
12.00
10.00
8.00
6.00
4.00
2.00
0.00
* Status as per summer 2010
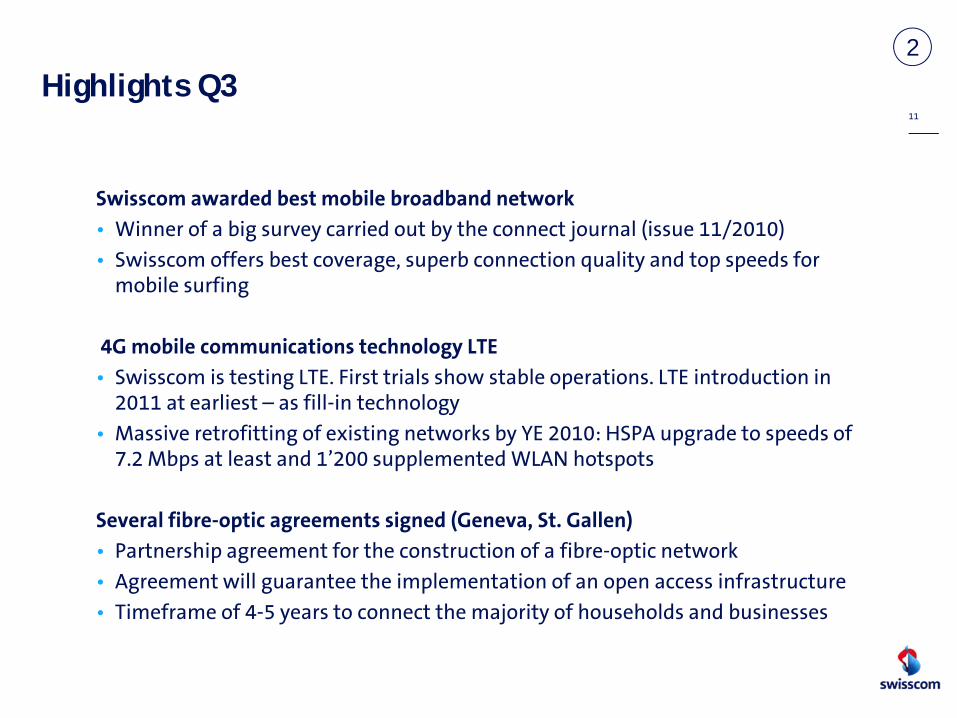
Highlights Q3
Swisscom awarded best mobile broadband network • Winner of a big survey carried out by the connect journal (issue 11/2010)• Swisscom offers best coverage, superb connection quality and top speeds for
mobile surfing
4G mobile communications technology LTE• Swisscom is testing LTE. First trials show stable operations. LTE introduction in
2011 at earliest – as fill-in technology• Massive retrofitting of existing networks by YE 2010: HSPA upgrade to speeds of
7.2 Mbps at least and 1’200 supplemented WLAN hotspots
Several fibre-optic agreements signed (Geneva, St. Gallen)• Partnership agreement for the construction of a fibre-optic network • Agreement will guarantee the implementation of an open access infrastructure• Timeframe of 4-5 years to connect the majority of households and businesses
11
2

Fastweb offer
Offer @ 18€/share launched in October, final acceptance day 12 November• Aim to delist Fastweb from Milan stock exchange• Goal to create more strategic and operational flexibility through 100% ownership
(after squeeze out)• Total cash out for Swisscom expected of € 256mm, not endangering the dividend
payment capability of the Group
Progress sofar• Acceptance per 8.11 would lead to >85% ownership for Swisscom• Typical practice for tender offers is that tendering takes place in last 3 days
Options• Ownership > 95%: right to buy remaining shares (squeeze out)• Ownership < 95%: right to withdraw the offer
– Ownership > 90%: right to delist the company (if acceptance condition waived)
– Ownership < 90%: option to merge Fastweb into a non-listed Swisscom entity
Conclusion: advisable in all cases for minority holders to tender their shares, as this will be the easiest way to monetize their stake
12
3
13
Agenda
1
3
4
5
And the winner is: Q3 2010
Q3 highlights
Segmental results 9 months
Group results
Outlook 2010
Carsten Schloter, CEO
Ueli Dietiker, CFO
6
Q&A
2
Offer to Fastweb minority shareholders
14
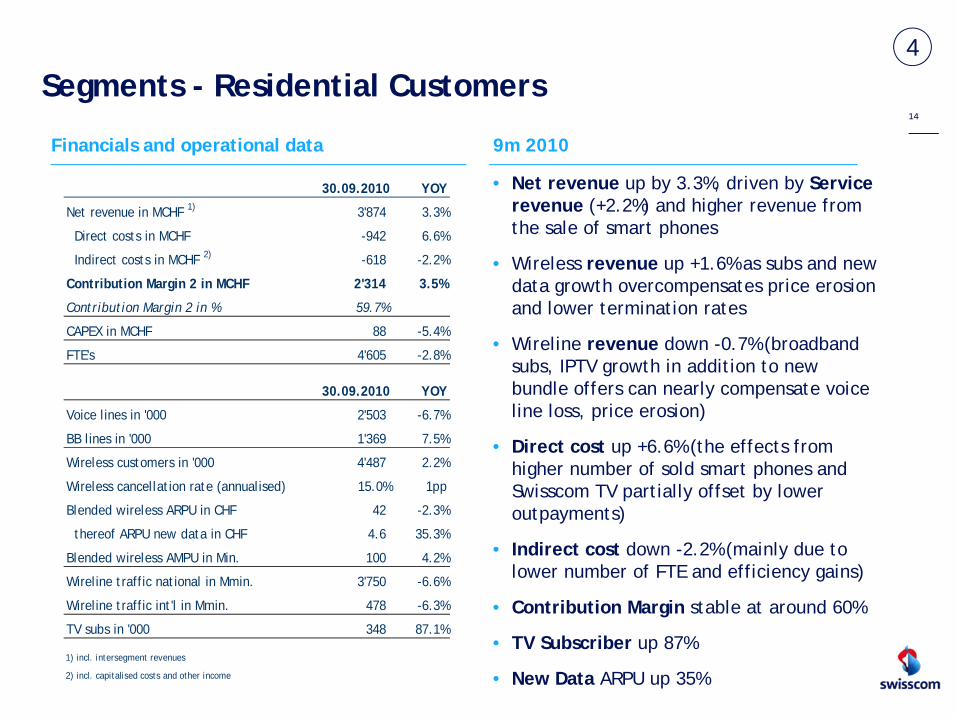
Segments - Residential Customers
9m 2010Financials and operational data
• Net revenue up by 3.3%, driven by Service revenue (+2.2%) and higher revenue from the sale of smart phones
• Wireless revenue up +1.6% as subs and new data growth overcompensates price erosion and lower termination rates
• Wireline revenue down -0.7% (broadband subs, IPTV growth in addition to new bundle offers can nearly compensate voice line loss, price erosion)
• Direct cost up +6.6% (the effects from higher number of sold smart phones and Swisscom TV partially offset by lower outpayments)
• Indirect cost down -2.2% (mainly due to lower number of FTE and efficiency gains)
• Contribution Margin stable at around 60%
• TV Subscriber up 87%
• New Data ARPU up 35%
30.09.2010 YOY
Net revenue in MCHF 1) 3'874 3.3%
Direct costs in MCHF -942 6.6%
Indirect costs in MCHF 2) -618 -2.2%
Contribution Margin 2 in MCHF 2'314 3.5%
Contribution Margin 2 in % 59.7%
CAPEX in MCHF 88 -5.4%
FTE's 4'605 -2.8%
30.09.2010 YOY
Voice lines in '000 2'503 -6.7%
BB lines in '000 1'369 7.5%
Wireless customers in '000 4'487 2.2%
Wireless cancellation rate (annualised) 15.0% 1pp
Blended wireless ARPU in CHF 42 -2.3%
thereof ARPU new data in CHF 4.6 35.3%
Blended wireless AMPU in Min. 100 4.2%
Wireline traffic national in Mmin. 3'750 -6.6%
Wireline traffic int'l in Mmin. 478 -6.3%
TV subs in '000 348 87.1%
1) incl. intersegment revenues
2) incl. capitalised costs and other income
4

15
Segments - Small & Medium-sized Enterprises
9m 2010Financials and operational data
• Net revenue up by +2.8% YoY (price erosion compensated by higher number of subscribers and new data growth)
• Direct costs down by -2.3% due to lower outpayments (decreasing rates)
• Indirect cost stable
• Contribution Margin up 1.0%-points to 74.1% YoY due to to revenue increase and lower direct costs
• BB lines up by +9.9%
• New Data ARPU up 22.6% to 13 CHF/month
30.09.2010 YOY
Net revenue in MCHF 1) 882 2.8%
Direct costs in MCHF -128 -2.3%
Indirect costs in MCHF 2) -100 0.0%
Contribution Margin 2 in MCHF 654 4.3%
Contribution Margin 2 in % 74.1%
CAPEX in MCHF 5 -37.5%
FTE's 743 -4.3%
30.09.2010 YOY
Voice lines in '000 513 0.6%
BB lines in '000 155 9.9%
Wireless customers in '000 485 9.0%
Wireless cancellation rate (annualised) 6.0% -1pp
Blended wireless ARPU in CHF 94 -2.1%
thereof ARPU new data in CHF 13.0 22.6%
Blended wireless AMPU in Min. 210 0.5%
Wireline traffic national in Mmin. 1'078 -2.6%
Wireline traffic int'l in Mmin. 133 -5.0%
1) incl. intersegment revenues
2) incl. capitalised costs and other income
4

16
Segments - Corporate Business
9m 2010Financials and operational data
• Revenue of 1’375 MCHF up by 1.1%. Decline of wireline revenue (voice lines and traffic volume) overcompensated by rising projects/outsourcing and Mobile revenue (subscriber and new data growth)
• Direct cost stable (increase in project/outsourcing revenue with low margin offset by lower outpayments)
• Indirect cost decline -4.9% (lower number of FTE and less expenses for external employees)
• Contribution Margin increased by 0.6%-points to 53.9% of net revenue due to revenue increase and cost management
• Order intake for project/outsourcing business totalling 123 MCHF (+11 MCHF vs. PY)
30.09.2010 YOY
Net revenue in MCHF 1) 1'375 1.1%
Direct costs in MCHF -322 0.3%
Indirect costs in MCHF 2) -312 -4.9%
Contribution Margin 2 in MCHF 741 4.2%
Contribution Margin 2 in % 53.9%
CAPEX in MCHF 50 -7.4%
FTE's 2'209 -1.8%
30.09.2010 YOY
Voice lines in '000 231 -4.5%
BB lines in '000 29 11.5%
Wireless customers in '000 789 12.1%
Wireless cancellation rate (annualised) 4.0% -5pp
Blended wireless ARPU in CHF 68 -6.8%
thereof ARPU new data in CHF 17.2 14.7%
Blended wireless AMPU in Min. 166 -6.7%
Wireline traffic national in Mmin. 1'160 -4.7%
Wireline traffic int'l in Mmin. 266 0.0%
1) incl. intersegment revenues
2) incl. capitalised costs and other income
4

17
Segments - Wholesale
9m 2010Financials and operational data
• Net revenue decreased by 118 MCHF - lower wireline termination volumes- lower interconnection rates- lower wireless termination rates - ongoing substitution towards full access- revenue decrease in data services+ higher inbound roaming
• Direct costs down by 72 MCHF as many revenue drivers push also down direct cost
• Full access lines growing substantially, mostly substituting wholesale broadband lines (ULL replaces wholesale broadband)
30.09.2010 YOY
Revenue from external customers in MCHF 583 -13.2%
Intersegment revenue in MCHF 393 -6.9%
Net revenue in MCHF 976 -10.8%
Direct costs in MCHF -630 -10.3%
Indirect costs in MCHF 1) -16 14.3%
Contribution Margin 2 in MCHF 330 -12.7%
Contribution Margin 2 in % 33.8%
CAPEX in MCHF - nm
FTE's 103 17.0%
30.09.2010 YOY
Full access lines in '000 238 107.0%
BB (wholesale) lines in '000 240 -33.9%
Wireline wholesale traffic in Mmin. 7'258 -14.9%
1) incl. capitalised costs and other income
4
18
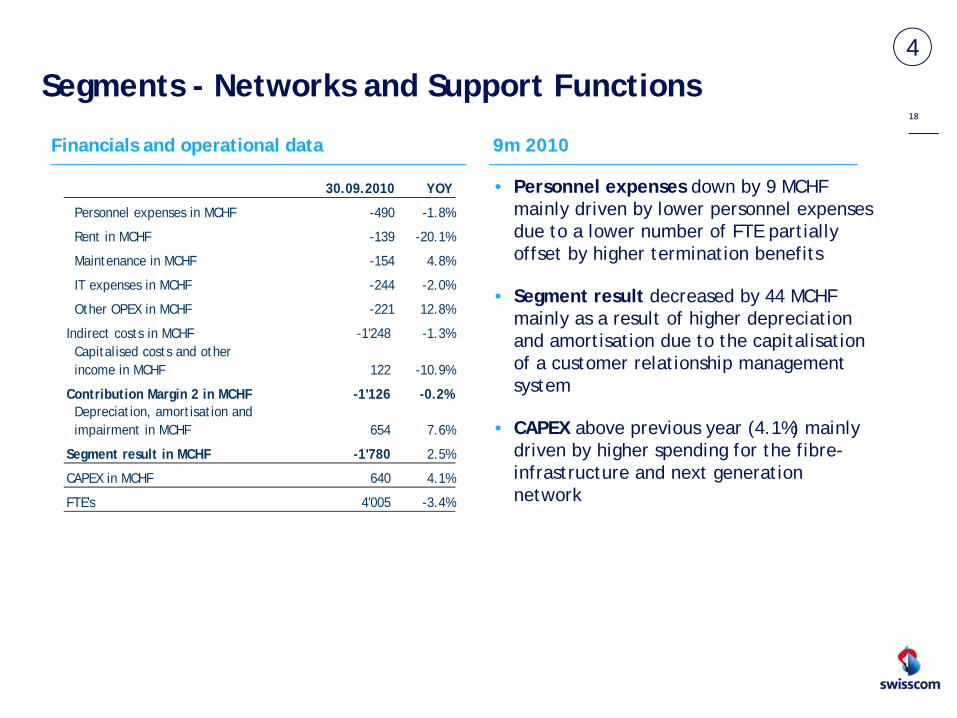
Segments - Networks and Support Functions
9m 2010Financials and operational data
• Personnel expenses down by 9 MCHF mainly driven by lower personnel expenses due to a lower number of FTE partially offset by higher termination benefits
• Segment result decreased by 44 MCHF mainly as a result of higher depreciation and amortisation due to the capitalisation of a customer relationship management system
• CAPEX above previous year (4.1%) mainly driven by higher spending for the fibre-infrastructure and next generation network
30.09.2010 YOY
Personnel expenses in MCHF -490 -1.8%
Rent in MCHF -139 -20.1%
Maintenance in MCHF -154 4.8%
IT expenses in MCHF -244 -2.0%
Other OPEX in MCHF -221 12.8%
Indirect costs in MCHF -1'248 -1.3%Capitalised costs and other income in MCHF 122 -10.9%
Contribution Margin 2 in MCHF -1'126 -0.2%Depreciation, amortisation and impairment in MCHF 654 7.6%
Segment result in MCHF -1'780 2.5%
CAPEX in MCHF 640 4.1%
FTE's 4'005 -3.4%
4

19
9m 2010Financials and operational data
Segments - Fastweb
• Revenues increased by 2.9% YoY – with a positive contribution from Consumer- and Executive segment. SME affected by very aggressive competition.
• Standalone EBITDA reaches 411 MEUR, up +1.7% YOY with a margin of 29.3% (-0.3pp lower compared to last year but +0.4pp vs. 6m 2010)
• In Swisscom’s accounts, a provision of 70 MEUR for the pending VAT case has been posted in Q1, directly affecting segmental EBITDA
• Contribution to Swisscom accounts in CHF lower than previous year, due to an ongoing strengthening of Swiss Franc in a YOY context (FX impact on total net revenue -166 MCHF / on EBITDA -41 MCHF)
30.09.2010 YOY
Consumer revenue in MEUR 535 3%
SME revenue in MEUR 301 -2%
Executive revenue in MEUR 1) 569 5%
Net revenue in MEUR 1) 1'405 3%
OPEX in MEUR -1'105 7%Capitalised costs and other income in MEUR 41 -42%
EBITDA in MEUR 341 -16%
EBITDA in MEUR w/o VAT prov. 411 2%
EBITDA margin in % 29.3%
CAPEX in MEUR 303 -3%
FTE's 3'125 1%
In Swisscom accounts 30.09.2010 YOY
EBITDA in MCHF 473 -23%
CAPEX in MCHF 421 -11%
30.09.2010 YOY
BB customers in '000 1'712 7%
Mobile customers in '000 330 106%
1) incl. revenues to Swisscom companies
4

20
Segments - Other operating segments
Financials and operational data 9m 2010
• External revenue up 81 MCHF (+13.5%):
– IT Services up 85 MCHF, mainly from new group companies Resource, Sourcag & Panatronic
– Swisscom Participations down 1 MCHF, the effect from outsourcing of facility management in 2009 was nearly offset by higher revenue from construction activities
• Intercompany revenues down 51MCHF due to outsourcing of facility management and reduced intercompany revenues at IT services
• EBITDA and margin slightly down
• Order intake IT Services CHF 353mm
30.09.2010 YOY
Swisscom IT Services in MCHF 387 28.1%
Swisscom Participations in MCHF 235 -0.4%
Hospitality Services in MCHF 58 1.8%
Other in MCHF 1 -80.0%
External revenue in MCHF 681 13.5%
Net revenue in MCHF 1) 1'279 2.4%
OPEX in MCHF -1'049 3.0%Capitalised costs and other income in MCHF 35 -5.4%
EBITDA in MCHF 265 -1.1%
EBITDA margin in % 20.7%
CAPEX in MCHF 79 -2.5%
FTE's 4'381 2.9%
1) incl. intersegment revenues
4

21
Group YTD: P&L breakdownin
CH
F m
m
EBIT and net income substantially lower compared to PY driven by EBITDA impact from Fastweb VAT provision as well as higher depreciation
(3‘593) (-1‘311) (-119) (2‘163) (-64) (1‘526)(+29) (-384) (1‘533) (-7)(-211)
3‘545 -1‘369
-109 2‘067-83 +18 -400
1‘408 +15
-194
1‘423
tax rate20.0%
tax rate22.1%
EPS CHF29.46
EPS CHF27.47
(prior year)
5

22
Group results - Cash flow breakdown
in C
HF
mm
3‘545 -1‘276
-125-177 -295
+53
-4752‘023
1‘551 +19
-1‘036
-113
(3‘593) (-1‘315) (-93) (-155) (-198) (-426)(-1‘715)(2‘154) (1‘801) (+780) (-308)(+9)
No cash flow impact from VAT provision. Despite lower capex and lower dividend payments to minority shareholders, operating free cash flow decreased by 131 MCHF due to the growth in net working capital
-8
-6(-40) (-984)
(prior year)
5

23
6Outlook 2010 – substantially improvedl
previousguidance in
CHF and €
expected change
new "guidance" in CHF bln
(at assumed rate of 1.40 CHF/€) comments
RevenuesSwisscom without Fastweb (CHF bln) 9.15 + 9.35 Both less price erosion as well as higher volume
growth than expected
Fastweb (€ bln) 1.95 - Just under € 1.9 bln, largely caused by changed revenue recognition and lower wholesale revenues
Proforma Group in CHF bln (assuming avg of CHF 1.40/€) 11.9 CHF +100mm 12.0
FY2010 to be slightly better than originally expected
EBITDA
Swisscom without Fastweb (CHF bln) 3.75 ++ 4.0Less price erosion as well as higher volume growth than expected lead to higher revenues, which translates fully into higher EBITDA. Additionally some extra cost savings achieved
Fastweb without VAT provision (€ bln) 0.58 -- ~5% lower than expected, largely caused by revenue recognition which impacts EBITDA
Proforma Group in CHF bln (assuming avg of CHF 1.40/€) 4.6 CHF +200mm 4.8
VAT provision € -70mm -0.1
Proforma Group including VAT provision CHF +100mm 4.7 FY 20VAT p
10 better than expected despite CHF 100mm rovision and lower exchange rate
Operating Free Cash Flow 2.6 0 2.6 Stable despite VAT provision and slightly higher (IT) CAPEX Fastweb. W/o potential extraordinary payments from existing regulatory provisions.

Questions &Answers

25
”This communication contains statements that constitute "forward-looking statements". In thiscommunication, such forward-looking statements include, without limitation, statements relating to ourfinancial condition, results of operations and business and certain of our strategic plans and objectives.
Because these forward-looking statements are subject to risks and uncertainties, actual future results maydiffer materially from those expressed in or implied by the statements. Many of these risks anduncertainties relate to factors which are beyond Swisscom’s ability to control or estimate precisely, such asfuture market conditions, currency fluctuations, the behaviour of other market participants, the actions ofgovernmental regulators and other risk factors detailed in Swisscom’s and Fastweb’s past and future filingsand reports, including those filed with the U.S. Securities and Exchange Commission and in past and futurefilings, press releases, reports and other information posted on Swisscom Group Companies’ websites.
Readers are cautioned not to put undue reliance on forward-looking statements, which speak only of thedate of this communication.
Swisscom disclaims any intention or obligation to update and revise any forward-looking statements,whether as a result of new information, future events or otherwise.”
For further information, please contact:phone: +41 31 342 6410 or +41 31 342 8658fax: +41 31 342 [email protected]/investor
Cautionary statementregarding forward-looking statements