Embed Size (px)
Citation preview

Further margin expansion is expected in nearly all major poultry production regions for the remainder of 2014, driven by strong poultry demand, high prices of competing proteins and the expectation of lower feed costs. The Russian ban is not likely to alter the global outlook, but trade streams will shift sharply, with Brazil coming through as the leader and the EU and US fighting for new markets in Africa, Asia and some Eastern European markets. Prices for legs and Mechanically Deboned Meat (MDM) will fall sharply. The local Russian and South African poultry industries will face sharp increases to prices as they operate under tight market conditions with demand likely to fall. Margins will grow significantly, but the exact level will depend on the possible establishment of a price ceiling by the Russian government. The Russian ban will have limited impact on US and EU poultry industries as strong local fundamentals and declining feed costs will compensate for lost export volumes. The US industry will remain at record high margins, while EU industry margins will also be healthy. Asian poultry markets will see market recovery. Supply discipline in China will support higher prices and margin recovery, despite ongoing food safety concerns and disease issues.
Global poultry markets: Bullish outlook, shifting trade streams
US: Record high margins - Measured supply growth - Well-balanced market conditions - Strong breast meat prices, lower leg prices
Brazil: The big winner of Russian ban - Exports drive positive outlook - Russia exports to grow by 150,000
tonnes - Domestic markets pressured
EU: Margin improvements - Strong demand, high breast meat prices - Low EU supply, less imports - South Africa and Russia restriction to affect trade
China: Recovery on low supply - Fragile recovery on low supply - Fewer avian flu outbreaks - Food safety scandal to affect QSR market
EMEA and rest of South America - Russia and South Africa bullish on trade restrictions - Argentina: Industry affected by downturn - Middle East: Supply expansion in Saudi, and UAE
Rest of Asia: - Japan: Low stock and China import concerns - Thailand: Recovery driven by better Japanese
demand - India: Fragile recovery
Poultry Quarterly Q3 2014
Russian ban won’t derail bullish margin outlook
Global chicken monitor* Q1 2013-Q3 2014
Whole Chicken
Breast meat
Leg Quarters
* Chicken price trend for cuts entering global trade
Rabobank International Food & Agribusiness Research and Advisory Published by the Global Animal Protein Sector Team
Lead authors : Nan-Dirk Mulder Chenjun Pan Will Sawyer
For a full list of authors, see back page
www.rabotransact.com www.rabobank.com/f&a
Rabobank Poultry Quarterly Q3 2014 – September 2014 Page 1 of 12

Global outlook
The global outlook for the poultry industry is bullish for the
remainder of 2014. Strong fundamentals will promote further
margin improvements in almost all regions of the world.
Worldwide supply of chicken is relatively tight, while competing
meat prices (i.e. beef, pork) are increasing due to low supply (see
Figures 1, 2 and 3). This will provide a strong base for margin
improvement, especially as the outlook for grain prices indicates
further declines into 2015, driven by the positive harvest outlook
for grains and oilseeds (see Figure 2). Average broiler and poultry
cut prices will fall in Q4 in line with falling feed prices, but will
remain high enough to keep margins strong. Fewer reports of
avian influenza H7N3 (AI) outbreaks in heavily affected markets,
such as China and Mexico, will provide the poultry industry in
these markets a chance to move to margin recovery.
The big events for 2H are the recently introduced restrictions on
global poultry trade by Russia and South Africa. Russia has
banned all poultry meat, amongst other food products,
imported from the US, EU, Canada, Australia and Norway, while
South Africa has imposed high import levies on imports from EU
membership countries, including the Netherlands, Germany and
the UK, affecting almost 50% of total imports. The consequence
will be a shift of 520,000 tonnes in global poultry trade (annual
base, 5% of global trade volume), from which 340,000 tonnes are
coming from the Russian ban and 180,000 tonnes are due to the
safeguard in South Africa.
The big winners of these restrictions on trade will be Brazil,
together with the local industries of Russia and South Africa,
where margins will rise significantly. Consumption in South
Africa and Russia may decline as prices will increase sharply in
these markets. The only country which could potentially
substitute some of the lost imports is Brazil. Projections indicate
that it would be able to supply an additional 150,000 tonnes to
Russia. Other countries such as Argentina, Chile or Thailand only
have limited ability to expand their exports into Russia. We do
not see other countries expanding their export volumes
significantly into South Africa as most key exporters, such as
Brazil and the US, already have restrictions on imports in South
Africa. Therefore, the consequence will be a loss of around
350,000 tonnes in global trade volume for the next year.
Exporters in the US and EU will compete to find alternative
markets, and this will affect price levels, with prices for legs and
MDM expected to fall. Africa, the Middle East and Asia will be on
the radar for exporters, while some volumes might be moved to
indirect channels for Russia via Belarus and Kazakhstan.
We do not believe this will have significant impact on the local
US and EU poultry industries, as market fundamentals are
relatively strong, especially in the US where the industry is again
heading to record high margin levels. Exports to Russia
represent only 8% of total US exports, while Russia and South
Africa represent 20% of total EU exports (6% and 14%
respectively). Strong fundamentals will keep white meat prices
high, while dark meat prices may come under some pressure,
but not at such a level that will affect margins seriously.
Figure 1: Global whole chicken and chicken cuts markets, USD/100 kg
2013 2014 change
Q1 Q2 Q3 Q4 Q1 Q2 Q3 Q2-Q3
Whole chicken Brazil wholesale 192.3 154.8 146.3 159.8 141.3 142.9 138.5 -3%
EU wholesale 255.3 257.5 264.1 258.3 264.4 267.7 263.0 -2%
Breast meat EU import price Brazil 334.3 309.0 328.3 309.0 322.6 303.9 298.0 -2%
EU import price Thailand 325.4 322.0 352.1 350.8 357.7 348.9 331.0 -4%
Leg quarters
US leg quarters, Northeast 114.2 117.0 113.9 96.1 94.6 95.0 95.0 0%
Japan import price 206.7 196.7 200.4 218.1 191.5 191.8 185.5 -3%
Russia wholesale 346.7 328.8 313.4 318.8 288.9 287.9 305.5 +9%
Feet China import price 141.1 143.5 135.8 135.8 144.9 143.3 142.0 -1%
Processed chicken EU import price Brazil 368.1 380.9 351.7 361.0 356.0 357.5 355.0 -0.5%
Source: Eurostat, FAO, national statistics, UBABEF, USDA, 2014
Rabobank Poultry Quarterly Q3 2014 – September 2014 Page 2 of 12
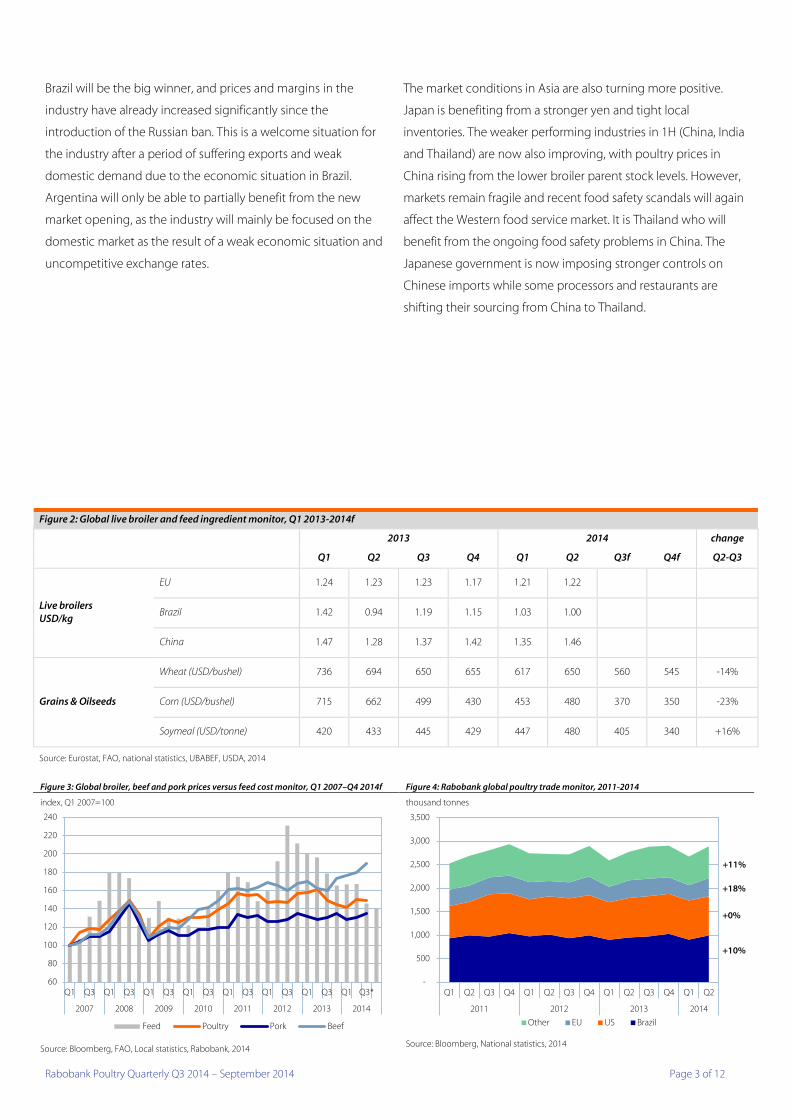
Brazil will be the big winner, and prices and margins in the
industry have already increased significantly since the
introduction of the Russian ban. This is a welcome situation for
the industry after a period of suffering exports and weak
domestic demand due to the economic situation in Brazil.
Argentina will only be able to partially benefit from the new
market opening, as the industry will mainly be focused on the
domestic market as the result of a weak economic situation and
uncompetitive exchange rates.
The market conditions in Asia are also turning more positive.
Japan is benefiting from a stronger yen and tight local
inventories. The weaker performing industries in 1H (China, India
and Thailand) are now also improving, with poultry prices in
China rising from the lower broiler parent stock levels. However,
markets remain fragile and recent food safety scandals will again
affect the Western food service market. It is Thailand who will
benefit from the ongoing food safety problems in China. The
Japanese government is now imposing stronger controls on
Chinese imports while some processors and restaurants are
shifting their sourcing from China to Thailand.
Figure 3: Global broiler, beef and pork prices versus feed cost monitor, Q1 2007–Q4 2014f Figure 4: Rabobank global poultry trade monitor, 2011-2014 index, Q1 2007=100 thousand tonnes
Source: Bloomberg, FAO, Local statistics, Rabobank, 2014
Source: Bloomberg, National statistics, 2014
60
80
100
120
140
160
180
200
220
240
Q1 Q3 Q1 Q3 Q1 Q3 Q1 Q3 Q1 Q3 Q1 Q3 Q1 Q3 Q1 Q3*
2007 2008 2009 2010 2011 2012 2013 2014
Feed Poultry Pork Beef
-
500
1,000
1,500
2,000
2,500
3,000
3,500
Q1 Q2 Q3 Q4 Q1 Q2 Q3 Q4 Q1 Q2 Q3 Q4 Q1 Q2
2011 2012 2013 2014
Other EU US Brazil
+10%
+0%
+18%
+11%
Figure 2: Global live broiler and feed ingredient monitor, Q1 2013-2014f
2013 2014 change
Q1 Q2 Q3 Q4 Q1 Q2 Q3f Q4f Q2-Q3
Live broilers USD/kg
EU 1.24 1.23 1.23 1.17 1.21 1.22
Brazil 1.42 0.94 1.19 1.15 1.03 1.00
China 1.47 1.28 1.37 1.42 1.35 1.46
Grains & Oilseeds
Wheat (USD/bushel) 736 694 650 655 617 650 560 545 -14%
Corn (USD/bushel) 715 662 499 430 453 480 370 350 -23%
Soymeal (USD/tonne) 420 433 445 429 447 480 405 340 +16%
Source: Eurostat, FAO, national statistics, UBABEF, USDA, 2014
Rabobank Poultry Quarterly Q3 2014 – September 2014 Page 3 of 12
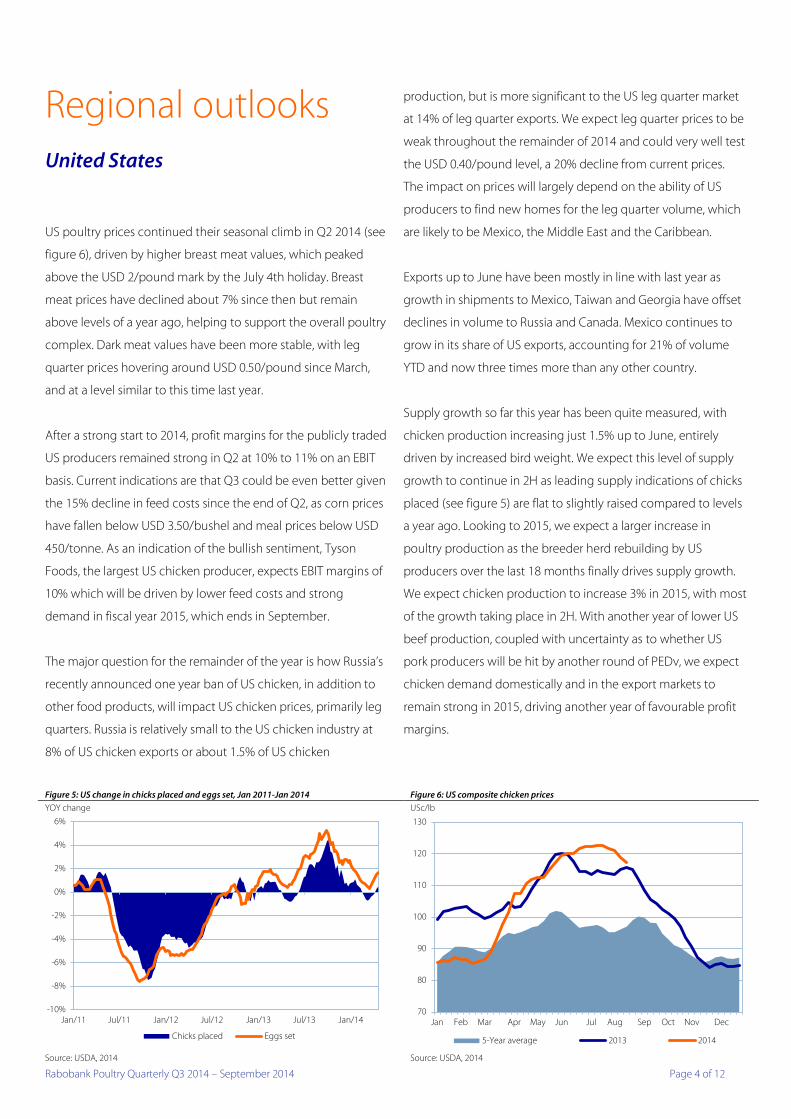
Regional outlooks United States
US poultry prices continued their seasonal climb in Q2 2014 (see
figure 6), driven by higher breast meat values, which peaked
above the USD 2/pound mark by the July 4th holiday. Breast
meat prices have declined about 7% since then but remain
above levels of a year ago, helping to support the overall poultry
complex. Dark meat values have been more stable, with leg
quarter prices hovering around USD 0.50/pound since March,
and at a level similar to this time last year.
After a strong start to 2014, profit margins for the publicly traded
US producers remained strong in Q2 at 10% to 11% on an EBIT
basis. Current indications are that Q3 could be even better given
the 15% decline in feed costs since the end of Q2, as corn prices
have fallen below USD 3.50/bushel and meal prices below USD
450/tonne. As an indication of the bullish sentiment, Tyson
Foods, the largest US chicken producer, expects EBIT margins of
10% which will be driven by lower feed costs and strong
demand in fiscal year 2015, which ends in September.
The major question for the remainder of the year is how Russia’s
recently announced one year ban of US chicken, in addition to
other food products, will impact US chicken prices, primarily leg
quarters. Russia is relatively small to the US chicken industry at
8% of US chicken exports or about 1.5% of US chicken
production, but is more significant to the US leg quarter market
at 14% of leg quarter exports. We expect leg quarter prices to be
weak throughout the remainder of 2014 and could very well test
the USD 0.40/pound level, a 20% decline from current prices.
The impact on prices will largely depend on the ability of US
producers to find new homes for the leg quarter volume, which
are likely to be Mexico, the Middle East and the Caribbean.
Exports up to June have been mostly in line with last year as
growth in shipments to Mexico, Taiwan and Georgia have offset
declines in volume to Russia and Canada. Mexico continues to
grow in its share of US exports, accounting for 21% of volume
YTD and now three times more than any other country.
Supply growth so far this year has been quite measured, with
chicken production increasing just 1.5% up to June, entirely
driven by increased bird weight. We expect this level of supply
growth to continue in 2H as leading supply indications of chicks
placed (see figure 5) are flat to slightly raised compared to levels
a year ago. Looking to 2015, we expect a larger increase in
poultry production as the breeder herd rebuilding by US
producers over the last 18 months finally drives supply growth.
We expect chicken production to increase 3% in 2015, with most
of the growth taking place in 2H. With another year of lower US
beef production, coupled with uncertainty as to whether US
pork producers will be hit by another round of PEDv, we expect
chicken demand domestically and in the export markets to
remain strong in 2015, driving another year of favourable profit
margins.
Figure 5: US change in chicks placed and eggs set, Jan 2011-Jan 2014 Figure 6: US composite chicken prices YOY change USc/lb
Source: USDA, 2014 Source: USDA, 2014
-10%
-8%
-6%
-4%
-2%
0%
2%
4%
6%
Jan/11 Jul/11 Jan/12 Jul/12 Jan/13 Jul/13 Jan/14
Chicks placed Eggs set
70
80
90
100
110
120
130
Jan Feb Mar Apr May Jun Jul Aug Sep Oct Nov Dec
5-Year average 2013 2014
Rabobank Poultry Quarterly Q3 2014 – September 2014 Page 4 of 12

Mexico
Mexican chicken production rebounded in March and April as
producers tried to capture positive margins in the market.
Despite bullish market fundamentals, the industry is still
struggling to deal with ongoing AI, as it continues to disrupt the
domestic poultry supply chain. Over the past few weeks, a
significant number of parent broilers have died or have had to
be culled. As a result, August production deteriorated, and we
expect production to remain sluggish in Q3 and heavily
challenged during Q4. Therefore, we continue to hold our
previous expectation for production growth at 1.3% over levels a
year ago, which will mean a very tight market again this quarter.
As a result, retail prices skyrocketed in August; breast meat prices
increased 20% to a historic record high of USD 8.5/kilogramme.
Chicken leg quarters and chicken paste in the form of nuggets
or burgers are becoming important protein alternatives to
consumers. YTD chicken leg quarter imports have increased
12%, while chicken paste imports have increased 4.6% over
levels a year ago.
We expect chicken prices to remain strong throughout the rest
of the year. However, the Russian import ban, particularly on US
chicken meat, could have a negative impact on Mexican prices,
as imports from the US could increase sharply. Some of the lost
US export volume could find room in Mexico, bringing domestic
prices down sharply in the months to come. Earlier this year, we
expected total Mexican chicken imports from the US to be at
715 thousand tonnes, but this could go up to 750,000 tonnes
after the Russian ban on US chicken (see figure 7).
Brazil
The Brazilian domestic poultry market is currently being affected
by a relatively weak domestic demand due to a squeeze on
consumer spending power (resulting from lower income growth
and persistently high inflation). Prices at the start of Q1 had
therefore been relatively low but started to grow from early July,
up almost 10% as a consequence of increasing prices of
competing proteins, especially beef, and also due to
expectations for continued export growth. Given that grain
prices should continue to decline, the overall outlook for the
Brazilian poultry market in 2H 2014 is generally positive. Brazil´s
total poultry meat exports increased slightly, up 0.6% by volume
in 1H 2014 versus 1H 2013 (see figure 8). Nevertheless, in July,
exports increased 8.3% over the same month of last year. Looking forward, the industry is optimistic about 2H export
volumes, especially due to the Russian ban on EU and US
exports. The industry is expected to be able to increase exports
to Russia an additional 150 thousand tonnes. Other markets
have also been increasing imports from Brazil. For instance,
during 1H 2014, exports of poultry meat to Mexico started to
gain strength. Although this represented only a very small part
of total exports during the period, it is a sign that Brazil is gaining
more space in the international market. Big companies will
adjust their supply to the domestic market in 2H and prioritise
exports. Rabobank expects that this scenario will help poultry
meat prices to rebound in the coming months, possibly
reaching last year’s levels by late Q3 (see figure 8).
Figure 7: Monthly Chicken meat imports in Mexico, 2011-2014 Figure 8: Chilled poultry meat prices in Brazil, 2009-2014
thousand tonnes BRL/kg
Source: GCMA, 2014 Source: Bloomberg, 2014
0
10
20
30
40
50
60
70
80
90
Jan Feb Mar Apr May Jun Jul Aug Sep Oct Nov Dec
Baseline 2014 scenario with Russias ban to US
2.00
2.50
3.00
3.50
4.00
4.50
5.00
1 2 3 4 5 6 7 8 9 10 11 12
Average 09-13 2012 2013 2014
Rabobank Poultry Quarterly Q3 2014 – September 2014 Page 5 of 12

Argentina
Poultry production in Argentina saw a 3% YOY reduction in the
first five months of the year, after having closed 2013 with an
annual growth of less than 1%, considerably lower than the 10%
annual average for the past decade. The recent performance is a
consequence of lower industry margins due to an overvalued
exchange rate, high domestic inflation and government-
controlled retail prices. Domestic consumption contracted by
2% for the same period, as a result of a general economic
slowdown and continued inflation, despite the government’s
attempts to control prices for food such as poultry.
Exports contracted more than production for the same period,
decreasing by 9% in volume and 3% in value (see figure 9). The
main export destination for Argentine poultry is Venezuela
(which accounts for more than half), followed by China and
Chile. Evidence of the complicated situation that the poultry
sector is in is highlighted by the fact that the second largest
poultry company filed for corporate reorganisation under
Chapter 11. Several other smaller players are in a similar
situation. We expect the rest of the year to continue to be
difficult for the sector, with the economy in recession but local
costs still increasing by more than 35% YOY. The only relief
might come with the expected further depreciation of the
Argentine peso. However, the movement so far has not been
enough to offset the domestic problems.
EU
The circumstances for the EU chicken market continue to remain
relatively strong, driven by a combination of high demand for
poultry and limited supply. Average live broiler prices in Q2 have
been around 3% below last year’s levels, but a particularly strong
decline in feed prices in Europe (around 10% below last year’s
level) has helped farmers in the EU gain healthy margins (see
figure 10).
Demand in the EU remains strong, as consumers tend to prefer
the cheaper broiler meat over expensive pork and beef
products. This is driving prices of breast meat to relatively high
levels. International demand for EU poultry meat is also relatively
strong, despite the expected loss of Middle Eastern export sales.
Total export volume over 1H was roughly in line with 1H 2013
level of 700,000 tonnes. The EU has been able to replace export
volumes to the Middle East with exports to Africa (Benin, South
Africa) and Asia (Philippines, Hong Kong). As most of these
markets buy lower value products, the value of EU exports
declined 7%, though this was also partly caused by lower
international prices than last year.
The outlook for the EU market is strong. We believe that the
industry will continue to benefit from a relatively tight market
(see figure 11) and high international prices for poultry and
competitive meats. Supply remains restricted due to limited
availability of hatching eggs, but demand is expected to remain
strong. This will pay out in ongoing high prices for breast meat.
The biggest support for the industry will be a further expected
Figure 9: Argentina monthly exports, 2012-2014 Figure 10: Northwest European broiler, feed price and margin trend 2010-2014
tonnes gross margin, EUR/kg index, Jan 2010=100
Source: Magyp, Ministery of Agriculture, 2014 Source: Eurostat, EMA, PVE, Igreca, Defra, Rabobank, 2014
-
20,000
40,000
60,000
80,000
100,000
120,000
140,000
160,000
180,000
200,000
2010 2011 2012 2013 2014
-
0.10
0.20
0.30
0.40
0.50
0.60
100
105
110
115
120
125
130
135
140
145
150
Jan
Ap
r
Jul
Oct
Jan
Ap
r
Jul
Oct
Jan
Ap
r
Jul
Oct
Jan
Ap
r
Jul
Oct
Jan
Ap
r
2010 2011 2012 2013 2014
Gross margin Broiler index Feed index
Rabobank Poultry Quarterly Q3 2014 – September 2014 Page 6 of 12

decline in feed prices. EU grains and oilseed prices dropped
sharply during the summer months (EU wheat prices dropped
20% since May to EUR 135/tonne, while soybean prices dropped
10% to EUR 380/tonne) and are expected to fall further in 2H.
These price reductions have started to flow through to the
supply chain and will result in ongoing lower feed prices in the
coming months. Margins at the farming level continue to remain
strong, mainly driven by relatively stable live broiler prices and
declining feed costs (see figure 10). Although the months of July
and August have shown some seasonal slowdown due to the
holiday season, demand for poultry remains relatively strong in
the EU and is supporting the relatively high white meat prices in
the EU.
One concern is how the industry will adjust to the new
restrictions on EU exports set by South Africa (special safeguard
levies on Dutch, German and UK exports) and by Russia (ban on
poultry meat imports for one year). These markets represented
around 20% of the EU’s export volume over 1H 2014, especially
for leg quarters and MDM. We expect EU exporters to shift
export streams to Africa and Asia (Philippines and Hong Kong) as
they have already successfully begun to over the last two years.
As export streams adjust, price pressure on these product
categories can be expected, but this will not be significant
enough to alter the bullish outlook for the industry.
Russia
After one year of disappointing performance, the Russian poultry
industry is again operating under very bullish market conditions.
Russian broiler prices increased 20% between March and July
(see figure 12) and the outlook for Q4 is significantly more
bullish since the introduction of the import ban on products
from the US, EU, Canada, Australia and Norway.
The price hike in Q2 was caused largely by the banning of pork
products from the EU after the reporting of ASF cases in Eastern
Europe. The EU pork exports represented 12% of total domestic
supply in Russia before the ban, and alternative exporters have
not been fully able to replace the EU volumes. This has resulted
in a tight Russian meat market, with sharply increasing pork
prices (20%, see figure 13) as consumers shift to cheaper broiler
products. The profitability improved significantly in Q2, despite
an ongoing increase in domestic feed prices (+10% in Q2, see
figure 12). This feed price increase differs from global trends and
is despite an expected good crop harvest in Russia of, for
example, 57 million tonnes of wheat. The main reason for this is
the weak Russian ruble, which pushes grain exporters to export
against competitive prices and leaves domestic supply relatively
more expensive. Vertically integrated protein companies with
their own land banks will benefit under this current market
environment.
The outlook for the Russian poultry industry is very bullish in 2H
after the recently implemented one year ban on poultry
products from the US, EU, Canada, Australia and Norway. These
Figure 11: Quarterly production for the EU and for individual countries, 2010-2014 Figure 12: Russia broiler and feed price index trend, Jan 2011-Jan 2014
Index, Q1 2010 = 100 Index, Jan 2010=100 EUR/kg
Source: Defra EMA, Eurostat, Itavi, PVE, 2014 Source: Rostat, 2014
90
95
100
105
110
115
120
125
130
135
140
Q1 Q2 Q3 Q4 Q1 Q2 Q3 Q4 Q1 Q2 Q3 Q4 Q1 Q2 Q3 Q4 Q1 Q2
2010 2011 2012 2013 2014
EU Germany
84.0
86.0
88.0
90.0
92.0
94.0
96.0
98.0
100.0
102.0
104.0
20%
30%
40%
50%
60%
70%
80%
90%
100%
110%
120%
01.0
1.20
1101
.03.
2011
01.0
5.20
1101
.07.
2011
01.0
9.20
1101
.11.
2011
01.0
1.20
1201
.03.
2012
01.0
5.20
1201
.07.
2012
01.0
9.20
121.
11.2
011
01.0
1.20
1301
.03.
2013
01.0
5.20
1301
.07.
2013
15.0
9.20
1515
.11.
2013
15.0
1.20
1415
.03.
2014
15.0
5.20
1401
.07.
2015
Feed index Broiler
Rabobank Poultry Quarterly Q3 2014 – September 2014 Page 7 of 12

countries (mainly the US and EU) together represented 8% of
Russian domestic supply, and the lost volumes of 350,000
tonnes will only be partially replaced by Brazil (from 50,000
tonnes to 150,000 tonnes).
The Russian industry should also be able to increase production
to full capacity and, together with new capacity currently
entering the market (like Akashevskaya and Donstar), this could
further help to replace the lost export volumes. However, we do
not believe it could fully replace the lost imports from the US
and the EU. The consequence will very likely be a 2% to 3%
reduction in consumption over 2H because of the lack of
availability of chicken. This pressured demand, together with the
already pressured demand in the pork sector, will likely mean a
very bullish market situation in the meat market in 2H. The
additional impact of the ban on the pork and beef markets will
be limited as the EU and US were already banned in the pork
sector and the EU represents only a minor part of imports in the
beef sector, while the US was already banned. The main impact
will come from the ban on Canadian pork (2%) and EU beef (1%).
The level at which prices will increase will depend on the
government’s reply to the market situation, and if they will
implement price ceiling mechanisms in the market, which is
currently being discussed with the industry. The final impact will
also be determined by the level in which trade streams will
move exports to informal routes via Belarus and Kazakhstan.
Upcoming new projects, which are expected to come into the
market in 2H 2014, might further relieve the impact of the ban.
South Africa
The South African poultry industry has also been hit by large
volumes of imports during Q2, but thanks to a reduction in
domestic production (-1.6% compared to Q2 2013), the total
market impact has been lower as this occurred during the large
oversupply periods of 2013. The industry has been anticipating
the long period of pressured margins by reorganisation via plant
closures or by mergers and acquisitions. This has resulted in a
more balanced market situation in South Africa, along with an
improvement in industry efficiency.
This better market balance in South Africa has pushed prices up
from less than SAR 15/kilogramme to SAR 16/kilogramme (see
figure 13). This did not fully pay off by resulting in better margins
as feed prices also increased by 600 SAR/tonne over the same
period, due to a tight domestic corn supply. The outlook for the
South African poultry industry is bullish for 2H on lower than
expected feed prices and less imports. In particular, the
implementation of anti-dumping tariffs on imports from the
Netherlands, the UK and Germany of roughly between 22% and
70% will reduce imports significantly. These three countries have
been responsible for 46% of the imports in South Africa over 1H.
Total imports in South Africa are expected to fall significantly in
2H. Other potential supplying regions, such as Brazil and the US,
have limited room to replace EU exports, as they have already
been affected by anti-dumping measurements. The outcome of
these new anti-dumping regulations will be higher local prices.
South African industry will benefit from better margins, as grain
prices will also drop further.
Figure 12: Russian meat prices, 2011-2014 Figure 13: South Africa broiler and feed price trend, 2010-2014
Index, Jan 2011 = 100 Broiler, SAR/kg Feed, SAR/kg
Source: Rostat, 2014 Source: SAPA, 2014
90%
95%
100%
105%
110%
115%
120%
125%
130%
135%
01.0
1.20
1115
.02.
2011
01.0
4.20
1115
.05.
2011
01.0
7.20
1115
.08.
2011
01.1
0.20
1115
.11.
2011
01.0
1.20
1215
.02.
2012
01.0
4.20
1215
.05.
2012
01.0
7.20
1215
.08.
2012
01.1
0.20
1215
.11.
2012
01.0
1.20
1315
.02.
2013
1.04
.201
315
.05.
2013
01.0
7.20
1301
.09.
2013
15.1
0.20
1301
.12.
2013
15.0
1.20
1401
.03.
2014
15.0
4.20
1401
.06.
2014
15.0
7.20
14
Chicken Beef Pork
2,500
3,000
3,500
4,000
4,500
5,000
5,500
10
11
12
13
14
15
16
17
Jan-
10
Ap
r-10
Jul-1
0
Oct
-10
Jan-
11
Ap
r-11
Jul-1
1
Oct
-11
Jan-
12
Ap
r-12
Jul-1
2
Oct
-12
Jan-
13
Ap
r-13
Jul-1
3
Oct
-13
Jan-
14
Ap
r-14
Broiler feed Frozen chicken
Rabobank Poultry Quarterly Q3 2014 – September 2014 Page 8 of 12

China
Entering Q3 2014, Chinese consumers’ concern over AI is fading,
as limited new cases have been reported. Poultry markets are
showing signs of recovery, with increasing prices in both live
bird (CNY 10/kilogramme in Aug, up 20% YOY) and retail price
(CNY 19/kilogramme, up 20% YOY) (see figure 14). Day old chick
(DOC) prices have shown stronger growth, from CNY 1.7/bird in
March to CNY 5/bird in August, showing the relatively tight
supply of DOC in the market after self-regulated initiatives.
The self-regulated initiatives have been imposed by the alliance
of white-feathered bird companies, which consists of over 50
top poultry companies. One of the initiatives is to substantially
reduce production capacity within the whole industry. As a
consequence of this initiative, imports of pure-bred chickens in
1H decreased sharply by 40% YOY, to 500,000 sets. The alliance
decided in June that a 10% further reduction would be made in
July and August in order to strengthen the effect of the initiative.
These reductions have had a positive impact on market
recovery, driving prices to enter an upward trend since the
beginning of Q3. However, whether the initiative can last longer
term is still questionable. This will require the joint effort of all
the participants within the industry.
Other than self-regulated supply, another important driving
force for poultry prices is the price of pork. The poultry price
movement is always associated with pork price, as poultry is the
major substitute for pork in China. Entering July, pork prices
started to climb due to the large sow liquidation in Q1 and Q2.
Strong pork prices are expected to last through the rest of 2014
and into early 2015, due to the combined factors of peak season
and tight supply. This will give poultry prices strong support in
the coming months.
Although China’s poultry market has been hit by many food
safety issues in recent years, the recent scandal related to
expired meat found in a plant of one QSR supplier seemed to
have a limited impact on the consumers’ perspective of poultry
products in general. However, the scandal did have a very
negative impact on the performance of Western-style QSRs. As
the affected plant also supplied the Japanese market, the
suspension of the operation drove QSRs to turn to other regions
such as Thailand for supply. This had a positive impact on
Thailand’s poultry industry, which has been experiencing
difficulties due to oversupply.
Farming profitability has improved greatly due to rising market
prices. The profit margin was CNY 1.8/bird in the week of August
11, a great improvement compared with CNY 0.03/bird in early
April. However, as feed prices are expected to rise in 2H 2014
due to the continuously rising minimum procurement price for
corn, the farming profitability will have limited room for further
improvement.
In 1H 2014, imported poultry products decreased 30% YOY to
217.5 thousand tonnes (see figure 15). Brazil and the US remain
the major suppliers, altogether accounting for 92% of the total.
In terms of product category, frozen chicken feet decreased
sharply by 47% YOY, while chicken wing imports remained
strong, with a slight increase over the previous year.
Figure 14: Chicken meat price in China, Jan 2011-2014 Figure 15: China monthly chicken feed imports by country
CNY/kg tonnes
Source: CAA,MOA, 2014 Source: CAA, 2014
14
14.5
15
15.5
16
16.5
17
17.5
18
18.5
19
Jan/11 July/11 Jan-12 July-12 Jan-13 July -13 Jan-14 Jul-14
0
5,000
10,000
15,000
20,000
25,000
30,000
35,000
France Chile United States Argentina Brazil
Rabobank Poultry Quarterly Q3 2014 – September 2014 Page 9 of 12

Japan
The Japanese poultry industry still operates under bullish market
conditions Local supply is still relatively tight due the
depreciation of the Japanese yen, which has made imports
relatively expensive (see figure 16). This has particularly affected
raw chicken imports which fell to a new low of 190,000 tonnes in
Q1 2014; the lowest quarterly import level since 2010. The result
of this is very low stock levels in Japan, and in Q2 their trading
houses were forced to import poultry (230,000 tonnes) to restore
some stocks in the country. Trading houses now pay around JPY
230/kilogramme for legs, 10% below Q1 prices but still
significantly more than in Q2 2013 (+10%).
Local producers benefit from the tight local market situation via
higher local prices. This has not stimulated production
expansion as Japanese monthly production is still moving
around the long-term level of 55,000 tonnes.
The outlook for the industry for 2H remains bullish with ongoing
low stock levels in the industry and limited impulses from the
local industry to expand. Local price levels will generally remain
high, further supported by an ongoing weak yen, which will
keep imports relatively expansive. The downside to the weak
yen is high feed prices in Japan.
From a trade perspective, a further shift in sourcing from China
to Thailand can be expected after the recent food safety scandal
in China. This has pushed the government to impose stricter
controls on chicken imports and some companies, such as
McDonald’s, have shifted their sourcing entirely to Thailand.
Thailand
The Thai chicken industry performance is still affected by
oversupply after the return of Saha Farms to the market, while
export volumes were disappointing, especially in Q1, with
almost 10% less exports than last year (see figure 17). Q2 market
conditions were significantly better and a sharp increase in
export volume of 145,000 tonnes has led to a new record 1H
export volume of 275,000 tonnes. Japan has driven this growing
demand for Thai chicken after the opening of the market for
Thai raw chicken earlier this year, and by the problems in China,
such as animal disease outbreaks and food safety issues.
The outlook for the Thai industry is increasingly more bullish,
driven by an improved position in the Japanese market and
higher pork prices in the domestic market. The recent food
safety scandal in China has pushed the Japanese government to
raise controls on imports and food processors, and restaurants
chains are now shifting sourcing from China to Thailand. We
therefore believe that the industry should be able to reach their
570,000 tonne target, even taking into account the relatively
weak EU demand for Thai chicken.
This stronger international demand for Thai products, together
with high prices for competitive proteins such as pork, will
provide the Thai industry with some room for margin recovery.
Some expected relief in feed prices in line with international
expectations will be an additional support for the industry. A key
wildcard will be disciplined supply management by the Thai
industry. Previous bullish market conditions were destroyed by
overambitious supply expansion.
Figure 16: Japan domestic supply 2012-2014 Figure 17: Thai broiler price versus feed monitor, Jan 2011-July 2014
tonnes index, Jan 2010 = 100
Source: Alic, Rabobank 2014 Source: Bloomberg, Rabobank, 2014
0
50,000
100,000
150,000
200,000
250,000
300,000
350,000
400,000
450,000
Q1 Q2 Q3 Q4 Q1 Q2 Q3 Q4 Q1 Q2
2012 2013 2014
Production Imports
60%
70%
80%
90%
100%
110%
120%
130%
140%
150%
160%
Jan
Mar
May Ju
l
Sep
Nov Ja
n
Mar
May Ju
l
Sep
Nov Ja
n
Mar
May Ju
l
Sep
Nov Ja
n
Mar
May Ju
l
2011 2012 2013 2014
Feed price index Broiler index
Rabobank Poultry Quarterly Q3 2014 – September 2014 Page 10 of 12

India
The performance of the Indian poultry industry was difficult in
Q2, with minimal positive margins (see figure 18). The outlook
for Q3 margins is better, despite the traditional low
consumption levels in August and September due to several
religious festivals. Improved prices as a result of better managed
production levels, together with a decline in meal prices have
kept the profitability positive and just marginally below the five-
year average. Demand in Q3 will remain subdued due to further
religious festivals. However, better demand can be expected in
Q4.
In July, the Indian government allowed duty-free imports of
soymeal, which will last until 31 December. However, due to the
lengthy process, it is unlikely that significant volumes will move
despite Indian domestic soymeal prices maintaining a premium
of more than USD 150/tonne over CBOT Soymeal price. The
current crop planting has been 10% lower than last year but
crop production can still surpass last year’s 11 million tonnes
provided the weather stays supportive until the harvest.
Improved crops and a correction in the global soymeal market
could suppress domestic meal prices, creating favourable
conditions for the industry in Q4. Corn prices are also expected
to ease under the influence of a global decline in prices. Lower
feed prices could help industry growth in Q4. However, to
achieve annual growth of 8% while maintaining profitability in
2014 would be a challenge.
In an interesting development, the Indian Ministry of External
Affairs has suggested allowing the duty-free import of American
chicken legs (currently India has 100% duty on frozen cuts) as
one of the considerations in return for the US allowing Indian
basmati rice, pomegranate and table grapes. Although currently
there is no decision on this, such a move could on the one hand
be seen as a benefit to QSR and modern trade, but on the other,
poultry producers and the wider industry will be wary of it.
Figure 18: Indian poultry operating margin, 2013-2014
tonnes
Source: CLFMA, NCDEX, Rabobank, 2014
-30%
-20%
-10%
0%
10%
20%
30%
40%
50%
Q1 Q2 Q3 Q4
2013 2014 Average 5 yr High 5 yr Low
Rabobank Poultry Quarterly Q3 2014 – September 2014 Page 11 of 12
This document is issued by Coöperatieve Centrale Raiffeisen-Boerenleenbank B.A. incorporated in the Netherlands, trading as Rabobank International (“RI”). The information and opinions contained in this document have been compiled or arrived at from sources believed to be reliable, but no representation or warranty, express or implied, is made as to their accuracy, completeness or correctness. This document is for information purposes only and is not, and should not be construed as, an offer or a commitment by RI or any of its affiliates to enter into a transaction, nor is it professional advice. This information is general in nature only and does not take into account an individual’s personal circumstances. All opinions expressed in this document are subject to change without notice. Neither RI, nor other legal entities in the group to which it belongs, accept any liability whatsoever for any loss howsoever arising from any use of this document or its contents or otherwise arising in connection therewith. This document may not be reproduced, distributed or published, in whole or in part, for any purpose, except with the prior written consent of RI. All copyrights, including those within the meaning of the Dutch Copyright Act, are reserved. Dutch law shall apply. By accepting this document you agree to be bound by the foregoing restrictions. © Rabobank International Utrecht Branch, Croeselaan 18, 3521 CB, Utrecht, The Netherlands +31 30 216 0000
Rabobank International
Rabobank Food & Agribusiness Research and Advisory Animal Protein Global Sector Team Analysts
US – Bill Cordingley [email protected]
US – Don Close [email protected]
US – Will Sawyer [email protected]
Argentina – Paula Savanti [email protected]
Brazil - Adolfo Fontes [email protected]
Europe – Nan-Dirk Mulder [email protected]
Europe – Gorjan Nikolik [email protected]
Europe – Albert Vernooij [email protected]
Mexico – Pablo Sherwell [email protected]
North East Asia – Chenjun Pan [email protected]
Singapore – Pawan Kumar [email protected]
New Zealand – Matt Costello [email protected]
www.rabotransact.com Rabobank Poultry Quarterly Q3 2014 – September 2014 Page 12 of 12