Embed Size (px)
Citation preview
SVEA EKONOMI AB 1 (63)
Annual Report, 2014
ANNUAL REPORT 2014
The Board of Directors and CEO of Svea Ekonomi AB, Co. Reg. No. 556489-2924, herewith submit the Annual Report and
Consolidated Accounts for the 2014 financial year.
REPORT OF THE BOARD OF DIRECTORS
Operations
Svea Ekonomi AB conducts financing activities under a permit from the Swedish Financial Supervisory Authority and in accordance
with the provisions of the Banking and Financing Business Act (SFS 2004:297). The Svea Ekonomi AB Group also provides
administrative services.
The Group’s business concept is to provide the market with personal service and efficient custom solutions within the areas of
Administrative and Financial Services (AFS) and Debt Recovery. Under this business concept we offer the following services:
invoice services, business financing, factoring, invoice purchasing, debt recovery, deposits, unsecured loans, VAT recovery, billing,
legal services, credit reports, training, payment transfers and foreign currency exchange.
Financial services are offered by the consolidated situation, which comprises Svea Ekonomi AB, the branches Svea Finans NUF in Norway, Svea Ekonomi AB in Finland, and the wholly owned subsidiaries Svea Finance AS, Svea Finance SIA, Svea Finans A/S, Svea Rahoitus Suomi OY, Svea Finans Nederland BV, Svea Finans AG, Payson AB and Svea Exchange AB. It also includes the subsidiaries Kapitalkredit Sverige AB, Svea Ekonomi Cyprus Limited (formerly Cogilane Holdings Limited), Rhoswen Limited, Daylet Limited and Svea Finance ZRT.
Administrative services are offered by the subsidiary operating companies Svea Kreditinfo AB, Svea Juridiska AB, Mobivox Telecom
AB, Svea Billing Services AB and the Group company Svea Vat Adviser AB. Also included are the associated companies eLombard
Oyj, Credex AB and Trade in Sports Europe AB.
Debt recovery operations are conducted by the sub-group Svea Inkasso AB with the subsidiaries Svea Finans AS, Svea Inkasso A/S
and Svea Finans GmbH, and by Svea Perintä Oy with the subsidiaries Svea Inkasso OÜ and Svea Inkasso SIA. In addition, debt
recovery operations are carried out in Eastern Europe by the associated company Creditexpress NV.
The Group conducts business operations in the Nordic region and in other parts of Europe, and is one of the biggest within financing,
administration and debt recovery. The Parent Company constitutes a substantial part of the Group, which can be seen in the five-year
summaries on pages 8 and 9.
Events during the financial year
The year was characterized by expansion and an increase in loans and deposits. The year was characterized by expansion and an
increase in loans and deposits. This positive trend is expected to continue. While credit losses grew in respect of loans to private
individuals, losses in respect of lending to companies fell. Total credit losses fell compared to the previous year.
Financial operations developed according to plan, with the exceptions of Denmark, the Netherlands and Switzerland, which performed
less well than planned. Investments in past-due receivables portfolios in eastern and central Europe developed according to plan, with
the exceptions of the Ukraine and Russia, which performed less well than planned, mainly due to foreign exchange effects.
Debt recovery operations developed according to plan, with the exceptions of Finland and Denmark, which performed less well than
planned. Eastern Europe operations performed better than planned.
During the first quarter, the Parent Company issued a further convertible loan in the amount of SEK 50 million, which was taken up by
the new company Svea Intressenter 2 AB. During the second quarter, the earlier convertible loan was converted to equity, shares
were withdrawn and a subordinated loan was raised in the amount of SEK 75 million.
During the first quarter, all loan receivables, which amounted to an approximate nominal SEK 285 million, together with the currency
exchange operation and Giroservice, were acquired from Exchange Finans Europe AB. Foreign currency exchange and Giroservice is
run by the subsidiary Svea Exchange AB, to which the necessary capital was extended during the period.
Investments were also made for the acquisition of past-due receivables portfolios in Croatia, Bulgaria, Hungary and Slovenia, and in
the acquisition of receivables in Slovakia. Following further capital contributions, the holding in eLombard Oyj has been written down to
zero.
During the year, the subsidiary Seblinco Finans Holding AB was sold and the dormant subsidiary DialIT Communications BV was
liquidated. The companies did not conduct any business in 2014.
The extraordinary shareholders meeting of 29 October 2014 resolved to pay a dividend to shareholders of SEK 15 million in
accordance with a separate statement from the Board.
SVEA EKONOMI AB 2 (63)
Annual Report, 2014
Operating revenues and operating profit
Operating revenues amounted to SEK 1498.2 million (1208.9) for the Group, and SEK 1319.2 million (949.6) for the Parent
Company. Operating profit amounted to SEK 325.9 million (195.4) for the Group, and SEK 519.6 million (267.1) for the Parent
Company.
Lending
As of 31 December 2014, external lending to the public amounted to SEK 5150.4 million (4289.1) for the Group, and SEK
4260.6 million (3504.2) for the Parent Company.
Financing
Group lending to the public is financed through deposits from the public, our own operations, other credit institutions, convertible
loans and subordinated debt. As of 31 December 2014, deposits from the public amounted to SEK 7544.8 million (5561.7) for
the Group, and SEK 7411.7 million (5461.5) for the Parent Company. As of 31 December 2014, liabilities to credit institutions
amounted to SEK 29.1 million (37.7) for the Group. The Parent Company has no liabilities to credit institutions. Convertible
loans amounted to a nominal SEK 50 million (50.0), and debenture loans to SEK 75.0 million (0.0).
Liquidity
As of 31 December 2014, cash and bank balances plus approved but unutilized credit, amounted to SEK 1,970.7 million
(1,125.2) for the Group, and SEK 1,581.7 million (839.3) for the Parent Company. As of 31 December 2014, liquidity including
investments in listed bonds and other securities amounted to SEK 3011.6 million (1715.2) for the Group, and SEK 2622.6 million
(1429.3) for the Parent Company.
Investments
Investments in tangible and intangible assets for the year amounted to SEK 92.4 million (61.0) for the Group, and SEK 200.2
million (155.0) for the Parent Company.
Personnel
The average number of permanent employees in the Group amounted to 839 (656), of whom 504 were women (395), and in the
Parent Company 432 (411), of whom 239 were women (235). As 31 December 2014, the number of employees in the Group
amounted to 896 (667), and in the Parent Company 440 (423).
The planning and decision-making process regarding remunerations and benefits for key individuals in executive positions
including the Board is described in Note 10.
Capital adequacy
The new European CRR/CRDIV (Basel III) regulations came into force as of 1 January 2014, and entail more stringent
requirements for the highest quality components of the capital base – core primary capital and primary capital. In addition to the
minimum capital requirement, a capital conservation buffer of 2.5 per cent was introduced as of 01 August 2014. A contra-cyclic
buffer of 1.0 per cent will also be introduced and come into force on 13 September 2015.
As of 31 December 2014, the minimum capital requirement for the core primary capital ratio amounted to 7.0 per cent, the
primary capital ratio to 8.5 per cent and the total capital ratio to 10.5 per cent.
The Board decided to implement a buffer of a further 0.5 per cent as of 01 August 2014, which means the capital requirement
for the core primary capital ratio amounts to 7.5 per cent, the primary capital ratio to 9.0 per cent and the total capital ratio to
11.0 per cent.
Capital requirement is calculated in compliance with statutory minimum requirements for capital for credit risk, market risk, operational risk and credit value adjustment risk. Comparative figures for capital ratios up until 2013 were based on earlier regulations.
The core primary capital ratio in the Parent Company amounted to 11.65 per cent (13.12) as of 31 December 2014, the primary capital ratio to 11.65 per cent (13.12) and the total capital ratio to 11.77 per cent (14.34).
In the consolidated situation, the core primary capital amounted to 10.87 per cent (10.56) as of 31 December 2014, the primary
capital ratio to 10.94 per cent (10.56) and the total capital ratio to 11.87 per cent (11.61).
For further information on risk management and capital management, refer to pages 4–7 and Note 37.
Events after closing day
The period January to April 2015 developed according to plan. Volumes increased in both financial services and administrative services.
The extraordinary shareholders meeting of 05 March 2015 resolved to pay a dividend to shareholders of SEK 25 million in
accordance with a separate statement from the Board.
No other significant events have occurred since year end.

SVEA EKONOMI AB 3 (63)
Annual Report, 2014
Economic outlook
Group operating income for 2015 is estimated to total around SEK 1,700 million with positive earnings and cash flow. The
group’s lending to the general public and its credit losses are anticipated to increase during 2015. The rate of deposits from
the public in 2015 is expected to be on a par with year-end 2014.
Proposed allocation of profits
The Board of Directors and the CEO propose that unappropriated earnings be placed at the disposal of the Annual General Meeting:
Profit brought forward from the previous year 828,693,228
Dividends to shareholders -15,000,000
Fair value reserve 3,057,457
Exchange rate differences 4,381,112
Equity portion of convertible loan 3,468,927
Bond conversion 49,578,770
Withdrawal of shares -87,026,118
Profit for the year 212,230,156
Total 999,383,532
To be distributed as follows:
To be paid to shareholders (800 000 shares x SEK 31.25 per share) as resolved by the extraordinary shareholders’ meeting of 5 March 2015
25,000,000
To be paid to shareholders (800,000 shares x SEK 31.25 per share) 25,000,000
To be carried forward 949,383,532
Total 999,383,532
Proposed motion regarding dividends
The Board of Directors proposes that SEK 25,000,000.00 be distributed, equivalent to SEK 31.25 per share.
The Board proposes that the Annual General Meeting of 08 May 2015 authorize the Board to decide on a distribution date.
Current regulations for capital adequacy and major exposures stipulate that the company must, at all times,
have a capital base corresponding to at least the total capital requirements for credit risks, market risks and
operational risks, as well as for additional identified risks in the operations in accordance with the company’s
internal capital adequacy assessment process (ICAAP). After the proposed appropriation of profits, the
company’s capital base amounts to SEK 855 million and the calculated minimum capital requirement to SEK
581 million. A specification of these items is presented in Note 37.
The Board of Directors and the CEO consider the proposed dividend to be justifiable with
regard to the requirements that the nature, scope and risks of the operations impose on the
size of shareholders’ equity and the company’s solvency requirements, liquidity and position
in general.
This statement should be viewed in light of the information presented in the Annual Report.
With regard to the Group’s and the Parent Company’s position and performance in general, refer to the
income statements and balance sheets presented below, with their associated supplementary
disclosures and notes to the financial statements.
SVEA EKONOMI AB 4 (63)
Annual Report, 2014
Risk management and capital management
Risk exposure is an integral part of all financial operations and means that Svea Ekonomi is exposed to credit,
liquidity, market and operational risks. Therefore, the business requires a well-defined organization and clear
division of responsibilities, as well as efficient processes for each area of risk.
Risk management organization
Svea Ekonomi uses a control model in which the responsibility for risk management is divided between the Board and three lines
of defence: the line organization (1st line of defence); risk control and compliance (2nd line of defence) and internal auditing (3rd
line of defence).
Board of Directors
Svea Ekonomi AB’s Board of Directors bears ultimate responsibility for limiting and following up the company’s and the
Group’s risks and also establishing the Group’s capital adequacy target. At Svea Ekonomi, risks are measured and
reported according to standardized principles and policies determined annually by the Board. The Board decides on
guidelines for credit, liquidity, market, transaction and operational risks, and the internal capital adequacy assessment
process (ICAAP), which is revised at least once annually. The Board monitors risk trends on a continuous basis and sets
and supervises limits of risk appetite that may not be exceeded.
Svea Ekonomi has established an efficient framework for risk appetites that includes all of the company’s relevant risks.
Ambition, approach and qualitative standpoints are established for each individual risk. Qualitative risk appetites are
combined with quantitative risk appetite metrics and tolerance levels. The Board continually evaluates the operation’s
compliance with established risk appetites through follow-up and reports by the independent risk control function. The
framework and relevance of risk appetite levels are evaluated on a continuous basis, for revision or update by the Board
as necessary.
Line organization
The risk originates in the line organization, which has thus formal responsibility for risks and risk management processes.
Guidelines and instructions form the basis of sound risk management, i.e. continuously identifying, measuring, controlling and
following up the operation’s risks.
Risk-control function
The Risk Controller is an independent control function responsible for ongoing controls that ensure risk exposure is kept
within established limits and that the line organization controls operations in the intended manner. This also involves
reporting relevant risk information to management and the Board. The function is also responsible for coordinating and
advising on the company’s internal risk-control issues and providing personnel with supplementary training. The function,
which is led by the Risk Control Officer, comprises a network of risk controllers in the major foreign subsidiaries and
branches.
Compliance
Compliance refers to abidance of external regulations. Svea Ekonomi has an independent compliance function led by
a Group Compliance Officer through a network of local compliance managers in the major foreign subsidiaries and
branches. The organization’s principal task is to assure the quality of the operation and prevent any problems by
ensuring that changes in legislation and regulations are implemented and complied with by the operation.
Internal audit
The internal audit is an independent auditing function procured externally. It examines and evaluates risk-control and
governance processes in the Group. It is independent of business operations and reports directly to the Board of Svea
Ekonomi AB. The audit plan and priorities for the focus of the work are established by the Board. Reports prepared by the
function are submitted to the Board and the unit an audit concerns. The function audits day-to-day operations in the line
organization and the work performed by the 2nd line of defence while also acting as an advisor to business operations.
Credit risks
Credit risk is defined as the risk of loss due to a counterparty’s failure to fulfil its contractual obligations and that any
collateral provided will not cover the amount due to Svea Ekonomi. The risk arises primarily through various types of lending
to the public (companies and private individuals) and through the issuance of guarantees.
Credit is granted based on the counterparty’s financial position and ability to pay, and that there is good reason to expect the
counterparty will meet its obligations.
Credit policy and organization
Svea Ekonomi’s credit policy describes such things as the approach, organization, responsibility and process required for
a credit decision. In this case the Group is divided into credit units where each unit’s management is responsible for
ensuring that credit processing complies with applicable credit risk regulations. This policy and its associated instructions
are based on the assessment that credit decisions require local expertise, and are thus best dealt with in a decentralized
organization. Credit unit operations differ in many respects regarding both their nature and their respective legal
environments. Accordingly, a credit unit’s management may decide on specific application instructions under the proviso
that requirements are met.
Credit process
The credit process is initiated when a business manager or customer-account manager in a credit unit submits a proposal
for a credit decision. After the case has been investigated, the credit rating is determined, following which action may be
taken in accordance with the credit decision. Counterparty exposure is continuously monitored by the credit manager in
the credit unit concerned and also by the Board in cases of major exposure. The responsibility for credit risk lies with the
customer unit concerned. The unit continuously assesses the customer’s ability to fulfil his commitments; it identifies
deviations from agreed terms and any weaknesses in the customer’s financial position. Based on reports of past-due
payments and other available information, the unit responsible for the customer account also determines whether the
receivable is doubtful, or if anything indicates that the customer’s ability to repay is jeopardized. If it is unlikely that the
customer will be able to repay the entire liability (the principal, interest and fees), and if the situation cannot be resolved in
SVEA EKONOMI AB 5 (63)
Annual Report, 2014
a reasonable manner, the receivable is considered doubtful. If a customer exposure is deemed weak, the exposure is
placed under special monitoring and an action plan is prepared to minimize the potential credit loss.
Individual and collective impairment assessment
The company continuously examines the quality of its credit portfolio to identify any need for impairments. Weak and doubtful
exposures are monitored and continuously reviewed with respect to current and future ability to make repayments. A receivable
is reported as doubtful and a provision is posted if objective evidence exists in the form of loss events or observable data
showing that the customer’s future cash flow has been affected to such an extent that full repayment, including collateral, is no
longer probable. The amount of the provision corresponds to the anticipated loss, based on the discounted value of future cash
flow and the value of the pledged property.
In addition to individual impairment assessment of receivables, a collective impairment assessment is conducted for groups of
receivables that were not necessarily assessed as doubtful on an individual basis. An impairment charge for a group of loan
receivables is a temporary measure pending the identification of an impairment for an individual customer. For lending to
companies, individual impairment testing is applied primarily since it is believed to result in the identification of necessary
reserves. In addition, an assessment is conducted to determine whether any collective impairment requirement exists. Group
impairment testing is applied to lending to private individuals when there are no individual significant items.
Lending and credit risk
Financial assets that can expose the Group to credit risks consist of lending to credit institutions, lending to the public, accounts
receivable and derivative contracts.
In general, significant concentrations of credit risks are considered not to exist as lending is spread across
different counterparties, business sectors and geographical regions.
The Group’s lending to credit institutions consists primarily of bank balances with established banks and credit institutions
where the risk of loss is deemed extremely small.
The Group’s lending to private individuals consists primarily of unsecured loans. These loans are attributable to a large
number of parties liable for payment with relatively low average loan amounts. Because credit is granted after rigorous
credit scoring of each individual customer, the risk of losses is deemed minimized. Portions of unsecured loans have co-
borrowers and may also be covered by voluntary payment insurance, which provides cover against inability to pay due to
involuntary unemployment, illness, accident or death.
As a part of its operations, the Group acquires stocks of past-due receivables and works with their collection. All
rights and risks associated with the receivables are thereby assumed. The stocks of receivables are acquired at
prices considerably lower than their nominal value. To minimize risk in these operations, the Group exercises
caution when making acquisition decisions. Emphasis lies on small stocks of receivables of relatively low average
amounts, which contributes to risk spreading. The acquisitions were made in the Nordic region and eastern Europe.
Alongside exchange rate risks in local currencies there are heightened risks chiefly in exposure in Ukraine and
Russia.
As collateral for its lending to companies, the Group uses accounts receivable, cash flows, property mortgage deeds,
company mortgages, leasing objects and guarantees which, following individual assessment, essentially cover total
lending on the closing date.
The Group’s accounts receivable are attributable to customers and parties liable for payment, who are active in various
industries and who are not concentrated to any particular geographic region. The risk of loss is deemed small.
The credit risk arising from the Parent Company’s currency swaps/forward contracts depends on the counterparty; as the
latter is a major bank, the risk of loss is extremely small.
Disclosures regarding amounts that best correspond to the maximum credit exposure of financial instruments are
presented in Note 48, which describes the Parent Company’s gross and net credit risk exposure with regard to the
collateral available for the Parent Company’s loan receivables.
Age analyses of doubtful receivables and unsettled but non-doubtful receivables are presented in Note 16.
Note 49 provides disclosures regarding the credit quality of the Group’s and Parent Company’s loan
receivables.
Liquidity risks
Liquidity risk is defined as the risk of extra expenses for ensuring that the Group’s payment obligations can be fulfilled on
the due date. The risk of Svea Ekonomi being unable to meet its payment commitments is deemed low.
Liquidity strategy
Svea Ekonomi manages its liquidity to provide satisfactory preparedness for current and non-current payments,
and has a contingency plan to manage disruptions that affect liquidity.
Available liquidity
Liquidity risks are managed according to a Board decision stipulating that at any time an adequate proportion of deposits from the public must be in the form of available liquidity via a liquidity reserve and other so-called liquidity-creating measures.
The liquidity reserve consists of high-quality assets that can be converted to cash the following banking day and which
consist of cash and cash equivalents, government securities, bank balances, secured bonds and corporate bonds with
high ratings (at least AA-) and bonds with valuation haircuts.
Other liquidity-creating measures consist of other assets and sources of liquidity comprising listed shares and
participations and unutilized credit facilities.
Otherwise, liquidity-creating measures can be taken by reducing lending and/or the sale of financial assets.

SVEA EKONOMI AB 6 (63)
Annual Report, 2014
Financing strategy
Svea Ekonomi finances for the long term at as low a cost as possible and with the maximum possible spread of risk.
Such financing consists of deposits from private individuals and companies, borrowing from credit institutions and issued
securities and subordinated loans.
Financing consists chiefly of non fixed-term deposits in SEK covered by the state deposit guarantee from a very large
number of private individuals. Despite its being current by definition, this financing is in the opinion of the company non-
current in character. This assessment is in line with Basel Committee thinking for the calculation of so-called Stable
Funding.
Svea Ekonomi’s long-term liquidity risk was otherwise minimized by the Parent Company’s issuance of a new convertible loan
in the amount of SEK 50 million in 2014. The Parent Company also raised a debenture loan for a total of SEK 75.0 million.
Otherwise, the Group has loan facilities with credit institutions in Switzerland of CHF 1.4 million and in the Netherlands of EUR
6 million.
Risk tolerance and risk appetite
Risk tolerance refers to the maximum risk level that Svea Ekonomi will accept based on the assessed existing liquidity risk with
regard to the business and its focus. Risk appetite is the level that Svea Ekonomi chooses to apply in practice.
Svea Ekonomi has a low tolerance as regards liquidity risk, which means that an adequate portion of deposits must be in the
form of available liquidity at any time. Said portion must be sufficient for business to be conducted on a long-term basis and
under various degrees of stress, without any need to change the business model. Risk appetite is at a lower level than risk
tolerance, as in relation to deposits, available liquidity exceeds the minimum requirement decided on by the Board.
Measuring and reporting liquidity risk
Liquidity risk is measured and monitored continuously by means of key ratios and stress tests. The stress tests cover various
major withdrawal scenarios by savings customers over 30 days, from realistic to less probable, the effect they have on
available liquidity and the number of days it takes before liquidity is spent. Liquidity risk is reported to the Board every month.
Publication of information
Information for publication comprises detailed information about the size of the liquidity reserve and its composition, the size and
distribution of financing sources and key ratios; refer to the table below for the consolidated situation and also www.sveaekonomi.se.
Liquidity for the consolidated situation 31/12/2014 31/12/2013
Liquidity reserve 2,486,245 1,254,292 Other liquidity-creating measures 872,625 699,547
Available liquidity 3,358,870 1,953,839
Lending 7,088,669 5,397,305
Borrowing 104,052 87,172 Deposits 7,665,543 5,630,055
Borrowing and deposits 7,769,595 5,717,227
Balance sheet total 9,194,728 6,856,804
Key ratios
Liquidity reserve/deposits 32.43% 22.28% Liquidity reserve/balance sheet total 27.04% 18.29% Available liquidity/deposits 43.82% 34.70% Available liquidity/balance sheet total 36.53% 28.49% Lending/deposits 92.47% 95.87% Borrowing and deposits/balance sheet total 84.50% 83.38%
Information on contractually remaining maturities for financial assets and liabilities is shown in Note 45, Liquidity
Exposure.
New standards in BASEL III (CRR) from 2015
As of 2015, a short-term liquidity metric – Liquidity Coverage Ratio (LCR) – will be introduced as part of BASEL III
standards, which describe how large a liquidity reserve the company will need to cover a net cash outflow for 30 days in a
stress scenario.
LCR must be reported monthly and the company will fulfil the upcoming requirement with room to spare.
As of 2018, another new metric will be introduced – Net Stable Funding Ratio (NSFR) – with the objective of measuring the
amount of the company’s non-current stable sources of finance in relation to its liquidity profile for assets financed, and for the
realization of off-balance-sheet commitments and liabilities.
NSFR will be reported as of 2015 while the standards are expected to be introduced in 2018. As of 2015, Leverage Ratio must
also be reported, for which a mandatory metric may be introduced from 2018.
SVEA EKONOMI AB 7 (63)
Annual Report, 2014
Market risks
Market risk is defined as the risk of losses due to changes in interest rates, exchange rates and share prices. Svea Ekonomi has
limited market risks; see below for further information.
Interest-rate risks
Because lending and borrowing essentially take place at variable interest rates, interest rate risk is insignificant. Accordingly, no
capital adequacy requirement is deemed necessary.
Disclosures regarding fixed-interest periods for financial assets and liabilities are presented in Note 46 Interest exposure.
Sensitivity analyses are presented in Note 47.
Currency risks
Currency risk is the risk that changes in exchange rates will negatively impact the Group’s income statement, balance sheet
and/or cash flows. Currency risk can be divided into transaction exposure and translation exposure. Transaction exposure
comprises the net of operational and financial currency inflows and outflows. Translation exposure consists primarily of foreign
subsidiary equities in foreign currency.
Disclosures regarding assets and liabilities specified by underlying currency and the foreign exchange rates applied are
presented in Note 41. Sensitivity analyses are presented in Note 47.
Transaction exposure
Because operations are local, every subsidiary has most of its income and expenses denominated in the local currency, thus
currency fluctuations only have a limited effect on the company’s operating profit or loss in local currency. Foreign operations
seldom have receivables or liabilities in other currencies, and this limits transaction exposure. Because the Parent Company has
receivables in foreign currency, major currency exposures in NOK, EUR, DKK and USD have been hedged through currency
swaps/forward contracts to minimize risk; refer to Note 41. We were unable to hedge the Group’s exchange rate exposure in
Russia and the Ukraine.
Translation exposure
Svea Ekonomi does business in many countries. Changes in exchange rates affect the value of net assets in foreign currencies. When the balance sheets of foreign subsidiaries are translated to SEK, balance-sheet exposure arises as a result of said balance sheets’ being expressed in other currencies. The subsidiaries’ performance and financial position are reported in the currencies of the countries concerned and then translated to SEK prior to inclusion in the consolidated accounts. Consequently, fluctuations in the exchange rates between local currencies and SEK will affect the consolidated income statement and balance sheet. The effect of this exposure is minimized through the limited need for equity and by financing in local currency; refer to the Equity report. Foreign net assets are not hedged.
Share price risks – asset management
The aim of asset management is to secure a satisfactory return, while keeping the company’s payment capacity intact. Available
funds must be allocated to interest-bearing bank accounts, commercial paper, funds or listed shares and participations
according to the company’s investment policy.
The company’s investments in listed shares and participations do not comprise a trading inventory. Investments are distributed
over a number of well-known listed companies in various industries and are thereby deemed to provide a good spread of risks.
While there are price fluctuation risks, they are not deemed to result in any requirements from a capital-adequacy perspective.
Disclosures regarding investments in shares and participations specified by geographical market and industry are presented in
Note 47. Sensitivity analyses are provided in the same note.
Commercial risks
Commercial risk is defined as the risk that the company’s revenues fall and are unable to cover operational expenses.
Commercial risk also includes strategic risk and reputational risk.
Strategic risk
Strategic risks are risks that can affect the company’s earnings in the long term due to erroneous or deficient business
decisions. Strategic risks are handled by Svea Ekonomi’s Board and management through e.g. regular board and management
meetings where strategic issues are taken up. The company has also established a continuity plan for the effective
management of strategic risks.
Reputational risk
Reputational risk refers to the risk that the company’s name and brand is impacted negatively, with negative effects on operations and earnings. Reputational risk is managed through such processes as the company’s procedures for approving major changes in the organization or operation.
Operational risks
Operational risk is defined as the risk that a direct or indirect loss or damaged reputation will result from shortcomings or errors
attributable to internal processes, individuals, systems or external events.
The company works continuously on developing and optimizing its internal processes to reduce the risk of operational incidents.
This work includes methods for personnel training and identifying and reporting operational risks. Information security and crime
prevention are important aspects in the management of operational risks.
The Group continuously evaluates its operations and takes the necessary actions in the event of incidents or quality
shortcomings. Process development focuses on the analysis of events linked to potential operational risks and other warning
signs.
Credit value adjustment risk (CVA risk)
The company’s receivables in foreign currency, primarily NOK, EUR, DKK and USD have been hedged through currency
swaps/forward contracts. Contracts have been signed with two major banks, and the company uses a credit value adjustment
calculation to calculate counterparty risk.
SVEA EKONOMI AB 8 (63)
Annual Report, 2014
Five-year summary, Group (SEK thousand)
Income statements 2014 2013 2012 2011 2010
Net interest income
1)
578,141
434,469
392,847
383,244
271,533
Net commissions 818,630 708,767 635,144 535,832 515,633
Other operating income 101,381 65,622 40,205 14,976 16,449
Operating income 1,498,152 1,208,858 1,068,196 934,052 803,615
Operating expenses 2) -1,049,606 -864,449 -762,081 -664,378 -615,853
Profit before credit losses 448,546 344,409 306,115 269,674 187,762
Credit losses, net -121,181 -148,978 -94,304 -77,719 -79,606
Impairment charges, financial assets -1,460 0 -4,977 0 0
Operating profit 325,905 195,431 206,834 191,955 108,156
Balance sheets Lending to credit institutions
3)
1,880,907
1,048,866
1,263,562
1,113,717
1,275,422
Lending to the public 5,150,410 4,289,118 3,387,319 2,922,912 2,127,775
Other assets 2,114,276 1,529,825 1,376,751 1,139,281 1,222,649
Assets 9,145,593 6,867,809 6,027,632 5,175,910 4,625,846
Liabilities to credit institutions 29,052 37,730 43,241 31,485 10,501
Deposits from the public 7,544,755 5,561,667 4,827,313 4,242,761 3,809,119
Other liabilities 466,794 346,943 342,340 258,351 261,835
Shareholders’ equity 1,104,992 921,469 814,738 643,313 544,391
Liabilities and shareholders’ equity 9,145,593 6,867,809 6,027,632 5,175,910 4,625,846
Key ratios Return on total capital, %
4)
4.1
3.0
3.7
3.9
2.5
Return on shareholders’ equity, % 5) 32.2 22.5 28.4 32.3 22.3
Quick ratio, % 82.7 81.6 88.2 86.3 86.7
Debt/equity ratio 6) 6.9 6.4 6.7 7.3 8.0
Equity/assets ratio, % 7) 12.1 13.4 13.5 12.4 11.8
Revenues/expenses excl. credit losses 1.4 1.4 1.4 1.4 1.3
Revenues/expenses incl. credit losses 1.3 1.2 1.2 1.3 1.2
Credit loss ratio, % 8) 2.6 3.9 3.0 3.1 4.1
Cash flow from operating activities, SEK thousands 9) 639,287 539,625 424,474 399,707 244,445
Average number permanent employees 839 656 620 543 475
1) Net interest income before depreciation according to plan for leasing items, until year end 2010.
2) Operating expenses for 2010 adjusted for recognition of negative goodwill.
3) Including cash and bank balances with central banks.
4) Operating profit as a percentage of average total capital.
5) Operating profit as a percentage of average shareholders’ equity.
6) Average liabilities divided by average shareholders’ equity.
7) Shareholders’ equity as a percentage of total assets at year end.
8) Credit losses as a percentage of average lending to the public.
9) Cash flow from operating activities before changes in operating assets and liabilities.
10) Financial leasing agreements are reported as lending to the public as of January 1, 2011.
SVEA EKONOMI AB 9 (63)
Annual Report, 2014
Five-year summary, Group (SEK thousands)
Income statements 2014 2013 2012 2011 2010
Net interest income
1)
539,515
382,276
297,982
269,499
205,510
Dividends received 259,673 140,033 152,796 158,767 140,958
Net commissions 231,439 192,901 154,959 115,213 104,178
Other operating income 288,559 234,382 194,928 159,735 139,709
Operating income 1,319,186 949,592 800,665 703,214 590,355
Operating expenses -633,512 -544,561 -456,236 -385,611 -330,469
Profit before credit losses 685,674 405,031 344,429 317,603 259,886
Credit losses, net -103,073 -104,750 -74,184 -62,492 -73,381
Impairment charges, financial assets -62,975 -33,150 -61,269 -31,240 -11,000
Operating profit 519,626 267,131 208,976 223,871 175,505
Appropriations -274,629 -110,951 -83,024 -103,356 -79,606
Profit before tax 244,997 156,180 125,952 120,515 95,899
Tax on profit for the year -32,767 -26,242 -13,669 -9,357 -3,779
Profit for the year 212,230 129,938 112,283 111,158 92,120
Balance sheets Lending to credit institutions
1,531,742
789,329
1,001,533
914,666
1,107,170
Lending to the public 4,952,040 4,107,382 3,213,851 2,892,565 2,126,892
Other assets 2,328,123 1,658,717 1,423,806 1,222,475 1,262,918
Assets 8,811,905 6,555,428 5,639,190 5,029,706 4,496,980
Liabilities to credit institutions 0 0 1,458 0 0
Deposits from the public 7,411,716 5,461,464 4,639,700 4,234,225 3,753,577
Other liabilities 352,784 235,670 223,165 161,281 178,197
Untaxed reserves 38,000 0 0 0 0
Shareholders’ equity 1,009,405 858,294 774,867 634,200 565,206
Liabilities and shareholders’ equity 8,811,905 6,555,428 5,639,190 5,029,706 4,496,980
Key ratios Return on total capital, %
2)
6.8
4.4
3.9
4.7
4.1
Return on shareholders’ equity, % 3) 54.8 32.7 29.7 37.3 34.1
Quick ratio, % 77.4 76.4 82.6 81.5 81.0
Debt/equity ratio 4) 7.1 6.5 6.6 6.9 7.2
Equity/assets ratio, % 5) 11.8 13.1 13.7 12.6 12.6
Revenues/expenses excl. credit losses 2.1 1.7 1.8 1.8 1.8
Revenues/expenses incl. credit losses 1.8 1.5 1.5 1.6 1.5
Credit loss ratio, % 6) 2.3 2.9 2.4 2.5 3.8
Capital base 855,323 836,185 768,082 610,298 588,564
Total capital ratio, % 11.8 - - - -
Capital adequacy ratio - 1.8 2.1 1.9 2.2
Cash flow from operating activities, SEK thousands 7) 527,357 398,668 339,175 194,294 170,578
Number of employees on closing day 282 251 224 192 158
1) Net interest income before depreciation according to plan for leasing items.
2) Operating profit as a percentage of average total capital.
3) Operating profit as a percentage of average shareholders’ equity.
4) Average liabilities divided by average shareholders’ equity. Untaxed reserves were allocated to liabilities and shareholders’ equity, respectively.
5) Shareholders’ equity + equity portion of untaxed reserves as a percentage of total assets at year end.
6) Credit losses as a percentage of average lending to the public.
7) Cash flow from operating activities before changes in operating assets and liabilities.

SVEA EKONOMI AB 10 (63)
Annual Report, 2014
Group Parent Company
Income statement (SEK thousands) Note 2014 2013 2014 2013
Interest income
3
728,825
568,852
593,423
457,019
Leasing income 3 0 0 87,666 52,269 Interest expenses 3 -150,684 -134,383 -141,574 -127,012
Net interest income 578,141 434,469 539,515 382,276
Dividends received 4 9,747 10,221 259,673 140,033 Commission income 5 858,212 743,843 254,521 212,315 Commission expenses 6 -39,582 -35,076 -23,082 -19,414
Net profit from financial transactions 7 61,051 41,443 96,470 44,425 Participations in associated company’s earnings 8 4,533 -1,037 0 0
Other operating income 9 26,050 14,995 192,089 189,957
Operating income 1,498,152 1,208,858 1,319,186 949,592
Personnel expenses
10
-470,237
-387,071
-279,968
-247,464
Other administrative expenses -540,895 -450,636 -278,920 -246,325
Depreciation/amortization of intangible and tangible fixed assets etc. 11 -37,229 -26,619 -74,624 -50,768 Other operating expenses -1,245 -123 0 -4
Operating expenses -1,049,606 -864,449 -633,512 -544,561
Profit before credit losses 448,546 344,409 685,674 405,031
Credit losses, net
12
-121,181
-148,978
-103,073
-104,750
Impairment charges, financial assets 13 -1,460 0 -62,975 -33,150
Operating profit 325,905 195,431 519,626 267,131
Appropriations
14
0
0
-274,629
-110,951
Profit before tax 325,905 195,431 244,997 156,180
Tax on profit for the year
15
-94,738
-52,519
-32,767
-26,242
Profit for the year 231,167 142,912 212,230 129,938
Of which attributable to:
Holding without a controlling influence 9,370 1,229 Parent Company shareholders 240,537 144,141
STATEMENT OF COMPREHENSIVE INCOME (SEK thousands)
Profit for the year
231,167
142,912
212,230 129,938
Items for possible reclassification and transfer to the income statement Financial assets available for sale 3,919 8,093 3,919 8,093
Tax effect of financial assets available for sale -862 -1,780 -862 -1,780
Translation of foreign operations 18,571 7,506 4,381 -2,824
Reclassification of holdings 2,260 0 0 0
Acquisition 494 0 0 0
Other comprehensive income 24,382 13,819 7,438 3,489
Comprehensive income for the year 255,549 156,731 219,668 133,427
Of which attributable to:
Holding without a controlling influence 9,370 1,229
Parent Company shareholders 264,919 157,960
SVEA EKONOMI AB 11 (63)
Annual Report, 2014
STATEMENT OF FINANCIAL POSITION/
BALANCE SHEETS (SEK thousands)
Group Parent Company
Note 31/12/2014 31/12/2013 31/12/2014 31/12/2013
Cash and balances with central banks
44,699
0
0
0
Lending to credit institutions 34 1,836,208 1,048,866 1,531,742 789,329 Lending to the public 16, 34 5,150,410 4,289,118 4,952,040 4,107,382 Bonds and other securities 17 1,040,949 589,985 1,040,949 589,985 Shares and participations 18 589,631 482,443 589,044 481,759 Other participations 19 4,534 3,374 0 0 Shares and participations in associated companies 20 57,076 56,934 56,802 60,602 Shares in Group companies 21 0 0 274,177 260,746 Intangible assets 22 156,225 139,941 886 1,266 Tangible assets 23 108,733 69,586 306,799 197,942 Deferred tax assets 24 3,281 47,707 701 843 Other assets 25, 34 108,062 95,115 34,569 35,715 Prepaid expenses and accrued income 26 45,785 44,740 24,196 29,859
Assets 9,145,593 6,867,809 8,811,905 6,555,428
Liabilities to credit institutions
27, 34
29,052
37,730
0
0
Deposits from the public 28, 34 7,544,755 5,561,667 7,411,716 5,461,464 Issued securities, etc. 29 0 49,442 47,375 49,442 Other liabilities 30 211,294 150,989 134,420 99,229 Accrued expenses and deferred income 31 145,285 118,132 74,797 66,586
Liabilities 7,930,386 5,917,960 7,668,308 5,676,721
Provisions 24 35,215 28,380 21,192 20,413
Subordinated liabilities 32 75,000 0 75,000 0
Untaxed reserves 33 0 0 38,000 0
Shareholders’ equity
Restricted shareholders’ equity
Share capital 8,421 8,000 8,421 8,000
Statutory reserve 1,600 1,600
Non-restricted shareholders’ equity
Fair value reserve 74,443 71,386
Reserves 69,948 49,760 0 0
Share premium account 49,579 0 49,579 0
Profit brought forward 730,940 708,825 663,132 647,370
Profit for the year 240,537 144,141 212,230 129,938
Attributable to Parent Company shareholders 1,099,425 910,726 1,009,405 858,294
Holding without a controlling influence 5,567 10,743 0 0
Shareholders’ equity 1,104,992 921,469 1,009,405 858,294
Liabilities and shareholders’ equity 9,145,593 6,867,809 8,811,905 6,555,428
Assets pledged for own liabilities 34 218,622 200,929 21,549 1,058 Contingent liabilities 35 100 1,265 12,310 8,420 Commitments 36 492,372 422,126 551,513 396,570
SVEA EKONOMI AB 12 (63)
Annual Report, 2014
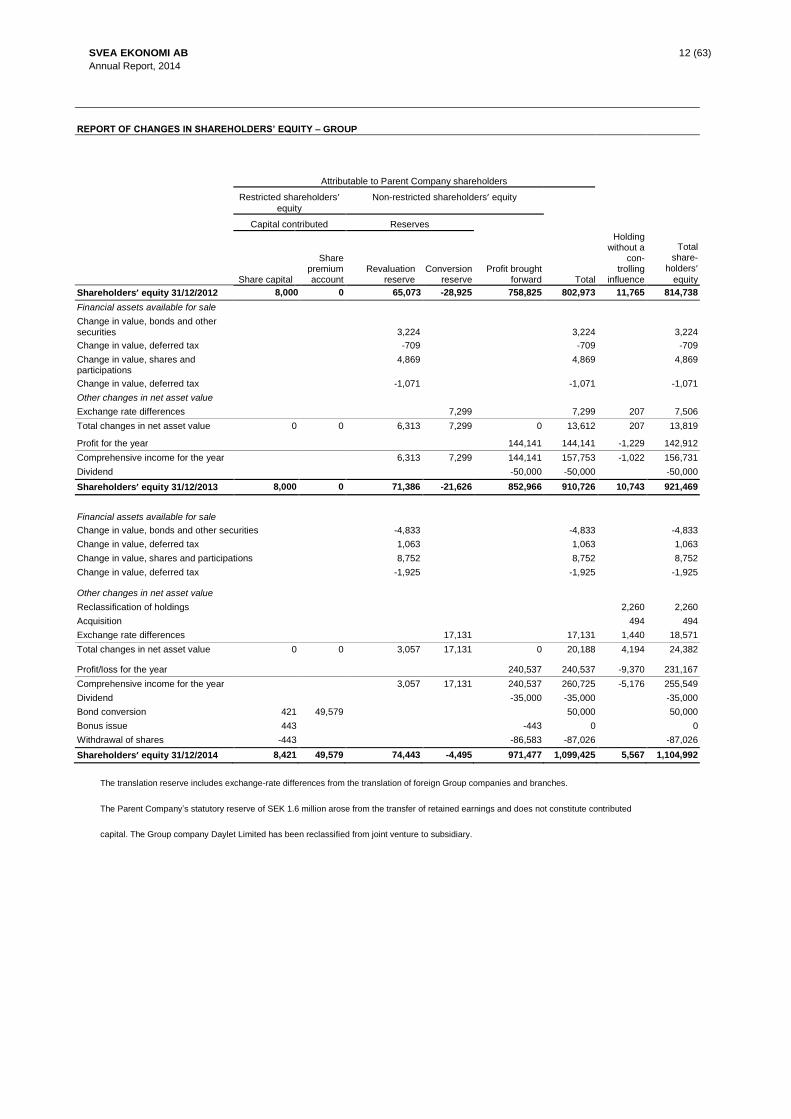
REPORT OF CHANGES IN SHAREHOLDERS’ EQUITY – GROUP
Attributable to Parent Company shareholders
Restricted shareholders’ equity
Non-restricted shareholders’ equity
Capital contributed Reserves
Share capital
Share premium account
Revaluation reserve
Conversion reserve
Profit brought forward Total
Holding without a
con-trolling
influence
Total share-
holders’ equity
Shareholders’ equity 31/12/2012 8,000 0 65,073 -28,925 758,825 802,973 11,765 814,738
Financial assets available for sale
Change in value, bonds and other
securities 3,224 3,224 3,224
Change in value, deferred tax -709 -709 -709
Change in value, shares and participations
4,869 4,869 4,869
Change in value, deferred tax -1,071 -1,071 -1,071
Other changes in net asset value
Exchange rate differences 7,299 7,299 207 7,506
Total changes in net asset value 0 0 6,313 7,299 0 13,612 207 13,819
Profit for the year 144,141 144,141 -1,229 142,912
Comprehensive income for the year 6,313 7,299 144,141 157,753 -1,022 156,731
Dividend -50,000 -50,000 -50,000
Shareholders’ equity 31/12/2013 8,000 0 71,386 -21,626 852,966 910,726 10,743 921,469
Financial assets available for sale
Change in value, bonds and other securities -4,833 -4,833 -4,833
Change in value, deferred tax 1,063 1,063 1,063
Change in value, shares and participations 8,752 8,752 8,752
Change in value, deferred tax -1,925 -1,925 -1,925
Other changes in net asset value
Reclassification of holdings 2,260 2,260
Acquisition 494 494
Exchange rate differences 17,131 17,131 1,440 18,571
Total changes in net asset value 0 0 3,057 17,131 0 20,188 4,194 24,382
Profit/loss for the year 240,537 240,537 -9,370 231,167
Comprehensive income for the year 3,057 17,131 240,537 260,725 -5,176 255,549
Dividend -35,000 -35,000 -35,000
Bond conversion 421 49,579 50,000 50,000
Bonus issue 443 -443 0 0
Withdrawal of shares -443 -86,583 -87,026 -87,026
Shareholders’ equity 31/12/2014 8,421 49,579 74,443 -4,495 971,477 1,099,425 5,567 1,104,992
The translation reserve includes exchange-rate differences from the translation of foreign Group companies and branches.
The Parent Company’s statutory reserve of SEK 1.6 million arose from the transfer of retained earnings and does not constitute contributed
capital. The Group company Daylet Limited has been reclassified from joint venture to subsidiary.
SVEA EKONOMI AB 13 (63)
Annual Report, 2014
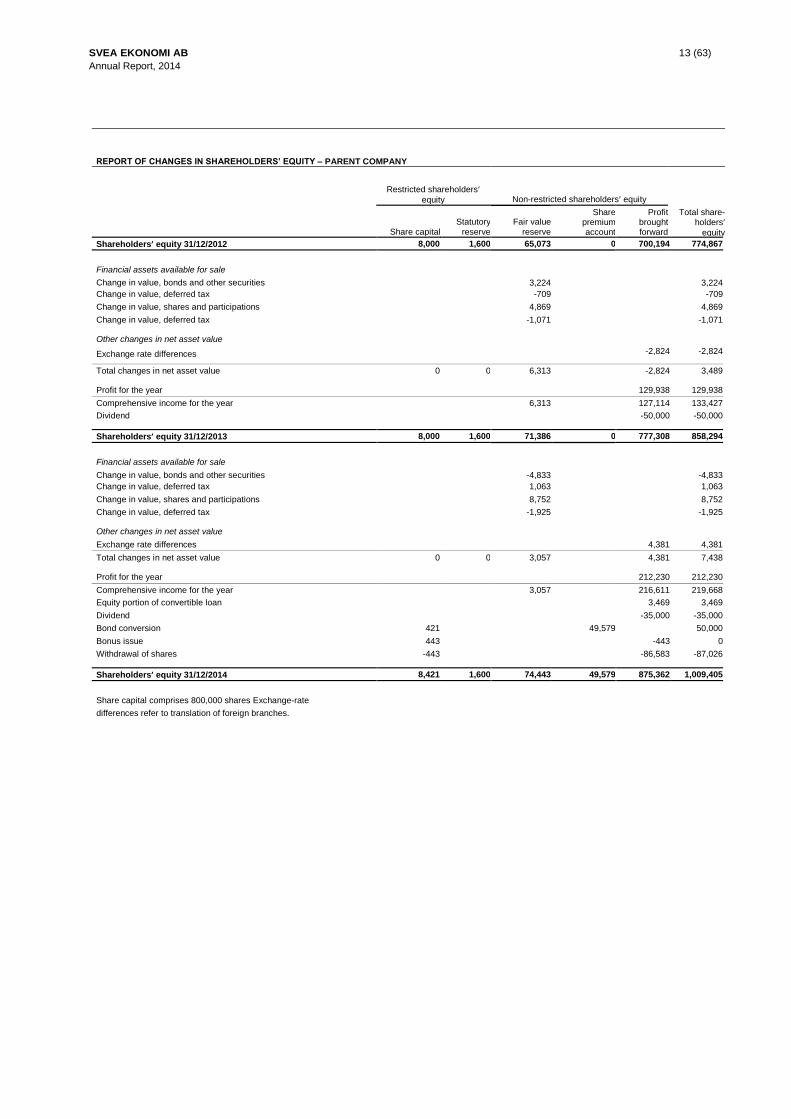
REPORT OF CHANGES IN SHAREHOLDERS’ EQUITY – PARENT COMPANY
Restricted shareholders’ equity Non-restricted shareholders’ equity
Share capital Statutory
reserve Fair value
reserve
Share premium account
Profit brought forward
Total share-holders’
equity
Shareholders’ equity 31/12/2012 8,000 1,600 65,073 0 700,194 774,867 Financial assets available for sale
Change in value, bonds and other securities
3,224
3,224
Change in value, deferred tax -709 -709
Change in value, shares and participations 4,869 4,869
Change in value, deferred tax -1,071 -1,071
Other changes in net asset value
Exchange rate differences -2,824 -2,824
Total changes in net asset value 0 0 6,313 -2,824 3,489
Profit for the year 129,938 129,938
Comprehensive income for the year 6,313 127,114 133,427
Dividend -50,000 -50,000
Shareholders’ equity 31/12/2013 8,000 1,600 71,386 0 777,308 858,294 Financial assets available for sale
Change in value, bonds and other securities
-4,833
-4,833
Change in value, deferred tax 1,063 1,063
Change in value, shares and participations 8,752 8,752
Change in value, deferred tax -1,925 -1,925
Other changes in net asset value
Exchange rate differences
4,381
4,381
Total changes in net asset value 0 0 3,057 4,381 7,438
Profit for the year 212,230 212,230
Comprehensive income for the year 3,057 216,611 219,668
Equity portion of convertible loan 3,469 3,469
Dividend -35,000 -35,000
Bond conversion 421 49,579 50,000
Bonus issue 443 -443 0
Withdrawal of shares -443 -86,583 -87,026
Shareholders’ equity 31/12/2014 8,421 1,600 74,443 49,579 875,362 1,009,405
Share capital comprises 800,000 shares Exchange-rate
differences refer to translation of foreign branches.
SVEA EKONOMI AB 14 (63)
Annual Report, 2014
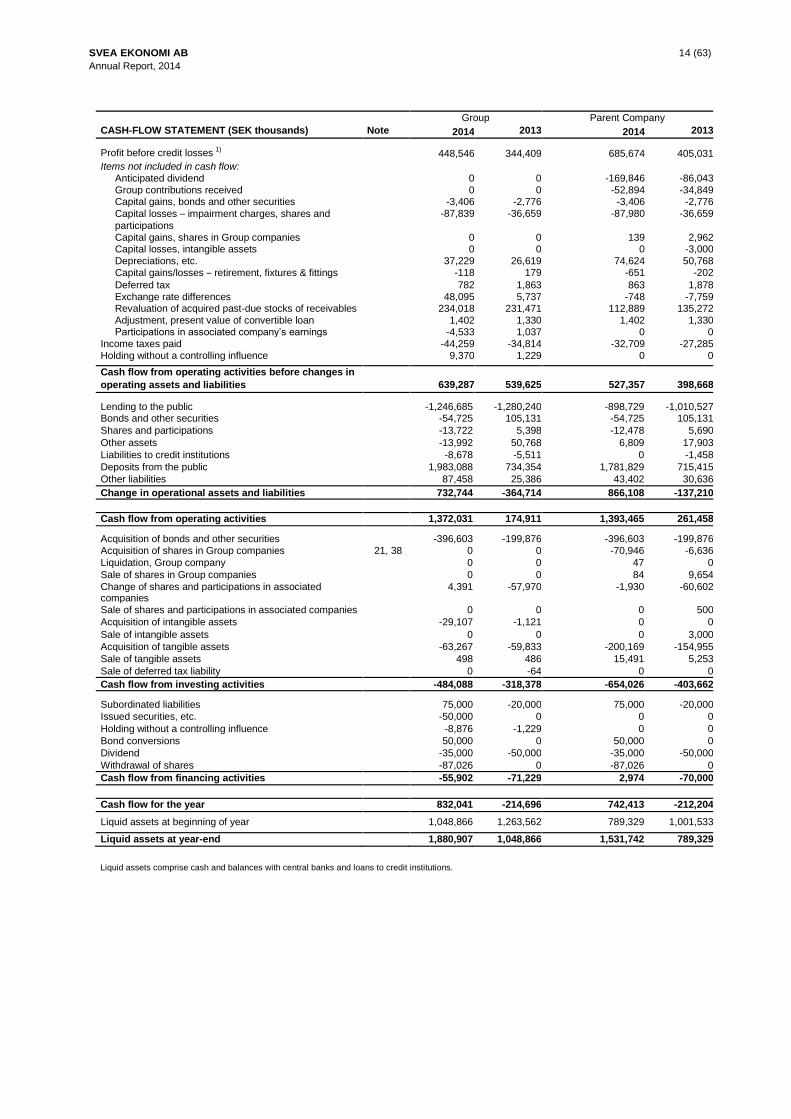
Group Parent Company
CASH-FLOW STATEMENT (SEK thousands) Note 2014 2013 2014 2013
Profit before credit losses 1) 448,546 344,409 685,674 405,031
Items not included in cash flow:
Anticipated dividend 0 0 -169,846 -86,043
Group contributions received 0 0 -52,894 -34,849 Capital gains, bonds and other securities -3,406 -2,776 -3,406 -2,776
Capital losses – impairment charges, shares and
participations
-87,839 -36,659 -87,980 -36,659
Capital gains, shares in Group companies 0 0 139 2,962 Capital losses, intangible assets 0 0 0 -3,000
Depreciations, etc. 37,229 26,619 74,624 50,768
Capital gains/losses – retirement, fixtures & fittings -118 179 -651 -202
Deferred tax 782 1,863 863 1,878
Exchange rate differences 48,095 5,737 -748 -7,759 Revaluation of acquired past-due stocks of receivables 234,018 231,471 112,889 135,272
Adjustment, present value of convertible loan 1,402 1,330 1,402 1,330 Participations in associated company’s earnings -4,533 1,037 0 0
Income taxes paid -44,259 -34,814 -32,709 -27,285
Holding without a controlling influence 9,370 1,229 0 0
Cash flow from operating activities before changes in
operating assets and liabilities
639,287
539,625
527,357
398,668
Lending to the public
-1,246,685 -1,280,240 -898,729 -1,010,527 Bonds and other securities -54,725 105,131 -54,725 105,131
Shares and participations -13,722 5,398 -12,478 5,690
Other assets -13,992 50,768 6,809 17,903
Liabilities to credit institutions -8,678 -5,511 0 -1,458
Deposits from the public 1,983,088 734,354 1,781,829 715,415
Other liabilities 87,458 25,386 43,402 30,636
Change in operational assets and liabilities 732,744 -364,714 866,108 -137,210
Cash flow from operating activities 1,372,031 174,911 1,393,465 261,458
Acquisition of bonds and other securities
-396,603 -199,876 -396,603 -199,876
Acquisition of shares in Group companies 21, 38 0 0 -70,946 -6,636
Liquidation, Group company 0 0 47 0
Sale of shares in Group companies 0 0 84 9,654
Change of shares and participations in associated companies
4,391 -57,970 -1,930 -60,602
Sale of shares and participations in associated companies 0 0 0 500
Acquisition of intangible assets -29,107 -1,121 0 0
Sale of intangible assets 0 0 0 3,000
Acquisition of tangible assets -63,267 -59,833 -200,169 -154,955
Sale of tangible assets 498 486 15,491 5,253
Sale of deferred tax liability 0 -64 0 0
Cash flow from investing activities -484,088 -318,378 -654,026 -403,662
Subordinated liabilities
75,000 -20,000 75,000 -20,000
Issued securities, etc. -50,000 0 0 0
Holding without a controlling influence -8,876 -1,229 0 0
Bond conversions 50,000 0 50,000 0
Dividend -35,000 -50,000 -35,000 -50,000
Withdrawal of shares -87,026 0 -87,026 0
Cash flow from financing activities -55,902 -71,229 2,974 -70,000
Cash flow for the year 832,041 -214,696 742,413 -212,204
Liquid assets at beginning of year 1,048,866 1,263,562 789,329 1,001,533
Liquid assets at year-end 1,880,907 1,048,866 1,531,742 789,329
Liquid assets comprise cash and balances with central banks and loans to credit institutions.
SVEA EKONOMI AB 15 (63)
Annual Report, 2014
Note 1 Accounting policies and valuation principles
Information about the company
The Annual Report and consolidated accounts were prepared on 31 December 2014 and refer to Svea Ekonomi AB, which is a
credit institution registered in Sweden, whose registered office is in Solna, Stockholm. The head office address is
Evenemangsgatan 31, Solna.
Compliance with standards and laws
The Annual Report and consolidated accounts were prepared in accordance with international reporting standards (IFRS) as
adopted by the EU and the Swedish Annual Accounts Act for Credit Institutions and Securities Companies (ÅRKL/1995:1559).
The Swedish Financial Supervisory Authority’s regulations and general advice (FFFS 2008:25) and the Swedish Financial
Reporting Board’s recommendations RFR 1 Supplementary Accounting Rules for Groups and RFR 2 Accounting for Legal Entities
are also applied. Accordingly, the company fully applies IFRS to the Group and legally restricted IFRS to the Parent Company.
The Annual Report and consolidated accounts were approved for issue by the Board of Directors on 08 May 2015. The income
statements and balance sheets were presented for adoption by the Annual General Meeting on 8 May 2015.
General conditions for the preparation of the company’s financial statements
Subsidiaries that prepare their own annual reports in accordance with the Annual Accounts Act adjust to comply with
ÅRKL/1995:1559 in the consolidated accounts, whereby the item net sales is reported as commission income. All companies in
the Group apply uniform accounting policies.
IFRS 8 Operating Segments and IAS 33 are applied only by companies whose shares are subject to public trading.
As of 1 January 2014, the Group company Daylet Limited has been reclassified from joint venture to subsidiary, which means it is
reported according to the acquisition method in contrast to the previously applied proportional consolidation principle. The change
has not had any material effect on capital requirements, the capital base, major exposures or the financial statements.
The new company, Svea Intressenter 2 AB has been classified as a Group company.
Otherwise the accounting policies have not changed in relation to the previous year.
Assets and liabilities are reported at cost, unless otherwise stated below.
All amounts in the financial statements of the Group and Parent Company are presented in SEK thousands unless otherwise
expressly stated. The Parent Company’s functional currency is SEK.
Revisions to IFRS 10, IFRS 11 and IFRS 12 as of 2014 have not had any material effect on capital requirements, the capital base,
major exposures or the financial statements.
Among future standards, IFRS 9 is anticipated to come into effect with the transition in 2018.
Critical assessments and important sources of uncertainty in estimates
Preparing the financial statements requires company management to make assessments and estimates as well as make
assumptions that affect the application of the accounting policies and the reported amounts of assets, liabilities, income and
expenses and off-balance-sheet commitments. These estimates and assumptions are based on past experience and other factors
that the management considers fair and reasonable.
Certain accounting policies are deemed to be of particular importance for the Group’s financial position as they are based on
complex, subjective assessments and estimates on the part of management, most of which refer to circumstances that are
uncertain. These critical assessments and estimates are primarily attributable to impairment testing of shares in Group companies,
goodwill and lending; see below for further information.
Impairment test for shares in Group companies
Shares in Group companies are tested as required in accordance with IAS 36 Impairment of Assets. An analysis is conducted in
the test to determine whether the book value of the shares in the Group company is fully recoverable. When the recoverable
amount is determined, the value in use is established measured as the present value of expected cash flows from the Group
company concerned.
The discount rate used is the risk-free interest rate plus a risk factor. Forecasts of future cash flows are based on Svea Ekonomi’s
best estimates of future income and expenses for the Group company concerned.
Refer also to the section below entitled Impairment testing of fixed assets.
Impairment testing of goodwill
Goodwill is tested every year in accordance with IAS 36 Impairment of Assets. An analysis is conducted in the test to determine
whether the book value of the goodwill is fully recoverable. When the recoverable amount is determined, the value in use is
established measured as the present value of expected cash flows from the cash-generating units to which goodwill has been
allocated.
The discount rate used is the risk-free interest rate plus a risk factor. Forecasts of future cash flows are based on Svea Ekonomi’s
best estimates of future income and expenses for the cash-generating units.
Refer also to the section below entitled Impairment testing of fixed assets.
Impairment testing of lending
When testing lending for impairment, the most critical assessment, and the one with the highest level of uncertainty, is estimating
the most probable future cash flow that the customers can generate. Refer also to the section below entitled Impairment testing of
financial assets.
SVEA EKONOMI AB 16 (63)
Annual Report, 2014
Consolidated accounts
The consolidated accounts have been prepared by applying the rules of acquisition accounting and comprise the Parent Company
and all the companies over which the Parent Company, directly or indirectly, has a controlling influence or significant influence, as
the case may be. A controlling influence is assumed to exist when ownership amounts to at least 50 per cent of the votes in the
subsidiary company. A significant influence is assumed to exist when ownership amounts to at least 20 per cent of the votes in the
associated company. Interest can also be attained by means other than share ownership.
Group companies and associated companies are included in the consolidated accounts from the date on which the controlling or
significant influence was obtained and are excluded from the consolidated accounts from the date on which the controlling or
significant influence ceases.
Only shareholders’ equity earned after the acquisition is reported in consolidated shareholders’ equity. Internal transactions with
subsidiaries and associated companies, and outstanding accounts with subsidiaries are eliminated in the consolidated accounts.
The subsidiaries’ and associated companies’ accounting policies have been adjusted where necessary to ensure their conformance
with the Group’s accounting policies. The equity portion of untaxed reserves is reported in shareholders’ equity as profit brought
forward. The tax portion of untaxed reserves is reported as deferred tax liabilities based on the current tax rate in each country.
Group companies, subsidiaries
Subsidiaries are reported according to the acquisition method, which means acquired, identifiable assets, liabilities and contingent
liabilities are measured at fair value on the acquisition date. The surplus that consists of the difference between the cost of the
acquired participations and the total fair value of the acquired, identifiable net assets is reported as goodwill. If the cost is less than
the fair value of the acquired subsidiary’s net assets, the difference is reported directly in the income statement as a reversal of
negative goodwill.
Associated companies
Associated companies are reported according to the equity method, which means the participation in the associated company is
reported at cost on the acquisition date and is subsequently adjusted by the Group’s share of the change in the associated
company’s net assets.
The acquisition cost of Group and associated companies comprises the total fair value of the assets provided, liabilities incurred or
assumed, plus expenses – in the Parent Company – directly attributable to the acquisition.
Foreign Group companies and branches are translated according to the current method; see below for further information.
Foreign currencies
Group
Assets and liabilities in foreign currencies are translated at the closing day rate, while items in the income statement are translated at the average exchange rate for the year. Foreign subsidiaries prepare their accounts in the local functional currency of the country where they do business. Exchange-rate differences arise in the translation of the subsidiaries’ annual accounts partly because the closing day rate changes between accounting year ends and also because the average rate deviates from the closing day rate. Exchange-rate differences attributable to the translation of subsidiaries are reported directly via comprehensive income in the translation reserve under shareholders’ equity.
Parent Company
Assets and liabilities in foreign currencies are translated at the closing day rate. Exchange rate differences are reported in the
income statement under net profit/loss from financial transactions. To minimize exchange-rate differences, net positions in NOK,
EUR, DKK and USD are hedged through currency swaps/forward contracts as presented in Note 41. Swaps/forward contracts are
translated on an ongoing basis at fair value and are reported in the income statement under net profit/loss from financial
transactions.
Income recognition
Interest income
Interest income is accrued over the life of the loan according to the effective interest method and deducted in arrears. Income
attributable to acquired but non-mature receivables is allocated up to the date of payment. Income attributable to acquired stocks of
past-due receivables is reported when payment has been received and is matched by expenses attributable to these payments.
Leasing income
Leasing income is invoiced on a monthly basis in advance and is periodized. In the consolidated accounts, financial leasing agreements are reported as lending to the public, which means that leasing income is reported as interest income and amortization.
Dividend income
Dividend income and Group contributions from Group companies are reported when the right to receive payment is determined
while dividends from other shares and participations are reported when payment is received.
Commission income
Income for services rendered is reported in the same month in which the assignment is completed or the service is rendered and at
the value expected to be invoiced, which is conducted in arrears. Subscription income is invoiced on an annual basis in advance and
is periodized over the life of the subscription.
Net profit/loss from financial transactions
Net profit/loss from financial transactions comprises realized gains and unrealized changes in the value of financial instruments
based on the fair value of derivatives. The item also includes revenues and expenses attributable to the sale and purchase of foreign
currencies and exchange rate changes.
Other operating income
Other operating income in the Parent Company refers primarily to staffing and re-invoicing of other expenses to other Group
companies. The item also refers to income not attributable to other income lines and which is normally reported when the
transactions have been completed.
SVEA EKONOMI AB 17 (63)
Annual Report, 2014
Remuneration to employees
Remunerations to employees in the form of salaries, paid vacation, paid sick leave, other short-term remuneration and similar, and
pensions are reported as they are earned.
Pension commitments
The Group has only defined-contribution plans, which means the Group’s obligations are limited to the contributions that it has
undertaken to pay to an insurance company. The expenses for defined-contribution pension plans are reported in the income
statement as the benefits are earned, which normally coincides with the dates on which the pension premiums are paid. Expenses
for the special employer’s contribution are allocated as they arise.
Leasing
Svea Ekonomi as lessor
Svea Ekonomi’s leasing operations are reported in the Parent Company as operational leasing. The assets referred to are reported
in the balance sheet as tangible assets. Leasing income is reported according to the straight-line method over the life of the leasing
agreement; see Note 23. Leased items are depreciated progressively down to the agreed residual value and reported in the income
statement as depreciation of tangible assets.
In the consolidated accounts these leasing agreements are classified as financial and are therefore reported as receivables from the
lessee in an amount equivalent to the net investment according to the leasing agreement. The leasing payment is reported as
repayment of receivables and as interest income. The income is spread to achieve an even return during each period of reported net
investment.
Svea Ekonomi as lessee
All leasing agreements for own use are reported as operational leasing. Leasing charges are reported as expenses in the income
statement in a straight-line over the lease term; see Note 23.
Operational leasing is primarily attributable to normal agreements for the operations relating to office premises and office equipment.
Taxes
Current tax
Current tax refers to income tax payable on the current year’s taxable income.
Deferred tax
Deferred tax is calculated for tax-loss carryforwards in Group companies insofar as it is probable that the loss carryforwards will be
deducted from surpluses at future taxation. Deferred tax is also calculated on temporary differences, such as changes in untaxed
reserves and the fair value reserve and on acquired Group-related surpluses.
In the Estonian Group companies, income tax is not paid until dividends are distributed. Since the companies will not pay any
dividends in the foreseeable future, no deferred tax expense or liability has been reported.
Financial instruments – classification of financial assets and liabilities
A financial instrument is defined as every type of agreement that gives rise to a financial asset in a company and a financial liability
or equity instrument with the counterparty.
Under IAS 39, every financial instrument is classified in one of the following categories and forms the basis for how such instruments
are valued in the balance sheet and how the change in the value of the instruments is reported; refer also to Note 42.
Financial assets
- Financial assets measured at fair value in the statement of comprehensive income (income statement)
- Loan receivables and accounts receivable
- Investments held to maturity
- Financial assets available for sale
Financial liabilities
- Financial liabilities measured at fair value in the statement of comprehensive income (income statement)
- Other financial liabilities
Financial assets measured at fair value in the statement of comprehensive income (income statement)
Financial assets measured at fair value in the income statement are measured at fair value. All changes in the values of these items
are reported directly in the income statement under net profit/loss from financial transactions.
Loan receivables and accounts receivable
Loan receivables and accounts receivable, which constitute financial assets that are not derivatives and which are not listed on an
active market, are valued at accrued cost.
Investments held to maturity
Investments held to maturity are financial assets that include interest-bearing securities with fixed or determinable payments that the
company is able, and intends, to hold until maturity. Assets in this category are valued at accrued cost.
Financial assets available for sale
Financial assets available for sale are measured at fair value. Changes in fair value, apart from impairment charges, are reported in
the Group in comprehensive income in the revaluation reserve and in the Parent Company in the fair value reserve under
shareholders’ equity. When an asset is sold, accumulated changes in fair value, which were previously reported under shareholders’
equity, are transferred from shareholders’ equity and reported instead under net profit/loss from financial transactions.
SVEA EKONOMI AB 18 (63)
Annual Report, 2014
Financial liabilities measured at fair value in the statement of comprehensive income (income statement)
Financial liabilities measured at fair value in the income statement are measured at fair value. All changes in the values of these
items are reported directly in the income statement under net profit/loss from financial transactions.
Other financial liabilities
Other financial liabilities not classified as belonging to the category of financial liabilities valued at fair value in the income statement
are valued at accrued cost.
Combined financial instruments
Convertible debt instruments are reported as combined financial instruments, i.e. debt instruments with an option to convert the debt
to shares. The debt instrument and the shareholders’ equity component are therefore reported separately in the statement of
financial position. The fair value of the debt instrument consists of the present value of future payments of interest and amortizations
attributable to the debt instrument. The discount rate consists of the market rate at the time of issue of comparable debt instruments
but without conversion options. The equity instrument consists of a built-in option to convert the debt instrument to shares.
Financial assets and liabilities
Financial assets in the balance sheet include cash and balances with central banks, lending to credit institutions, lending to the
public, bonds and other interest-bearing securities, shares and participations, accounts receivable and derivative instruments.
Financial liabilities in the balance sheet include liabilities to credit institutions, deposits from the public, issued securities, etc.,
accounts payable, derivative instruments and subordinated liabilities.
Cash and balances with central banks
Cash and bank balances are classified as financial assets or liabilities measured at fair value in the income statement. Changes in
fair value are reported as net profit/loss from financial transactions in the income statement. The item comprises cash and bank
balances that consist of Swedish and foreign notes and coin.
Lending to credit institutions
Lending to credit institutions is classified as loan receivables and accounts receivable and comprises bank balances and short-term
liquid investments; it is valued at accrued cost.
Lending to the public
Lending to the public is classified as loan receivables and accounts receivable and is valued at accrued cost. The item includes lending to private individuals and companies, factoring, acquired but non-mature receivables and acquired stocks of past-due receivables. The costs of stocks of past-due receivables of minor value and with estimated payment terms up to 18 months are expensed over their assessed life and matched against payments reported as income. The Group monitors advances in the manner described in the separate section on risk and capital management. Impairment testing is conducted to identify loans attributable to individual customers or groups of customers if there is objective evidence of an impairment and if impairment requirement testing indicates a loss. See below for further information.
Bonds and other interest-bearing securities
Bonds and other interest-bearing securities are classified as financial assets available for sale. This item includes interest-bearing
securities with fixed or determinable payments and fixed maturities that are reported at estimated fair value via comprehensive
income in the revaluation reserve or fair value reserve under shareholders equity.
Shares and participations
Shares and participations are classified as financial assets available for sale. Shares and participations are reported at estimated fair
value via comprehensive income in the revaluation reserve or fair value reserve under shareholders equity. Unlisted shares and
participations are reported at cost.
Accounts receivable
Accounts receivable are classified as loan receivables and accounts receivable and comprise part of other assets; they are valued at
accrued cost.
Derivative instruments
Derivative instruments are classified as financial assets or liabilities measured at fair value in the income statement. Changes in fair
value are reported as net profit/loss from financial transactions in the income statement.
If the fair value of an individual contract is positive, it is reported as an asset and forms part of the item Other assets. If the fair value
of an individual contract is negative, the derivative instrument is reported as a liability and comprises part of the item Other liabilities.
Svea Ekonomi’s derivative instruments consist of currency swaps and constitute hedging of net positions in NOK, EUR, DKK and
USD.
Liabilities to credit institutions
Liabilities to credit institutions are classified as other financial liabilities and valued at accrued cost. The item comprises bank loans
and loans from other credit institutions.
Deposits from the public
Deposits from the public are classified as other financial liabilities and valued at accrued cost. The item comprises deposits from
both private individuals and companies.
Issued securities, etc.
Issued securities, etc. are classified as other financial liabilities and valued at accrued cost. The item refers to a convertible debt
instrument.
SVEA EKONOMI AB 19 (63)
Annual Report, 2014
Accounts payable
Accounts payable are classified as other financial liabilities and valued at accrued cost. The item forms part of other liabilities.
Subordinated liabilities
Subordinated liabilities are classified as other financial liabilities and valued at accrued cost. The item refers to subordinated loans
from companies.
Financial guarantees
Guarantees are reported off the balance sheet as contingent liabilities. Insofar as it is considered necessary to realize guarantee
commitments, they are reported as provisions in the balance sheet and as credit losses in the income statement, as the case may
be. The provision is calculated as the discounted best estimate of the amount required to settle the guarantee in question.
Loan commitments
Loan commitments are reported off the balance sheet as commitments. In this context a loan commitment refers to a unilateral
undertaking by the company to issue a loan on predetermined terms and conditions that allow the borrower to choose whether to
raise the loan or not. The normal procedure for the company is for future payment to be on condition that the trend forecast
regarding the borrower’s ability to repay when the contract was signed does not deteriorate significantly. Should such a significant
deterioration exist, the loan commitment may be revoked. Accordingly, loan commitments are risk-weighted at zero per cent when
calculating capital requirements for the company and the Financial Companies Group, as said loan commitments are often subject
to new credit checks if any disbursement is made in the future.
Methods for measuring fair value
Financial assets quoted on an active market
The fair value of financial instruments quoted on an active market is measured based on the bid price quoted on closing day, without
additions for transaction expenses at the time of acquisition. A financial instrument is considered quoted on an active market if
quoted prices are readily available on an exchange, from a trader, broker, banks, etc. and that such prices represent actual and
regularly occurring market transactions on commercial conditions. Share prices are obtained from NASDAQ OMX. Instruments
quoted on an active market are reported in the balance sheet under Shares and participations, and Bonds and other securities.
Other
The fair values of derivative instruments in the form of currency swaps/currency forward contracts are obtained from external
commercial banks, and currency exchange rates from the Swedish Tax Agency and the Swedish Central Bank. Holdings of unlisted
shares are reported at cost when it is not possible to reliably determine fair values. (For the measurement of financial assets and
liabilities in foreign currency, fair values of these currencies are obtained from the Swedish Tax Agency and the Swedish Central
Bank. These balance-sheet items are reported at accrued cost.)
The division of financial instruments measured at fair value into three levels is described in Note 44.
Impairment tests of financial assets
On each reporting date, the company evaluates whether objective evidence exists indicating that a financial asset or group of assets
require impairment as a result of loss events and that such events are deemed to have an impact on estimated future cash flows
from the asset or group of assets.
Financial assets reported at accrued cost
Impairment testing of loans attributable to companies
Svea Ekonomi primarily applies individual impairment testing for lending to companies. A collective assessment is also conducted.
Testing involves determining whether objective evidence exists, in the form of loss events or observable data showing that the
customer’s future cash flow has been affected to such an extent that full repayment, including collateral, is no longer probable.
These cash flows have terms of less than one year. The amount of the impairment corresponds to the amount of the anticipated
loss.
Impairment testing of loans attributable to private individuals
Svea Ekonomi applies collective impairment testing primarily for lending to private individuals who have similar risk characteristics
as there are no individually significant items. Testing includes an assessment of the amount of cash flow the customer is expected to
generate in the future. These cash flows, with terms exceeding one year, are subsequently discounted using an effective rate of
interest and result in a present value. The discount rate for loan receivables with variable interest comprises the current effective
interest (IAS 39 AG84). Collateral received to limit the credit risk is measured at fair value.
If the book value of the loan exceeds the total of the present value of the expected cash flows, including the fair value of the
collateral, the difference constitutes an impairment requirement. A need to recognize impairment for a group of loan receivables is a
temporary measure pending the identification of an impairment for an individual customer. Identification occurs if the customer
actually defaults or on the basis of other indicators.
SVEA EKONOMI AB 20 (63)
Annual Report, 2014
Credit losses
If the impairment is not considered definite, it is reported in a reserve account showing the accumulated impairments. Changes in
the credit risk and the accumulated impairments are reported as changes in the reserve account and as credit losses, net, in the
income statement. If the impairment is considered to be definite, it is reported as a verified credit loss. An impairment loss is
considered to be definite when a bankruptcy petition is submitted against the borrower and the receiver in bankruptcy has presented
the financial outcome of the bankruptcy proceedings, or when Svea Ekonomi waives its receivable through restructuring or, for other
reasons considers recovery of the receivable improbable.
Investments held to maturity
Svea Ekonomi has no investments held to maturity.
Financial assets available for sale
Financial assets in this category consist almost exclusively of quoted shares, participations, bonds and other securities measured at
fair value, for which reason there is usually no requirement for an impairment. However, impairments take place if fair values fall
significantly below cost or if the decline in value is permanent. In contrast to changes in fair value, which are reported directly or via
comprehensive income in shareholders’ equity, impairments are reported in the income statement under net profit/loss from financial
transactions.
Financial assets reported at cost
In the case of unlisted equity instruments, for which reliable fair values cannot be determined, impairment charges are calculated as
the difference between an asset’s cost and the present value of estimated future cash flows discounted at the current market return
for similar financial assets.
Safeguarding receivables
When pledged assets are considered insufficient and there is a manifest risk that a loss might otherwise be incurred, the loan
receivable may be protected through acquisition of the counterparty’s business (Banking and Financing Business Act, Chapter 7).
Acquired property must be disposed of when appropriate with regard to market conditions, however not later than when this can be
done without loss.
The subsidiary Mobivox Telecom AB sells telephone subscriptions and is a business that was acquired to protect claims. However,
the acquisition does not satisfy the conditions of IFRS 5 on non-current assets held for sale. The subsidiary Dial IT Communications
BV, which was acquired to protect claims, was liquidated as of 30 June 2014.
Fixed assets
Fixed assets excluding goodwill are reported at cost less accumulated depreciations according to plan. Depreciation is calculated
based on original cost. Depreciation is on a straight-line basis over the assets’ useful lifetimes, with the exception of leasing objects.
In the Parent Company, all fixtures and fittings for own use via leasing contracts and for rental are reported as operational leases.
Leasing items for rental are depreciated on a straight-line basis according to their contractual useful life down to the agreed residual
value. In the Group, all leasing agreements in which the Group is lessor are reported as financial and as lending to the public.
Impairment of fixed assets takes place if and when any decline in value is deemed permanent; see below.
Intangible assets
Goodwill is not depreciated.
Negative Group goodwill is reversed directly via the income statement.
Customer contracts are amortized according to plan over 2–10 years.
Licenses are amortized according to plan over 2.5–5 years.
Leasing objects are amortized according to plan over 5 years.
Capitalized expenditures for development work are amortized according to plan over 3–5 years.
Tangible assets
Buildings are depreciated according to plan over 50 years.
Computer equipment is depreciated according to plan over 3–5 years.
Other fixtures and fittings are depreciated according to plan over 5–10 years.
Leasing items for rental are depreciated according to plan over 1–7 years.
Depreciation of Parent Company leasing items is reported as anticipated credit losses.
Financial assets
Shares in Group companies and participations in associated companies are classified as financial assets and reported in the Parent
Company at cost.
Impairment testing of fixed assets
Goodwill is tested for impairment in accordance with IAS 36 Impairment of Assets in conjunction with the closing of the annual
accounts. Other fixed assets are tested for impairment whenever there is an indication of the need for an impairment. Impairment
takes place if and when any decline in value is deemed permanent. In the case of assets representing cash-generating units,
impairments are reported by calculating a value in use. This value in use corresponds to the estimated future cash flows discounted
by a factor that takes into account risk-free interest and the risk specific to the asset. Impairments for holdings in Group companies
that do not conduct cash-generating operations are based on net asset value at the closing date.
SVEA EKONOMI AB 21 (63)
Annual Report, 2014
The Group’s cash-generating units consist of its subsidiaries and associated companies. The cash flows of each company are used
when testing goodwill and the planned residual value of other intangible assets attributable to said Group companies and shares in
Group companies held by the Parent Company. Forecasts have been produced by company management. The forecast period for
each cash-generating unit is five years with a supplement for subsequent cash flow without growth. The two most important
assumptions for which the units’ recoverable value is most sensitive are the Group’s weighted average cost of capital (WACC) and
rate of growth. The cash flows were discounted to a present value by applying the Group’s weighted average cost of capital (WACC)
estimated corresponding to 14–16 per cent (15–18) before tax for this year’s tests. Estimated average rates of growth per year
amount to around 3–14 per cent (approx. 3–20). The reduction in WACC is attributable to lower long-term risk-free interest rates and
a changed capital structure. With the exceptions of the Parent Company’s holding values in Svea Rahoitus Suomi OY, Svea Finans
AG, Svea Juridiska AB and Svea Kreditinfo AB, impairment testing indicated that no impairment requirements of the Group’s
reported goodwill value exist.
The Group’s reported goodwill value is distributed partly across factoring/invoice purchasing operations mainly in Denmark,
Switzerland, the Netherlands and Finland (SEK 62 million) and payment transfers/currency exchange operations in Sweden (SEK 46
million) in the AFS field, and partly across debt recovery operations in Denmark (SEK 14 million). Sensitivity analyses were
conducted into WACC and the level of annual growth at which an impairment requirement would exist, which showed there to be
adequate room for manoeuvre in the calculated values in use. The least room for manoeuvre in growth rate and/or WACC is present
partly in the two factoring/invoice purchasing units in Denmark and Switzerland, and partly in the debt recovery unit in Denmark.
Between approximately 2–3 percentage points lower WACC or around 4 percentage points lower growth rate per year would result
in an impairment of goodwill in these units.
Memorandum items
Assets pledged, contingent liabilities and commitments are reported in connection with the signing of contracts. In the case of
pledged assets, the book value of the asset pledged as collateral is reported. In the case of contingent liabilities and commitments,
the maximum guaranteed amount or the amount granted is reported.
Information regarding areas of operation
Information regarding areas of operation is provided for administrative and financial services (AFS) and debt collection; see Note 39.
Information regarding geographical areas
Information on geographical areas is provided for the country in which a company has its registered office and for all other countries
where the company received revenues or has assets. Each significant specific country, i.e. constituting more than 10 per cent of the
Group, is reported separately. The division into geographical areas is based on where customers are located and includes Sweden,
Norway, Finland and other countries. Other countries include Denmark, Estonia, Latvia, the Netherlands, Switzerland, Austria,
Germany, Russia, Romania, Serbia, the Ukraine, Bulgaria, Croatia, Slovakia, Hungary and Slovenia; see Note 40.
Parent Company
Note 2 Expenses and income between Group companies 2014 2013
Expenses -13,876 -10,432
Income 1 206,524 205,343
1 Income has been adjusted for dividends received and Group
contributions received.
Group Parent Company
Note 3 Net interest income 2014 2013 2014 2013
Interest income
Lending to credit institutions 13,726 15,310 11,835 13,256
Lending to the public, Group 0 0 31,697 29,601
Lending to the public, external 702,081 535,978 536,873 396,598
Bonds and other securities 13,018 17,564 13,018 17,564
Total 728,825 568,852 593,423 457,019
Leasing income
Leasing income 0 0 87,666 52,269
Depreciation according to plan, leased items 0 0 -62,464 -38,998
Total 0 0 25,202 13,271
Interest expenses
Liabilities to credit institutions -893 -2,970 -33 -1,363
Deposits from the public, external -145,882 -126,010 -133,788 -120,246
Issued securities, etc. -1,659 -4,330 -5,503 -4,330
Subordinated liabilities -2,250 -1,073 -2,250 -1,073
Total -150,684 -134,383 -141,574 -127,012
Net interest income 578,141 434,469 477,051 343,278

SVEA EKONOMI AB 22 (63)
Annual Report, 2014
Group Parent Company
Note 4 Dividends received 2014 2013 2014 2013
Shares and participations 9,747 10,221 9,747 10,221
Dividends from associated companies 0 0 5,504 0
Dividends from Group companies 0 0 191,528 94,964
Group contributions received 0 0 52,894 34,848
Total 9,747 10,221 259,673 140,033
Group Parent Company
Note 5 Commission income 2014 2013 2014 2013
Payment brokerage 33,124 26,767 0 0
Lending commissions 228,104 185,193 213,841 172,290
Foreign currency exchange, net 55,008 0 0 0
Other commissions 541,976 531,883 40,680 40,025
Total 858,212 743,843 254,521 212,315
Group Parent Company
Note 6 Commission expenses 2014 2013 2014 2013
Payment brokerage -21,183 -19,038 -7,510 -6,432
Information brokerage -533 -657 0 0
Other commissions -17,866 -15,381 -15,572 -12,982
Total -39,582 -35,076 -23,082 -19,414
Group Parent Company
Note 7 Net profit/loss from financial transactions 2014 2013 2014 2013
Financial assets available for sale
Capital gain, shares and participations
113,139
37,774
113,139
37,774
Impairment loss, shares and participations -25,300 -1,115 -25,159 -1,115
Capital gain, bonds and other securities 3,406 2,776 3,406 2,776
Total 91,245 39,435 91,386 39,435
Financial instruments measured at fair value via the income statement
Changes in fair value of derivatives used as hedging instruments
-51,176
-2,191
-51,176
-2,191
Change in fair value of hedged items in foreign currencies 56,315 7,299 56,315 7,299
Total 5,139 5,108 5,139 5,108
Financial instruments appraised at accrued cost
Other exchange-rate gains/losses
-35,333
-3,100
-55
-118
Total -35,333 -3,100 -55 -118
Total 61,051 41,443 96,470 44,425
Group Parent Company
Note 8 Participations in associated company’s profit/loss 2014 2013 2014 2013
Credex AB
-362
0
0
0
Trade in Sports Europe AB -188 0 0 0
eLombard Oyj -684 -1,037 0 0
Creditexpress NV 5,767 0 0 0
Total 4,533 -1,037 0 0
Group Parent Company Note 9 Other operating income 2014 2013 2014 2013
Group
0
0
175,646
176,874
External 26,050 14,995 16,443 13,083
Total 26,050
14,995 192,089 189,957
SVEA EKONOMI AB 23 (63)
Annual Report, 2014
Group Parent Company
Note 10 Personnel, etc. 2014 2013 2014 2013
Wages, salaries and other remunerations
Sweden
to Board of Directors and CEO
-6,130
-6,870
-3,730
-4,043
to other employees -186,720 -140,416 -136,323 -124,974
-192,850 -147,286 -140,053 -129,017
Norway
to Board of Directors and CEO
-1,363
-1,304
0
0
to other employees -61,294 -54,964 -25,042 -22,628
-62,657 -56,268 -25,042 -22,628
Finland
to Board of Directors and CEO
-2,540
-2,569
0
0
to other employees -49,391 -45,840 -28,655 -20,325
-51,931 -48,409 -28,655 -20,325
Denmark
to Board of Directors and CEO
-1,223
-1,164
0
0
to other employees -15,393 -12,913 0 0
-16,616 -14,077 0 0
Estonia
to Board of Directors and CEO
0
0
0
0
to other employees -2,697 -2,605 0 0
-2,697 -2,605 0 0
Latvia
to Board of Directors and CEO
0
0
0
0
to other employees -449 -217 0 0
-449 -217 0 0
Switzerland
to Board of Directors and CEO
-1,501
-1,141
0
0
to other employees -2,977 -4,667 0 0
-4,478 -5,808 0 0
Netherlands
to Board of Directors and CEO
-4,227
-1,779
0
0
to other employees -6,078 -4,096 0 0
-10,305 -5,875 0 0
Ukraine
to Board of Directors and CEO
0
0
0
0
to other employees -337 -325 0 0
-337 -325 0 0
Serbia
to Board of Directors and CEO
0
0
0
0
to other employees -442 -64 0 0
-442 -64 0 0
Bulgaria
to Board of Directors and CEO
0
0
0
0
to other employees 0 0 0 0
0 0 0 0
Hungary
to Board of Directors and CEO
0
0
0
0
to other employees -25 0 0 0
-25 0 0 0
Total -342,787 -280,934 -193,750 -171,970
Social security expenses -82,077 -69,530 -57,013 -50,733
Pension expenses
to Board of Directors and CEO
-1,482
-1,529
-412
-513
to other employees -21,922 -16,818 -14,280 -12,309
-23,404 -18,347 -14,692 -12,822
Other personnel expenses -21,969 -18,260 -14,513 -11,939
Total -470,237 -387,071 -279,968 -247,464
SVEA EKONOMI AB 24 (63)
Annual Report, 2014
Remuneration of senior executives
Preparation and decision-making processes
Remuneration of senior executives is decided by the Board.
Salaries and fees
As of 2014, only fixed fees are paid to the Chairman and members of the Board as resolved by the Annual General Meeting. Remuneration to the CEO
and senior executives in the foreign branches comprises basic salary and pension. Other senior executives refers also to the 7 (7) individuals who
together with the CEO comprise the management team in Sweden.
Salaries and remuneration to senior executives of the Parent Company, 2014
Basic salary/Board fees
Variable remuneration
Pension expenses Total
Board Chairman, Ulf Geijer
450
0
0
450
Board member, Mats Hellström 300 0 0 300
Board member, Anders Ingler 300 0 0 300
Board member, Mats Kärsrud 1,358 0 207 1,565
CEO, Lennart Ågren 1,322 0 205 1,527
Other senior executives 11,259 0 1,074 12,333
Total 14,989 0 1,486 16,475
Salaries and remuneration to senior executives of the Parent Company, 2013
Basic salary/Board fees
Variable remuneration
Pension expenses Total
Board Chairman, Ulf Geijer
55
250
0
305
Board member, Mats Hellström 50 250 0 300
Board member, Anders Lidefelt 536 250 103 889
Board member, Anders Ingler 0 0 0 0
Board member, Mats Kärsrud 1,341 0 206 1,547
CEO, Lennart Ågren 1,312 0 204 1,516
Other senior executives 9,895 0 916 10,811
Total 13,189 750 1,429 15,368
No severance pay or pension commitments other than defined-contribution fees are paid to the Board, CEO or other senior executives. The period of
notice for senior executives in Sweden is prescribed by the Swedish Employment Protection Act. Loans to Board members, the CEO or equivalent
senior executives in the Group amount to SEK 0 (321,000).
Average number permanent employees
Group
2014
2013
Parent Company
2014
2013
Women 503 395 239 235
Men 336 261 193 176
Total 839 656 432 411
The average number of permanent employees in the Parent Company also refers to personnel in the branch Svea Finans NUF and the
Svea Ekonomi AB branch in Finland. During the year, personnel were outsourced from the Parent Company to operations in Svea Inkasso
AB, Svea Kreditinfo AB, Svea Juridiska AB, Svea Vat Adviser AB, Svea Billing Services AB and Mobivox Telecom AB.
Number of employees 31/12/2014 31/12/2013 31/12/2014 31/12/2013
Sweden
Women
354
206
88
81
Men 226 144 86 70
580 350 174 151
Norway
Women
45
49
12
13
Men 63 48 28 26 Finland
108 97 40 39
Women 84 93 36 31
Men 48 53 32 30 Denmark
132 146 68 61
Women 23 20 0 0
Men 8 8 0 0 Estonia
31 28 0 0
Women 9 12 0 0
Men 6 5 0 0
15 17 0 0

SVEA EKONOMI AB 25 (63)
Annual Report, 2014
Number of employees, continued 31/12/2
014 31/12/2013 31/12/2014 31/12/2013
Latvia Women 1 2 0 0
Men 0 1 0 0
1 3 0 0
Switzerland Women 3 4 0 0
Men 4 5 0 0
7 9 0 0
Netherlands Women 8 8 0 0
Men 6 5 0 0
14 13 0 0
Ukraine Women 2 2 0 0
Men 4 1 0 0
6 3 0 0
Serbia Women 0 1 0 0
Men 0 0 0 0
0 1 0 0
Bulgaria Women 1 0 0 0
Men 0 0 0 0
1 0 0 0
Hungary Women 1 0 0 0
Men 0 0 0 0
1 0 0 0
Total 896 667 282 251
Number of Board members and company management
31/12/2014 31/12/2013 31/12/2014 31/12/2013 Board members
Women 0 0
Men 5 5
5 5
Of whom external members 3 3
Company management Women
2
0
0
0
Men 15 16 3 3
17 16 3 3
Group Parent Company
Remunerations to auditors 2014 2013 2014 2013
Grant Thornton Sweden AB
Audit assignment
2,998
1,362
1,829
643
Audit activities in addition to audit assignment 110 20 95 3
Tax advice 713 15 713 15
Other services 226 827 226 827
4,047 2,224 2,863 1,488
Other foreign auditors
Audit assignment
1,397
1,260
422
355
Audit activities in addition to audit assignment 487 257 280 81
Tax advice 78 0 0 0
Other services 0 0 0 0
1,962 1,517 702 436
Total 6,009 3,741 3,565 1,924
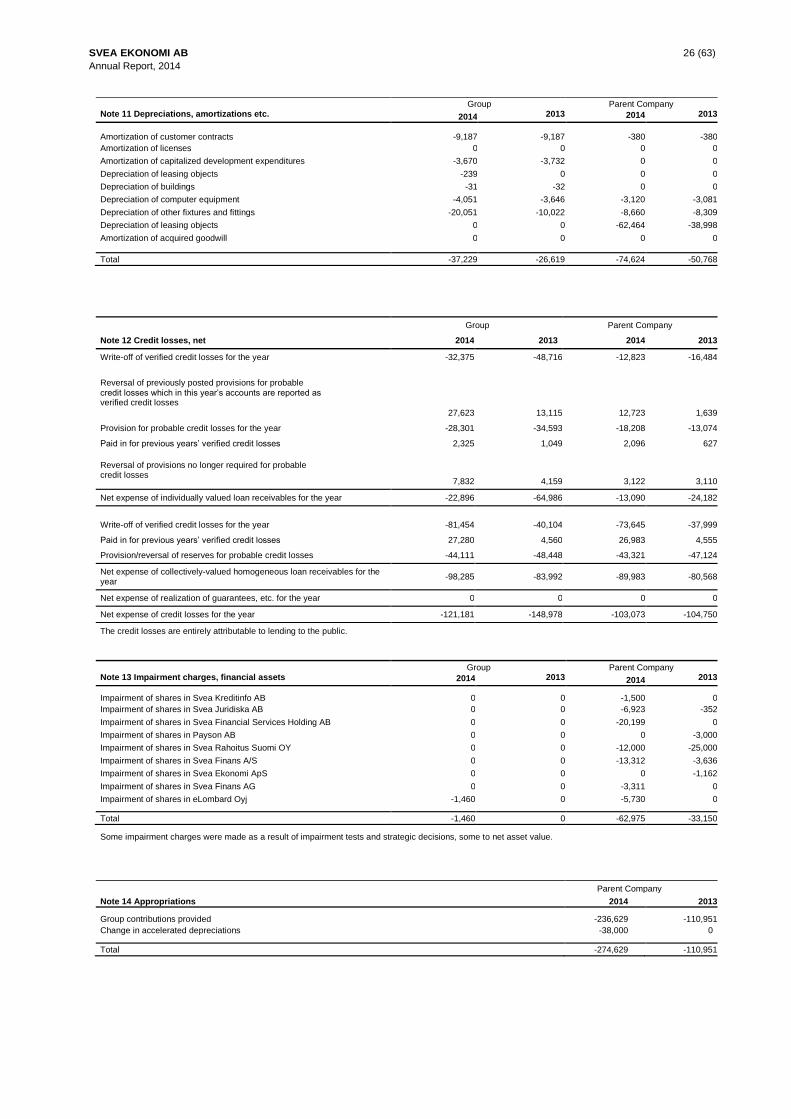
SVEA EKONOMI AB 26 (63)
Annual Report, 2014
Group Parent Company
Note 11 Depreciations, amortizations etc. 2014 2013 2014 2013
Amortization of customer contracts
-9,187
-9,187
-380
-380
Amortization of licenses 0 0 0 0
Amortization of capitalized development expenditures -3,670 -3,732 0 0
Depreciation of leasing objects -239 0 0 0
Depreciation of buildings -31 -32 0 0
Depreciation of computer equipment -4,051 -3,646 -3,120 -3,081
Depreciation of other fixtures and fittings -20,051 -10,022 -8,660 -8,309
Depreciation of leasing objects 0 0 -62,464 -38,998
Amortization of acquired goodwill 0 0 0 0
Total -37,229 -26,619 -74,624 -50,768
Group Parent Company
Note 12 Credit losses, net 2014 2013 2014 2013
Write-off of verified credit losses for the year -32,375 -48,716 -12,823 -16,484
Reversal of previously posted provisions for probable credit losses which in this year’s accounts are reported as verified credit losses
27,623
13,115
12,723
1,639
Provision for probable credit losses for the year -28,301 -34,593 -18,208 -13,074
Paid in for previous years’ verified credit losses 2,325 1,049 2,096 627
Reversal of provisions no longer required for probable credit losses
7,832
4,159
3,122
3,110
Net expense of individually valued loan receivables for the year -22,896 -64,986 -13,090 -24,182
Write-off of verified credit losses for the year
-81,454
-40,104
-73,645
-37,999
Paid in for previous years’ verified credit losses 27,280 4,560 26,983 4,555
Provision/reversal of reserves for probable credit losses -44,111 -48,448 -43,321 -47,124
Net expense of collectively-valued homogeneous loan receivables for the year
-98,285 -83,992 -89,983 -80,568
Net expense of realization of guarantees, etc. for the year 0 0 0 0
Net expense of credit losses for the year -121,181 -148,978 -103,073 -104,750
The credit losses are entirely attributable to lending to the public.
Group Parent Company
Note 13 Impairment charges, financial assets 2014 2013 2014 2013
Impairment of shares in Svea Kreditinfo AB 0 0 -1,500 0
Impairment of shares in Svea Juridiska AB 0 0 -6,923 -352
Impairment of shares in Svea Financial Services Holding AB 0 0 -20,199 0
Impairment of shares in Payson AB 0 0 0 -3,000
Impairment of shares in Svea Rahoitus Suomi OY 0 0 -12,000 -25,000
Impairment of shares in Svea Finans A/S 0 0 -13,312 -3,636
Impairment of shares in Svea Ekonomi ApS 0 0 0 -1,162
Impairment of shares in Svea Finans AG 0 0 -3,311 0
Impairment of shares in eLombard Oyj -1,460 0 -5,730 0
Total -1,460 0 -62,975 -33,150
Some impairment charges were made as a result of impairment tests and strategic decisions, some to net asset value.
Parent Company
Note 14 Appropriations 2014 2013
Group contributions provided -236,629 -110,951
Change in accelerated depreciations -38,000 0
Total -274,629 -110,951
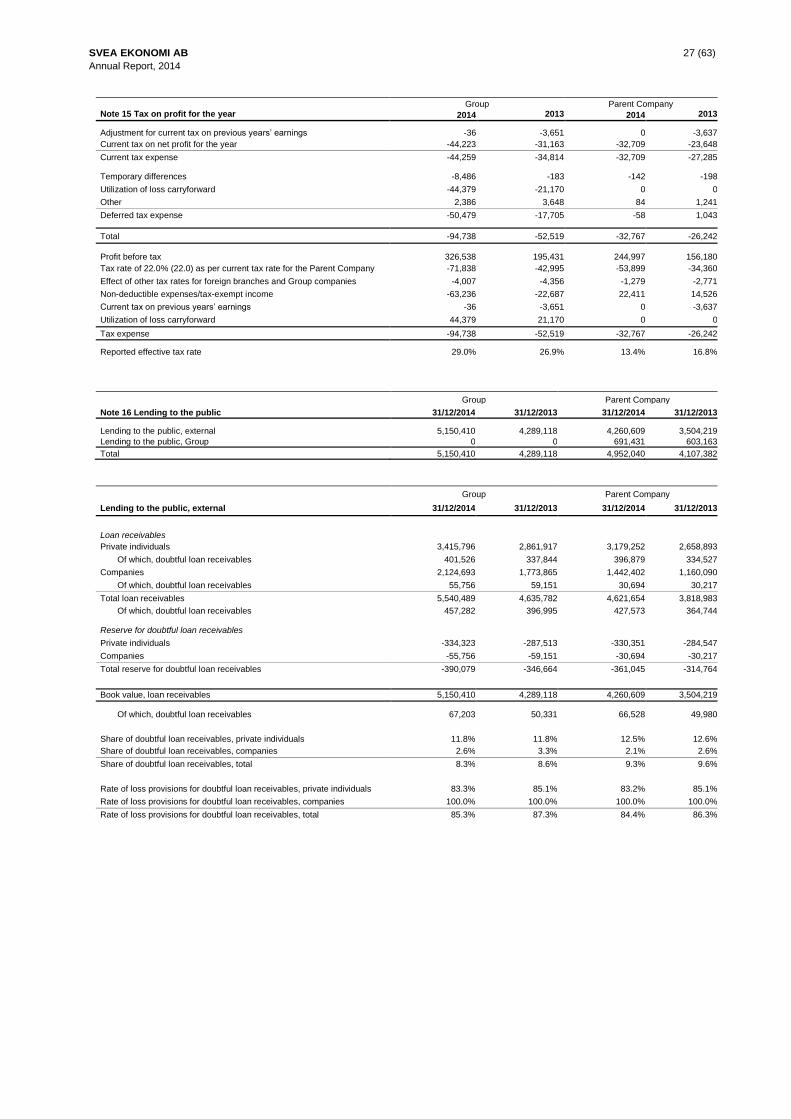
SVEA EKONOMI AB 27 (63)
Annual Report, 2014
Group Parent Company
Note 15 Tax on profit for the year 2014 2013 2014 2013
Adjustment for current tax on previous years’ earnings -36 -3,651 0 -3,637
Current tax on net profit for the year -44,223 -31,163 -32,709 -23,648
Current tax expense -44,259 -34,814 -32,709 -27,285
Temporary differences -8,486 -183 -142 -198
Utilization of loss carryforward -44,379 -21,170 0 0
Other 2,386 3,648 84 1,241
Deferred tax expense -50,479 -17,705 -58 1,043
Total -94,738 -52,519 -32,767 -26,242
Profit before tax
326,538
195,431
244,997
156,180
Tax rate of 22.0% (22.0) as per current tax rate for the Parent Company -71,838 -42,995 -53,899 -34,360
Effect of other tax rates for foreign branches and Group companies -4,007 -4,356 -1,279 -2,771
Non-deductible expenses/tax-exempt income -63,236 -22,687 22,411 14,526
Current tax on previous years’ earnings -36 -3,651 0 -3,637
Utilization of loss carryforward 44,379 21,170 0 0
Tax expense -94,738 -52,519 -32,767 -26,242
Reported effective tax rate 29.0% 26.9% 13.4% 16.8%
Group Parent Company
Note 16 Lending to the public 31/12/2014 31/12/2013 31/12/2014 31/12/2013
Lending to the public, external 5,150,410 4,289,118 4,260,609 3,504,219
Lending to the public, Group 0 0 691,431 603,163
Total 5,150,410 4,289,118 4,952,040 4,107,382
Group Parent Company
Lending to the public, external 31/12/2014 31/12/2013 31/12/2014 31/12/2013
Loan receivables
Private individuals 3,415,796 2,861,917 3,179,252 2,658,893
Of which, doubtful loan receivables 401,526 337,844 396,879 334,527
Companies 2,124,693 1,773,865 1,442,402 1,160,090
Of which, doubtful loan receivables 55,756 59,151 30,694 30,217
Total loan receivables 5,540,489 4,635,782 4,621,654 3,818,983
Of which, doubtful loan receivables 457,282 396,995 427,573 364,744
Reserve for doubtful loan receivables Private individuals -334,323 -287,513 -330,351 -284,547
Companies -55,756 -59,151 -30,694 -30,217
Total reserve for doubtful loan receivables -390,079 -346,664 -361,045 -314,764
Book value, loan receivables 5,150,410 4,289,118 4,260,609 3,504,219
Of which, doubtful loan receivables
67,203
50,331
66,528
49,980
Share of doubtful loan receivables, private individuals
11.8%
11.8%
12.5%
12.6%
Share of doubtful loan receivables, companies 2.6% 3.3% 2.1% 2.6%
Share of doubtful loan receivables, total 8.3% 8.6% 9.3% 9.6%
Rate of loss provisions for doubtful loan receivables, private individuals 83.3% 85.1% 83.2% 85.1%
Rate of loss provisions for doubtful loan receivables, companies 100.0% 100.0% 100.0% 100.0%
Rate of loss provisions for doubtful loan receivables, total 85.3% 87.3% 84.4% 86.3%
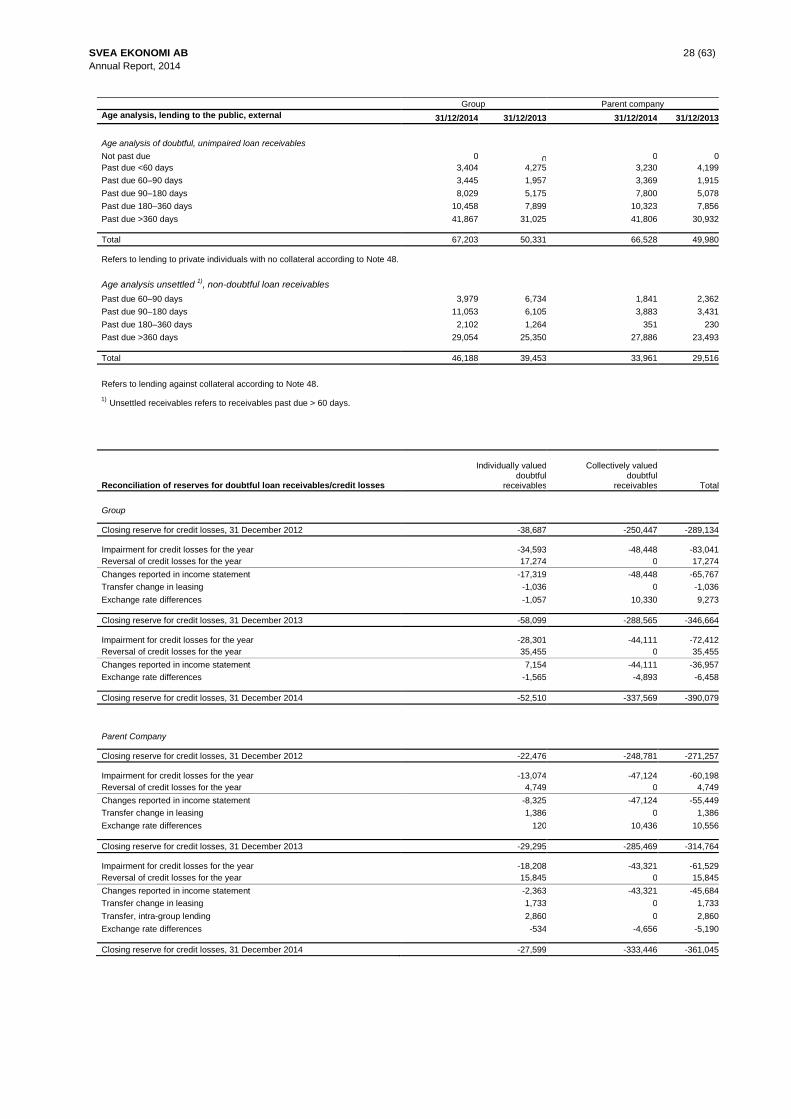
SVEA EKONOMI AB 28 (63)
Annual Report, 2014
Group Parent company
Age analysis, lending to the public, external 31/12/2014 31/12/2013 31/12/2014 31/12/2013 Age analysis of doubtful, unimpaired loan receivables
Not past due
0
0
0
0
Past due <60 days 3,404 4,275 3,230 4,199
Past due 60–90 days 3,445 1,957 3,369 1,915
Past due 90–180 days 8,029 5,175 7,800 5,078
Past due 180–360 days 10,458 7,899 10,323 7,856
Past due >360 days 41,867 31,025 41,806 30,932
Total 67,203 50,331 66,528 49,980
Refers to lending to private individuals with no collateral according to Note 48.
Age analysis unsettled 1)
, non-doubtful loan receivables Past due 60–90 days 3,979 6,734 1,841 2,362
Past due 90–180 days 11,053 6,105 3,883 3,431
Past due 180–360 days 2,102 1,264 351 230
Past due >360 days 29,054 25,350 27,886 23,493
Total 46,188 39,453 33,961 29,516 Refers to lending against collateral according to Note 48.
1) Unsettled receivables refers to receivables past due > 60 days.
Reconciliation of reserves for doubtful loan receivables/credit losses
Individually valued doubtful
receivables
Collectively valued doubtful
receivables
Total
Group
Closing reserve for credit losses, 31 December 2012 -38,687 -250,447 -289,134
Impairment for credit losses for the year
-34,593
-48,448
-83,041
Reversal of credit losses for the year 17,274 0 17,274
Changes reported in income statement -17,319 -48,448 -65,767
Transfer change in leasing -1,036 0 -1,036
Exchange rate differences -1,057 10,330 9,273
Closing reserve for credit losses, 31 December 2013 -58,099 -288,565 -346,664
Impairment for credit losses for the year
-28,301
-44,111
-72,412
Reversal of credit losses for the year 35,455 0 35,455
Changes reported in income statement 7,154 -44,111 -36,957
Exchange rate differences -1,565 -4,893 -6,458
Closing reserve for credit losses, 31 December 2014 -52,510 -337,569 -390,079
Parent Company
Closing reserve for credit losses, 31 December 2012 -22,476 -248,781 -271,257
Impairment for credit losses for the year
-13,074
-47,124
-60,198
Reversal of credit losses for the year 4,749 0 4,749
Changes reported in income statement -8,325 -47,124 -55,449
Transfer change in leasing 1,386 0 1,386
Exchange rate differences 120 10,436 10,556
Closing reserve for credit losses, 31 December 2013 -29,295 -285,469 -314,764
Impairment for credit losses for the year
-18,208
-43,321
-61,529
Reversal of credit losses for the year 15,845 0 15,845
Changes reported in income statement -2,363 -43,321 -45,684
Transfer change in leasing 1,733 0 1,733
Transfer, intra-group lending 2,860 0 2,860
Exchange rate differences -534 -4,656 -5,190
Closing reserve for credit losses, 31 December 2014 -27,599 -333,446 -361,045
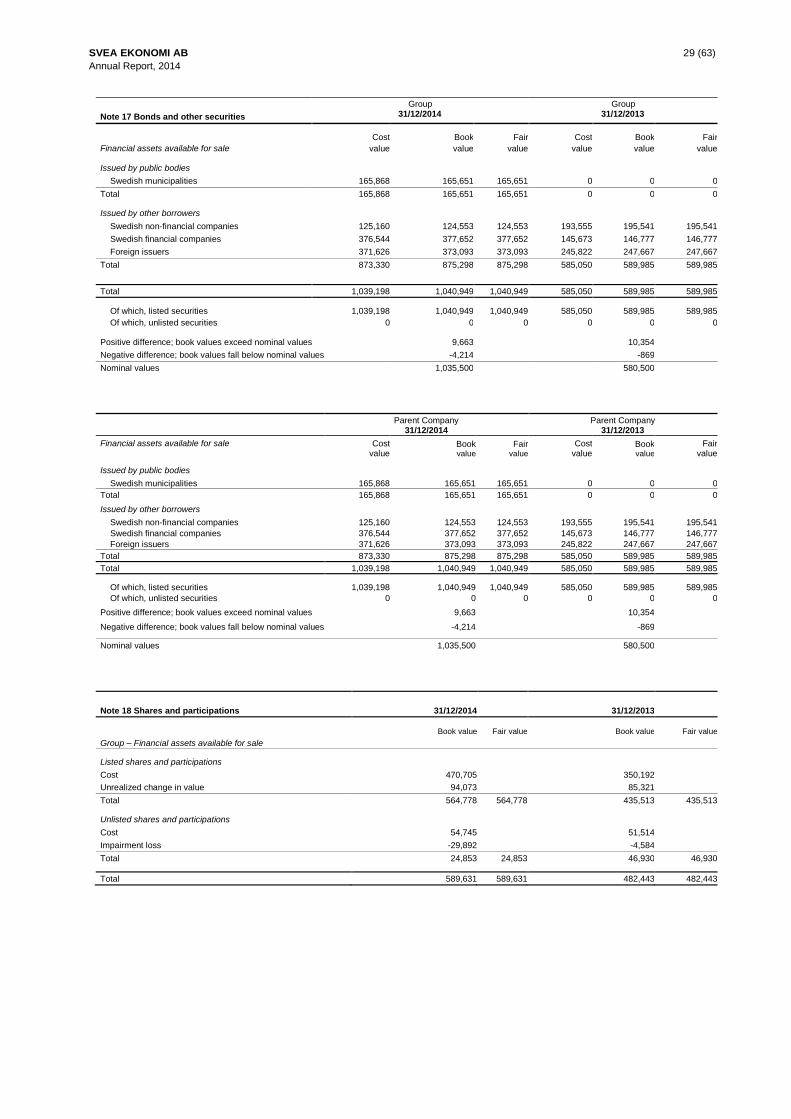
SVEA EKONOMI AB 29 (63)
Annual Report, 2014
Note 17 Bonds and other securities
Group 31/12/2014
Group 31/12/2013
Cost
Book
Fair
Cost
Book
Fair
Financial assets available for sale value value value value value value
Issued by public bodies
Swedish municipalities
165,868
165,651
165,651
0
0
0
Total 165,868 165,651 165,651 0 0 0
Issued by other borrowers
Swedish non-financial companies
125,160
124,553
124,553
193,555
195,541
195,541
Swedish financial companies 376,544 377,652 377,652 145,673 146,777 146,777
Foreign issuers 371,626 373,093 373,093 245,822 247,667 247,667
Total 873,330 875,298 875,298 585,050 589,985 589,985
Total 1,039,198 1,040,949 1,040,949 585,050 589,985 589,985
Of which, listed securities
1,039,198
1,040,949
1,040,949
585,050
589,985
589,985
Of which, unlisted securities 0 0 0 0 0 0
Positive difference; book values exceed nominal values 9,663 10,354 Negative difference; book values fall below nominal values -4,214 -869 Nominal values 1,035,500 580,500
Parent Company 31/12/2014
Parent Company 31/12/2013
Financial assets available for sale Cost value
Book value
Fair value
Cost value
Book value
Fair value
Issued by public bodies
Swedish municipalities
165,868
165,651
165,651
0
0
0
Total 165,868 165,651 165,651 0 0 0
Issued by other borrowers
Swedish non-financial companies
125,160
124,553
124,553
193,555
195,541
195,541
Swedish financial companies 376,544 377,652 377,652 145,673 146,777 146,777
Foreign issuers 371,626 373,093 373,093 245,822 247,667 247,667
Total 873,330 875,298 875,298 585,050 589,985 589,985
Total 1,039,198 1,040,949 1,040,949 585,050 589,985 589,985
Of which, listed securities
1,039,198
1,040,949
1,040,949
585,050
589,985
589,985
Of which, unlisted securities 0 0 0 0 0 0
Positive difference; book values exceed nominal values 9,663 10,354 Negative difference; book values fall below nominal values -4,214 -869 Nominal values 1,035,500 580,500
Note 18 Shares and participations
31/12/2014
31/12/2013
Group – Financial assets available for sale
Book value
Fair value
Book value
Fair value
Listed shares and participations
Cost
470,705
350,192
Unrealized change in value 94,073 85,321 Total 564,778 564,778 435,513 435,513
Unlisted shares and participations
Cost
54,745
51,514
Impairment loss -29,892 -4,584 Total 24,853 24,853 46,930 46,930
Total 589,631 589,631 482,443 482,443
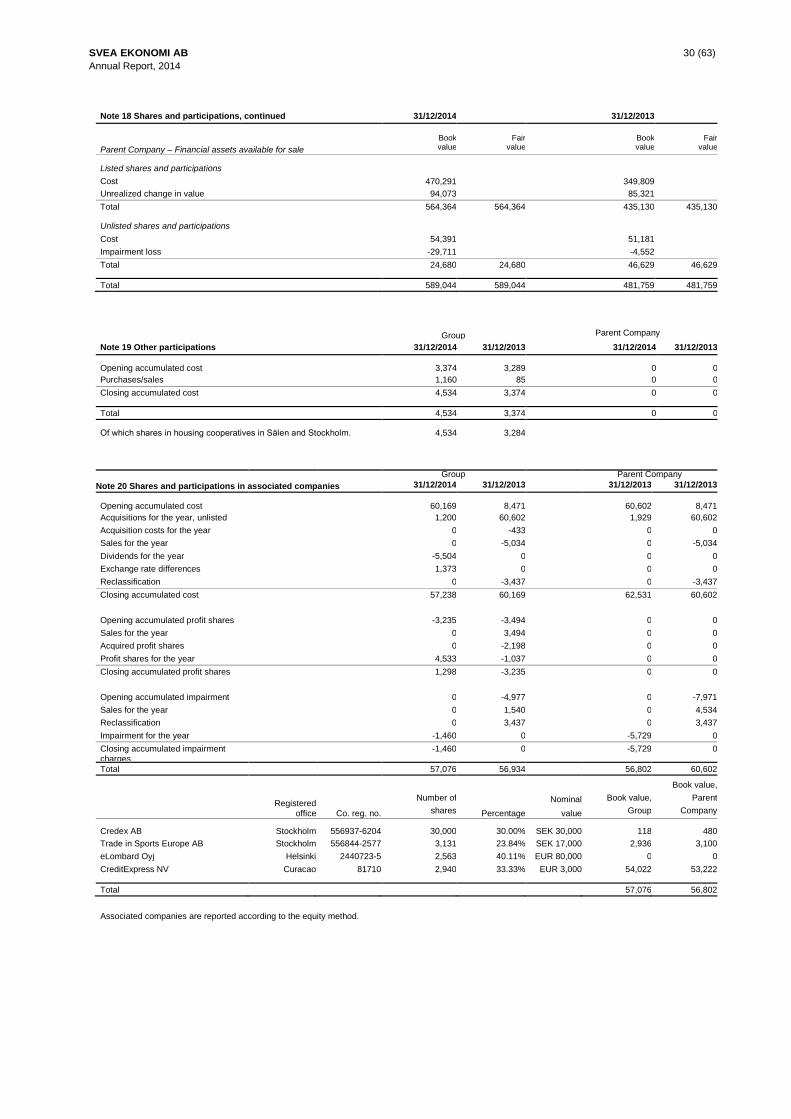
SVEA EKONOMI AB 30 (63)
Annual Report, 2014
Note 18 Shares and participations, continued 31/12/2014 31/12/2013
Parent Company – Financial assets available for sale
Book value
Fair
value
Book value
Fair
value
Listed shares and participations
Cost
470,291
349,809
Unrealized change in value 94,073 85,321 Total 564,364 564,364 435,130 435,130
Unlisted shares and participations
Cost
54,391
51,181
Impairment loss -29,711 -4,552 Total 24,680 24,680 46,629 46,629
Total 589,044 589,044 481,759 481,759
Group
Parent Company
Note 19 Other participations 31/12/2014 31/12/2013 31/12/2014 31/12/2013
Opening accumulated cost
3,374
3,289
0
0
Purchases/sales 1,160 85 0 0
Closing accumulated cost 4,534 3,374 0 0
Total 4,534 3,374 0 0
Of which shares in housing cooperatives in Sälen and Stockholm.
4,534
3,284
Group Parent Company
Note 20 Shares and participations in associated companies 31/12/2014 31/12/2013 31/12/2013 31/12/2013
Opening accumulated cost
60,169
8,471
60,602
8,471
Acquisitions for the year, unlisted 1,200 60,602 1,929 60,602
Acquisition costs for the year 0 -433 0 0
Sales for the year 0 -5,034 0 -5,034
Dividends for the year -5,504 0 0 0
Exchange rate differences 1,373 0 0 0
Reclassification 0 -3,437 0 -3,437
Closing accumulated cost 57,238 60,169 62,531 60,602
Opening accumulated profit shares
-3,235
-3,494
0
0
Sales for the year 0 3,494 0 0
Acquired profit shares 0 -2,198 0 0
Profit shares for the year 4,533 -1,037 0 0
Closing accumulated profit shares 1,298 -3,235 0 0
Opening accumulated impairment charges
0
-4,977
0
-7,971
Sales for the year 0 1,540 0 4,534
Reclassification 0 3,437 0 3,437
Impairment for the year -1,460 0 -5,729 0
Closing accumulated impairment charges
-1,460 0 -5,729 0
Total 57,076 56,934 56,802 60,602
Registered office
Co. reg. no.
Number of
shares
Percentage
Nominal
value
Book value,
Group
Book value,
Parent
Company
Credex AB
Stockholm
556937-6204
30,000
30.00%
SEK 30,000
118
480
Trade in Sports Europe AB Stockholm 556844-2577 3,131 23.84% SEK 17,000 2,936 3,100
eLombard Oyj Helsinki 2440723-5 2,563 40.11% EUR 80,000 0 0
CreditExpress NV Curacao 81710 2,940 33.33% EUR 3,000 54,022 53,222
Total 57,076 56,802
Associated companies are reported according to the equity method.
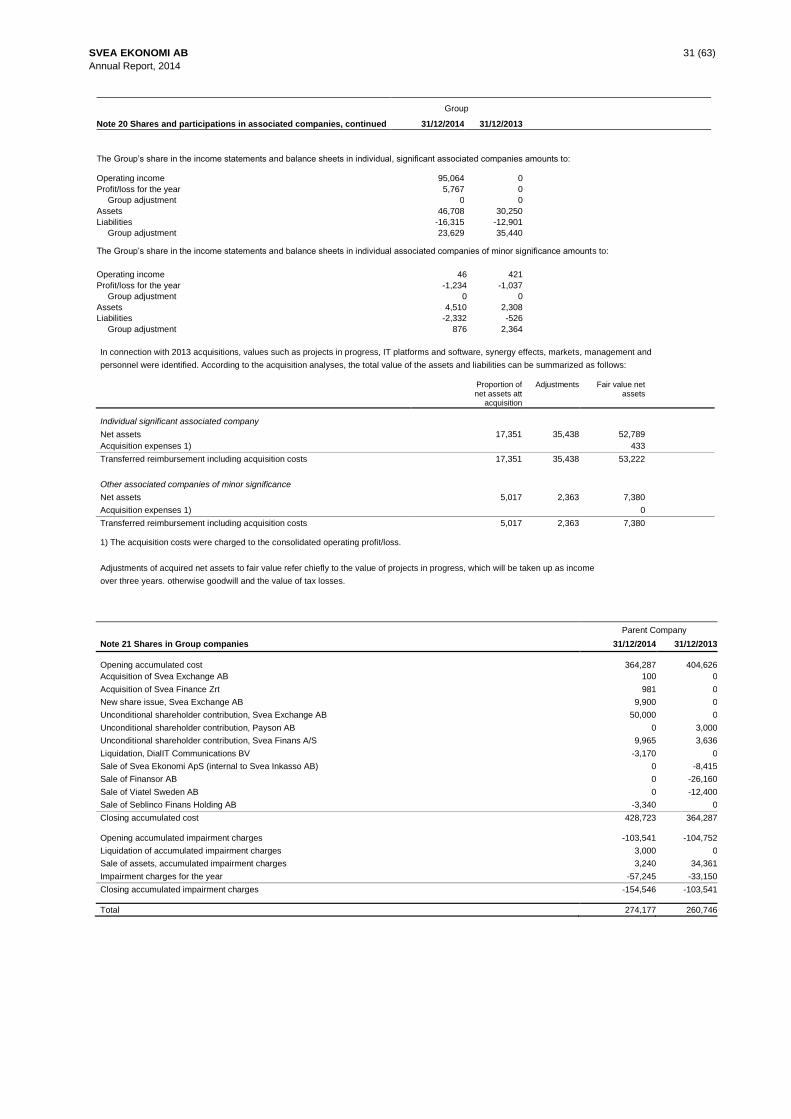
SVEA EKONOMI AB 31 (63)
Annual Report, 2014
Group
Note 20 Shares and participations in associated companies, continued 31/12/2014 31/12/2013
The Group’s share in the income statements and balance sheets in individual, significant associated companies amounts to:
Operating income 95,064 0
Profit/loss for the year 5,767 0
Group adjustment 0 0
Assets 46,708 30,250
Liabilities -16,315 -12,901
Group adjustment 23,629 35,440
The Group’s share in the income statements and balance sheets in individual associated companies of minor significance amounts to:
Operating income 46 421
Profit/loss for the year -1,234 -1,037
Group adjustment 0 0
Assets 4,510 2,308
Liabilities -2,332 -526
Group adjustment 876 2,364
In connection with 2013 acquisitions, values such as projects in progress, IT platforms and software, synergy effects, markets, management and
personnel were identified. According to the acquisition analyses, the total value of the assets and liabilities can be summarized as follows:
Proportion of net assets att
acquisition
Adjustments Fair value net assets
Individual significant associated company
Net assets
17,351
35,438
52,789
Acquisition expenses 1) 433
Transferred reimbursement including acquisition costs 17,351 35,438 53,222
Other associated companies of minor significance
Net assets
5,017
2,363
7,380
Acquisition expenses 1) 0
Transferred reimbursement including acquisition costs 5,017 2,363 7,380
1) The acquisition costs were charged to the consolidated operating profit/loss.
Adjustments of acquired net assets to fair value refer chiefly to the value of projects in progress, which will be taken up as income
over three years. otherwise goodwill and the value of tax losses.
Parent Company
Note 21 Shares in Group companies 31/12/2014 31/12/2013
Opening accumulated cost
364,287
404,626
Acquisition of Svea Exchange AB 100 0
Acquisition of Svea Finance Zrt 981 0
New share issue, Svea Exchange AB 9,900 0
Unconditional shareholder contribution, Svea Exchange AB 50,000 0
Unconditional shareholder contribution, Payson AB 0 3,000
Unconditional shareholder contribution, Svea Finans A/S 9,965 3,636
Liquidation, DialIT Communications BV -3,170 0
Sale of Svea Ekonomi ApS (internal to Svea Inkasso AB) 0 -8,415
Sale of Finansor AB 0 -26,160
Sale of Viatel Sweden AB 0 -12,400
Sale of Seblinco Finans Holding AB -3,340 0
Closing accumulated cost 428,723 364,287
Opening accumulated impairment charges -103,541 -104,752
Liquidation of accumulated impairment charges 3,000 0
Sale of assets, accumulated impairment charges 3,240 34,361
Impairment charges for the year -57,245 -33,150
Closing accumulated impairment charges -154,546 -103,541
Total 274,177 260,746
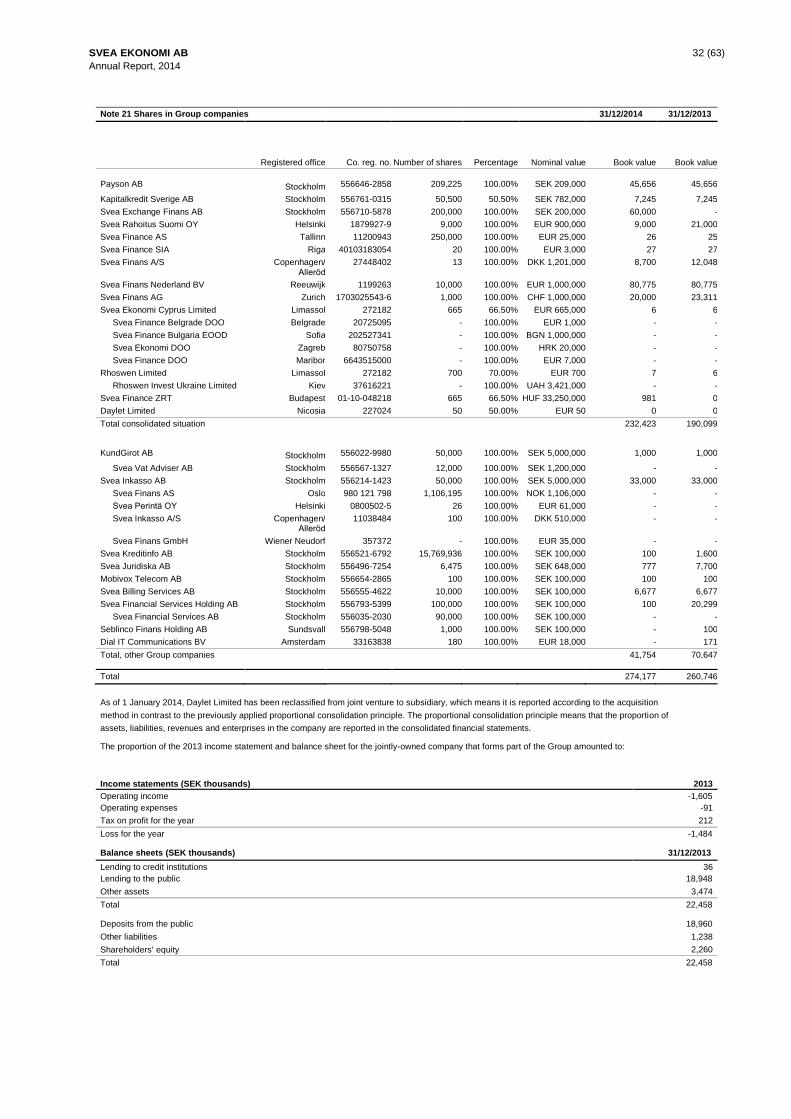
SVEA EKONOMI AB 32 (63)
Annual Report, 2014
Note 21 Shares in Group companies 31/12/2014 31/12/2013
Registered office
Co. reg. no.
Number of shares
Percentage
Nominal value
Book value
Book value
Payson AB
Stockholm
556646-2858
209,225
100.00%
SEK 209,000
45,656
45,656
Kapitalkredit Sverige AB Stockholm 556761-0315 50,500 50.50% SEK 782,000 7,245 7,245
Svea Exchange Finans AB Stockholm 556710-5878 200,000 100.00% SEK 200,000 60,000 -
Svea Rahoitus Suomi OY Helsinki 1879927-9 9,000 100.00% EUR 900,000 9,000 21,000
Svea Finance AS Tallinn 11200943 250,000 100.00% EUR 25,000 26 25
Svea Finance SIA Riga 40103183054 20 100.00% EUR 3,000 27 27
Svea Finans A/S Copenhagen/ Alleröd
27448402 13 100.00% DKK 1,201,000 8,700 12,048
Svea Finans Nederland BV Reeuwijk 1199263 10,000 100.00% EUR 1,000,000 80,775 80,775
Svea Finans AG Zurich 1703025543-6 1,000 100.00% CHF 1,000,000 20,000 23,311
Svea Ekonomi Cyprus Limited Limassol 272182 665 66.50% EUR 665,000 6 6
Svea Finance Belgrade DOO Belgrade 20725095 - 100.00% EUR 1,000 - -
Svea Finance Bulgaria EOOD Sofia 202527341 - 100.00% BGN 1,000,000 - -
Svea Ekonomi DOO Zagreb 80750758 - 100.00% HRK 20,000 - -
Svea Finance DOO Maribor 6643515000 - 100.00% EUR 7,000 - -
Rhoswen Limited Limassol 272182 700 70.00% EUR 700 7 6
Rhoswen Invest Ukraine Limited Kiev 37616221 - 100.00% UAH 3,421,000 - -
Svea Finance ZRT Budapest 01-10-048218 665 66.50% HUF 33,250,000 981 0
Daylet Limited Nicosia 227024 50 50.00% EUR 50 0 0
Total consolidated situation 232,423 190,099
KundGirot AB
Stockholm
556022-9980
50,000
100.00%
SEK 5,000,000
1,000
1,000
Svea Vat Adviser AB Stockholm 556567-1327 12,000 100.00% SEK 1,200,000 - -
Svea Inkasso AB Stockholm 556214-1423 50,000 100.00% SEK 5,000,000 33,000 33,000
Svea Finans AS Oslo 980 121 798 1,106,195 100.00% NOK 1,106,000 - -
Svea Perintä OY Helsinki 0800502-5 26 100.00% EUR 61,000 - -
Svea Inkasso A/S Copenhagen/ Alleröd
11038484 100 100.00% DKK 510,000 - -
Svea Finans GmbH Wiener Neudorf 357372 - 100.00% EUR 35,000 - -
Svea Kreditinfo AB Stockholm 556521-6792 15,769,936 100.00% SEK 100,000 100 1,600
Svea Juridiska AB Stockholm 556496-7254 6,475 100.00% SEK 648,000 777 7,700
Mobivox Telecom AB Stockholm 556654-2865 100 100.00% SEK 100,000 100 100
Svea Billing Services AB Stockholm 556555-4622 10,000 100.00% SEK 100,000 6,677 6,677
Svea Financial Services Holding AB Stockholm 556793-5399 100,000 100.00% SEK 100,000 100 20,299
Svea Financial Services AB Stockholm 556035-2030 90,000 100.00% SEK 100,000 - -
Seblinco Finans Holding AB Sundsvall 556798-5048 1,000 100.00% SEK 100,000 - 100
Dial IT Communications BV Amsterdam 33163838 180 100.00% EUR 18,000 - 171
Total, other Group companies 41,754 70,647
Total 274,177 260,746
As of 1 January 2014, Daylet Limited has been reclassified from joint venture to subsidiary, which means it is reported according to the acquisition
method in contrast to the previously applied proportional consolidation principle. The proportional consolidation principle means that the proportion of
assets, liabilities, revenues and enterprises in the company are reported in the consolidated financial statements. The proportion of the 2013 income statement and balance sheet for the jointly-owned company that forms part of the Group amounted to:
Income statements (SEK thousands) 2013
Operating income -1,605
Operating expenses -91
Tax on profit for the year 212
Loss for the year -1,484
Balance sheets (SEK thousands) 31/12/2013
Lending to credit institutions 36
Lending to the public 18,948
Other assets 3,474
Total 22,458
Deposits from the public 18,960
Other liabilities 1,238
Shareholders’ equity 2,260
Total 22,458

SVEA EKONOMI AB 33 (63)
Annual Report, 2014
Group Parent company
Note 22 Intangible assets 31/12/2014
31/12/2013 31/12/2014 31/12/2013
Goodwill
Opening accumulated cost 99,877 99,877 0 0
Acquisition 24,676 0 0 0
Sales/retirements -1,631 0 0 0
Closing accumulated cost
122,922
99,877
0
0
Opening accumulated impairment charges -1,721 -1,721 0 0
Sales/retirements 1,631 0 0 0
Closing accumulated impairment charges
-90
-1,721
0
0
Closing residual value according to plan 122,832 98,156 0 0
Customer contracts
Opening accumulated cost 204,162 206,380 36,750 38,435
Sales/retirements -99,054 -785 -27,708 0
Exchange rate differences 0 -1,433 437 -1,685
Closing accumulated cost
105,108
204,162
9,479
36,750
Opening accumulated depreciations -172,634 -165,664 -35,484 -36,789
Sales/retirements 99,054 785 27,708 0
Exchange rate differences 0 1,432 -437 1,685
Depreciations for the year -9,187 -9,187 -380 -380
Closing accumulated depreciations
-82,767
-172,634
-8,593
-35,484
Closing residual value according to plan 22,341 31,528 886 1,266
Licenses
Opening accumulated cost 3,000 3,000 3,000 3,000
Closing accumulated cost
3,000
3,000
3,000
3,000
Opening accumulated depreciations -3,000 -3,000 -3,000 -3,000
Closing accumulated depreciations
-3,000
-3,000
-3,000
-3,000
Closing residual value according to plan 0 0 0 0
Capitalized development expenditures, etc.
Opening accumulated cost 19,115 18,562 0 0
Acquisition 4,061 1,121 0 0
Exchange rate differences 269 -568 0 0
Sales/retirements -1,723 0 0 0
Closing accumulated cost
21,722
19,115
0
0
Opening accumulated depreciations -8,858 -5,346 0 0
Sales/retirements 1,723 0 0 0
Exchange rate differences 4 220 0 0
Depreciations for the year -3,671 -3,732 0 0
Closing accumulated depreciations
-10,802
-8,858
0
0
Closing residual value according to plan 10,920 10,257 0 0
Leasing objects
Opening accumulated cost 0 0 0 0
Acquisition 4,013 0 0 0
Closing accumulated cost
4,013
0
0
0
Opening accumulated depreciations 0 0 0 0
Acquisitions/ sale/ retirements -3,642 0 0 0
Depreciations for the year -239 0 0 0
Closing accumulated depreciations
-3,881
0
0
0
Closing residual value according to plan 132 0 0 0
Total 156,225 139,941 886 1,266
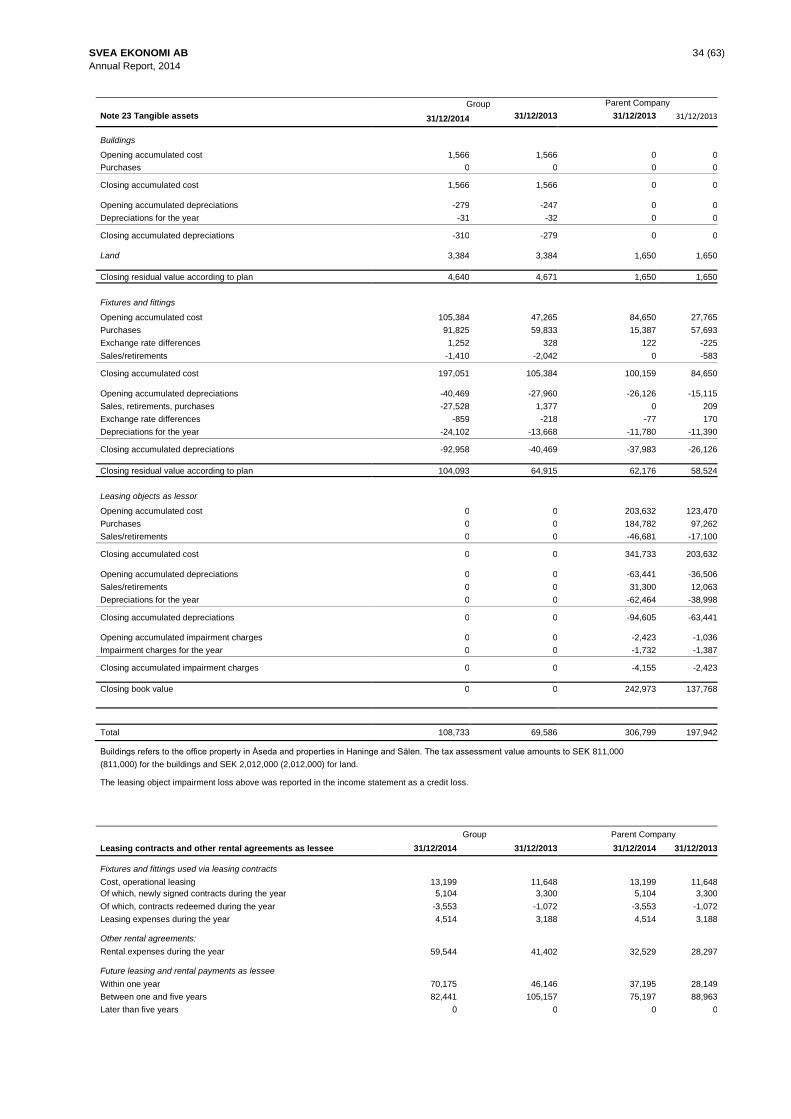
SVEA EKONOMI AB 34 (63)
Annual Report, 2014
Group Parent Company
Note 23 Tangible assets 31/12/2014 31/12/2013 31/12/2013 31/12/2013
Buildings
Opening accumulated cost 1,566 1,566 0 0
Purchases 0 0 0 0
Closing accumulated cost 1,566 1,566 0 0
Opening accumulated depreciations -279 -247 0 0
Depreciations for the year -31 -32 0 0
Closing accumulated depreciations -310 -279 0 0
Land 3,384 3,384 1,650 1,650
Closing residual value according to plan 4,640 4,671 1,650 1,650 Fixtures and fittings
Opening accumulated cost 105,384 47,265 84,650 27,765
Purchases 91,825 59,833 15,387 57,693
Exchange rate differences 1,252 328 122 -225
Sales/retirements -1,410 -2,042 0 -583
Closing accumulated cost 197,051 105,384 100,159 84,650
Opening accumulated depreciations -40,469 -27,960 -26,126 -15,115
Sales, retirements, purchases -27,528 1,377 0 209
Exchange rate differences -859 -218 -77 170
Depreciations for the year -24,102 -13,668 -11,780 -11,390
Closing accumulated depreciations -92,958 -40,469 -37,983 -26,126
Closing residual value according to plan 104,093 64,915 62,176 58,524 Leasing objects as lessor
Opening accumulated cost 0 0 203,632 123,470
Purchases 0 0 184,782 97,262
Sales/retirements 0 0 -46,681 -17,100
Closing accumulated cost 0 0 341,733 203,632
Opening accumulated depreciations 0 0 -63,441 -36,506
Sales/retirements 0 0 31,300 12,063
Depreciations for the year 0 0 -62,464 -38,998
Closing accumulated depreciations 0 0 -94,605 -63,441
Opening accumulated impairment charges 0 0 -2,423 -1,036
Impairment charges for the year 0 0 -1,732 -1,387
Closing accumulated impairment charges 0 0 -4,155 -2,423
Closing book value 0 0 242,973 137,768
Total 108,733 69,586 306,799 197,942
Buildings refers to the office property in Åseda and properties in Haninge and Sälen. The tax assessment value amounts to SEK 811,000
(811,000) for the buildings and SEK 2,012,000 (2,012,000) for land.
The leasing object impairment loss above was reported in the income statement as a credit loss.
Group Parent Company
Leasing contracts and other rental agreements as lessee 31/12/2014 31/12/2013 31/12/2014 31/12/2013
Fixtures and fittings used via leasing contracts
Cost, operational leasing
13,199
11,648
13,199
11,648
Of which, newly signed contracts during the year 5,104 3,300 5,104 3,300
Of which, contracts redeemed during the year -3,553 -1,072 -3,553 -1,072
Leasing expenses during the year 4,514 3,188 4,514 3,188
Other rental agreements:
Rental expenses during the year
59,544
41,402
32,529
28,297
Future leasing and rental payments as lessee
Within one year
70,175
46,146
37,195
28,149
Between one and five years 82,441 105,157 75,197 88,963
Later than five years 0 0 0 0
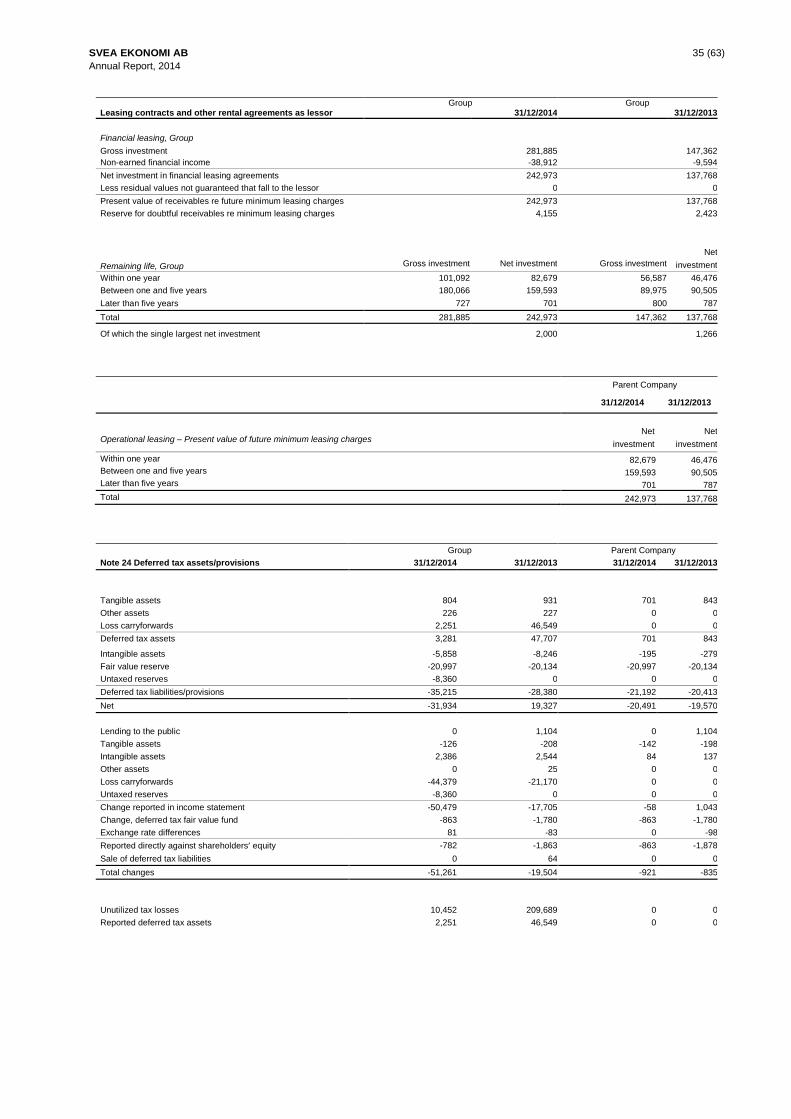
SVEA EKONOMI AB 35 (63)
Annual Report, 2014
Group Group
Leasing contracts and other rental agreements as lessor 31/12/2014 31/12/2013
Financial leasing, Group
Gross investment
281,885
147,362
Non-earned financial income -38,912 -9,594
Net investment in financial leasing agreements 242,973 137,768
Less residual values not guaranteed that fall to the lessor 0 0
Present value of receivables re future minimum leasing charges 242,973 137,768
Reserve for doubtful receivables re minimum leasing charges 4,155 2,423
Remaining life, Group
Gross investment
Net investment
Gross investment
Net
investment
Within one year 101,092 82,679 56,587 46,476
Between one and five years 180,066 159,593 89,975 90,505
Later than five years 727 701 800 787
Total 281,885 242,973 147,362 137,768
Of which the single largest net investment 2,000 1,266
Parent Company
31/12/2014 31/12/2013
Operational leasing – Present value of future minimum leasing charges
Net
investment
Net
investment
Within one year 82,679 46,476
Between one and five years 159,593 90,505
Later than five years 701 787
Total 242,973 137,768
Group Parent Company
Note 24 Deferred tax assets/provisions 31/12/2014 31/12/2013 31/12/2014 31/12/2013
Tangible assets
804
931
701
843
Other assets 226 227 0 0
Loss carryforwards 2,251 46,549 0 0
Deferred tax assets 3,281 47,707 701 843
Intangible assets -5,858 -8,246 -195 -279
Fair value reserve -20,997 -20,134 -20,997 -20,134
Untaxed reserves -8,360 0 0 0
Deferred tax liabilities/provisions -35,215 -28,380 -21,192 -20,413
Net -31,934 19,327 -20,491 -19,570
Lending to the public
0
1,104
0
1,104
Tangible assets -126 -208 -142 -198
Intangible assets 2,386 2,544 84 137
Other assets 0 25 0 0
Loss carryforwards -44,379 -21,170 0 0
Untaxed reserves -8,360 0 0 0
Change reported in income statement -50,479 -17,705 -58 1,043
Change, deferred tax fair value fund -863 -1,780 -863 -1,780
Exchange rate differences 81 -83 0 -98
Reported directly against shareholders’ equity -782 -1,863 -863 -1,878
Sale of deferred tax liabilities 0 64 0 0
Total changes -51,261 -19,504 -921 -835
Unutilized tax losses
10,452
209,689
0
0
Reported deferred tax assets 2,251 46,549 0 0
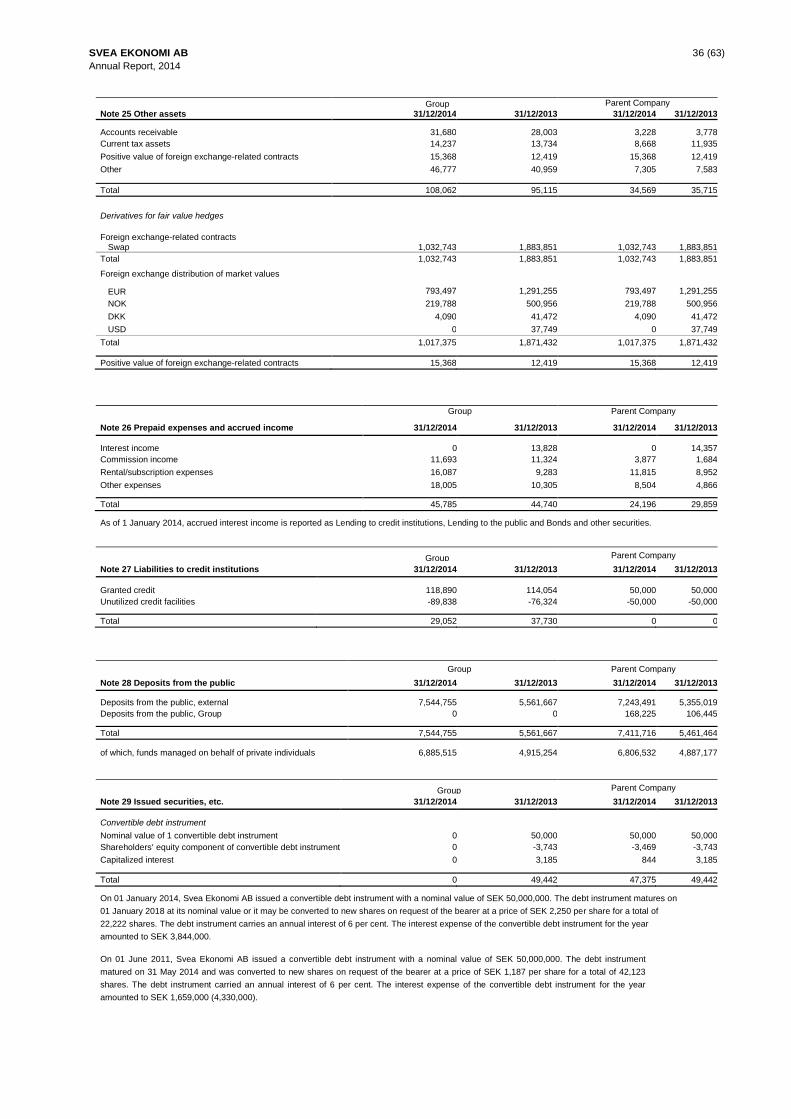
SVEA EKONOMI AB 36 (63)
Annual Report, 2014
Group Parent Company
Note 25 Other assets 31/12/2014 31/12/2013 31/12/2014 31/12/2013
Accounts receivable 31,680 28,003 3,228 3,778
Current tax assets 14,237 13,734 8,668 11,935
Positive value of foreign exchange-related contracts 15,368 12,419 15,368 12,419
Other 46,777 40,959 7,305 7,583
Total 108,062 95,115 34,569 35,715
Derivatives for fair value hedges
Foreign exchange-related contracts Swap
1,032,743
1,883,851
1,032,743
1,883,851
Total 1,032,743 1,883,851 1,032,743 1,883,851
Foreign exchange distribution of market values
EUR
793,497
1,291,255
793,497
1,291,255
NOK 219,788 500,956 219,788 500,956
DKK 4,090 41,472 4,090 41,472
USD 0 37,749 0 37,749
Total 1,017,375 1,871,432 1,017,375 1,871,432
Positive value of foreign exchange-related contracts 15,368 12,419 15,368 12,419
Group
Parent Company
Note 26 Prepaid expenses and accrued income 31/12/2014 31/12/2013 31/12/2014 31/12/2013
Interest income 0 13,828 0 14,357
Commission income 11,693 11,324 3,877 1,684
Rental/subscription expenses 16,087 9,283 11,815 8,952
Other expenses 18,005 10,305 8,504 4,866
Total 45,785 44,740 24,196 29,859
As of 1 January 2014, accrued interest income is reported as Lending to credit institutions, Lending to the public and Bonds and other securities.
Group
Parent Company
Note 27 Liabilities to credit institutions 31/12/2014 31/12/2013 31/12/2014 31/12/2013
Granted credit
118,890
114,054
50,000
50,000
Unutilized credit facilities -89,838 -76,324 -50,000 -50,000
Total 29,052 37,730 0 0
Group Parent Company
Note 28 Deposits from the public 31/12/2014 31/12/2013 31/12/2014 31/12/2013
Deposits from the public, external 7,544,755 5,561,667 7,243,491 5,355,019
Deposits from the public, Group 0 0 168,225 106,445
Total 7,544,755 5,561,667 7,411,716 5,461,464
of which, funds managed on behalf of private individuals
6,885,515
4,915,254
6,806,532
4,887,177
Group
Parent Company
Note 29 Issued securities, etc. 31/12/2014 31/12/2013 31/12/2014 31/12/2013
Convertible debt instrument
Nominal value of 1 convertible debt instrument
0
50,000
50,000
50,000
Shareholders’ equity component of convertible debt instrument 0 -3,743 -3,469 -3,743
Capitalized interest 0 3,185 844 3,185
Total 0 49,442 47,375 49,442
On 01 January 2014, Svea Ekonomi AB issued a convertible debt instrument with a nominal value of SEK 50,000,000. The debt instrument matures on
01 January 2018 at its nominal value or it may be converted to new shares on request of the bearer at a price of SEK 2,250 per share for a total of
22,222 shares. The debt instrument carries an annual interest of 6 per cent. The interest expense of the convertible debt instrument for the year
amounted to SEK 3,844,000.
On 01 June 2011, Svea Ekonomi AB issued a convertible debt instrument with a nominal value of SEK 50,000,000. The debt instrument
matured on 31 May 2014 and was converted to new shares on request of the bearer at a price of SEK 1,187 per share for a total of 42,123
shares. The debt instrument carried an annual interest of 6 per cent. The interest expense of the convertible debt instrument for the year
amounted to SEK 1,659,000 (4,330,000).

SVEA EKONOMI AB 37 (63)
Annual Report, 2014
Group Parent Company
Note 30 Other liabilities 31/12/2014 31/12/2013 31/12/2013 31/12/2013
Accounts payable
72,282
52,002
38,447
30,456
Tax liability 23,351 21,889 15,656 18,304
Negative value of foreign exchange-related contracts 22,592 4,243 22,592 4,243
Other 93,069 72,855 57,725 46,226
Total 211,294 150,989 134,420 99,229 Derivatives for fair value hedges
Foreign exchange-related contracts
swap
1,269,770
195,496
1,269,770
195,496
Total 1,269,770 195,496 1,269,770 195,496
Foreign exchange distribution of market values
EUR
899,850
161,602
899,850
161,602
NOK 263,430 0 263,430 0
DKK 66,588 25,771 66,588 25,771
USD 62,494 12,366 62,494 12,366
Total 1,292,362 199,739 1,292,362 199,739
Negative value of foreign exchange-related contracts 22,592 4,243 22,592 4,243
Group Parent Company
Note 31 Accrued expenses and deferred income 31/12/2014 31/12/2013 31/12/2014 31/12/2013
Interest income
3,041
2,242
2,833
2,132
Leasing income 16,218 8,297 16,218 8,297
Interest expenses 0 7,989 0 6,805
Commission income 2,368 3,935 2,368 3,884
Commission expenses 2,367 2,127 2,367 2,127
Personnel expenses 65,655 50,437 38,781 35,275
Other expenses 55,636 43,105 12,230 8,066
Total 145,285 118,132 74,797 66,586
As of 1 January 2014, accrued interest expenses are reported as Liabilities to credit institutions, Deposits from the public, Issued securities, etc. and
Subordinated liabilities.
Group Parent Company
Note 32 Subordinated liabilities 31/12/2014 31/12/2013 31/12/2014 31/12/2013
Subordinated loan, rate of interest 6%
75,000
0
75,000
0
Total 75,000 0 75,000 0
The subordinated loan in the amount of SEK 75,000,000 runs for 6 years and matures in full on 30 June 2020. The expense for the subordinated loan for the year amounted to SEK 2,250,000.
Parent Company
Note 33 Untaxed reserves 31/12/2014 31/12/2013
Accelerated depreciations 38,000 0
Total 38,000 0
Group Parent Company
Note 34 Assets pledged for own liabilities 31/12/2014 31/12/2013 31/12/2014 31/12/2013
For guarantees provided by banks
Lending to credit institutions – portion of
10,087
1,558
9,477
1,058
For liabilities to credit institutions
Lending to the public
196,463
199,371
0
0
Other assets 11 0 11 0
For deposits from the public
Deposits from the public
12,061
0
12,061
0
Total 218,622 200,929 21,549 1,058
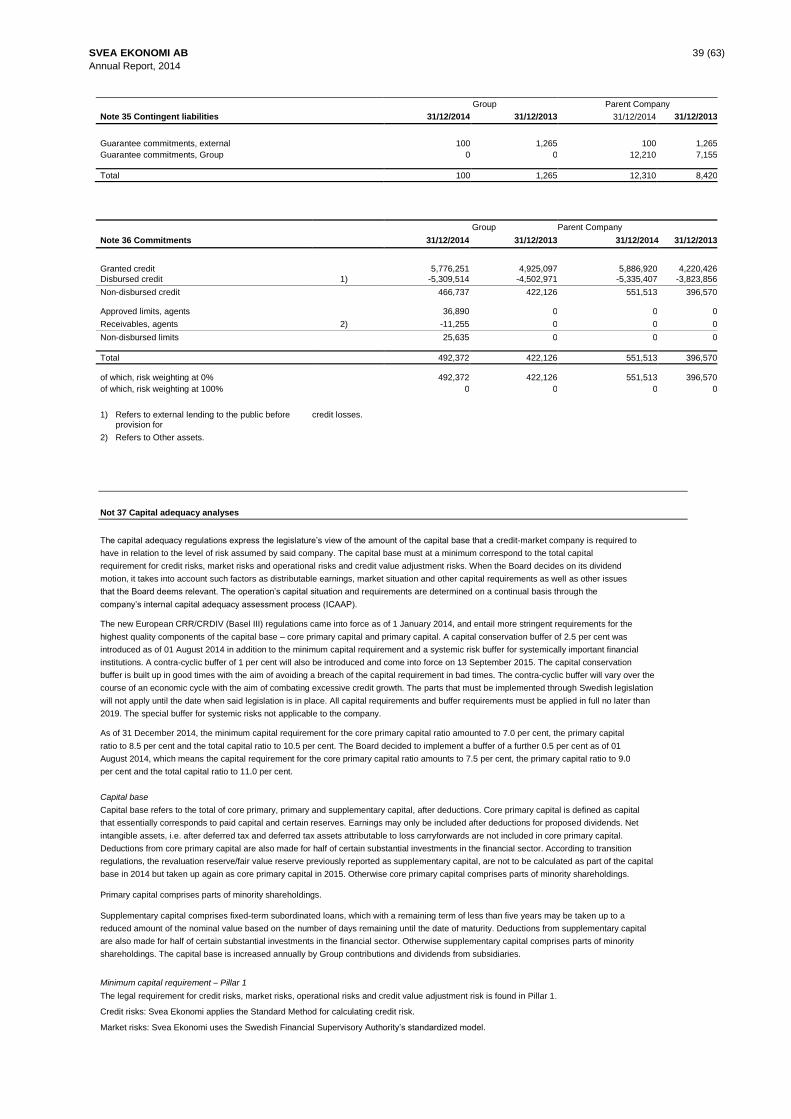
SVEA EKONOMI AB 39 (63)
Annual Report, 2014
Group Parent Company
Note 35 Contingent liabilities 31/12/2014 31/12/2013 31/12/2014 31/12/2013 Guarantee commitments, external
100
1,265
100
1,265
Guarantee commitments, Group 0 0 12,210 7,155
Total 100 1,265 12,310 8,420
Group Parent Company
Note 36 Commitments 31/12/2014 31/12/2013 31/12/2014 31/12/2013
Granted credit
5,776,251
4,925,097
5,886,920
4,220,426
Disbursed credit 1) -5,309,514 -4,502,971 -5,335,407 -3,823,856
Non-disbursed credit 466,737 422,126 551,513 396,570
Approved limits, agents 36,890 0 0 0
Receivables, agents 2) -11,255 0 0 0
Non-disbursed limits 25,635 0 0 0
Total 492,372 422,126 551,513 396,570
of which, risk weighting at 0%
492,372
422,126
551,513
396,570
of which, risk weighting at 100% 0 0 0 0
1) Refers to external lending to the public before provision for
2) Refers to Other assets.
credit losses.
Not 37 Capital adequacy analyses
The capital adequacy regulations express the legislature’s view of the amount of the capital base that a credit-market company is required to
have in relation to the level of risk assumed by said company. The capital base must at a minimum correspond to the total capital
requirement for credit risks, market risks and operational risks and credit value adjustment risks. When the Board decides on its dividend
motion, it takes into account such factors as distributable earnings, market situation and other capital requirements as well as other issues
that the Board deems relevant. The operation’s capital situation and requirements are determined on a continual basis through the
company’s internal capital adequacy assessment process (ICAAP).
The new European CRR/CRDIV (Basel III) regulations came into force as of 1 January 2014, and entail more stringent requirements for the
highest quality components of the capital base – core primary capital and primary capital. A capital conservation buffer of 2.5 per cent was
introduced as of 01 August 2014 in addition to the minimum capital requirement and a systemic risk buffer for systemically important financial
institutions. A contra-cyclic buffer of 1 per cent will also be introduced and come into force on 13 September 2015. The capital conservation
buffer is built up in good times with the aim of avoiding a breach of the capital requirement in bad times. The contra-cyclic buffer will vary over the
course of an economic cycle with the aim of combating excessive credit growth. The parts that must be implemented through Swedish legislation
will not apply until the date when said legislation is in place. All capital requirements and buffer requirements must be applied in full no later than
2019. The special buffer for systemic risks not applicable to the company.
As of 31 December 2014, the minimum capital requirement for the core primary capital ratio amounted to 7.0 per cent, the primary capital
ratio to 8.5 per cent and the total capital ratio to 10.5 per cent. The Board decided to implement a buffer of a further 0.5 per cent as of 01
August 2014, which means the capital requirement for the core primary capital ratio amounts to 7.5 per cent, the primary capital ratio to 9.0
per cent and the total capital ratio to 11.0 per cent.
Capital base
Capital base refers to the total of core primary, primary and supplementary capital, after deductions. Core primary capital is defined as capital
that essentially corresponds to paid capital and certain reserves. Earnings may only be included after deductions for proposed dividends. Net
intangible assets, i.e. after deferred tax and deferred tax assets attributable to loss carryforwards are not included in core primary capital.
Deductions from core primary capital are also made for half of certain substantial investments in the financial sector. According to transition
regulations, the revaluation reserve/fair value reserve previously reported as supplementary capital, are not to be calculated as part of the capital
base in 2014 but taken up again as core primary capital in 2015. Otherwise core primary capital comprises parts of minority shareholdings.
Primary capital comprises parts of minority shareholdings.
Supplementary capital comprises fixed-term subordinated loans, which with a remaining term of less than five years may be taken up to a
reduced amount of the nominal value based on the number of days remaining until the date of maturity. Deductions from supplementary capital
are also made for half of certain substantial investments in the financial sector. Otherwise supplementary capital comprises parts of minority
shareholdings. The capital base is increased annually by Group contributions and dividends from subsidiaries.
Minimum capital requirement – Pillar 1
The legal requirement for credit risks, market risks, operational risks and credit value adjustment risk is found in Pillar 1.
Credit risks: Svea Ekonomi applies the Standard Method for calculating credit risk.
Market risks: Svea Ekonomi uses the Swedish Financial Supervisory Authority’s standardized model.
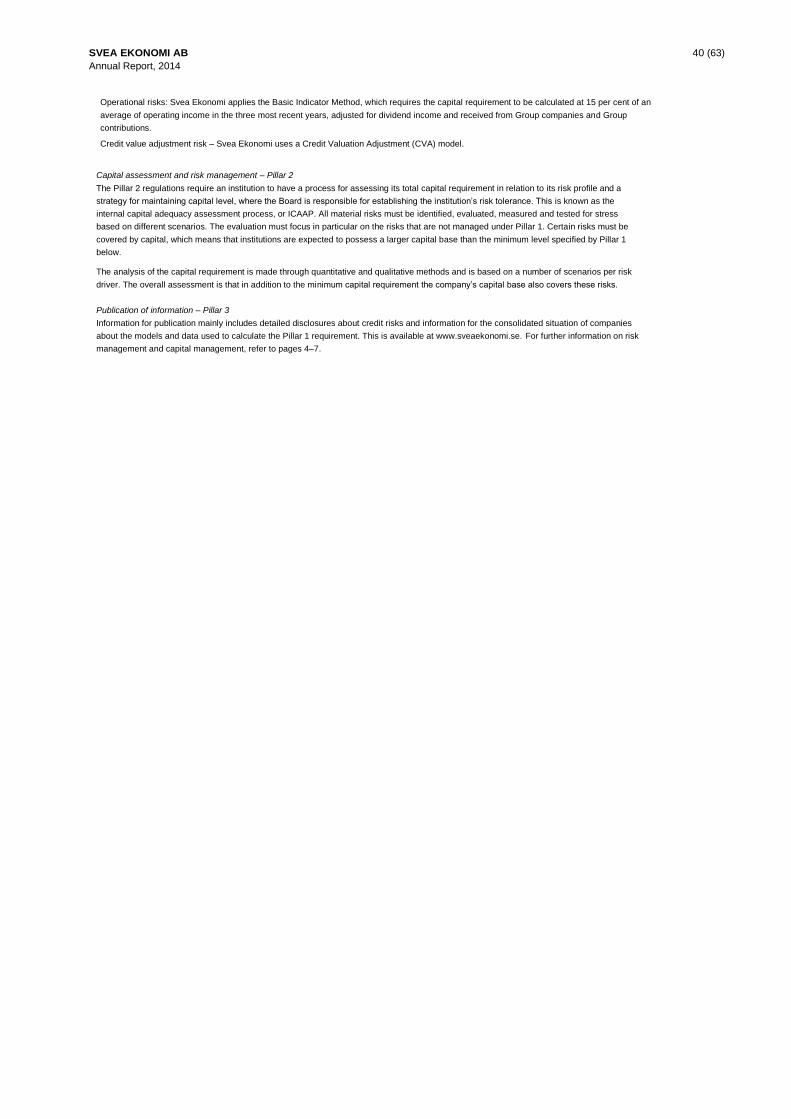
SVEA EKONOMI AB 40 (63)
Annual Report, 2014
Operational risks: Svea Ekonomi applies the Basic Indicator Method, which requires the capital requirement to be calculated at 15 per cent of an
average of operating income in the three most recent years, adjusted for dividend income and received from Group companies and Group
contributions.
Credit value adjustment risk – Svea Ekonomi uses a Credit Valuation Adjustment (CVA) model.
Capital assessment and risk management – Pillar 2
The Pillar 2 regulations require an institution to have a process for assessing its total capital requirement in relation to its risk profile and a
strategy for maintaining capital level, where the Board is responsible for establishing the institution’s risk tolerance. This is known as the
internal capital adequacy assessment process, or ICAAP. All material risks must be identified, evaluated, measured and tested for stress
based on different scenarios. The evaluation must focus in particular on the risks that are not managed under Pillar 1. Certain risks must be
covered by capital, which means that institutions are expected to possess a larger capital base than the minimum level specified by Pillar 1
below.
The analysis of the capital requirement is made through quantitative and qualitative methods and is based on a number of scenarios per risk
driver. The overall assessment is that in addition to the minimum capital requirement the company’s capital base also covers these risks.
Publication of information – Pillar 3
Information for publication mainly includes detailed disclosures about credit risks and information for the consolidated situation of companies
about the models and data used to calculate the Pillar 1 requirement. This is available at www.sveaekonomi.se. For further information on risk
management and capital management, refer to pages 4–7.
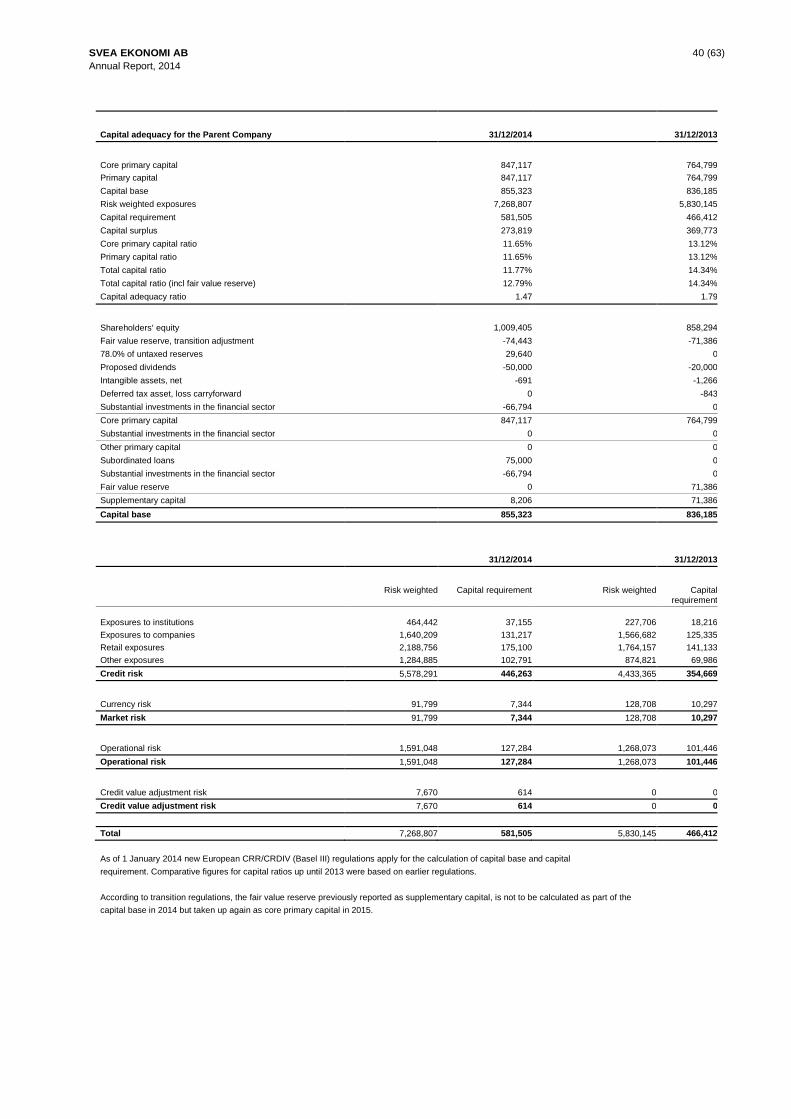
SVEA EKONOMI AB 40 (63)
Annual Report, 2014
Capital adequacy for the Parent Company
31/12/2014
31/12/2013
Core primary capital
847,117
764,799
Primary capital 847,117 764,799
Capital base 855,323 836,185
Risk weighted exposures 7,268,807 5,830,145
Capital requirement 581,505 466,412
Capital surplus 273,819 369,773
Core primary capital ratio 11.65% 13.12%
Primary capital ratio 11.65% 13.12%
Total capital ratio 11.77% 14.34%
Total capital ratio (incl fair value reserve) 12.79% 14.34%
Capital adequacy ratio 1.47 1.79
Shareholders’ equity
1,009,405
858,294
Fair value reserve, transition adjustment -74,443 -71,386
78.0% of untaxed reserves 29,640 0
Proposed dividends -50,000 -20,000
Intangible assets, net -691 -1,266
Deferred tax asset, loss carryforward 0 -843
Substantial investments in the financial sector -66,794 0
Core primary capital 847,117 764,799
Substantial investments in the financial sector 0 0
Other primary capital 0 0
Subordinated loans 75,000 0
Substantial investments in the financial sector -66,794 0
Fair value reserve 0 71,386
Supplementary capital 8,206 71,386
Capital base 855,323 836,185
31/12/2014
31/12/2013
Risk weighted
Capital requirement
Risk weighted
Capital requirement
Exposures to institutions
464,442
37,155
227,706
18,216
Exposures to companies 1,640,209 131,217 1,566,682 125,335
Retail exposures 2,188,756 175,100 1,764,157 141,133
Other exposures 1,284,885 102,791 874,821 69,986
Credit risk 5,578,291 446,263 4,433,365 354,669
Currency risk
91,799
7,344
128,708
10,297
Market risk 91,799 7,344 128,708 10,297
Operational risk
1,591,048
127,284
1,268,073
101,446
Operational risk 1,591,048 127,284 1,268,073 101,446
Credit value adjustment risk
7,670
614
0
0
Credit value adjustment risk 7,670 614 0 0
Total 7,268,807 581,505 5,830,145 466,412
As of 1 January 2014 new European CRR/CRDIV (Basel III) regulations apply for the calculation of capital base and capital
requirement. Comparative figures for capital ratios up until 2013 were based on earlier regulations.
According to transition regulations, the fair value reserve previously reported as supplementary capital, is not to be calculated as part of the
capital base in 2014 but taken up again as core primary capital in 2015.

SVEA EKONOMI AB 41 (63)
Annual Report, 2014
Capital adequacy for the consolidated situation 31/12/2014 31/12/2013 Core primary capital
871,230
719,226
Primary capital 876,695 719,226
Capital base 951,780 790,612
Risk weighted exposures 8,017,116 6,810,989
Capital requirement 641,369 544,879
Capital surplus 310,411 245,733
Core primary capital ratio 10.87% 10.56%
Primary capital ratio 10.94% 10.56%
Total capital ratio 11.87% 11.61%
Total capital ratio (incl fair value reserve) 12.80% 11.61%
Capital adequacy ratio 1.48 1.45 Shareholders’ equity
1,110,462
921,325
Fair value reserve, transition adjustment -74,443 -71,386
Proposed dividends -50,000 -20,000
Intangible assets, net -121,291 -105,591
Deferred tax asset, loss carryforward -1,685 -5,122
Minority shareholding 8,187 0
Core primary capital 871,230 719,226
Minority shareholding 5,465 0
Other primary capital 5,465 0
Subordinated loans 75,000 0
Minority shareholding 85 0
Fair value reserve 0 71,386
Supplementary capital 75,085 71,386
Capital base 951,780 790,612
31/12/2014
31/12/2013
Risk weighted
Capital
requirement
Risk weighted
Capital
requirement Exposures to institutions
496,978
39,758
254,946
20,396
Exposures to companies 2,229,084 178,327 2,117,190 169,375
Retail exposures 2,357,190 188,575 1,934,159 154,733
Other exposures 878,171 70,254 758,963 60,717
Credit risk 5,961,423 476,914 5,065,257 405,221 Currency risk
272,912
21,833
286,780
22,942
Market risk 272,912 21,833 286,780 22,942 Operational risk
1,775,111
142,009
1,458,952
116,716
Operational risk 1,775,111 142,009 1,458,952 116,716 Credit value adjustment risk
7,670
614
0
0
Credit value adjustment risk 7,670 614 0 0
Total 8,017,116 641,369 6,810,989 544,879
During the period, the consolidated situation comprised Svea Ekonomi AB, the branches Svea Finans NUF in Norway, Svea Ekonomi AB in
Finland, and the subsidiaries Svea Finance AS, Svea Finance SIA, Svea Finans A/S, Svea Rahoitus Suomi OY, Svea Finans Nederland BV,
Svea Finans AG, Payson AB and Svea Exchange AB. It also includes the subsidiaries Kapitalkredit Sverige AB, Svea Ekonomi Cyprus Limited
(formerly Cogilane Holdings Limited), Rhoswen Limited, Daylet Limited and Svea Finance ZRT and the Group company Svea Intressenter 2 AB.
As of 1 January 2014, new European CRR/CRDIV (Basel III) regulations apply for the calculation of capital base and capital
requirement. Comparative figures for capital ratios up until 2013 were based on earlier regulations.
According to transition regulations, the fair value reserve previously reported as supplementary capital, is not to be calculated as part of the
capital base in 2014 but taken up again as core primary capital in 2015.
The reclassification of Daylet Limited entailed a reduction in the capital requirement for credit risk, an increase in the capital requirement for
market and operational risks, and an increase in the capital base. The change has not had any material effect.

SVEA EKONOMI AB 42 (63)
Annual Report, 2014
Note 38 Business combinations
A foreign currency exchange and giro service operation was acquired with takeover on 20 March 2014. In connection with the acquisition, values such as customer contracts, synergy effects, geographical presence, market share, management and personnel were identified. The acquisition was allocated within the Group to the subsidiary Svea Exchange AB. According to the acquisition analysis, the total value of the assets and liabilities were as follows:
Carrying amount in the
company on acquisition
Adjustments
Fair value reported in
Group
Other participations
1,250
1,250
Intangible assets, leasing objects 371 371
Intangible assets, goodwill 24,676 24,676
Tangible assets 36,368 36,368
Assets 37,989 24,676 62,665
Liabilities -6,365 0 -6,365
Net assets 31,624 24,676 56,300
Acquisition costs 1,024
Transferred reimbursement including acquisition costs 57,324
Acquired lending to credit institutions
0
Effect of Group lending to credit institutions -57,324
Operations during the period April-December 2014 affected the Group’s operating income by SEK 63,060,000 and the operating profit by
SEK -62,412,000.
The period entailed major expenses for restarting the operation.

SVEA EKONOMI AB 43 (63)
Annual Report, 2014
Note 39 Information by business segment AFS Collections Elimination Total
Group 2014
Interest income 728,015 874 -64 728,825
Interest expenses -150,801 48 69 -150,684
Dividends received 82,895 0 -73,148 9,747
Commission income 421,112 422,076 15,024 858,212
Commission expenses -36,179 -3,439 36 -39,582
Net profit from financial transactions 61,051 0 0 61,051
Participations in associated company’s earnings -1,234 5,767 0 4,533
Other operating income 164,640 8,907 -147,497 26,050
Operating income 1,269,499 434,233 -205,580 1,498,152
Operating expenses -821,294 -360,744 132,432 -1,049,606
Operating profit before credit losses 448,205 73,489 -73,148 448,546
Credit losses, net -121,181 0 0 -121,181
Impairment charges, financial assets -1,460 0 0 -1,460
Operating profit 325,564 73,489 -73,148 325,905
Group 2013
Interest income 569,025 903 -1,076 568,852
Interest expenses -134,279 -1,186 1,082 -134,383
Dividends received 44,006 0 -33,785 10,221
Commission income 328,310 397,747 17,786 743,843
Commission expenses -31,702 -3,443 69 -35,076
Net profit from financial transactions 41,443 0 0 41,443
Participations in associated company’s earnings -1,037 0 0 -1,037
Other operating income 160,431 7,067 -152,503 14,995
Operating income 976,197 401,088 -168,427 1,208,858
Operating expenses -636,453 -362,637 134,641 -864,449
Operating profit before credit losses 339,744 38,451 -33,786 344,409
Credit losses, net -148,978 0 0 -148,978
Operating profit 190,766 38,451 -33,786 195,431
The areas of operation are divided into administrative and financial services (AFS) and debt collection.
Note 40 Information by business segment
Sweden
Norway
Finland
Other
Elimination
Total
Group 2014
Interest income 344,453 112,663 164,801 106,979 -71 728,825
Interest expenses -136,356 -4,527 -99 -9,754 52 -150,684
Dividends received 9,747 0 0 0 0 9,747
Commission income 543,240 155,212 122,365 37,234 161 858,212
Commission expenses -28,412 -2,327 -5,753 -3,155 65 -39,582
Net profit/loss from financial transactions 96,498 -53 -67 -35,604 277 61,051
Participations in associated company’s earnings -550 0 -684 5,767 0 4,533
Other operating income 17,388 3,347 3,629 1,564 122 26,050
Total operating income 846,008 264,315 284,192 103,031 606 1,498,152
Percentage 56% 18% 19% 7% 0% 100%
Group 2013
Interest income 262,568 91,804 126,601 88,011 -132 568,852
Interest expenses -124,000 -3,520 -121 -6,778 36 -134,383
Dividends received 10,221 0 0 0 0 10,221
Commission income 450,751 145,056 118,298 29,298 440 743,843
Commission expenses -24,751 -2,365 -5,064 -2,970 74 -35,076
Net profit/loss from financial transactions 44,546 -20 -1 -3,104 22 41,443
Participations in associated company’s earnings 0 0 -1,037 0 0 -1,037
Other operating income 10,878 4,176 606 79 -744 14,995
Total operating income 630,213 235,131 239,282 104,536 -304 1,208,858
Percentage 52% 19% 20% 9% 0% 100%
The division into geographical areas is based on where customers are located and includes Sweden, Norway, Finland and other countries.
Other countries include Denmark, Estonia, Latvia, the Netherlands, Switzerland, Austria, Germany, Russia, Romania, Serbia, the Ukraine,
Bulgaria, Croatia, Slovakia, Hungary and Slovenia.
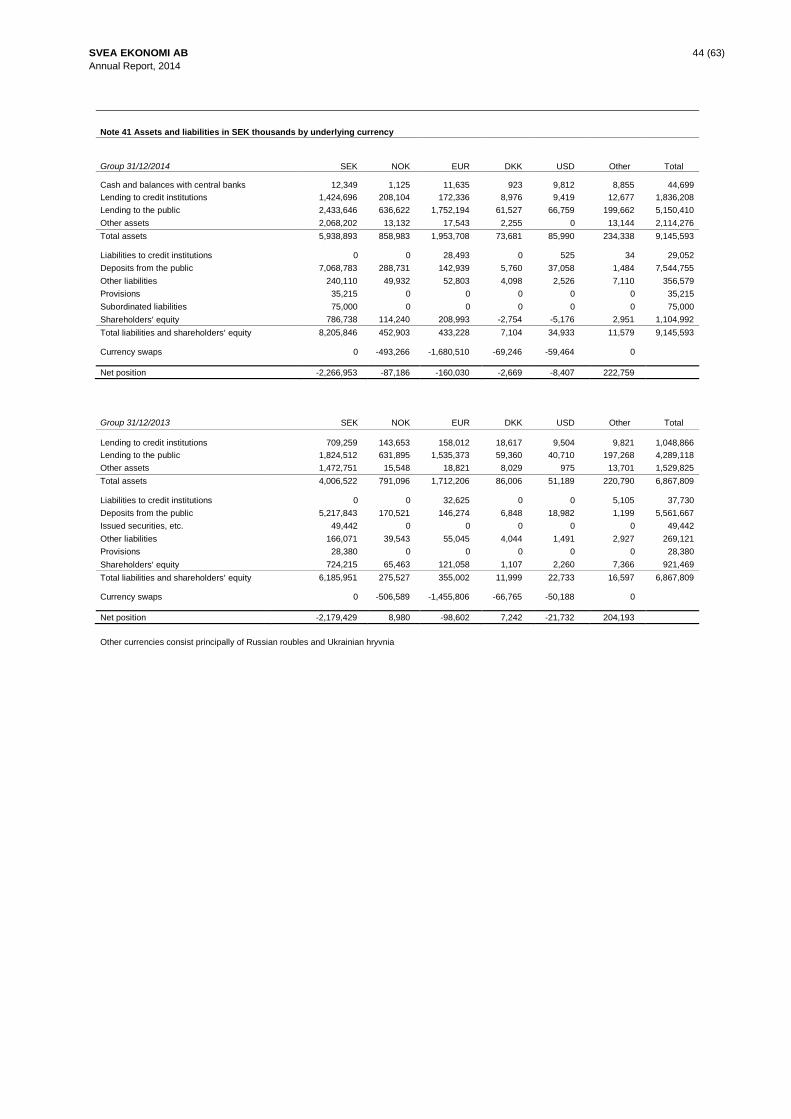
SVEA EKONOMI AB 44 (63)
Annual Report, 2014
Note 41 Assets and liabilities in SEK thousands by underlying currency
Group 31/12/2014 SEK NOK EUR DKK USD Other Total Cash and balances with central banks
12,349
1,125
11,635
923
9,812
8,855
44,699
Lending to credit institutions 1,424,696 208,104 172,336 8,976 9,419 12,677 1,836,208
Lending to the public 2,433,646 636,622 1,752,194 61,527 66,759 199,662 5,150,410
Other assets 2,068,202 13,132 17,543 2,255 0 13,144 2,114,276
Total assets 5,938,893 858,983 1,953,708 73,681 85,990 234,338 9,145,593
Liabilities to credit institutions 0 0 28,493 0 525 34 29,052
Deposits from the public 7,068,783 288,731 142,939 5,760 37,058 1,484 7,544,755
Other liabilities 240,110 49,932 52,803 4,098 2,526 7,110 356,579
Provisions 35,215 0 0 0 0 0 35,215
Subordinated liabilities 75,000 0 0 0 0 0 75,000
Shareholders’ equity 786,738 114,240 208,993 -2,754 -5,176 2,951 1,104,992
Total liabilities and shareholders’ equity 8,205,846 452,903 433,228 7,104 34,933 11,579 9,145,593
Currency swaps 0 -493,266 -1,680,510 -69,246 -59,464 0
Net position -2,266,953 -87,186 -160,030 -2,669 -8,407 222,759
Group 31/12/2013 SEK NOK EUR DKK USD Other Total
Lending to credit institutions
709,259
143,653
158,012
18,617
9,504
9,821
1,048,866
Lending to the public 1,824,512 631,895 1,535,373 59,360 40,710 197,268 4,289,118
Other assets 1,472,751 15,548 18,821 8,029 975 13,701 1,529,825
Total assets 4,006,522 791,096 1,712,206 86,006 51,189 220,790 6,867,809
Liabilities to credit institutions 0 0 32,625 0 0 5,105 37,730
Deposits from the public 5,217,843 170,521 146,274 6,848 18,982 1,199 5,561,667
Issued securities, etc. 49,442 0 0 0 0 0 49,442
Other liabilities 166,071 39,543 55,045 4,044 1,491 2,927 269,121
Provisions 28,380 0 0 0 0 0 28,380
Shareholders’ equity 724,215 65,463 121,058 1,107 2,260 7,366 921,469
Total liabilities and shareholders’ equity 6,185,951 275,527 355,002 11,999 22,733 16,597 6,867,809
Currency swaps 0 -506,589 -1,455,806 -66,765 -50,188 0
Net position -2,179,429 8,980 -98,602 7,242 -21,732 204,193
Other currencies consist principally of Russian roubles and Ukrainian hryvnia
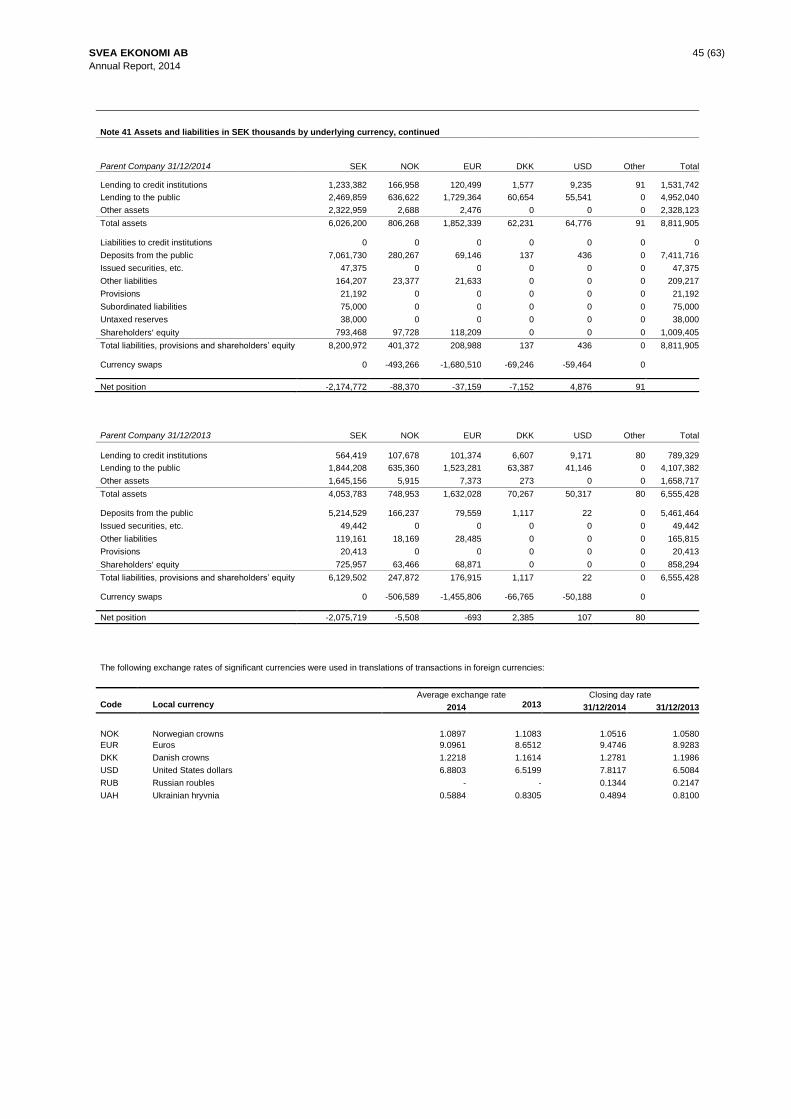
SVEA EKONOMI AB 45 (63)
Annual Report, 2014
Note 41 Assets and liabilities in SEK thousands by underlying currency, continued
Parent Company 31/12/2014 SEK NOK EUR DKK USD Other Total Lending to credit institutions
1,233,382
166,958
120,499
1,577
9,235
91
1,531,742
Lending to the public 2,469,859 636,622 1,729,364 60,654 55,541 0 4,952,040
Other assets 2,322,959 2,688 2,476 0 0 0 2,328,123
Total assets 6,026,200 806,268 1,852,339 62,231 64,776 91 8,811,905
Liabilities to credit institutions 0 0 0 0 0 0 0
Deposits from the public 7,061,730 280,267 69,146 137 436 0 7,411,716
Issued securities, etc. 47,375 0 0 0 0 0 47,375
Other liabilities 164,207 23,377 21,633 0 0 0 209,217
Provisions 21,192 0 0 0 0 0 21,192
Subordinated liabilities 75,000 0 0 0 0 0 75,000
Untaxed reserves 38,000 0 0 0 0 0 38,000
Shareholders’ equity 793,468 97,728 118,209 0 0 0 1,009,405
Total liabilities, provisions and shareholders’ equity 8,200,972 401,372 208,988 137 436 0 8,811,905
Currency swaps 0 -493,266 -1,680,510 -69,246 -59,464 0
Net position -2,174,772 -88,370 -37,159 -7,152 4,876 91
Parent Company 31/12/2013 SEK NOK EUR DKK USD Other Total
Lending to credit institutions
564,419
107,678
101,374
6,607
9,171
80
789,329
Lending to the public 1,844,208 635,360 1,523,281 63,387 41,146 0 4,107,382
Other assets 1,645,156 5,915 7,373 273 0 0 1,658,717
Total assets 4,053,783 748,953 1,632,028 70,267 50,317 80 6,555,428
Deposits from the public 5,214,529 166,237 79,559 1,117 22 0 5,461,464
Issued securities, etc. 49,442 0 0 0 0 0 49,442
Other liabilities 119,161 18,169 28,485 0 0 0 165,815
Provisions 20,413 0 0 0 0 0 20,413
Shareholders’ equity 725,957 63,466 68,871 0 0 0 858,294
Total liabilities, provisions and shareholders’ equity 6,129,502 247,872 176,915 1,117 22 0 6,555,428
Currency swaps 0 -506,589 -1,455,806 -66,765 -50,188 0
Net position -2,075,719 -5,508 -693 2,385 107 80
The following exchange rates of significant currencies were used in translations of transactions in foreign currencies:
Average exchange rate Closing day rate Code Local currency 2014 2013 31/12/2014 31/12/2013
NOK
Norwegian crowns
1.0897
1.1083
1.0516
1.0580
EUR Euros 9.0961 8.6512 9.4746 8.9283
DKK Danish crowns 1.2218 1.1614 1.2781 1.1986
USD United States dollars 6.8803 6.5199 7.8117 6.5084
RUB Russian roubles - - 0.1344 0.2147
UAH Ukrainian hryvnia 0.5884 0.8305 0.4894 0.8100
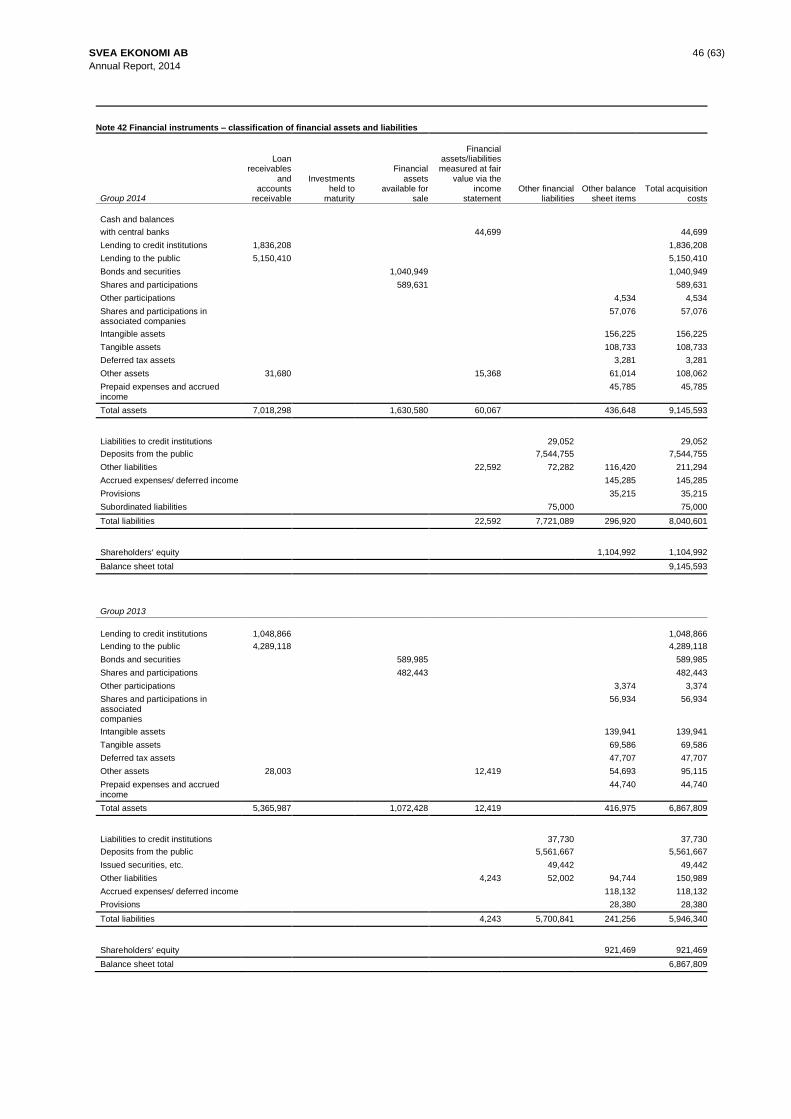
SVEA EKONOMI AB 46 (63)
Annual Report, 2014
Note 42 Financial instruments – classification of financial assets and liabilities
Group 2014
Loan
receivables and
accounts receivable
Investments
held to maturity
Financial
assets available for
sale
Financial
assets/liabilities measured at fair
value via the income
statement
Other financial
liabilities
Other balance
sheet items
Total acquisition
costs
Cash and balances
with central banks 44,699 44,699
Lending to credit institutions 1,836,208 1,836,208
Lending to the public 5,150,410 5,150,410
Bonds and securities 1,040,949 1,040,949
Shares and participations 589,631 589,631
Other participations 4,534 4,534
Shares and participations in associated companies
57,076 57,076
Intangible assets 156,225 156,225
Tangible assets 108,733 108,733
Deferred tax assets 3,281 3,281
Other assets 31,680 15,368 61,014 108,062
Prepaid expenses and accrued income
45,785 45,785
Total assets 7,018,298 1,630,580 60,067 436,648 9,145,593
Liabilities to credit institutions
29,052
29,052
Deposits from the public 7,544,755 7,544,755
Other liabilities 22,592 72,282 116,420 211,294
Accrued expenses/ deferred income 145,285 145,285
Provisions 35,215 35,215
Subordinated liabilities 75,000 75,000
Total liabilities 22,592 7,721,089 296,920 8,040,601
Shareholders’ equity
1,104,992
1,104,992
Balance sheet total 9,145,593
Group 2013
Lending to credit institutions
1,048,866
1,048,866
Lending to the public 4,289,118 4,289,118
Bonds and securities 589,985 589,985
Shares and participations 482,443 482,443
Other participations 3,374 3,374
Shares and participations in associated companies
56,934 56,934
Intangible assets 139,941 139,941
Tangible assets 69,586 69,586
Deferred tax assets 47,707 47,707
Other assets 28,003 12,419 54,693 95,115
Prepaid expenses and accrued income
44,740 44,740
Total assets 5,365,987 1,072,428 12,419 416,975 6,867,809
Liabilities to credit institutions
37,730
37,730
Deposits from the public 5,561,667 5,561,667
Issued securities, etc. 49,442 49,442
Other liabilities 4,243 52,002 94,744 150,989
Accrued expenses/ deferred income 118,132 118,132
Provisions 28,380 28,380
Total liabilities 4,243 5,700,841 241,256 5,946,340
Shareholders’ equity
921,469
921,469
Balance sheet total 6,867,809

SVEA EKONOMI AB 47 (63)
Annual Report, 2014
Note 42 Financial instruments – classification of financial assets and liabilities, continued
Parent Company 2014
Loan receivables
and accounts
receivable
Investments held to
maturity
Financial assets
available for sale
Financial
assets/liabilities measured at fair
value via the income
statement
Other financial liabilities
Other balance sheet items
Total acquisition costs
Lending to credit institutions 1,531,742
Lending to the public 4,952,040
Bonds and securities 1,531,742 1,040,949 1,040,949
Shares and participations 4,952,040 589,044 589,044
Shares and
participations in
associated companies
56,802 56,802
Shares in Group companies 274,177 274,177
Intangible assets 886 886
Tangible assets 306,799 306,799
Deferred tax
assets
701 701
Other assets 3,228 15,368 15,973 34,569
Prepaid expenses and accrued income
24,196 24,196
Total assets 6,487,010 1,629,993 15,368 679,534 8,811,905
Deposits from the public
7,411,716
7,411,716
Issued securities, etc. 47,375 47,375
Other liabilities 22,592 38,447 73,381 134,420
Accrued expenses/ deferred income 74,797 74,797
Provisions 21,192 21,192
Subordinated liabilities 75,000 75,000
Untaxed reserves 38,000 38,000
Total liabilities 22,592 7,572,538 207,370 7,802,500 Shareholders’ equity
1,009,405
1,009,405
Balance sheet total 8,811,905
Parent Company 2013
Lending to credit institutions 789,329
789,329
Lending to the public 4,107,382 4,107,382
Bonds and securities 589,985 589,985
Shares and participations 481,759 481,759
Shares and participations in associated companies
60,602 60,602
Shares in Group companies 260,746 260,746
Intangible assets 1,266 1,266
Tangible assets 197,942 197,942
Deferred tax assets 843 843
Other assets 3,778 12,419 19,518 35,715
Prepaid expenses and accrued income
29,859 29,859
Total assets 4,900,489 1,071,744 12,419 570,776 6,555,428
Deposits from the public
5,461,464
5,461,464
Issued securities, etc. 49,442 49,442
Other liabilities 4,243 30,456 64,530 99,229
Accrued expenses/ deferred income 66,586 66,586
Provisions 20,413 20,413
Total liabilities 4,243 5,541,362 151,529 5,697,134
Shareholders’ equity
858,294
858,294
Balance sheet total 6,555,428
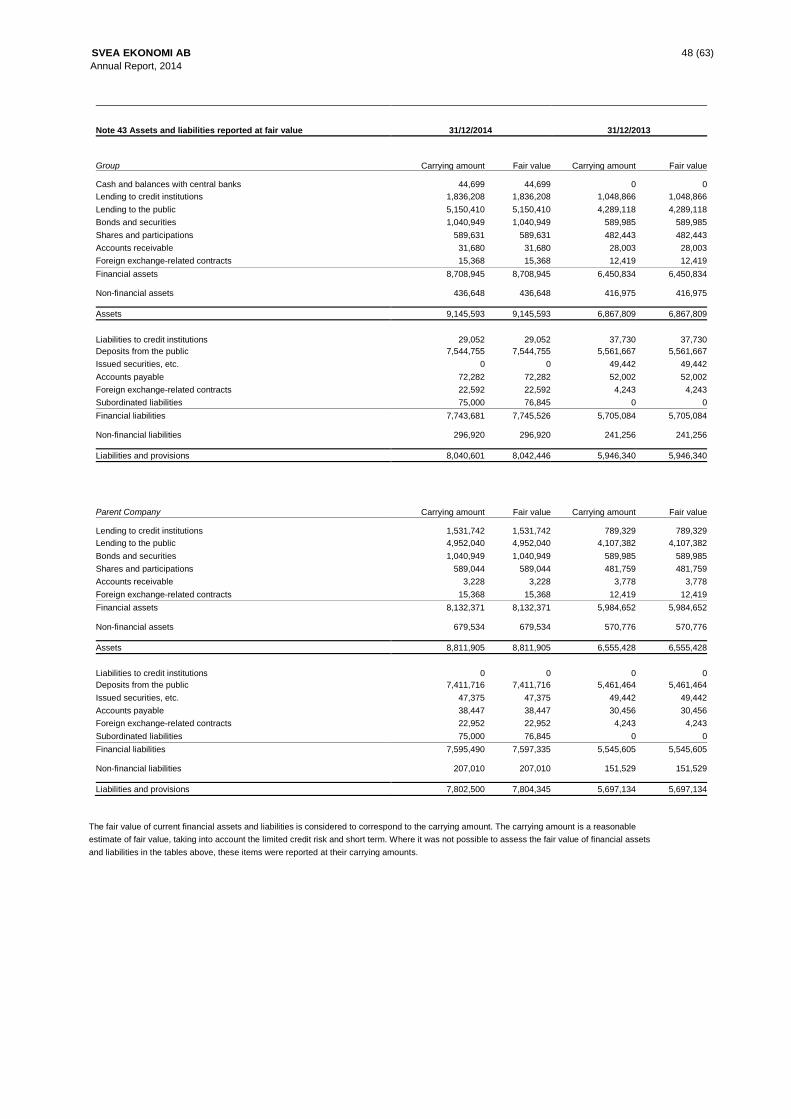
SVEA EKONOMI AB 48 (63)
Annual Report, 2014
Note 43 Assets and liabilities reported at fair value 31/12/2014 31/12/2013
Group Carrying amount Fair value Carrying amount Fair value Cash and balances with central banks
44,699
44,699
0
0
Lending to credit institutions 1,836,208 1,836,208 1,048,866 1,048,866
Lending to the public 5,150,410 5,150,410 4,289,118 4,289,118
Bonds and securities 1,040,949 1,040,949 589,985 589,985
Shares and participations 589,631 589,631 482,443 482,443
Accounts receivable 31,680 31,680 28,003 28,003
Foreign exchange-related contracts 15,368 15,368 12,419 12,419
Financial assets 8,708,945 8,708,945 6,450,834 6,450,834
Non-financial assets 436,648 436,648 416,975 416,975
Assets 9,145,593 9,145,593 6,867,809 6,867,809 Liabilities to credit institutions
29,052
29,052
37,730
37,730
Deposits from the public 7,544,755 7,544,755 5,561,667 5,561,667
Issued securities, etc. 0 0 49,442 49,442
Accounts payable 72,282 72,282 52,002 52,002
Foreign exchange-related contracts 22,592 22,592 4,243 4,243
Subordinated liabilities 75,000 76,845 0 0
Financial liabilities 7,743,681 7,745,526 5,705,084 5,705,084
Non-financial liabilities 296,920 296,920 241,256 241,256
Liabilities and provisions 8,040,601 8,042,446 5,946,340 5,946,340
Parent Company Carrying amount Fair value Carrying amount Fair value Lending to credit institutions
1,531,742
1,531,742
789,329
789,329
Lending to the public 4,952,040 4,952,040 4,107,382 4,107,382
Bonds and securities 1,040,949 1,040,949 589,985 589,985
Shares and participations 589,044 589,044 481,759 481,759
Accounts receivable 3,228 3,228 3,778 3,778
Foreign exchange-related contracts 15,368 15,368 12,419 12,419
Financial assets 8,132,371 8,132,371 5,984,652 5,984,652
Non-financial assets 679,534 679,534 570,776 570,776
Assets 8,811,905 8,811,905 6,555,428 6,555,428 Liabilities to credit institutions
0
0
0
0
Deposits from the public 7,411,716 7,411,716 5,461,464 5,461,464
Issued securities, etc. 47,375 47,375 49,442 49,442
Accounts payable 38,447 38,447 30,456 30,456
Foreign exchange-related contracts 22,952 22,952 4,243 4,243
Subordinated liabilities 75,000 76,845 0 0
Financial liabilities 7,595,490 7,597,335 5,545,605 5,545,605
Non-financial liabilities 207,010 207,010 151,529 151,529
Liabilities and provisions 7,802,500 7,804,345 5,697,134 5,697,134
The fair value of current financial assets and liabilities is considered to correspond to the carrying amount. The carrying amount is a reasonable
estimate of fair value, taking into account the limited credit risk and short term. Where it was not possible to assess the fair value of financial assets
and liabilities in the tables above, these items were reported at their carrying amounts.
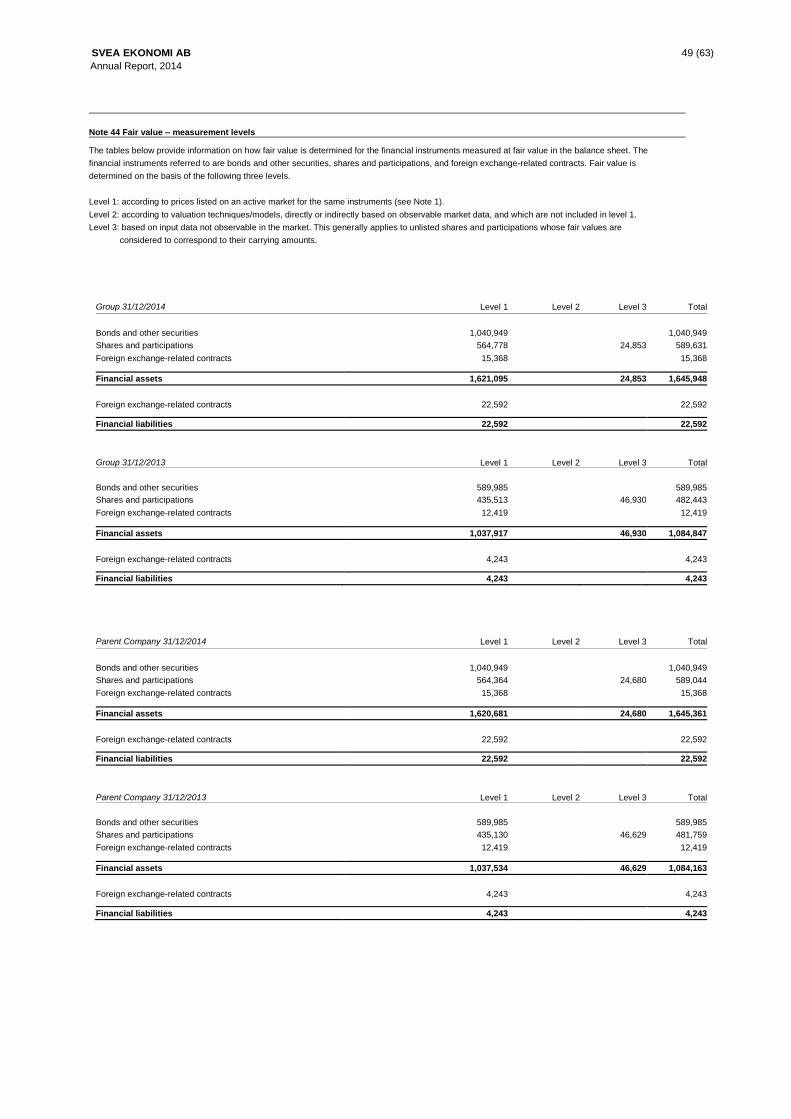
SVEA EKONOMI AB 49 (63)
Annual Report, 2014
Note 44 Fair value – measurement levels The tables below provide information on how fair value is determined for the financial instruments measured at fair value in the balance sheet. The
financial instruments referred to are bonds and other securities, shares and participations, and foreign exchange-related contracts. Fair value is
determined on the basis of the following three levels.
Level 1: according to prices listed on an active market for the same instruments (see Note 1).
Level 2: according to valuation techniques/models, directly or indirectly based on observable market data, and which are not included in level 1.
Level 3: based on input data not observable in the market. This generally applies to unlisted shares and participations whose fair values are
considered to correspond to their carrying amounts.
Group 31/12/2014 Level 1 Level 2 Level 3 Total Bonds and other securities
1,040,949
1,040,949
Shares and participations 564,778 24,853 589,631
Foreign exchange-related contracts 15,368 15,368
Financial assets 1,621,095 24,853 1,645,948 Foreign exchange-related contracts
22,592
22,592
Financial liabilities 22,592 22,592
Group 31/12/2013
Level 1
Level 2
Level 3
Total
Bonds and other securities
589,985
589,985
Shares and participations 435,513 46,930 482,443
Foreign exchange-related contracts 12,419 12,419
Financial assets 1,037,917 46,930 1,084,847
Foreign exchange-related contracts
4,243
4,243
Financial liabilities 4,243 4,243
Parent Company 31/12/2014 Level 1 Level 2 Level 3 Total Bonds and other securities
1,040,949
1,040,949
Shares and participations 564,364 24,680 589,044
Foreign exchange-related contracts 15,368 15,368
Financial assets 1,620,681 24,680 1,645,361
Foreign exchange-related contracts
22,592
22,592
Financial liabilities 22,592 22,592
Parent Company 31/12/2013
Level 1
Level 2
Level 3
Total
Bonds and other securities
589,985
589,985
Shares and participations 435,130 46,629 481,759
Foreign exchange-related contracts 12,419 12,419
Financial assets 1,037,534 46,629 1,084,163 Foreign exchange-related contracts
4,243
4,243
Financial liabilities 4,243 4,243

SVEA EKONOMI AB 50 (63)
Annual Report, 2014
Note 44 Fair value – Level 3
Shares and participations
Group
Closing balance 31/12/2012 37,869
Acquisition cost
10,171
Exchange rate differences 5
Gains and losses reported in profit for the year -1,115
Closing balance 31/12/2013 46,930
Acquisition cost
3,210
Exchange rate differences 13
Gains and losses reported in profit for the year -25,300
Closing balance 31/12/2014 24,853
Parent Company
Closing balance 31/12/2012 37,744 Acquisition cost
10,000
Gains and losses reported in profit for the year -1,115
Closing balance 31/12/2013 46,629
Acquisition cost
3,210
Gains and losses reported in profit for the year -25,159
Closing balance 31/12/2014 24,680
Note 45 Liquidity exposure, contractually remaining terms
The discounted cash flows attributable to financial liabilities below correspond to the nominal cash flows as the liabilities almost exclusively carry
variable interest that is considered to correspond to current market interest rates.
Contingent liquidity is described below and defined as available funds (at fair value) in relation to deposits from the public.

SVEA EKONOMI AB 51 (63)
Annual Report, 2014
Note 45 Liquidity exposure, contractually remaining terms, continued.
Discounted/nominal cash flows – contractually remaining terms
Group 2014 On demand
Max
3 months 3 mo. – 1 yr 1 yr – 5 yrs More than
5 yrs No term Carrying amount
Cash and balances
with central banks 44,699 44,699
Lending to credit institutions 1,814,060 21,648 500 1,836,208
Lending to the public 3,167,328 590,609 1,098,018 294,455 5,150,410
Bonds and securities 80,080 910,379 50,490 1,040,949
Shares and participations 589,631 589,631
Other assets 47,048 14,237 422,411 483,696
Total assets 1,858,759 3,214,376 706,574 2,008,397 345,445 1,012,042 9,145,593
Liabilities to credit institutions
29,052
29,052
Deposits from the public 6,806,532 601,211 20,469 116,543 7,544,755
Subordinated liabilities 75,000 75,000
Other liabilities 94,874 23,351 273,569 391,794
Shareholders’ equity 1,104,992 1,104,992
Total liabilities and shareholders’ equity
6,806,532 725,137 43,820 116,543 75,000 1,378,561 9,145,593
Issued financial guarantees
-100
-100
Issued loan commitments -492,372 -492,372
Lease agreements as lessee -17,544 -52,631 -82,441 0 -152,616
Total 0 -17,544 -52,631 -82,441 0 -492,472 -645,088
Total difference -4,947,773 2,471,695 610,123 1,809,413 270,445
Cash and balances with central banks
44,699
Lending to credit institutions 1,836,208
Bonds and securities, after valuation haircuts 1,015,550
Shares and participations, listed 564,778
Unutilized credit facilities 39,838
Available liquidity 3,501,073
Available liquidity/deposits from public
46%
Group 2013 On demand Max 3 months 3 mo. – 1 yr 1 yr – 5 yrs More than
5 yrs No term Carrying amount
Lending to credit institutions
1,048,366
500
1,048,866
Lending to the public 2,574,931 467,803 984,353 262,031 4,289,118
Bonds and securities 25,719 523,549 40,717 589,985
Shares and participations 482,443 482,443
Other assets 40,422 13,734 403,241 457,397
Total assets 1,048,366 2,615,353 507,256 1,507,902 303,248 885,684 6,867,809
Liabilities to credit institutions
37,730
37,730
Deposits from the public 4,887,177 610,131 17,146 47,213 5,561,667
Issued securities, etc. 49,442 49,442
Other liabilities 56,245 21,889 219,367 297,501
Shareholders’ equity 921,469 921,469
Total liabilities and shareholders’ equity
4,887,177 704,106 88,477 47,213 0 1,140,836 6,867,809
Issued financial guarantees
-1,265
-1,265
Issued loan commitments -422,126 -422,126
Lease agreements as lessee -11,537 -34,610 -105,157 0 -151,303
Total 0 -11,537 -34,610 -105,157 0 -423,391 -574,694
Total difference -3,838,811 1,899,711 384,169 1,355,532 303,248
Lending to credit institutions
1,048,866
Bonds and securities, after valuation haircuts 566,856
Shares and participations, listed 435,513
Unutilized credit facilities 26,324
Available liquidity 2,077,559
Available liquidity/deposits from public 37%
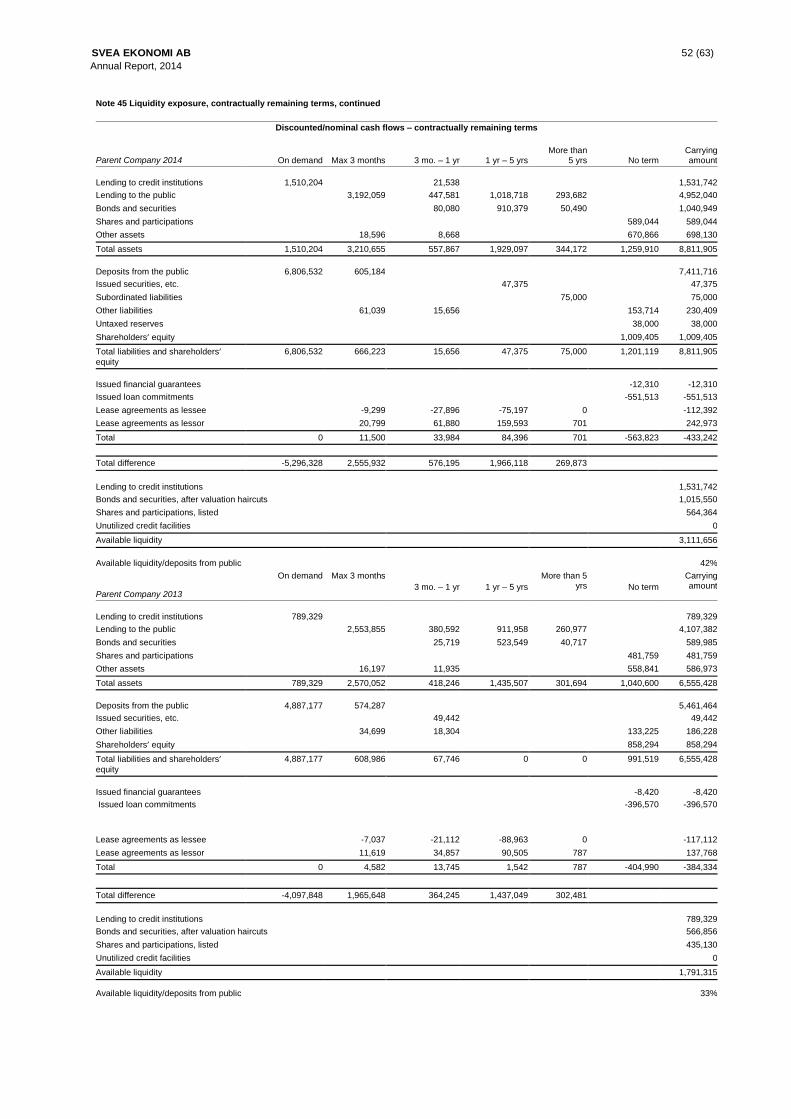
SVEA EKONOMI AB 52 (63)
Annual Report, 2014
Note 45 Liquidity exposure, contractually remaining terms, continued
Discounted/nominal cash flows – contractually remaining terms
Parent Company 2014 On demand Max 3 months
3 mo. – 1 yr
1 yr – 5 yrs More than
5 yrs
No term Carrying amount
Lending to credit institutions
1,510,204
21,538
1,531,742
Lending to the public 3,192,059 447,581 1,018,718 293,682 4,952,040
Bonds and securities 80,080 910,379 50,490 1,040,949
Shares and participations 589,044 589,044
Other assets 18,596 8,668 670,866 698,130
Total assets 1,510,204 3,210,655 557,867 1,929,097 344,172 1,259,910 8,811,905
Deposits from the public
6,806,532
605,184
7,411,716
Issued securities, etc. 47,375 47,375
Subordinated liabilities 75,000 75,000
Other liabilities 61,039 15,656 153,714 230,409
Untaxed reserves 38,000 38,000
Shareholders’ equity 1,009,405 1,009,405
Total liabilities and shareholders’ equity
6,806,532 666,223 15,656 47,375 75,000 1,201,119 8,811,905
Issued financial guarantees
-12,310
-12,310
Issued loan commitments -551,513 -551,513
Lease agreements as lessee -9,299 -27,896 -75,197 0 -112,392
Lease agreements as lessor 20,799 61,880 159,593 701 242,973
Total 0 11,500 33,984 84,396 701 -563,823 -433,242
Total difference -5,296,328 2,555,932 576,195 1,966,118 269,873
Lending to credit institutions
1,531,742
Bonds and securities, after valuation haircuts 1,015,550
Shares and participations, listed 564,364
Unutilized credit facilities 0
Available liquidity 3,111,656
Available liquidity/deposits from public
42%
Parent Company 2013
On demand Max 3 months
3 mo. – 1 yr
1 yr – 5 yrs
More than 5 yrs
No term
Carrying amount
Lending to credit institutions
789,329
789,329
Lending to the public 2,553,855 380,592 911,958 260,977 4,107,382
Bonds and securities 25,719 523,549 40,717 589,985
Shares and participations 481,759 481,759
Other assets 16,197 11,935 558,841 586,973
Total assets 789,329 2,570,052 418,246 1,435,507 301,694 1,040,600 6,555,428
Deposits from the public
4,887,177
574,287
5,461,464
Issued securities, etc. 49,442 49,442
Other liabilities 34,699 18,304 133,225 186,228
Shareholders’ equity 858,294 858,294
Total liabilities and shareholders’ equity
4,887,177 608,986 67,746 0 0 991,519 6,555,428
Issued financial guarantees
-8,420
-8,420
Issued loan commitments
-396,570 -396,570
Lease agreements as lessee -7,037 -21,112 -88,963 0 -117,112
Lease agreements as lessor 11,619 34,857 90,505 787 137,768
Total 0 4,582 13,745 1,542 787 -404,990 -384,334
Total difference -4,097,848 1,965,648 364,245 1,437,049 302,481
Lending to credit institutions
789,329
Bonds and securities, after valuation haircuts 566,856
Shares and participations, listed 435,130
Unutilized credit facilities 0
Available liquidity 1,791,315
Available liquidity/deposits from public 33%
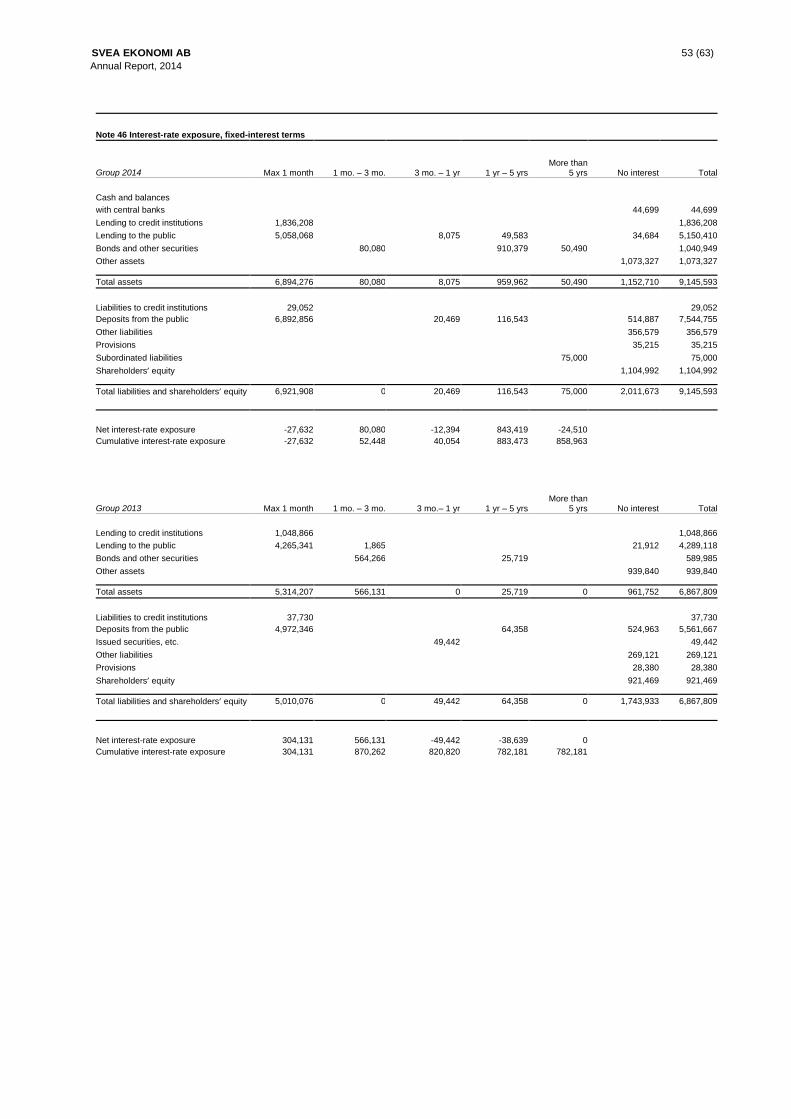
SVEA EKONOMI AB 53 (63)
Annual Report, 2014
Note 46 Interest-rate exposure, fixed-interest terms
Group 2014
Max 1 month
1 mo. – 3 mo.
3 mo. – 1 yr
1 yr – 5 yrs
More than
5 yrs
No interest
Total Cash and balances
with central banks 44,699 44,699
Lending to credit institutions 1,836,208 1,836,208
Lending to the public 5,058,068 8,075 49,583 34,684 5,150,410
Bonds and other securities 80,080 910,379 50,490 1,040,949
Other assets 1,073,327 1,073,327
Total assets 6,894,276 80,080 8,075 959,962 50,490 1,152,710 9,145,593
Liabilities to credit institutions
29,052
29,052
Deposits from the public 6,892,856 20,469 116,543 514,887 7,544,755
Other liabilities 356,579 356,579
Provisions 35,215 35,215
Subordinated liabilities 75,000 75,000
Shareholders’ equity 1,104,992 1,104,992
Total liabilities and shareholders’ equity 6,921,908 0 20,469 116,543 75,000 2,011,673 9,145,593
Net interest-rate exposure
-27,632
80,080
-12,394
843,419
-24,510
Cumulative interest-rate exposure -27,632 52,448 40,054 883,473 858,963
Group 2013
Max 1 month
1 mo. – 3 mo.
3 mo.– 1 yr
1 yr – 5 yrs
More than
5 yrs
No interest
Total Lending to credit institutions
1,048,866
1,048,866
Lending to the public 4,265,341 1,865 21,912 4,289,118
Bonds and other securities 564,266 25,719 589,985
Other assets 939,840 939,840
Total assets 5,314,207 566,131 0 25,719 0 961,752 6,867,809 Liabilities to credit institutions
37,730
37,730
Deposits from the public 4,972,346 64,358 524,963 5,561,667
Issued securities, etc. 49,442 49,442
Other liabilities 269,121 269,121
Provisions 28,380 28,380
Shareholders’ equity 921,469 921,469
Total liabilities and shareholders’ equity 5,010,076 0 49,442 64,358 0 1,743,933 6,867,809
Net interest-rate exposure
304,131
566,131
-49,442
-38,639
0
Cumulative interest-rate exposure 304,131 870,262 820,820 782,181 782,181
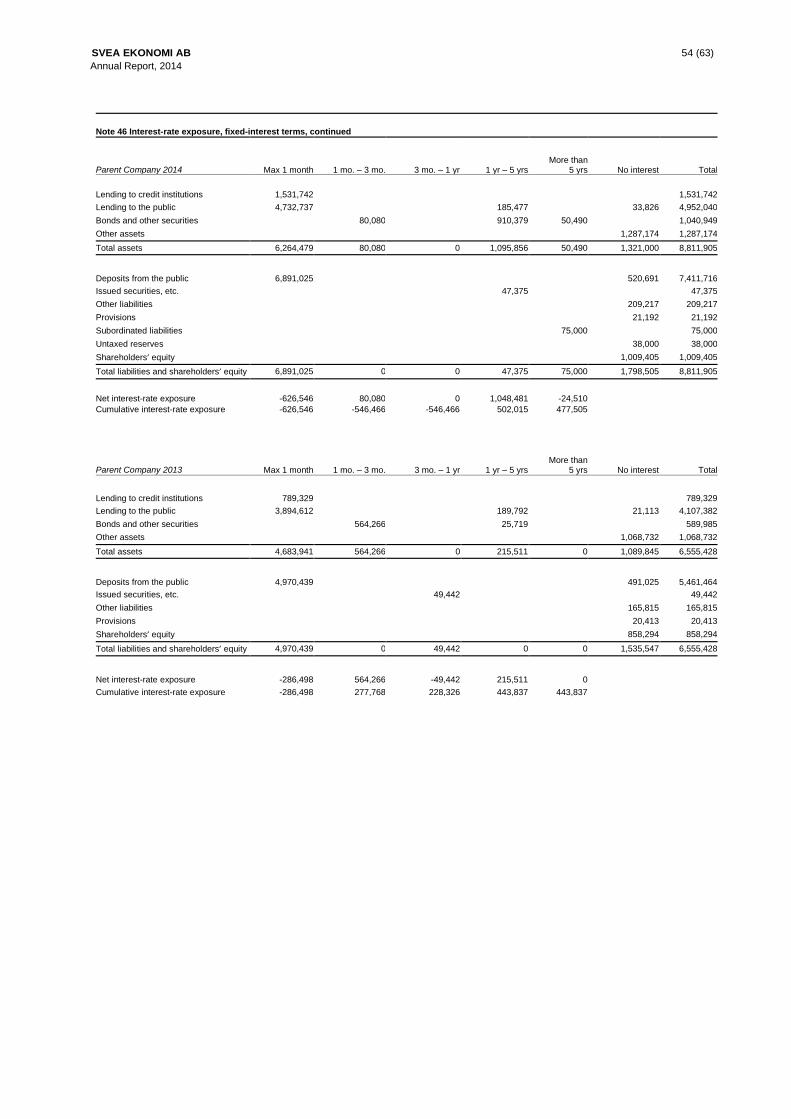
SVEA EKONOMI AB 54 (63)
Annual Report, 2014
Note 46 Interest-rate exposure, fixed-interest terms, continued
Parent Company 2014
Max 1 month
1 mo. – 3 mo.
3 mo. – 1 yr
1 yr – 5 yrs
More than
5 yrs
No interest
Total Lending to credit institutions
1,531,742
1,531,742
Lending to the public 4,732,737 185,477 33,826 4,952,040
Bonds and other securities 80,080 910,379 50,490 1,040,949
Other assets 1,287,174 1,287,174
Total assets 6,264,479 80,080 0 1,095,856 50,490 1,321,000 8,811,905
Deposits from the public
6,891,025
520,691
7,411,716
Issued securities, etc. 47,375 47,375
Other liabilities 209,217 209,217
Provisions 21,192 21,192
Subordinated liabilities 75,000 75,000
Untaxed reserves 38,000 38,000
Shareholders’ equity 1,009,405 1,009,405
Total liabilities and shareholders’ equity 6,891,025 0 0 47,375 75,000 1,798,505 8,811,905 Net interest-rate exposure
-626,546
80,080
0
1,048,481
-24,510
Cumulative interest-rate exposure -626,546 -546,466 -546,466 502,015 477,505
Parent Company 2013
Max 1 month
1 mo. – 3 mo.
3 mo. – 1 yr
1 yr – 5 yrs
More than
5 yrs
No interest
Total
Lending to credit institutions
789,329
789,329
Lending to the public 3,894,612 189,792 21,113 4,107,382
Bonds and other securities 564,266 25,719 589,985
Other assets 1,068,732 1,068,732
Total assets 4,683,941 564,266 0 215,511 0 1,089,845 6,555,428
Deposits from the public
4,970,439
491,025
5,461,464
Issued securities, etc. 49,442 49,442
Other liabilities 165,815 165,815
Provisions 20,413 20,413
Shareholders’ equity 858,294 858,294
Total liabilities and shareholders’ equity 4,970,439 0 49,442 0 0 1,535,547 6,555,428
Net interest-rate exposure
-286,498
564,266
-49,442
215,511
0
Cumulative interest-rate exposure -286,498 277,768 228,326 443,837 443,837

SVEA EKONOMI AB 55 (63)
Annual Report, 2014
Note 47 Sensitivity analyses, market risks
Interest-rate risk
On the closing date, the impact of a 1-percentage-point increase/decrease in interest on net interest income during the forthcoming 12-month
period amounts to +/- SEK 8,590,000 (7,822,000) for the Group and +/- SEK 4,775,000 (4,438,000) for the Parent Company, based on all
interest-bearing assets and liabilities existing on the closing date, according to Note 46.
Currency risk
Group 2014 NOK EUR DKK USD Other Total
Net position according to Note 41 -87,186 -160,030 -2,669 -8,407 222,759 -35,533
Effect of 10% increase in SEK against currency
8,719 16,003 267 841 -22,276 3,553
Group 2013 NOK EUR DKK USD Other Total
Net position according to Note 41 8,980 -98,602 7,242 -21,732 204,193 100,081
Effect of 10% increase in SEK against currency
-898 9,860 -724 2,173 -20,419 -10,008
Parent Company 2014 NOK EUR DKK USD Other Total
Net position according to Note 41 -88,370 -37,159 -7,152 4,876 91 -127,714
Effect of 10% increase in SEK against currency
8,837 3,716 715 -488 -9 12,771
Parent Company 2013 NOK EUR DKK USD Other Total
Net position according to Note 41 -5,508 -693 2,385 107 80 -3,629
Effect of 10% increase in SEK against currency
551 9 -239 -11 -8 363
Share-price risk
Group Parent Company
Geographic distribution of holdings: 31/12/2014 31/12/2013 31/12/2014 31/12/2013
Sweden 589,044 456,600 589,044 456,600
Nordic, other 552 513 0 0
Europe, other 35 25,330 0 25,159
Total 589,631 482,443 589,044 481,759
Group Parent Company
Distribution of holdings per industry: 31/12/2014 31/12/2013 31/12/2014 31/12/2013
Commodities 201,737 177,897 201,737 177,897
Services 154,880 133,573 154,880 133,573
Telecoms 111,902 98,949 111,896 98,943
IT 100,605 38,148 100,605 38,148
Health care 5,693 4,087 5,693 4,087
Finance 7,249 6,253 6,668 5,575
Industry 6,223 6,991 6,223 6,991
Other 1,342 16,545 1,342 16,545
Total 589,631 482,443 589,044 481,759
The impact on shareholders’ equity of a 10 per cent increase or decrease in the share price on the closing date would amount to +/- SEK
58,963,000 (48,244,000) for the Group, or 5.3 per cent (5.2) of shareholders’ equity, and +/- SEK 58,904,000 (48,176,000) for the Parent Company,
or 5.8 per cent (5.6) of shareholders’ equity, based on the shares and participations existing on the closing date.
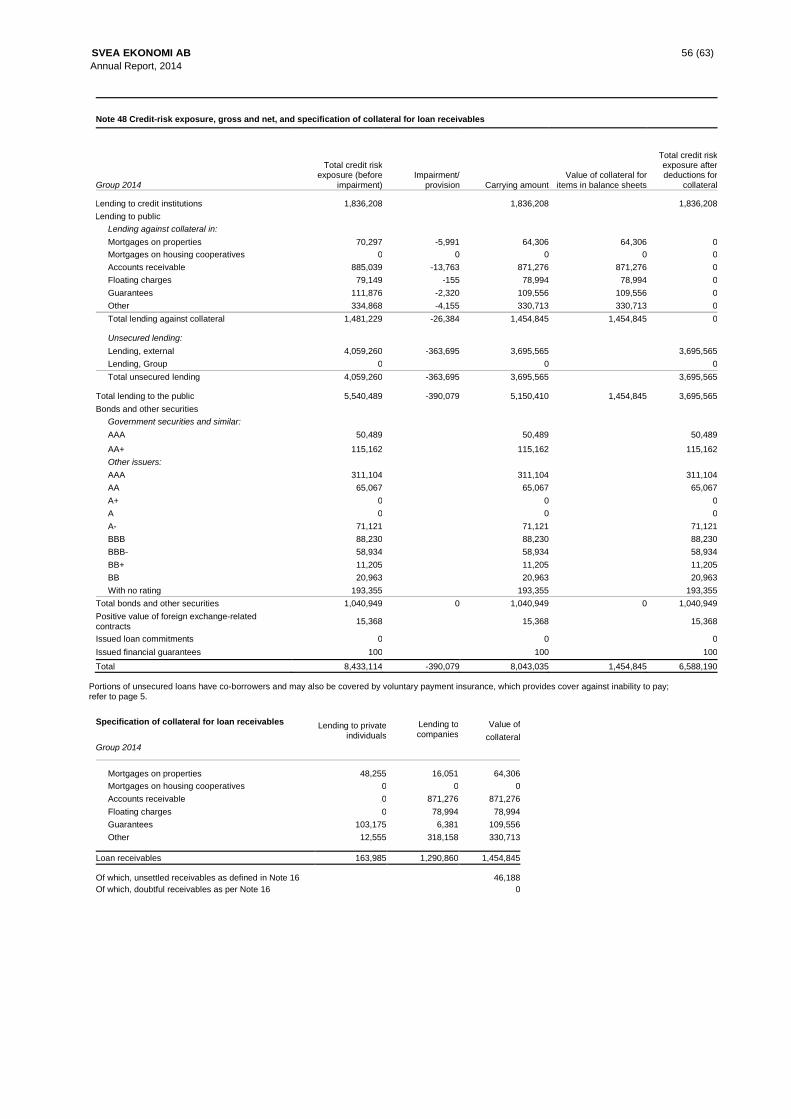
SVEA EKONOMI AB 56 (63)
Annual Report, 2014
Note 48 Credit-risk exposure, gross and net, and specification of collateral for loan receivables
Group 2014
Total credit risk exposure (before
impairment)
Impairment/ provision
Carrying amount
Value of collateral for items in balance sheets
Total credit risk exposure after deductions for
collateral Lending to credit institutions
Lending to public
Lending against collateral in:
Mortgages on properties
1,836,208
70,297
-5,991
1,836,208
64,306
64,306
1,836,208
0
Mortgages on housing cooperatives 0 0 0 0 0
Accounts receivable 885,039 -13,763 871,276 871,276 0
Floating charges 79,149 -155 78,994 78,994 0
Guarantees 111,876 -2,320 109,556 109,556 0
Other 334,868 -4,155 330,713 330,713 0
Total lending against collateral 1,481,229 -26,384 1,454,845 1,454,845 0
Unsecured lending:
Lending, external
4,059,260
-363,695
3,695,565
3,695,565
Lending, Group 0 0 0
Total unsecured lending 4,059,260 -363,695 3,695,565 3,695,565
Total lending to the public
Bonds and other securities
Government securities and similar:
AAA
5,540,489
50,489
-390,079 5,150,410
50,489
1,454,845 3,695,565
50,489
AA+
Other issuers:
AAA
115,162
311,104
115,162
311,104
115,162
311,104
AA 65,067 65,067 65,067
A+ 0 0 0
A 0 0 0
A- 71,121 71,121 71,121
BBB 88,230 88,230 88,230
BBB- 58,934 58,934 58,934
BB+ 11,205 11,205 11,205
BB 20,963 20,963 20,963
With no rating 193,355 193,355 193,355
Total bonds and other securities 1,040,949 0 1,040,949 0 1,040,949
Positive value of foreign exchange-related contracts
15,368 15,368 15,368
Issued loan commitments 0 0 0
Issued financial guarantees 100 100 100
Total 8,433,114 -390,079 8,043,035 1,454,845 6,588,190
Portions of unsecured loans have co-borrowers and may also be covered by voluntary payment insurance, which provides cover against inability to pay; refer to page 5.
Specification of collateral for loan receivables Group 2014
Lending to private individuals
Lending to companies
Value of
collateral
Mortgages on properties
48,255
16,051
64,306
Mortgages on housing cooperatives 0 0 0
Accounts receivable 0 871,276 871,276
Floating charges 0 78,994 78,994
Guarantees 103,175 6,381 109,556
Other 12,555 318,158 330,713
Loan receivables 163,985 1,290,860 1,454,845
Of which, unsettled receivables as defined in Note 16
46,188
Of which, doubtful receivables as per Note 16 0
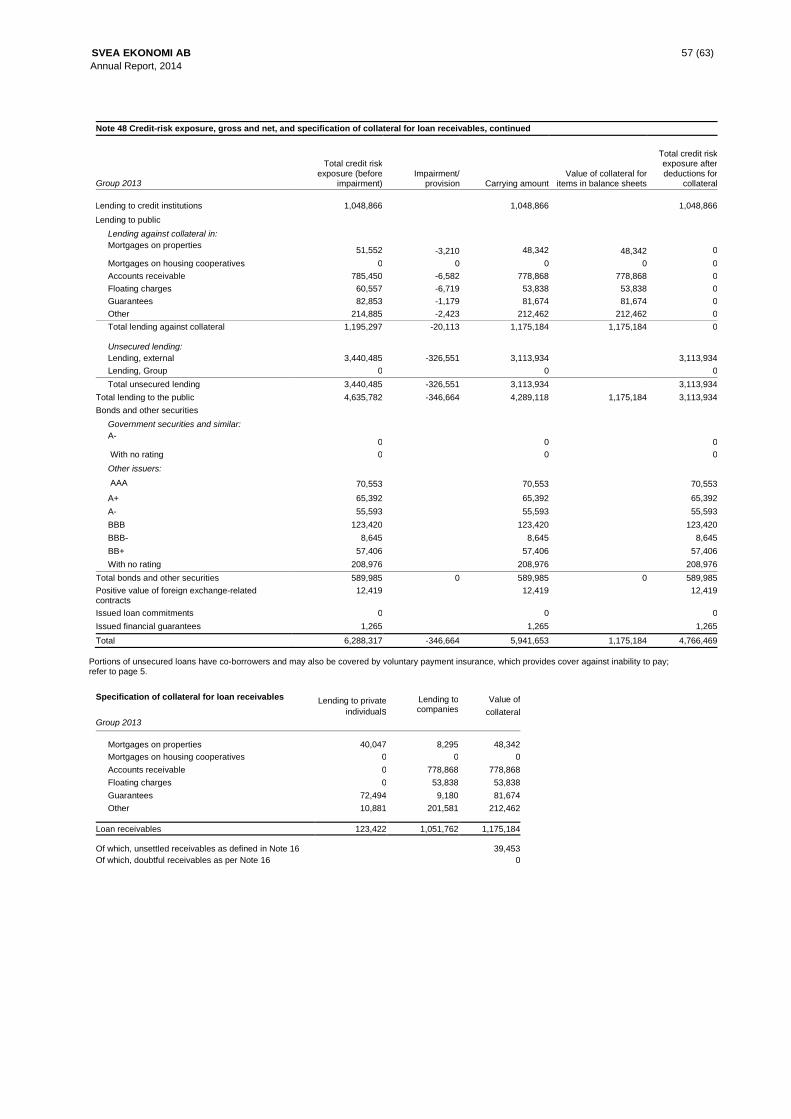
SVEA EKONOMI AB 57 (63)
Annual Report, 2014
Note 48 Credit-risk exposure, gross and net, and specification of collateral for loan receivables, continued
Group 2013
Total credit risk exposure (before
impairment)
Impairment/ provision
Carrying amount
Value of collateral for items in balance sheets
Total credit risk exposure after deductions for
collateral
Lending to credit institutions
Lending to public
Lending against collateral in:
Mortgages on properties
1,048,866
51,552
-3,210
1,048,866
48,342
48,342
1,048,866
0
Mortgages on housing cooperatives 0 0 0 0 0
Accounts receivable 785,450 -6,582 778,868 778,868 0
Floating charges 60,557 -6,719 53,838 53,838 0
Guarantees 82,853 -1,179 81,674 81,674 0
Other 214,885 -2,423 212,462 212,462 0
Total lending against collateral 1,195,297 -20,113 1,175,184 1,175,184 0
Unsecured lending:
Lending, external
3,440,485
-326,551
3,113,934
3,113,934
Lending, Group 0 0 0
Total unsecured lending 3,440,485 -326,551 3,113,934 3,113,934
Total lending to the public
Bonds and other securities
Government securities and similar:
A-
4,635,782
0
-346,664 4,289,118
0
1,175,184 3,113,934
0
With no rating
Other issuers:
AAA
0
70,553
0
70,553
0
70,553
A+ 65,392 65,392 65,392
A- 55,593 55,593 55,593
BBB 123,420 123,420 123,420
BBB- 8,645 8,645 8,645
BB+ 57,406 57,406 57,406
With no rating 208,976 208,976 208,976
Total bonds and other securities 589,985 0 589,985 0 589,985
Positive value of foreign exchange-related contracts
12,419 12,419 12,419
Issued loan commitments 0 0 0
Issued financial guarantees 1,265 1,265 1,265
Total 6,288,317 -346,664 5,941,653 1,175,184 4,766,469
Portions of unsecured loans have co-borrowers and may also be covered by voluntary payment insurance, which provides cover against inability to pay; refer to page 5.
Specification of collateral for loan receivables Group 2013
Lending to private
individuals
Lending to companies
Value of
collateral
Mortgages on properties
40,047
8,295
48,342
Mortgages on housing cooperatives 0 0 0
Accounts receivable 0 778,868 778,868
Floating charges 0 53,838 53,838
Guarantees 72,494 9,180 81,674
Other 10,881 201,581 212,462
Loan receivables 123,422 1,051,762 1,175,184
Of which, unsettled receivables as defined in Note 16
39,453
Of which, doubtful receivables as per Note 16 0
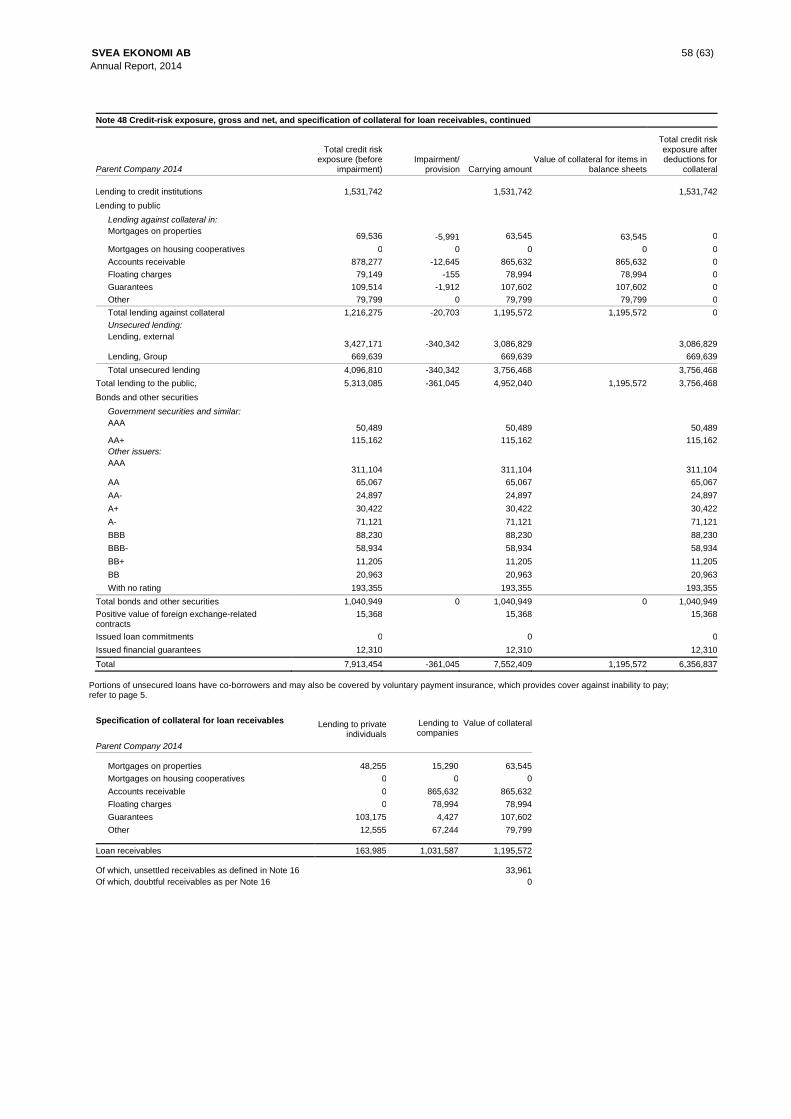
SVEA EKONOMI AB 58 (63)
Annual Report, 2014
Note 48 Credit-risk exposure, gross and net, and specification of collateral for loan receivables, continued
Parent Company 2014
Total credit risk exposure (before
impairment)
Impairment/ provision
Carrying amount
Value of collateral for items in balance sheets
Total credit risk exposure after deductions for
collateral
Lending to credit institutions
Lending to public
Lending against collateral in:
Mortgages on properties
1,531,742
69,536
-5,991
1,531,742
63,545
63,545
1,531,742
0
Mortgages on housing cooperatives 0 0 0 0 0
Accounts receivable 878,277 -12,645 865,632 865,632 0
Floating charges 79,149 -155 78,994 78,994 0
Guarantees 109,514 -1,912 107,602 107,602 0
Other 79,799 0 79,799 79,799 0
Total lending against collateral 1,216,275 -20,703 1,195,572 1,195,572 0
Unsecured lending:
Lending, external
3,427,171
-340,342
3,086,829
3,086,829
Lending, Group 669,639 669,639 669,639
Total unsecured lending 4,096,810 -340,342 3,756,468 3,756,468
Total lending to the public,
Bonds and other securities
Government securities and similar:
AAA
5,313,085
50,489
-361,045 4,952,040
50,489
1,195,572 3,756,468
50,489
AA+
Other issuers:
AAA
115,162
311,104
115,162
311,104
115,162
311,104
AA 65,067 65,067 65,067
AA- 24,897 24,897 24,897
A+ 30,422 30,422 30,422
A- 71,121 71,121 71,121
BBB 88,230 88,230 88,230
BBB- 58,934 58,934 58,934
BB+ 11,205 11,205 11,205
BB 20,963 20,963 20,963
With no rating 193,355 193,355 193,355
Total bonds and other securities 1,040,949 0 1,040,949 0 1,040,949
Positive value of foreign exchange-related contracts
15,368 15,368 15,368
Issued loan commitments 0 0 0
Issued financial guarantees 12,310 12,310 12,310
Total 7,913,454 -361,045 7,552,409 1,195,572 6,356,837
Portions of unsecured loans have co-borrowers and may also be covered by voluntary payment insurance, which provides cover against inability to pay; refer to page 5.
Specification of collateral for loan receivables Parent Company 2014
Lending to private individuals
Lending to companies
Value of collateral
Mortgages on properties
48,255
15,290
63,545
Mortgages on housing cooperatives 0 0 0
Accounts receivable 0 865,632 865,632
Floating charges 0 78,994 78,994
Guarantees 103,175 4,427 107,602
Other 12,555 67,244 79,799
Loan receivables 163,985 1,031,587 1,195,572
Of which, unsettled receivables as defined in Note 16
33,961
Of which, doubtful receivables as per Note 16 0
SVEA EKONOMI AB 59 (63)
Annual Report, 2014
Note 48 Credit-risk exposure, gross and net, and specification of collateral for loan receivables, continued
Parent Company 2013
Total credit risk exposure (before
impairment)
Impairment/ provision
Carrying amount
Value of collateral for items in balance sheets
Total credit risk exposure after deductions for
collateral
Lending to credit institutions
Lending to public
Lending against collateral in:
Mortgages on properties
789,329
50,824
-3,210
789,329
47,614
47,614
789,329
0
Mortgages on housing cooperatives 0 0 0 0 0
Accounts receivable 784,924 -5,893 779,031 779,031 0
Floating charges 60,557 -6,719 53,838 53,838 0
Guarantees 77,802 -381 77,421 77,421 0
Other 68,473 0 68,473 68,473 0
Total lending against collateral 1,042,580 -16,203 1,026,377 1,026,377 0
Unsecured lending:
Lending, external
2,803,186
-298,561
2,504,625
2,504,625
Lending, Group 576,380 576,380 576,380
Total unsecured lending 3,379,566 -298,561 3,081,005 3,081,005
Total lending to the public
Bonds and other securities
Government securities and similar:
A-
4,422,146
0
-314,764 4,107,382
0
1,026,377 3,081,005
0
With no rating
Other issuers:
AAA
0
70,553
0
70,553
0
70,553
A+ 65,392 65,392 65,392
A- 55,593 55,593 55,593
BBB 123,420 123,420 123,420
BBB- 8,645 8,645 8,645
BB+ 57,406 57,406 57,406
With no rating 208,976 208,976 208,976
Total bonds and other securities 589,985 0 589,985 0 589,985
Positive value of foreign exchange-related contracts
12,419 12,419 12,419
Issued loan commitments 0 0 0
Issued financial guarantees 8,420 8,420 8,420
Total 5,822,299 -314,764 5,507,535 1,026,377 4,481,158
Portions of unsecured loans have co-borrowers and may also be covered by voluntary payment insurance, which provides cover against inability to pay; refer to page 5.
Specification of collateral for loan receivables Parent Company 2013
Lending to private individuals
Lending to companies
Value of collateral
Mortgages on properties
40,047
7,567
47,614
Mortgages on housing cooperatives 0 0 0
Accounts receivable 0 779,031 779,031
Floating charges 0 53,838 53,838
Guarantees 72,494 4,927 77,421
Other 10,881 57,592 68,473
Loan receivables 123,422 902,955 1,026,377 Of which, unsettled receivables as defined in Note 16
29,516
Of which, doubtful receivables as per Note 16 0
Group Parent Company
Note 49 Credit quality of loan receivables 31/12/2014 31/12/2013 31/12/2014 31/12/2013 Private individuals:
Share of doubtful loan receivables
11.8%
11.8%
12.5%
12.6%
Rate of loss provisions for doubtful loan receivables 83.3% 85.1% 83.2% 85.1%
Credit loss ratio 3.2% 3.7% 3.3% 3.9% Companies:
Share of doubtful loan receivables 2.6% 3.3% 2.1% 2.6%
Rate of loss provisions for doubtful loan receivables 100.0% 100.0% 100.0% 100.0%
Credit loss ratio 1.6% 4.1% 1.4% 2.3%
SVEA EKONOMI AB 60 (63)
Annual Report, 2014
Note 50 Reporting per country
Group 2014
Country Geographical area Operation 3)
Operating income
Operating
profit
Tax on profit for
the year
Average number
permanent employees
Sweden SE, DE, NL, AT 1)
FIN, REC, ADM
846,008
210,992
-47,716
523
Norway Norway FIN, REC 264,315 64,396 -17,482 103
Finland Finland FIN, REC 284,192 68,013 -17,088 139
Denmark Denmark FIN, REC 35,586 -9,725 -5,646 29
Estonia Estonia FIN, REC 9,431 496 0 16
Latvia Latvia FIN, REC 51 -1,404 0 2
Switzerland Switzerland FIN 8,939 2,685 -632 8
Netherlands Netherlands FIN 45,226 14,651 -3,519 14
Cyprus CY, RU, RO, SL 2) FIN 6,690 -8,360 -1,744 0
Ukraine Ukraine FIN -10,770 -15,333 -17 4
Serbia Serbia FIN -1,085 -2,956 0 0
Bulgaria Bulgaria FIN 572 17 -2 1
Croatia Croatia FIN 3,628 1,082 -715 0
Slovenia Slovenia FIN 89 76 -15 0
Hungary Hungary FIN -32 -187 0 0
Austria Austria ADM -2 3 0 0
Curacao Eastern Europe REC 5,767 5,767 0 0
Eliminations -453 -4,308 -162
Total 1,498,152 325,905 -94,738 839
Group 2013
Country Geographical area Operation 3) Operating income
Operating
profit
Tax on profit
for the year
Average
number
permanent
employees
Sweden SE, DE, NL, AT 1)
FIN, REC, ADM
630,213
133,177
-22,596
350
Norway Norway FIN, REC 235,131 40,732 -11,505 92
Finland Finland FIN, REC 239,282 43,933 -18,170 143
Denmark Denmark FIN, REC 27,418 -5,526 792 28
Estonia Estonia FIN, REC 8,305 -1,936 0 16
Latvia Latvia FIN, REC -4 -972 0 2
Switzerland Switzerland FIN 12,499 3,804 -870 9
Netherlands Netherlands FIN 47,833 -3,139 689 13
Cyprus CY, RU, RO, SL 2) FIN 14,384 169 -1,189 0
Ukraine Ukraine FIN -2,017 -3,722 0 3
Serbia Serbia FIN -884 -1,362 -14 0
Austria Austria ADM 1 9 0 0
Curacao Eastern Europe REC 0 -433 0 0
Eliminations -3,303 -9,303 344
Total 1,208,858 195,431 -52,519 656
The tables show information per country where Svea Ekonomi is established, i.e. has a physical presence through a subsidiary,
associated company or a branch. The names of subsidiaries and associated companies are provided under notes 20 and 21. The
Parent Company also conducts business in Norway and Finland via the branches Svea Finans NUF and Svea Ekonomi AB respectively.
1) Geographical area refers to Sweden, Germany, the Netherlands and Austria.
2) Geographical area refers to Cyprus, Russia, Romania and Slovakia.
3) Operations comprise FIN = Financial services, REC = Debt recovery services, ADM = Administrative services. FIN and ADM together constitute the AFS operational area.
SVEA EKONOMI AB 61 (63)
Annual Report, 2014
Parent Company
Note 51 Related-parties 31/12/2014 31/12/2013
Income and expenses
Interest income, Group companies
31,697
29,601
Dividends and Group contributions received, Group companies 244,422 129,812
Dividends received, associated companies 5,504 0
Commission income, Group companies -819 -1,132
Other operating income, Group companies 175,646 176,874
Other operating income, associated companies 0 0
Other administrative expenses, Group companies -13,876 -10,432
Other administrative expenses, associated companies -188 0
Total 442,386 324,723
Assets
Lending to the public, Group companies
691,431
603,163
Prepaid expenses and accrued income, Group companies 3,296 2,137
Total 694,727 605,300
Liabilities
Deposits from the public, Group companies
168,225
106,445
Accrued expenses and deferred income, Group companies 1,204 551
Total 169,429 106,996
Assets pledged for own liabilities
For Group companies and associated companies
0
0
Contingent liabilities
Guarantees, Group companies and associated companies
12,210
7,155
Group companies and associated companies
The Parent Company finances the Group companies, which generate interest income, receive dividends and lease personnel to Group companies.
Senior executives, etc.
Disclosures are provided in Note 10 Personnel, etc.
The Board of Directors and CEO hereby certify that the Annual Report and the consolidated accounts have been
prepared in accordance with the IFRS adopted by the EU and the Swedish Annual Accounts Act for Credit Institutions
and Securities Companies (ÅRKL), applying the Swedish Financial Supervisory Authority’s regulations (FFFS 2008:25)
and the Swedish Financial Reporting Board’s recommendations, and provide a true and fair view of the Group’s and the
Parent Company’s financial position and earnings and that the Board of Directors’ Report provides a true and fair
overview of the performance of the Group’s and Parent Company’s operations, financial position and earnings and
describes the significant risks and uncertainties to which the Parent Company and the companies included in the Group
are exposed.
Stockholm 08 May 2015 Ulf Geijer Mats Kärsrud Mats Hellström
Chairman
Anders Ingler Lennart Ågren
CEO
My audit report was submitted on 08 May 2015 Per Fridolin
Authorized Public Accountant
Grant Thornton Sweden AB

Audit Report
To the Annual General Meeting of Svea Ekonomi AB Company registration number 556489-2924
Report on he Annual Report and the consolidated accounts I have audited the annual accounts and consolidated accounts of Svea Ekonomi AB for 2014.
The responsibility of the Board of Directors and the Chief Executive Officer for the annual
accounts and the consolidated accounts
The Board of Directors and the Chief Executive Officer are responsible for the preparation of annual accounts which give a true and fair view in accordance with the Swedish Annual Accounts Act for Credit Institutions and Securities Companies and consolidated accounts which give a true and fair view in accordance with international accounting standards as adopted by the EU, and the Swedish Annual Accounts Act for Credit Institutions and Securities Companies and for such internal control as the Board of Directors and Chief Executive Officer consider necessary for the preparation of annual accounts and consolidated accounts that are free from material misstatement, whether due to irregularities or errors.
The auditor’s responsibility
My responsibility is to express an opinion on the annual accounts and the consolidated accounts on the basis of my audit. I have conducted my audit in accordance with the International Standards on Auditing and generally accepted auditing standards in Sweden. These standards require that I observe professional ethical standards and plan and conduct my audit with the aim of obtaining a reasonable degree of certainty that the annual accounts and consolidated accounts are free from material misstatement.
An audit involves obtaining, through various actions, audit evidence about amounts and other information contained in the annual accounts and the consolidated accounts. The auditor decides which actions to take, partly by assessing the risks of material misstatements in the annual accounts and the consolidated accounts, whether due to irregularities or errors. In this risk assessment the auditor takes into consideration those parts of the internal control that are relevant for how the company prepares its annual accounts and consolidated accounts in order to give a true and fair view for the purpose of devising auditing actions that are appropriate in view of the circumstances, but not for the purpose of expressing an opinion on the efficacy of the company’s internal control. An audit also includes an evaluation of the appropriateness of the accounting principles employed and the reasonableness of the estimates used by the Board of Directors and Chief Executive Officer in the accounts as well as an evaluation of the general presentation in the annual accounts and the consolidated accounts.
I believe that the audit evidence I have obtained is sufficient and adequate as a basis for my opinion.
Opinion
In my opinion the annual accounts have been prepared in accordance with the Swedish Annual Accounts Act for Credit Institutions and Securities Companies and in all material respects give a true and fair view of the financial position of the Parent Company on 31 December 2014 and of its financial results and cash flows for the year in accordance with the Swedish Annual Accounts Act for Credit Institutions and Securities Companies, and that the consolidated accounts have been prepared in accordance with the Swedish Annual Accounts Act for Credit Institutions and Securities Companies and in all material respects give a true and fair view of the financial position of the Group on 31 December 2014 and of its financial results and cash flows for the year in accordance with international auditing standards as adopted by the EU and the Swedish Annual Accounts Act for Credit Institutions and Securities Companies. The Report of the Board of Directors is consistent with the other sections of the annual accounts and the consolidated accounts.

I therefore recommend that the Annual General Meeting adopt the income statements and balance sheets of the Parent Company and the Group.
Report on other statutory and regulatory requirements In addition to my audit of the annual accounts and consolidated accounts, I have also audited the proposal for appropriation of the company’s profit or loss and the Board of Directors’ and Chief Executive Officer’s administration of Svea Ekonomi AB for the year 2014.
The Board of Directors’ and Chief Executive Officer’s responsibility
Under the Swedish Companies Act and the Banking and Financing Business Act, responsibility for the proposal for appropriation of the company’s profit or loss rests with the Board of Directors, and responsibility for the administration rests with the Board of Directors and Chief Executive Officer.
The auditor’s responsibility
My responsibility is to express an opinion, with a reasonable degree of certainty, on the proposal for appropriation of the company’s profit or loss and on the administration on the basis of my audit. I have conducted my audit in accordance with generally accepted auditing standards in Sweden.
As a basis for my opinion on the Board of Directors’ proposal for appropriation of the company’s profit or loss, I have examined the Board’s reasoned opinion and a sample of the evidence for the same in order to be able to determine whether the proposal is consistent with the Swedish Companies Act.
As a basis for my opinion on release from liability, I have, in addition to my audit of the annual accounts and consolidated accounts, examined significant decisions, actions and circumstances of the company in order to be able to determine the liability, if any, to the company of any Director or the Chief Executive Officer. I have also examined whether any Director or the Chief Executive Officer has in any other way acted in violation of the Swedish Companies Act, he Banking and Financing Business Act, the Swedish Annual Accounts Act for Credit Institutions and Securities Companies or the company’s Articles of Association.
I believe that the audit evidence I have obtained is sufficient and adequate as a basis for my opinion.
Opinion
I recommend that the Annual General Meeting appropriate the company’s retained earnings as proposed in the Report of the Board of Directors and grant freedom from liability to the Directors and the Chief Executive Officer in respect of the financial year. Stockholm 08 May 2015
Per Fridolin Authorized Public Accountant