Embed Size (px)
Citation preview

Sustainable Market Share Index™
Research on 2015-2020 IRI Purchasing Data Reveals Sustainability Drives Growth, Survives the PandemicRandi Kronthal-SaccoTensie WhelanUpdated: July 16, 2020

Sustainable Market Share Index™: Executive Summary
We reviewed consumer purchasing of sustainability-marketed products in 36 CPG categories comprising ~40% of the total CPG market* ($). Our findings are:
• Sustainability-marketed products delivered 54.7% of CPG market growth (2015-2019) despite representing only 16.1% share of the category($) in 2019, up +2.4 ppts vs. 2015 (Pgs. 5,6 ). Sustainability-marketed products grew 7.1x faster than products not marketed as sustainable (Pg. 7).
• Sustainabilty marketed products continue to grow despite the COVID-19 pandemic (Pgs. 10-13).
• The market share of sustainability-marketed products aligns along a continuum based on perceived category functionality or efficacy (Pg. 15). Even in categories with low shares, shares of sustainability-marketed products increased.
• Sustainability-marketed branded products enjoy a significant price premium of 39.5%** vs. their conventionally-marketed branded counterparts, with a widening premium of +5.3 pts vs. 2014 (Pgs. 17-20).
• Per capita, the top 5 states for purchases of sustainability-marketed products are NH, ME, MA,VT and CT (Pg. 22).
• Upper income, millennials, college-educated and urban consumers are more likely to buy sustainability-marketed products. In addition, Middle Income, Baby Boomers and Gen Xers contribute a significant percent of sustainable sales (Pgs. 24-27).
*Excluding alcohol and tobacco. **Weighted by $ Sustainable Sales of categories examined
2

Sustainable Market Share Index™: Research QuestionsConsumer packaged goods (CPG) companies are responding to changing generational expectations, including for more sustainable product offerings, yet understanding of sustainable purchasing trends is limited.
The NYU Stern Center for Sustainable Business partnered with IRI, who provided the data pro bono, to assess the following:
1. Have purchases of sustainable products increased over time?
2. Have sustainable purchases been impacted by COVID-19?
3. Are there specific product categories for which the purchases of more sustainable product options out- or under-perform less sustainable alternatives?
4. What is the impact of price on purchases of sustainable products?
5. Are there geographical differences in sustainable purchasing?
6. What is the demographic profile of the sustainable purchaser?
3
Note: This study represents an updated and significantly expanded review of consumer purchasing first presented in March 2019.

Sustainable Market Share Index™: Research Question 1
Research Question 1:
Have purchases of sustainable products increased over time?
Research Result:
Not only are sustainability-marketed products growing but they also are contributing to a disproportionate share of the CPG category growth.
4

Ann
ual $
Sha
re o
f Sus
tain
abili
ty-
Mar
kete
d Pr
oduc
ts
13.7%
16.1%
0%
5%
10%
15%
20%
25%
2015 2019
Sustainable Market Share Index™: Sustainable Market Share
Across all categories studied, sustainability-marketed products account for 16.1%* share of market ($) in 2019, up from 13.7%* in 2015.
* Shares updated due to CSB & IRI re-categorizations; based on 36 categories examined
5
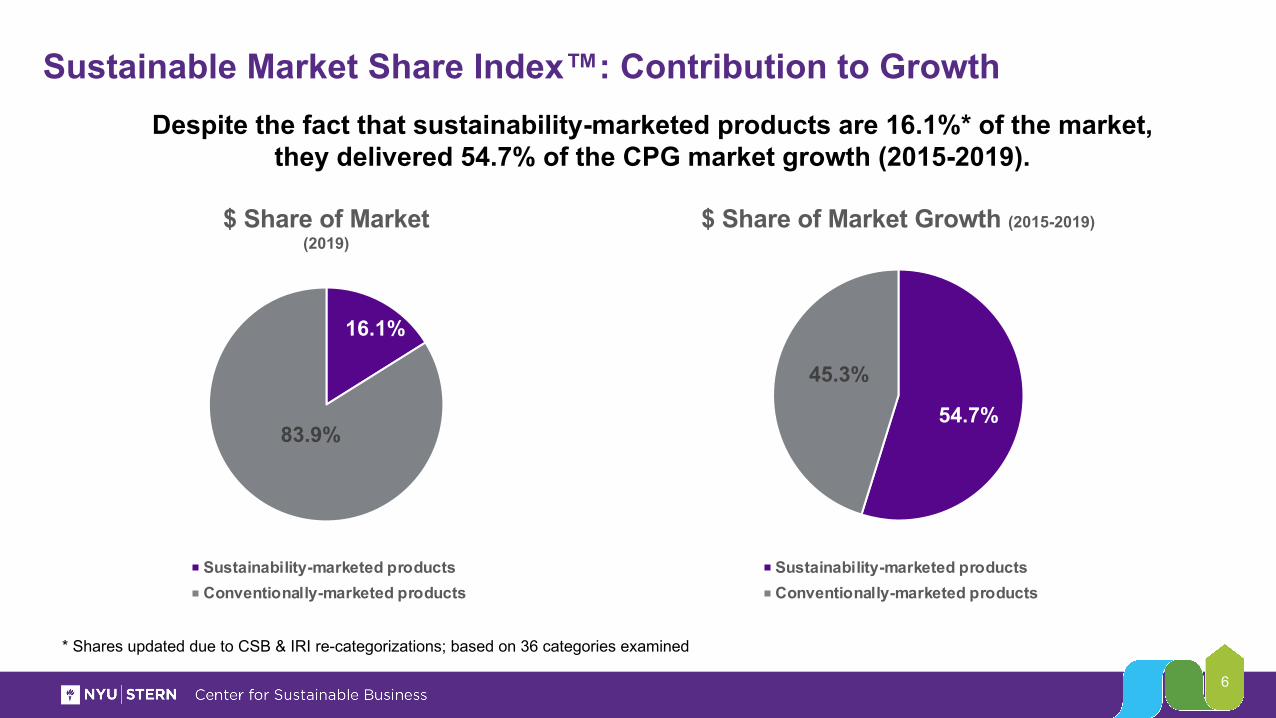
Sustainable Market Share Index™: Contribution to GrowthDespite the fact that sustainability-marketed products are 16.1%* of the market,
they delivered 54.7% of the CPG market growth (2015-2019).
46.9%54.7%
45.3%
$ Share of Market Growth (2015-2019)
Sustainability-marketed productsConventionally-marketed products
16.1%
83.9%
$ Share of Market(2019)
Sustainability-marketed productsConventionally-marketed products
* Shares updated due to CSB & IRI re-categorizations; based on 36 categories examined
6

Sustainable Market Share Index™: Growth RateSustainability-marketed products grew 7.1x faster than conventionally-
marketed products, and 3.8x faster than the CPG market.
46.9%
Note: Based on 36 categories examined
7
100
105
110
115
120
125
130
2015 2016 2017 2018 2019
Sustainablility-marketed products Category Conventionally-marketed products
Total Market 4-YR CAGR:1.56%
Conventionally-marketed 4-YR CAGR:0.83%
Sustainability-marketed4-YR CAGR:5.86%
Inde
x (B
ase
Year
201
5=
100)

Sustainable Market Share Index™: Category PerformanceIn ~90% of individual product categories, the growth of sustainability-marketed
products outpaced the growth of their respective categories.
-30.00%
-10.00%
10.00%
30.00%
50.00%
70.00%
90.00%
110.00%
130.00%
150.00%
Sanita
ry Nap
kins
Laun
dry Care
Floor C
leane
rs
Deodoran
t
Diapers
Soap
Facia l T
issue
Carbonate
d Bev
erages
Skin C
areSou
p
Cookies
Dish D
eterg
ent
Toothp
aste
Pet Tre
ats
Fresh B
read &
Roll
s
Vitamins
Dinner E
ntrees
-FZ
Cereal
Natural C
heese
Weig
ht Con
trol
Bottled
Juice
s
Laun
dry Dete
rgent
Crack
ers
Sal ty S
nack
s
Food and
Tras
h Bag
s
Coffee
Chocola
te Can
dy
Energy
Drin
ks
Pet Fo
odYog
urt
Househ
old C
leane
rMilk
Paper
Towels
Toilet
Tissue
Cups an
d Plates
Paper
Napkin
s
Sustainability-marketed products
Category
% C
hang
e in
Sal
es (2
015-
19)
** * * *
*Note: Actual sales growth for sustainability-marketed products in these categories from 2015-19 were 1019%, 901%, 545%, 449%, 280%, 197% and 160%, respectively
* *
* Paper towels, cups and plates, toilet tissue and paper napkins lost share to private label. Because we did not have visibility into private label to ascertain if there were claims regarding sustainability, we had to assume they were not marketed as sustainable. So, in fact, if private labels were making claims of sustainability (as we have observed they do on shelf), these categories may not have seen share decline of sustainability-marketed products.
8

Sustainable Market Share Index™: Research Question 2
Research Question 2:
Have sustainable purchases been impacted by COVID-19?
Research Result:
• Purchases of sustainability marketed products continue to grow in the face of the pandemic.
9

Sustainable Market Share Index™: 2020 Dollar Sales
10
Both sustainability-marketed and total category sales grew significantly and similarly the week ending March 15th
80.00
100.00
120.00
140.00
160.00
180.00
Week E
nd 01
-05-20
Week E
nd 01
-12-20
Week E
nd 01
-19-20
Week E
nd 01
-26-20
Week E
nd 02
-02-20
Week E
nd 02
-09-20
Week E
nd 02
-16-20
Week E
nd 02
-23-20
Week E
nd 03
-01-20
Week E
nd 03
-08-20
Week E
nd 03
-15-20
Week E
nd 03
-22-20
Week E
nd 03
-29-20
Week E
nd 04
-05-20
Week E
nd 04
-12-20
Week E
nd 04
-19-20
Week E
nd 04
-26-20
Week E
nd 05
-03-20
Week E
nd 05
-10-20
Week E
nd 05
-17-20
Week E
nd 05
-24-20
Week E
nd 05
-31-20
Week E
nd 06
-07-20
Week E
nd 06
-14-20
Inde
x vs
Wee
k of
1-0
5-20
*Sustainability-Marketed Products and Total Category $ Index
Category $ Sustainability-Marketed Products $* Index vs 100

Sustainable Market Share Index™: Sustainable Shares: COVID-19Shares of sustainability-marketed products grew significantly the week of March 15th and have continued to maintain share through
mid-June
16.13%
16.39% 16.87% 17.38%
19.32%
16.81%
16.86%
16.87%
16.53% 16.94%
16.94%
16.64%
16.40%
16.37%
16.18%
10.00%
12.00%
14.00%
16.00%
18.00%
20.00%
22.00%
24.00%
Year End2019
8 WeeksEnd 2-23-
20
WeekEnd 03-
01
WeekEnd 03-
08
WeekEnd 03-
15
WeekEnd 03-
22
WeekEnd 03-
29
WeekEnd 04-
05
WeekEnd 04-
12
WeekEnd 04-
19
WeekEnd 04-
26
WeekEnd 05-
03
WeekEnd 05-
10
WeekEnd 05-
17
4 WeeksEnd 6-14
Sustainability-Marketed Product Share
11

-1.00
-0.50
0.00
0.50
1.00
1.50
2.00
2.50
3.00
3.50
4.00
Cer
eal
Deo
dora
nt
Coo
kies
San
itary
Nap
Sou
p
Cra
cker
s
Dia
pers
Floo
r C
lean
ers
Laun
dry
Car
e
Food
& T
rsh
Bg
Pet
Tre
ats
Ene
rgy
Drin
ks
Toot
hpas
te
Laun
dry
Det
Car
b B
ev
Vita
min
s
Din
Ent
rees
Sal
ty S
nack
s
Cup
s an
d Pl
ates
Pet
Foo
d
Dis
h D
eter
gent
Bot
tled
Juic
es
Cho
cola
te
Yog
urt
Nat
ural
Che
ese
Hou
se C
lean
er
Fres
h B
read
Faci
al T
issu
e
Milk
Ski
n C
are
Pap
er N
ap
Soa
p
Toile
t Tis
sue
Wei
ght C
ontro
l
Cof
fee
Pap
er T
owel
s
Sustainable Market Share Index™: March 15 share performancePaper goods, skincare and food items drove the
greatest week to week share increases (week ending March 15 vs prior week).
12
Shar
e ch
ange
wee
k en
ding
Mar
ch 1
5 vs
. prio
r per
iod

Sustainable Market Share Index™: YTD Sustainable Market ShareSustainability-marketed products now account for 16.8% YTD, +.6pts vs. 2019
Ann
ual $
Sha
re o
f Sus
tain
abili
ty-
Mar
kete
d Pr
oduc
ts
13.66%*
16.13%*16.77%**
0%
5%
10%
15%
20%
25%
2015 2019 2020 YTD**
* Shares updated due to CSB & IRI re-categorizations** January-June 15th, 2020
13

Sustainable Market Share Index™: Research Question 3
Research Question 3:
Are there specific product categories where the purchases of more sustainable product options out or underperform less sustainable alternatives?
Research Result:
• Yes. Categories that demand high functionality (e.g., detergent) do not have a large percentage of sustainable purchases, but nevertheless experienced share growth.
• Conversely, categories with low functionality demands (e.g., dairy) have higher category consumption.
14

Sustainable Market Share Index™: Shares of Sustainable Products
0%
10%
20%
30%
40%
50%
60%
70%
80%
Food an
d Trash
Bags
Carbonate
d Bev
erages
Energy D
rinks
Pet Foo
d
Pet Treats
Laund
ry Detergen
t
Laund
ry Care
Chocolate C
andy
Toothpa
ste
Sanita
ry Nap
kins
Cookies
Diapers
Paper
Napkin
s
Cups and
Plates
Deodora
nt
Househo
ld Clean
er
Dish D
etergent
Dinner Entr
ees -
FZ
Vitamins
Salty S
nack
s
Paper
Towels
Weight Contr
ol
Soup
Floor Clean
ers
Fresh Bread
& Rolls
Cracke
rs
Cereal
Skin C
are
Natural C
heese
Coffee
Soap
Bottled J
uices Milk
Facial T
issue
Yogurt
Toilet T
issue
2019
Sus
tain
abilit
y-M
arke
ted
Prod
ucts
$ S
hare
of C
ateg
ory >20% Share
Toilet TissueYogurtFacial TissueMilkBottled JuiceSoapCoffeeNatural CheeseSkin Care
5%- 20% ShareCerealCrackersFresh BreadFloor CleanerSoupWeight ControlPaper TowelsSalty SnacksVitaminsFrozen DinnerDish DetergentHousehold CleanerDeodorantCups and PlatesPaper Napkins
<5% ShareDiapersCookiesSanitary NapkinsToothpasteChocolateLaundry CareLaundry DetergentPet TreatsPet FoodEnergy DrinksCarbonated BevTrash Bags
15

Sustainable Market Share Index™: Research Question 4
Research Question 4:
What is the impact of price on purchases of sustainable products*?
Research Result:
• Despite significant price premiums, sustainability-marketed products grew far faster than the conventionally branded players and had lower price sensitivity in 2/3rds of the categories examined.
Analysis conducted was among branded players and excluded store brand/private label; based on 36 categories examined
16

34.21%39.46%
0%
5%
10%
15%
20%
25%
30%
35%
40%
45%
50%
2014 2018
Sust
aina
bilit
y-M
arke
ted
Prod
ucts
’ Pric
e Pr
emiu
m
vs. C
onve
ntio
nally
-Mar
kete
d Pr
oduc
ts
+ 5.3pts
Sustainable Market Share Index™: Price PremiumSustainability-marketed products enjoyed a sizeable price premium at
39%* over conventionally-marketed products, and increased +5.3 pts since 2014
*Weighted by $ Sustainable Sales of categories examined; analysis excluded store brand/private label
17

-58%
-33%-27%
-19%
-5%
3% 3%14% 18% 20% 21% 22% 22% 23%
28% 29% 32% 32% 35%42% 46% 47% 49% 50% 50%
56%
74%80%
100%
112% 114%123%
134% 135%
165%
-75%
-50%
-25%
0%
25%
50%
75%
100%
125%
150%
175%
Paper Napki
ns
Skincar
e
Paper Towels
Vitamins
Dish Dete
rgent
Laundry Dete
rgent
Energy D
rinks
Facial Ti
ssues
Salty Snack
sMilk
Household
Cleaner
Natural
Cheese
Deodorant
Foods and Tras
h Bags
Diapers
Weight C
ontrol
Floor C
leaners
SoapCere
alSoup
Yogurt
Cups & Plate
s
Fresh B
read &
Rolls
Chocolate
Toothpast
e
Crackers
Sanitary N
apkins
Bottled Ju
ices
Coffee
Dinner E
ntrees
Cookies
Pet Treats
Pet Food
Laundry Care
Carbonated
Beverages
2018
Sus
tain
abilit
y-M
arke
ted
Prod
ucts
’ Pric
e Pr
emiu
m/D
isco
unt
Sustainable Market Share Index™: Price Premium by CategoryPrice premiums ranged from 3% to over 150%. Only a few categories
had a price discount vs. conventionally-marketed products.
18

21.37%
2.95%
0%
5%
10%
15%
20%
25%
$ Sa
les
% G
row
th (E
x-Pr
ivat
e La
bel)
2014
-201
8
Sustainability-Marketed Products Conventionally-Marketed Products
Sustainable Market Share Index™: Growth of Sustainable Branded PlayersAmong branded players, sustainability-marketed products grew over 7x faster than conventionally-marketed products, indicating consumers’ willingness to
pay higher prices.
7X
19

Sustainable Market Share Index™: Price SensitivitySustainability-marketed products had lower price sensitivity in most categories studied: Food categories had the greatest price leverage.
-3
-2
-1
0
1
2
3
4
5
6
Diapers
Dinner
Entree
s
Cereal
Pet Foo
d
Dish D
eterge
nt
Pet Trea
ts
Yogurt
Fresh B
read a
nd R
olls
Natural
Che
ese
House
hold
Cleane
r
Carbon
ated B
evera
ges
Energy
Drin
ks
Weight C
ontro
l
Cookie
s
Crackers
Choco
late
Coffee
Salty S
nack
s
Bottled
Juice
s
Floor C
leane
rs
Sanita
ry Nap
kins
Soup
Milk
Deodo
rant
Soap
Paper
Towels
Facial
Tiss
ues
Vitamins
Skinca
re
Laun
dry C
are
Food T
rash B
ags
Cups &
Plates
Paper
Napkin
s
Toothp
aste
Laun
dry D
eterge
nt
Toilet
Tissu
e
Diff
eren
ce in
Ela
stic
ity b
etw
een
Sust
aina
bilit
y-M
arke
ted
and
Con
vent
iona
lly-M
arke
ted
Prod
ucts
Price sensitivity is the % change in volume due to a 1% change in price.
Less Sensitive to Price More Sensitive to Price
20

Sustainable Market Share Index™: Research Question 5
Research Question 5:
Are there geographical differences in sustainable purchasing?
Research Result:
• Yes. The top 5 states in terms of per capita* basis spending of sustainability-marketed products are New Hampshire, Maine, Massachusetts, Vermont, and Connecticut; the bottom five are Mississippi, Utah, Texas, Alabama and Kentucky
• Measured by state-wide purchases, however, California, Florida, Texas, New York, and Pennsylvania top the ranking in terms of total sustainable dollars spent due to the size of the states.
*STI: PopStats; based on 36 categories examined
21

Sustainable Market Share Index™: Geography
22

Sustainable Market Share Index™: Research Question 6
Research Question 6:
What is the demographic profile of the sustainable purchaser*?
Research Result:
• Millennials, upper income, college-educated and more urban cohorts are more likely to buy sustainability-marketed products.
• Baby Boomers, Gen Xers, upper and middle income, college educated and urban cohorts account for the bulk of the sustainable dollars spent.
Analysis conducted using IRI HH panel data; based on 35 categories examined23

The younger the household, the more likely they were to buy sustainability-marketed products. However, most sustainability-marketed product purchases came from Gen X
and Boomers.
Total CPG Sustainable Sales
Composition
Millennials 25%
Generation X 32%
Boomers 33%
Seniors & Retirees 10%
Sustainable Market Share Index™: Generational Cohorts
Chart read as: Millennials purchased a significantly higher percent (>1.2x) of their Carbonated Beverage purchases on sustainability-marketed products, than did Average HHs.
Index 120+Index 80-120Index <80
24

The higher the education, the more likely they were to buy sustainability-marketed products. Most of the sustainability-marketed product sales came from College graduates
or those with some college education.
* 7% had no female present
Total CPG Sustainable Sales
Composition*
Post Graduate
School17%
Graduated College 33%
Some College 25%
Graduated High School 16%
Some High School or
Less2%
Sustainable Market Share Index™: Household Education
Chart read as: Female HH who attended Post Graduate School purchased a significantly higher percent (>1.2x) of their Carbonated Beverage purchases on sustainability-marketed products, than did Average HHs.
Index 120+Index 80-120
Index <80
25

The higher the household income, the more likely they were to buy sustainability-marketed products. Upper/middle income made up the highest percent of sustainability-
marketed product dollars spent.
Total CPG Sustainable Sales
Composition
Upper 38%
Middle 39%
Lower 22%
Sustainable Market Share Index™: Income Tiers
Chart read as: Upper Income Households purchased a significantly higher percent (>1.2x) of their Carbonated Beverage purchases on sustainability-marketed products, than did Average HHs.
Index 120+Index 80-120
Index <80
26

The more urban the residence, the more likely the purchases of sustainability-marketed products. County A accounted for just under half of the total CPG
sustainability-marketed dollars spent.
Total CPG Sustainable Sales
Composition
Coun
ty A
44%
Coun
ty B
30%
Coun
ty C
/D
26%
Sustainable Market Share Index™: Urbanicity
Chart read as: County A purchased a significantly higher percent (>1.2x) of their Carbonated Beverage purchases on sustainability-marketed products, than did Average HH’s.
Index 120+
Index 80-120Index <80
27

Additional Research Planned
Early 2021, the NYU Stern Center for Sustainable Business will release:• The full year impact of COVID-19 on sustainability-marketed product purchases.• The impact of a narrowing price gap between sustainability-marketed products and
conventionally-marketed products on volumes as well as a detailed analysis of price elasticity.
28

About the NYU Stern Center for Sustainable BusinessThe NYU Stern Center for Sustainable Business was founded on the principle that sustainable business is good business; delivering better financial results while protecting the planet and its people. We aim to help current and future business leaders embrace proactive and innovative mainstreaming of sustainability, resulting in competitive advantage and resiliency for their companies as well as a positive impact for society.
Randi Kronthal-Sacco is a Senior Scholar, Marketing and Corporate Outreach for the NYU Stern Center for Sustainable Business. Ms. Kronthal-Sacco was a senior executive at Johnson & Johnson and is a Stern alumna.
Tensie Whelan is a Clinical Professor at NYU Stern and Founding Director of the NYU Stern Center for Sustainable Business.
Please contact [email protected] or [email protected] with any comments or questions.
29

AcknowledgmentsThe NYU Stern Center for Sustainable Business would like to thank the IRI organization for the generous donation of its data.
A special thank you to IRI’s Larry Levin, Executive V.P., Market and Shopper Intelligence. We also are grateful for the support of Jeanne Livelsberger, Executive Vice President and co-Leader of IRI’s Market and Shopper Intelligence Center of Excellence, and Sheila Noojibail, Vice President and leader of IRI’s Shopper Intelligence Platform.
We would like to acknowledge the research support of NYU Interns Dorea Novaez, Alexandra Walstad, Samuel Wallace, Ethan Ou, Jessica Tou, Patrick Wu, and Anirudh Dave as well as market research consultants Elena Kanner and Biren Shah.
30

Appendix

MethodologyData
• IRI Point of Sale and HH panel data in all measured channels in U.S. excluding alcohol and tobacco
Selection Criteria
• 36 categories examined held the largest dollar volume; in a few cases, smaller categories were included to ensure fair representation of all major CPG segments
• 73,293 products reviewed; products with 0.00 dollar share of category were not considered unless identified as organic.
• Due to lack of visibility into private label product claims, private label was not included as sustainability-marketed, with the exception of organic private label in the food categories.
Sustainability-Marketed Products Determination
• Identified all skus for each category marketed as sustainable with on-package communication, e.g. 3rd party certification (e.g. USDA Organic), containing organic ingredients, no phosphates, no phthalates, etc.
• Sustainability determination focused on the product itself, not the recyclability of the package.
• A very conservative approach was adopted. For example, the following was not considered sustainable:• Natural with no other sustainable identification• Recyclable packaging
Other Assumptions/Information
• Products that were deemed sustainability-marketed in 2018 were considered sustainability-marketed in 2015. This likely depressed the growth numbers.
• We made no attempt to assess if products marketed as sustainable were, in fact, sustainable. Instead, we focused on whether the marketing of a product as sustainable would drive purchase.
All estimates and analysis in this paper based on Information Resources Inc., data are by the authors and not by Information Resources, Inc.
32