Embed Size (px)
Citation preview
Sustainable and equitable transportation in Latin America, Asia and Africa: The challenges of integrating BRT and private transit services
Written and edited by Dan Chatman, Lisa Rayle, Manuel Santana Palacios, and Robert Cervero With additional chapter co-authors: Kelan Stoy, Abigail Cochran, Corwin Bell, Ulises Hernández Jiménez, Eleanor Leshner, Francisco Trejo Morales, Raleigh McCoy, and Emily Roach Special thanks to Roger Behrens, Aaron Golub, Herrie Schalekamp, Julian Arellana and Victor Cantillo
UC Berkeley Center for Future Urban Transport Institute of Transportation Studies
Institute for Urban and Regional Development Department of City and Regional Planning
University of California, Berkeley June 22, 2019

2
Table of Contents Preface and Acknowledgments ........................................................................................... 4
SECTION I: Overview of the Study and Report ................................................ 6Chapter 1 Introduction ......................................................................................................... 7Chapter 2 Literature Review............................................................................................... 11
Private Transit and Paratransit: And Overview of Benefits, Challenges, and Costs ........... 11Bus Rapid Transit: Arguments for Its Implementation, and Benefits and Challenges ........ 12Arguments for BRT ........................................................................................................... 13Challenges of BRT Implementation ................................................................................... 14Operational integration with BRT and private transit ......................................................... 17Fare integration ................................................................................................................. 18
Chapter 3 Research Approach & Methods ........................................................................ 20
SECTION II: CASE STUDIES ............................................................................ 22Chapter 4 Case study: Barranquilla .................................................................................. 25
Formalization attempts and current BRT-private transit integration plan: Missing elements and further challenges ...................................................................................................... 35
Chapter 5 Case study: Cape Town .................................................................................... 38Public transport and paratransit prior to BRT .................................................................... 41Cape Town’s BRT, MyCiTi ................................................................................................ 45Intended and actual BRT-paratransit integration ............................................................... 50
Chapter 6 Case study: Dar es Salaam ............................................................................... 55Fragmented Mass Transit ............................................................................................... 56Modernizing Transit with BRT........................................................................................ 58BRT Operations, System Design and Interim Services ................................................ 59Paratransit Integration and Displacement ......................................................................... 60Vehicle Scrappage ............................................................................................................ 63Other Challenges to BRT-Paratransit Integration .............................................................. 64Transitioning to a Formal BRT System.............................................................................. 65
Chapter 7 Case study: Jakarta ........................................................................................... 67TransJakarta BRT ............................................................................................................. 68Paratransit: Complements or Competitors?....................................................................... 69BRT-Minibus Integration ................................................................................................... 71Ramping Up to Direct Minibus Services and BRT-Minibus Integration .............................. 75Experiences to Date and Lessons ..................................................................................... 78
Chapter 8 Case study: Quito .............................................................................................. 81Quito’s Metropolitan Area Public-Private Transit System Overview ................................... 84Bus Rapid Transit Evolution: Local Politics and System Fragmentation ............................ 89Private-Public Transit Integration Plan: Description, Challenges, and Missing Links ......... 91
SECTION III: Data Collection and Analysis in Barranquilla and Cape Town 94Chapter 9 Survey data analysis: Comparing travel time changes in Barranquilla and Cape Town .......................................................................................................................... 95
Methods ............................................................................................................................ 95Commute time changes .................................................................................................. 103
3
Non-work travel time changes ......................................................................................... 111Chapter 10 Perspectives from Barranquilla residents ................................................... 119
Methods .......................................................................................................................... 119Findings .......................................................................................................................... 122
Chapter 11: Perspectives from Cape Town residents .................................................... 132Findings .......................................................................................................................... 135
Discussion ........................................................................................................................ 155
SECTION IV: Conclusions .............................................................................. 157Chapter 12 Summary of Findings .................................................................................... 158
Case study findings......................................................................................................... 159Findings from survey data in Barranquilla and Cape Town ............................................. 162Findings from qualitative interviews with residents in Barranquilla and Cape Town......... 164
Chapter 13 Policy Implications, Research Needs, and Conclusions ............................ 166Policy implications........................................................................................................... 167Research needs .............................................................................................................. 168Conclusions .................................................................................................................... 169
References ........................................................................................................................ 171
4
Preface and Acknowledgments The genesis of this study was in a 2013 proposal to the Volvo Research and Educational Foundations by Dan Chatman and Robert Cervero of UC Berkeley along with Aaron Golub of Portland State University and Roger Behrens and Herrie Schalekamp of the University of Cape Town. We are grateful to the Volvo Research and Education Foundations for the grant that made field work possible between 2014 and 2016, and that funded graduate students Lisa Rayle, Manuel Santana Palacios and Kelan Stoy at UC Berkeley. Special thanks to Henrik Nolmark, executive director at VREF, and Fabienne Niklasson for their substantive, administrative, and moral support, including the opportunity to present the work at the Mobilize conference in Santiago de Chile in June 2017 and in Dar es Salam, Tanzania, in July 2018. For the institutional case studies, we interviewed dozens of transport providers and experts. Barranquilla’s case study was possible thanks to the information provided by Adriana Sarmiento of the Colombian National Planning Department, Barranquilla’s Mobility Secretariat staff, Raul Ramos of Monteria Ciudad Amable, representatives of Metrocaribe and SISTUR – the two companies that operate the BRT routes in Barranquilla, and representatives of the three-wheeled taxis and private transit buses. Special thanks to Federico Diaz from Transmetro and Victor Cantillo from Universidad del Norte who helped us scheduling some of the interviews in Barranquilla. Many thanks to Julio Echeverria, Diego Carrion, Cesar Arias, Cristobal Buendia, Freddy Paredes, and Julie Gamble who provided information for the Quito case. Thanks to Yoga Adiwinarto from ITDP Indonesia for providing valuable information for the Jakarta case and representatives of the City of Cape Town and taxi associations for providing information for the Cape Town case. For the survey data & analysis chapter, Kelan Stoy helped design the survey template and managed the implementation of the Barranquilla survey. Special thanks to Roger Behrens, Herrie Schalekamp, and Bulelwa Mayende for making the survey work possible in Cape Town, and to Victor Cantillo and Julian Arellana for making the survey work possible in Barranquilla. Thanks to Federico Díaz for providing valuable data. Many thanks to our field survey administrators in Cape Town, Claire Birungi, Xoliswa Gqola, Xochiwe Jere, Mercy King’Ori, Graeme Leighton, Sakhumzi Mbulawa, and Mzanya Ndibongo; in Barranquilla, Tamara Sam, Adriana Russill, Astor Andres Dominguez, Evelin Arias, Sergio Iguaran, Silvana Sinin, Yoheilein Valbuena, Edgardo Uhia Aroca, Gisell Herrera, Julio Cantero Durango, and Oswaldo Figueroa. Chapter 10 is based on a longer studio report written by the listed co-authors along with Kelan Stoy, Evelyne St Louis, Mwikali Mbilo, and Dana Rubin. Additional funding for the studio was provided by the U.C. Berkeley Department of City and Regional Planning. The studio course was conceived and supervised by Dan Chatman. Kelan Stoy helped coordinate and organize the studio logistics with assistance from Manuel Santana Palacios. Special thanks to Professors Victor Cantillo and Julian Arellana of Universidad
5
del Norte in Barranquilla, Colombia, for helping to recruit local interviewers and for giving advice about interviewee recruitment. Thanks also to Ruby Rubio, Communications Manager, and Federico Paz, Head of Modeling, both at Transmetro S.A., for their advice and feedback on the project and for making on-board interviews possible. Special thanks to those who, in addition to the co-authors of the chapter, carried out field work and transcription: U.C. Berkeley students Dana Rubin, Evelyne St-Louis, Kelan Stoy, and Mwikali Mbilo, and students at Universidad del Norte: Javier Cantillo, Stephanie Fernandez, Andrea Martinez, Kelly Rendon, Ruben Rodriguez, Alejandra Salazar, and Maria Alejandra Saltarín.

6
SECTION I: Overview of the Study and Report

7
Chapter 1 Introduction Millions, even billions, of people living in cities around the world rely on privately owned and operated, loosely-regulated or unregulated shared transport to access their everyday needs. We refer to such services as “private transit” and “paratransit.” 1 Private transit services are sometimes provided using 50- to 24-seat buses, often by structured companies that are regulated by the state. “Paratransit” is a subset of private transit consisting of smaller vehicles that are typically more loosely regulated or illegal. Convenient and relatively affordable, the wide range of paratransit services includes vehicles of widely different types, ranging from 20 seat buses to one-seat motorcycle taxis, which in different parts of the world are referred to using such iconic terms as “colectivos,” “matatus,” “tuk-tuks,” “mototaxis,” and “combis.” While providing essential mobility in many cities, particularly for lower-income households, private transit services also contribute to road congestion and air pollution, and often have poor safety records.2 Paratransit services have a long history in cities throughout the world, including “jitneys” and “gypsy cabs” in the United States, where they were largely outlawed in the early 1900s in favor of a regulated system of taxi service.3 A more recent invention, bus rapid transit (BRT) is a completely different form of shared transport. Like private transit, the practice of BRT varies substantially. It generally consists of publicly-organized bus service with operational characteristics intended to increase operating speed and thus enable high frequency. Though it is constructed and administered by public agencies, in many cases private firms are contracted to provide service. So-called “gold standard” BRT has a dedicated right-of-way, off-board fare collection on dedicated platforms, high-capacity vehicles (often including articulated buses), multiple door and level entrances and exits to the vehicles, and traffic signal prioritization.4 BRT was conceived as a lower-cost alternative to heavy rail or light rail services, and it has the potential to carry almost as many passengers along some corridors as some rail system would.5
1 Cervero, Informal Transport in the Developing World. 2 Cervero and Golub, “Informal Transport.” 3 Cervero, Paratransit in America. 4 “The BRT Standard.” 5 Lindau, Modeira da Silva, and Facchini, “Global Overview of BRT and Bus Corridors.”
8
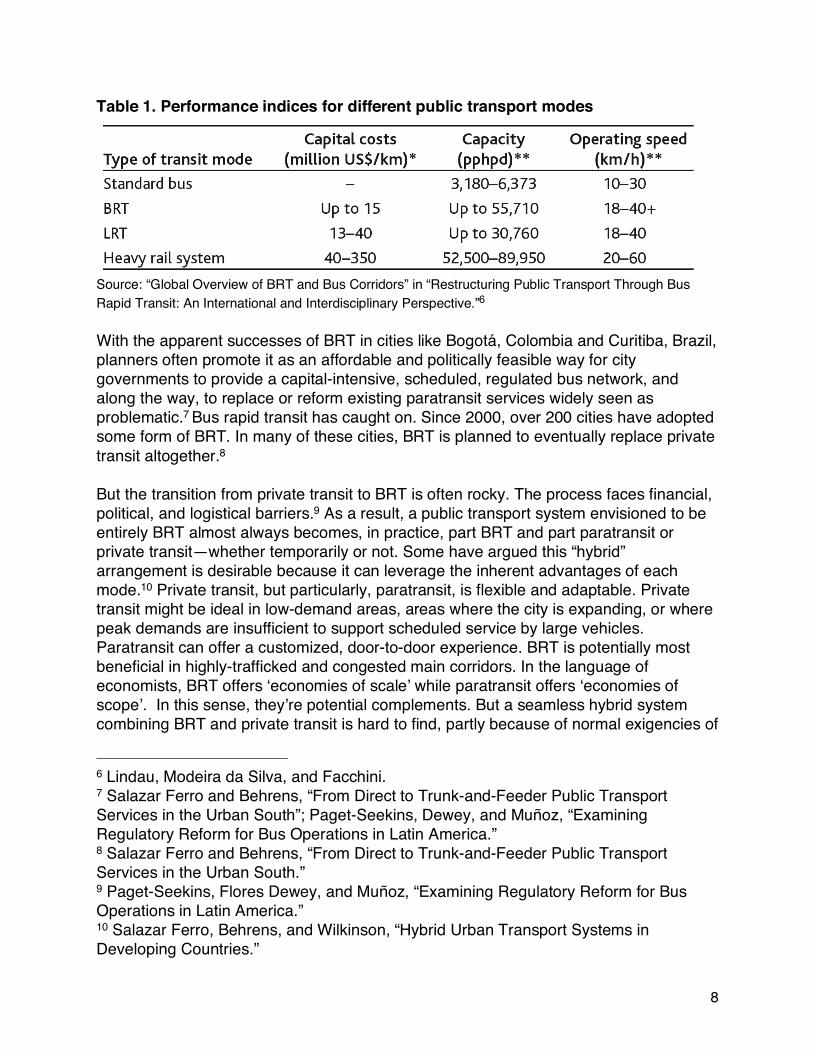
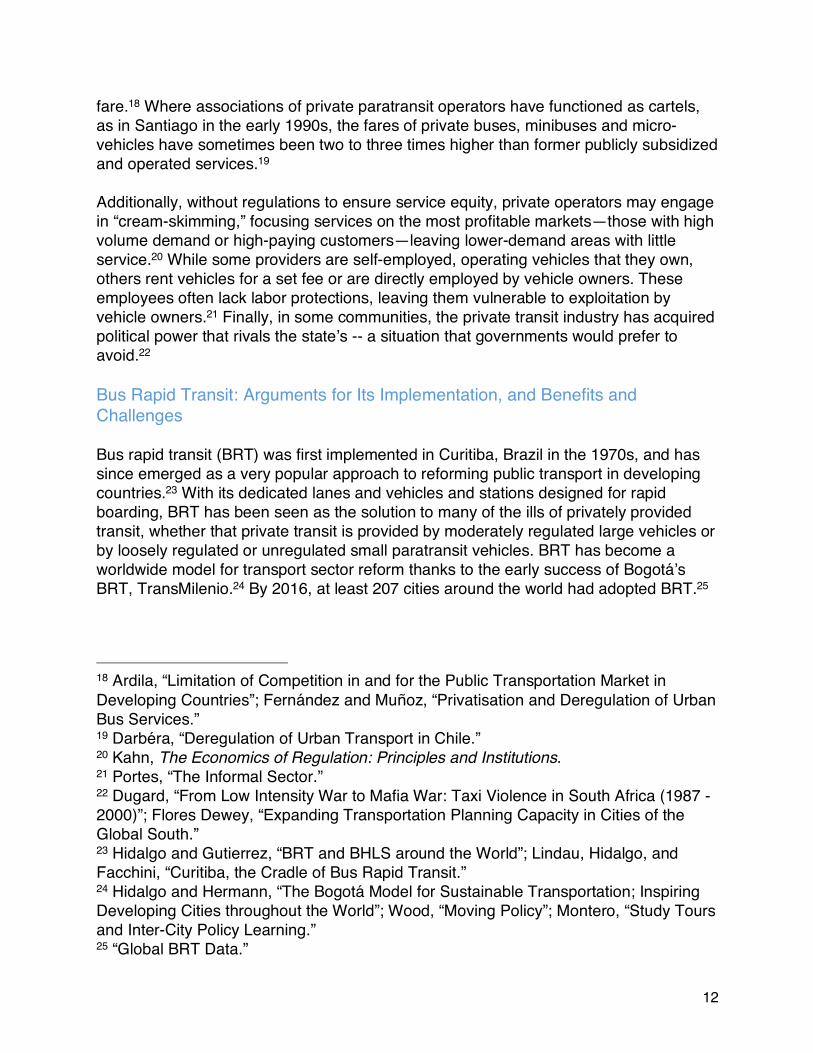
Table 1. Performance indices for different public transport modes
Source: “Global Overview of BRT and Bus Corridors” in “Restructuring Public Transport Through Bus Rapid Transit: An International and Interdisciplinary Perspective.”6 With the apparent successes of BRT in cities like Bogotá, Colombia and Curitiba, Brazil, planners often promote it as an affordable and politically feasible way for city governments to provide a capital-intensive, scheduled, regulated bus network, and along the way, to replace or reform existing paratransit services widely seen as problematic.7 Bus rapid transit has caught on. Since 2000, over 200 cities have adopted some form of BRT. In many of these cities, BRT is planned to eventually replace private transit altogether.8 But the transition from private transit to BRT is often rocky. The process faces financial, political, and logistical barriers.9 As a result, a public transport system envisioned to be entirely BRT almost always becomes, in practice, part BRT and part paratransit or private transit—whether temporarily or not. Some have argued this “hybrid” arrangement is desirable because it can leverage the inherent advantages of each mode.10 Private transit, but particularly, paratransit, is flexible and adaptable. Private transit might be ideal in low-demand areas, areas where the city is expanding, or where peak demands are insufficient to support scheduled service by large vehicles. Paratransit can offer a customized, door-to-door experience. BRT is potentially most beneficial in highly-trafficked and congested main corridors. In the language of economists, BRT offers ‘economies of scale’ while paratransit offers ‘economies of scope’. In this sense, they’re potential complements. But a seamless hybrid system combining BRT and private transit is hard to find, partly because of normal exigencies of
6 Lindau, Modeira da Silva, and Facchini. 7 Salazar Ferro and Behrens, “From Direct to Trunk-and-Feeder Public Transport Services in the Urban South”; Paget-Seekins, Dewey, and Muñoz, “Examining Regulatory Reform for Bus Operations in Latin America.” 8 Salazar Ferro and Behrens, “From Direct to Trunk-and-Feeder Public Transport Services in the Urban South.” 9 Paget-Seekins, Flores Dewey, and Muñoz, “Examining Regulatory Reform for Bus Operations in Latin America.” 10 Salazar Ferro, Behrens, and Wilkinson, “Hybrid Urban Transport Systems in Developing Countries.”
9
real-world operation, but also because of difficulties both with successfully regulating private transit and with successfully financing the BRT system in the face of substantial capital and operating costs—even if those costs are not as high as a conventional rail system would be. Much of the literature on the policy decisions and the transition processes from private transit to BRT focuses on relationships between the government and the public transport industry, and the extent to which BRT provides efficient services along the high-frequency corridors that are its focus.11 A broader test of whether new BRT has been successful is whether travelers are better off after the change—both those who use the BRT system as well as those who do not use BRT but are affected by the restructured system. How does newly provided BRT, along with a transition away from private transit, affect travelers specifically, and residents in general? Who benefits, and in what ways; and who does not? These are critical questions. Global urbanization has the potential to significantly decrease per capita GHG emissions, increase affluence, decrease morbidity and mortality, and increase educational attainment. A large share of the global urban population, and an even larger share of expected population growth, is in cities that seem likely to adopt BRT and reconfigure private transit, or have recently done so. The success or failure of these efforts will heavily influence the environmental sustainability and social welfare of urbanization. Thus, integrating BRT and private transit is an extraordinarily important policy topic worldwide. The focus of this report is therefore as follows:
• User benefits and costs. Who is helped by new BRT and reconfigured private transit? Who is not? What are the potential equity issues?
• Changes in accessibility. What are the challenges in increasing accessibility broadly when introducing BRT and reforming existing private transit? A related and very important question is how to best measure changes in accessibility.
• Environmental sustainability. The critical environmental sustainability issue in the transport and land use sphere is limiting greenhouse gas production and other pollutants caused by energy-intensive travel patterns. In the developing world, for the foreseeable future, this means forestalling the move toward private auto and motorcycle ownership and use. Are new BRT-plus-private-transit systems more or less competitive with autos and motorcycles than a regulated and/or subsidized private transit system would be?
The remaining of this report is organized in as follows. In Chapter 2 we summarize the literature we consider relevant to provide a background to subsequent chapters.
11 Flores Dewey, “Expanding Transportation Planning Capacity in Cities of the Global South”; Paget-Seekins and Tironi, “The Publicness of Public Transport.”
10
Chapter 3 consist our methodological approach. Section II, Chapters 4 to 8, consists of the five case studies, which explains the economic and demographic contexts, along with institutional and implementation challenges, of BRT and private transit integration in Barranquilla, Quito, Cape Town, Dar es Salaam, and Jakarta. Section III, Chapters 9 to 11, focuses on analysis of intercept surveys and qualitative interviews that we conducted in Barranquilla and Cape Town. Conclusions and policy implications are presented in Section IV.
11
Chapter 2 Literature Review Private Transit and Paratransit: And Overview of Benefits, Challenges, and Costs Private transit, and particularly paratransit, has many advantages for urban residents and city governments. It can offer convenient, flexible, demand-responsive service at an affordable price, while employing lower-skilled workers that would face difficulties finding work in the formal economy.12 By operating smaller vehicles, paratransit providers can adjust capacity as demand changes, and without fixed infrastructure, operators can adapt routes to meet demand. With low labor and operational costs, providers can keep fares low and adjust supply as demand increases. Private transit requires little if any subsidy or capital investment, aside from basic road provision, making it affordable for resource-constrained governments.13 Additionally, the private transit industry, and particularly the paratransit sector, provides income-earning opportunities for low-skilled workers with few other employment options. Despite these benefits, private transit also presents numerous challenges for cities. Private transit is seen as contributing to road congestion, air pollution, and road accidents—particularly smaller paratransit vehicles. Private transit services have been variously criticized for having poor service quality, for being nonresponsive to user complaints, for exploiting drivers, and for unfairly discriminating against some users.14 It has been argued that in places with high demand and low barriers to market entry, too many private transit companies and vehicles enter the market, exacerbating road congestion. Private transit vehicle owners often incentivize their drivers to pick up as many passengers as possible, which can result in aggressive driving and increased accidents.15 Paratransit often has poor safety records, and public perception is generally negative.16 Outdated and poorly maintained vehicles exacerbate air pollution and cause more accidents.17 It is even argued that paratransit fares are priced higher than they would be in an efficient market, because time-sensitive passengers who lack information about vehicle arrival times will tend to take whatever vehicle arrives first, even if it has a higher
12 Vasconcellos, Urban Transport Environment and Equity; Cervero and Golub, “Informal Transport.” 13 Vasconcellos, Urban Transport Environment and Equity. 14 Vasconcellos; Cervero and Golub, “Informal Transport.” 15 Estache and Gómez-Lobo, “Limits to Competition in Urban Bus Services in Developing Countries.” 16 Gilbert, “Bus Rapid Transit”; Joewono and Kubota, “User Satisfaction with Paratransit in Competition with Motorization in Indonesia.” 17 Cervero, Informal Transport in the Developing World; Estache and Gómez-Lobo, “Limits to Competition in Urban Bus Services in Developing Countries.”
12
fare.18 Where associations of private paratransit operators have functioned as cartels, as in Santiago in the early 1990s, the fares of private buses, minibuses and micro-vehicles have sometimes been two to three times higher than former publicly subsidized and operated services.19 Additionally, without regulations to ensure service equity, private operators may engage in “cream-skimming,” focusing services on the most profitable markets—those with high volume demand or high-paying customers—leaving lower-demand areas with little service.20 While some providers are self-employed, operating vehicles that they own, others rent vehicles for a set fee or are directly employed by vehicle owners. These employees often lack labor protections, leaving them vulnerable to exploitation by vehicle owners.21 Finally, in some communities, the private transit industry has acquired political power that rivals the state’s -- a situation that governments would prefer to avoid.22 Bus Rapid Transit: Arguments for Its Implementation, and Benefits and Challenges Bus rapid transit (BRT) was first implemented in Curitiba, Brazil in the 1970s, and has since emerged as a very popular approach to reforming public transport in developing countries.23 With its dedicated lanes and vehicles and stations designed for rapid boarding, BRT has been seen as the solution to many of the ills of privately provided transit, whether that private transit is provided by moderately regulated large vehicles or by loosely regulated or unregulated small paratransit vehicles. BRT has become a worldwide model for transport sector reform thanks to the early success of Bogotá’s BRT, TransMilenio.24 By 2016, at least 207 cities around the world had adopted BRT.25
18 Ardila, “Limitation of Competition in and for the Public Transportation Market in Developing Countries”; Fernández and Muñoz, “Privatisation and Deregulation of Urban Bus Services.” 19 Darbéra, “Deregulation of Urban Transport in Chile.” 20 Kahn, The Economics of Regulation: Principles and Institutions. 21 Portes, “The Informal Sector.” 22 Dugard, “From Low Intensity War to Mafia War: Taxi Violence in South Africa (1987 - 2000)”; Flores Dewey, “Expanding Transportation Planning Capacity in Cities of the Global South.” 23 Hidalgo and Gutierrez, “BRT and BHLS around the World”; Lindau, Hidalgo, and Facchini, “Curitiba, the Cradle of Bus Rapid Transit.” 24 Hidalgo and Hermann, “The Bogotá Model for Sustainable Transportation; Inspiring Developing Cities throughout the World”; Wood, “Moving Policy”; Montero, “Study Tours and Inter-City Policy Learning.” 25 “Global BRT Data.”
13
In addition to its role in reforming existing transport services in developing cities, BRT is perhaps even more strongly seen as providing an upgrade to the transport system at a lower cost than what it has always been intended to emulate, namely fixed rail passenger transport, whether heavy rail (metro) or light rail. Politically, BRT appeals to elected officials because it can usually be built and opened to the public far more quickly than rail projects, often within the term of the mayor or governor who initiated the investment.26 Arguments for BRT There are a number of reasons for cities’ pursuit of BRT. First, BRT ideally provides a high-quality transit system, comparable in quality to that of rail systems.27 The high-quality service of BRT has the potential to bring about more broad forms of transportation change. While reforms focused on private transit would mostly affect passengers who are dependent on public transport, BRT holds the promise of attracting private vehicle users as well. Convincing drivers and motorcyclists to switch to transit is a potential solution to congestion and pollution problems that has attracted support from international advocacy organizations.28 Thanks in part to such advocacy and marketing, BRT has successfully appealed to a broad range of constituents, a critical element in building the political will to invest public funds in infrastructure and to tackle private transit industry reform. Second, as advocates have heavily emphasized, BRT networks tend to be much less expensive on a per-kilometer basis than rail networks.29 In a review of existing BRT systems worldwide, Deng and Nelson calculated BRT's average capital cost per mile at 52% that of light rail and 8% that of heavy rail.30 Moreover, some advocates have found reason to believe that BRT operations could be financially self-sufficient, implying that no government subsidies would be necessary.31 The promise of low initial cost and self-sufficiency were seen as major benefits for governments facing constrained resources.32 In addition, BRT networks can be built quickly in comparison to rail, a fact
26 Cervero, “Bus Rapid Transit (BRT): An Efficient and Competitive Mode of Public Transport.” 27 Hensher, “Sustainable Public Transport Systems.” 28 Wright and Hook, “Bus Rapid Transit Planning Guide”; Hensher, “Sustainable Public Transport Systems.” 29 Hidalgo and Gutierrez, “BRT and BHLS around the World.” 30 Deng and Nelson, “Recent Developments in Bus Rapid Transit.” 31 Hook, “Institutional and Regulatory Options for Bus Rapid Transit in Developing Countries.” 32 Hidalgo and Gutierrez, “BRT and BHLS around the World.”
14
that has appealed to elected officials looking for tangible results within a 3- to 4-year election cycle.33 A third argument in favor of BRT comes from Ardila.34 Drawing from cases in Curitiba, Bogotá, Medellin, and León de Guanajuato, he argued that BRT, compared with conventional buses, is more effective in establishing competition “for the market” because BRT corridors and centralized fare collection systems create tangible barriers to market entry, rather than relying only on enforcement. Specifically, only BRT vehicles can physically access the stations and dedicated lanes, while informal operators are forced to compete in mixed traffic. This approach is more effective than relying on under-resourced or corruptible enforcement agencies. With centralized fare collection, bus owners are paid per kilometer rather than per passenger, such that "bus companies maximize profits if the fleet is a reasonable size" instead of "maximizing profit as fleet size increases."35 While centralized fare collection can be implemented without BRT, it is presumably easier to do so along with a new BRT system. Fourth, BRT has been more politically feasible than many previous efforts at formalization in large part because it offers a more concrete pathway to transform the existing transport sector, thus mitigating political opposition from informal operators. As Hook put it, BRT has been “a mechanism for allowing municipal government to establish effective regulatory control over largely privatized systems.”36 Bogotá’s TransMilenio demonstrated that it was possible to benefit existing operators by including them as shareholders in the new BRT system.37 Cities like Mexico City and Cape Town, where the private transit sector previously strongly resisted government reforms, have used Bogotá as an example to persuade existing operators to buy into BRT plans.38 Challenges of BRT Implementation As more cities have gained experience with BRT in the last two decades, criticisms of the technology and the standardized approach to implementation have emerged. Research has sometimes suggested that the benefits of BRT, including congestion
33 Hidalgo and Hermann, “The Bogotá Model for Sustainable Transportation; Inspiring Developing Cities throughout the World”; Wood, “Moving Policy”; Montero, “Study Tours and Inter-City Policy Learning.” 34 Ardila, “Limitation of Competition in and for the Public Transportation Market in Developing Countries.” 35 Ardila, 13. 36 Hook, “Institutional and Regulatory Options for Bus Rapid Transit in Developing Countries,” 184. 37 Hook, “Institutional and Regulatory Options for Bus Rapid Transit in Developing Countries”; Gilbert, “Bus Rapid Transit.” 38 Montero, “Study Tours and Inter-City Policy Learning”; Wood, “Moving Policy”; Flores Dewey, “Expanding Transportation Planning Capacity in Cities of the Global South.”
15
reductions and improvements in service quality, fall short of expectations. Gilbert’s compilation of previous studies of Bogotá’s BRT, TransMilenio, found that implementation had not fully delivered on solving the problems of service quality, congestion, and inequitable ownership structures.39 TransMilenio earned generally positive public opinion, but ultimately became so popular that severe overcrowding have affected public perception, which in turn motivated political leaders to explore other alternatives, including heavy rail, which in turn had slowed the political momentum for the deployment of new BRT corridors in the city.40 Additionally, the corporatization of the industry apparently went further than intended. The original aim was to include existing operators as shareholders in TransMilenio, ensuring they would profit from the reform. While many owners of traditional buses did become shareholders in the new companies, Ardila-Gomez and Gilbert found evidence that the bidding process favored large companies; large investors have bought out smaller shareholders, by 2006 consolidating 88% of shares in the hands of 21% of investors.41 The reforms failed to remove all existing buses from the streets, prompting TransMilenio operators to complain of encroaching competition from pre-existing bus operators.42 Secondly, the costs of implementing BRT have often been much higher than expected. The capital cost of building high-quality BRT is indeed much lower than for rail networks of comparable length, but is still a major investment for governments facing significant financial constraints.43 Design and construction shortcuts, often made out of political or financial expediency, have been seen to increase long-term maintenance costs in cities like Jakarta.44 There is an emerging consensus that in most cities, long-term financial self-sufficiency for the BRT system is not possible except on high-demand corridors, which implies the need for governments to subsidize BRT operations in contexts in which private transit requires little or no subsidies.45 In Mexico City, generous financial concessions to existing operators were necessary in negotiations for the first BRT corridor, setting up untenably high expectations for subsequent phases, and increasing costs overall (the same has happened in Cape Town, as we describe below).46 In
39 Gilbert, “Bus Rapid Transit.” 40 Rojas Ricaurte, “Transmilenio, el ‘metro’ barato que nos vendió Peñalosa, fracasó.” 41 Ardila-Gómez, “Transit Planning in Curitiba and Bogotá. Roles in Interaction, Risk, and Change. Diss. Massachusetts Institute of Technology, 2004.”; Gilbert, “Bus Rapid Transit.” 42 Gilbert, “Bus Rapid Transit.” 43 Hidalgo and Graftieaux, “Bus Rapid Transit Systems in Latin America and Asia”; Deng and Nelson, “Recent Developments in Bus Rapid Transit.” 44 Ernst, “Initiating Bus Rapid Transit in Jakarta, Indonesia.” 45 Paget-Seekins, Flores Dewey, and Muñoz, “Examining Regulatory Reform for Bus Operations in Latin America”; Gilbert, “Bus Rapid Transit.” 46 Flores Dewey, “Expanding Transportation Planning Capacity in Cities of the Global South.”

16
Santiago de Chile, regulatory capture and collusion in the bidding process also increased contract costs.47 Third, implementation of BRT requires technical expertise that may exceed that available in many cities. In particular, BRT is often implemented by requesting bids from private entities to operate the system; this requires cities to set up truly competitive bidding processes, a challenging task given the relative lack of municipal expertise in this area.48 In a review of BRT systems worldwide, a report by EMBARQ, an organization advocating BRT, documented problems encountered in the planning, implementation and operation phases, the majority of which stemmed from public authorities' lack of technical capacity.49 Hidalgo and Gutiérrez summarized these challenges, highlighting common problems such as rushed implementation, very tight financial planning, delayed implementation of fare collection systems, and insufficient user education for initial implementation.50 The authors argued that the "problems are associated with financial restrictions and institutional constraints, rather than intrinsic issues of BRT."51 The research makes clear that BRT systems requires a lot from public authorities: they must have the capacity to manage all the responsibilities that come with competitive tendering, and additional competency in both planning and overseeing a BRT system. Fourth, existing private transit operators in many cities such as Cape Town and Mexico City continue to mount political opposition.52 In such cases governments must spend considerable time and resources on managing relationships with private transit operators. Private transit operators can block BRT implementation through political demonstrations and threats of violence. They may choose not to participate in compensation and vehicle scrapping schemes and may continue to operate in competition with new BRT services. For these reasons, not all planners or researchers agree that full replacement of private transit with BRT is desirable. As discussed previously, some authors argue private transit has inherent advantages, including demand-responsiveness and affordability. 53 Even with the new BRT, travelers may continue to prefer private transit for its convenience, its lower cost, or simply its familiarity. If travelers choose private transit over BRT, it suggests they may be better off with private transit. 47 Paget-Seekins, Flores Dewey, and Muñoz, “Examining Regulatory Reform for Bus Operations in Latin America.” 48 Paget-Seekins, Flores Dewey, and Muñoz; Gilbert, “Bus Rapid Transit.” 49 Hidalgo and Carrigan, “Modernizing Public Transportation, Lessons Learned from Major Bus Improvements in Latin America and Asia.” 50 Hidalgo and Gutierrez, “BRT and BHLS around the World.” 51 Hidalgo and Gutierrez, 11. 52 Gilbert, “Bus Rapid Transit”; Flores Dewey, “Expanding Transportation Planning Capacity in Cities of the Global South.” 53 Cervero and Golub, “Informal Transport.”
17
Despite the expectations of restructuring private transit with BRT, the reality is that most cities that have embarked in this transition have so far completed only partial reform, leaving them with a public transport system that includes both private transit and BRT. Those that have succeeded in wholesale replacement may not have benefited everyone and may have hurt some – and at substantial social cost, in the form of needed government capital and operating subsidy. Given the pace of BRT implementation and the possibility of slowing political momentum behind it, these “hybrid” systems could be the norm for some time. Put another way, few if any cities so far have succeeded in completely replacing private transit with BRT, and the most common outcome is a system consisting of BRT in conjunction with private transit, including informal paratransit. Operational integration with BRT and private transit Given the documented incomplete implementation of BRT, some authors have recommended that cities plan for "hybrid" BRT and private transit systems. In a hybrid system, the goal is operational integration (or at least complementarity) between modes. Operational integration means that travelers experience “seamless” journeys, moving between modes or operators without barriers.54 At least five different spatial-temporal operational schemes involving BRT and private transit have been proposed. The first configuration is the “separate or parallel roads scheme,” where private transit vehicles runs parallel to BRT routes in instances where demand exceeds the BRT’s capacity.55 Under this arrangement, smaller vehicles are intended, but not limited, to serve local trips, while the larger ones running in parallel to the main corridor serve longer trips. A second configuration is a variant of the above in which separate/parallel private transit services are run only during peak demand periods; this configuration is sometimes called ‘peak-lopping.’ Under this arrangement, private transit vehicles are allowed to operate during peak demand hours parallel to a BRT corridor with the goal of increasing peak-period corridor capacity. At other times private transit vehicles return to their pre-designated routes in other areas of the city where they will (ideally) not compete with BRT services. The third configuration, and most commonly used, is the hybrid BRT trunk – private transit feeder arrangement. Private transit vehicles connect areas not well served by the BRT at transfer points or stations.56 As a result, private transit feeder routes serve local
54 Rivasplata, “Public Transport Integration in a Privatised Market: Recent Policy Lessons from Abroad.” 55 Golub, Behrens, and Ferro, “Planned and Paratransit Service Integration through Trunk and Feeder Arrangements.” 56 Golub, Behrens, and Ferro.
18
trips and the “first-last” mile of longer trips. Trunk-feeder operational integration has been tested in Quito, Sao Paulo, and Recife, and the city of Cape Town has also considered this arrangement. In cities like Jakarta or Lagos where feeder services were not initially planned for the BRT, private transit vehicles informally reorganized to connect unserved areas with the BRT. A fourth configuration is called ‘connecting corridors.’57 Like the trunk and feeder arrangement, BRT corridors and private transit routes intersect at transfer points or stations. However, in this configuration, private transit routes do not necessarily work as feeders of BRT, but instead operate on corridors that reach different urban nodes, much like BRT corridors. The final operational configuration is called ‘shared busway.’ In this configuration, private transit and BRT vehicles shares (an) exclusive corridor(s). Private transit vehicles enter and exit the exclusive corridor as needed, while still providing direct door-to-door services as they used to before BRT implementation. This shared-busways arrangement has been tested in Delhi since 2008 and recently in Jakarta and Barranquilla – although this arrangement requires special vehicles that can pick up and drop off passengers along the entire route. One of the biggest concerns of this integration scheme is that BRT performance might be compromised if corridor capacity is not suited to support this hybrid operation. Also, and as we will discuss in Chapter 7, this arrangement might occur only after a formalization process and fleet renewal. Fare integration Fare integration is another important element when considering integration of BRT and private transit. Without integrated fares, passengers must pay the full fare each time they change vehicle to access to their destinations. Reward or discount fare schemes are two options to facilitate transfers between vehicles and help passengers avoid paying twice. One reward arrangement consists in offering “free” feeder services to passengers, who pay for the entire trip once at the BRT station. In this case, officially designated personnel compensate drivers on a per-passenger basis upon arrival to the transfer point. In this case, private transit drivers are compensated at transfer points according to the number of passengers by personnel officially designated for such task.58 This specific fare integration mechanism works only in conjunction with physical integration. The reward private transit-feeder scheme was successfully tested in Quito in the early 2000s. A variant to the reward scheme is to offer a discount fare to passengers using the paratransit-feeder. In this case, paratransit bus owners or cooperatives are paid the difference between the discounted fare and the full route fare for each passenger
57 Golub, Behrens, and Ferro. 58 Golub, Behrens, and Ferro.
19
brought to the BRT, plus bonuses for good performance.59 As in the case of the reward scheme, this scheme requires transfer stations in which strict monitoring and control can be exercised. The discounted-fare mechanism was proposed in Jakarta also in the early 2000’s, though implementation failed during the negotiation of discount reimbursements and bonuses. Drivers did not trust vehicle owners to uphold their end of the bargain.60 Integration can be enhanced through electronic fare mechanisms. Electronic fare validation devices can be installed on-board paratransit vehicles, where passengers tap their pre-loaded fare card when boarding the vehicle and again to enter the BRT station. Physical integration, while not required, is preferable to enhance passenger comfort. While integrated fares are obviously convenient and potentially cheaper for passengers, fare integration through a centralized fare collection system has benefits beyond convenience and cost savings. In the typical cash fare system used by most private transit operators, drivers (and vehicle owners) are rewarded in direct proportion to the number of passengers they carry. Drivers are incentivized to compete over passengers, and owners are incentivized to maximize the number of vehicles they have circulating on the street. The result is aggressive driving and over-supply.61
A centralized fare collection system makes it possible to pay operators based on other criteria, like service supplied or hours driven. Drivers can thus focus on performance and quality of service rather than the total number of passengers they carry in their vehicle. The same organizational reforms that make centralized fare collection possible also enable fare integration, although the two need not necessarily be paired.
59 Golub, Behrens, and Ferro. 60 Golub, Behrens, and Ferro. 61 Ardila, “Limitation of Competition in and for the Public Transportation Market in Developing Countries”; Estache and Gómez-Lobo, “Limits to Competition in Urban Bus Services in Developing Countries.”
20
Chapter 3 Research Approach & Methods We began this project intending to study cases across a variety of global contexts with a focus on cities that were likely to adopt BRT as a first line solution to their transport problems rather than adopting rail and that have a high share of travel by private transit services Very large cities are much more likely to have the capital funding to construct expensive rail services as well as more likely to have cost recovery with those systems due to high ridership and more affluent populations. For smaller cities (up to around 4 million residents), BRT services are more cost-effective and realistic—though, as we will see, they are not always cost-effective enough. At the same time, in those cities there is often a higher share of travel accounted for by private transit services. For these reasons and also reasons of convenience we settled on Barranquilla, Colombia; Quito, Ecuador; Cape Town, South Africa; Dar es Salaam, Tanzania. We added to the list of cases Jakarta, Indonesia because it was the only city that was reforming private transit to be integrated with its large BRT network. We conducted three kinds of data sources: surveys, interviews with residents, transit providers and experts, and written reports and newspaper articles. First, for all five cities we followed a case study research approach relying partly on interviews with elites knowledgeable about the cities and about the history of BRT and private transit, and partly on planning reports, newspaper reports and academic journal articles and working papers. The intention in the case studies was to describe the challenges and successes in each place. Second, in Barranquilla and Cape Town, we conducted both qualitative interviews and intercept surveys with residents, capturing both users and – critically – non-users of the recently created BRT systems in those places. We analyzed these data using appropriate methods to better understand the user and non-user perspective and travel patterns associated with the BRT and private transit in both cities. This report is nearly unique in doing so as there has been very little survey work done with urban residents regarding BRT and reconfigured private transit services, and perhaps none that has looked at cross-case comparisons as we have done here (collecting data from an almost-identical survey instrument and very similar qualitative interviewing approach). We chose Barranquilla and Cape Town for the more detailed research for several reasons. First, the BRT opened at about the same time in both cities, in 2010/2011. Thus, at the time we conducted the data collection, in 2015, the BRT had been in place for nearly five years, an appropriate time frame for a retrospective survey and conducting qualitative in-depth interviews in which participants would reasonably remember their travel patterns and experiences before the BRT was implemented. Second, both are mid-sized cities with entrenched inequality and spatial segregation, along racial lines in Cape Town and economic lines in Barranquilla, making comparison between user groups meaningful. Finally, data collection was feasible in both cities as

21
we were able to identify local partners to aid with logistical issues in conducting fieldwork.
22
SECTION II: CASE STUDIES This study originally considered a number of possible ways in which to characterize case studies, including defining potential dimensions to consider in choosing and analyzing cases. This list included the following:
• dimensions of integration (i.e. spatial scope of intervention, timing of reform, form of institutional integration, and form of engagement/negotiation);
• existing transport services (i.e. degree of organization/consolidation of paratransit sector, regulation of paratransit sector, type of vehicle and service, and degree to which existing service “successfully” serves users);
• and user characteristics / transport market (i.e. potential ridership of BRT, income level of potential users, the dominant alternative to public transit for existing users, and settlement patterns).
With these dimensions in mind, we aimed to select cases that represented a variety of approaches to BRT-private transit integration. To select cases, we first used the Global BRT database to make a list of cities that had opened BRT corridors within the last ten years or that are about to open a corridor.62 Of those, fourteen cities stood out as having significant BRT systems, or its planning process: Ahmedabad, Bangkok, Bogota, Cape Town, Dar es Salaam, Delhi, Guatemala City, Jakarta, Johannesburg, Lagos, Mexico City, Quito, Recife, Rio de Janeiro, and Santiago. For these fourteen cities, we conducted a more detail analysis using secondary sources in order to choose cases that best fit our research purposes. We wanted to choose a set of cases with variance in the intended style of BRT-private transit integration, and also the degree to which the new BRT system represented a significant transformation of the current public/private transit sector. We were also interested in focusing on cases that had not already been extensively researched. And finally, we chose cases where we expected that secondary data were available and where we could identify willing local contacts to help. To guide the selection process, we also reviewed literature on multiple or case study methodology. There is no one accepted methodology for case study research. While this review only looked at a few sources, even those suggested large variation in thinking and widespread misunderstandings. If there is any accepted framework, it is probably Yin’s book, Case Study Research, which is now in its sixth edition.63 Even Yin recognizes a wide range of approaches. A review of the literature resulted in three main takeaways for this research project:
62 “Global BRT Data.” 63 Yin, Case Study Research and Applications.

23
• Cases should be selected so as to verify (or falsify) a proposition and should be thought of as if they were multiple experiments with the goal of replication, rather than as samples with the goal of representativeness.
• Achieving internal validity within cases is very important. • Selecting cases that are similar across some dimensions is one possible
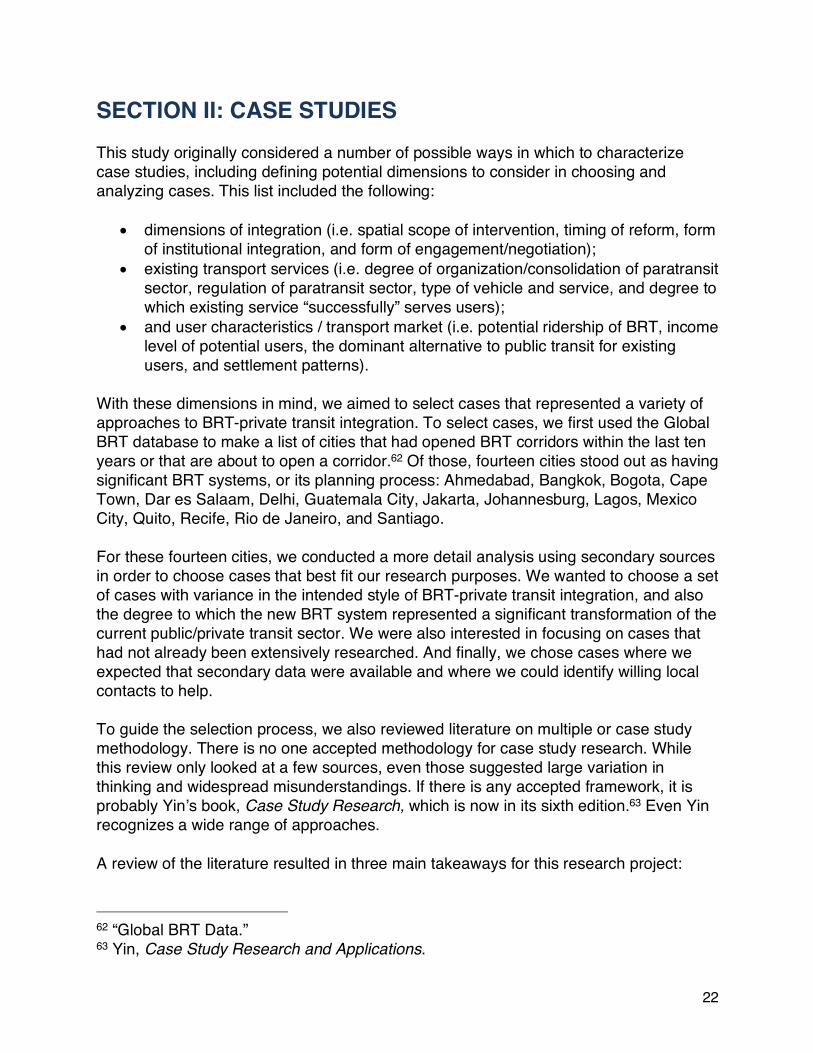
approach, but not the only or necessarily the best approach. The aforementioned cities were considered within this selection framework, in conjunction with the criteria mentioned previously, to finalize the case study cities examined in this report. Ultimately, we chose the following case study cities, which we describe at the beginning of the next section – two in South America, one in Asia and two in Africa: 1. Barranquilla (Colombia); 2. Quito (Ecuador); 3. Cape Town (South Africa); 4. Dar es Salaam (Tanzania); and 5. Jakarta (Indonesia). Details on these five case studies are presented in Figure 1 and Table 1. With each of these cities, the BRT represents a significant transformation, whether realized or potential, of the public/private transport system. The cases represent a spectrum of approaches to integration and include cases where the BRT is perceived as successful and where it is perceived as less so. Figure 1: Five Case Study Cities
Source: own elaboration with information from brtdata.org
24
Table 1: Case Study City & BRT System Descriptive Statistics Metric Cape Town Dar es Salaam Jakarta Barranquilla Quito
GDP per capita (US$) 5,692 865 3,347 6,056 6,248
Modal split % public transport 44 56 36 50 62
Modal split % private transport (including motorcycles)
47 7 41 19 35
Modal split % non-motorized 9 37 23 31 3
Peak load (passengers per hour per direction)
-- -- 3,600 -- 11,700
Daily demand (passengers per day)
20,000 160,000 370,000 115,000 833,095
System length (km) 17 21 207 14 69 Peak frequency (buses per hour) 6 -- 40 54 140
Source: own elaboration with information from brtdata.org
25
Chapter 4 Case study: Barranquilla Located in northern Colombia on the Caribbean coast, the metropolitan area of Barranquilla has a population of approximately two million and includes the cities of Barranquilla, Soledad, Malambo, Galapa, and Puerto Colombia.64 The city is also located by the Magdalena river, which stretches from the Andean Cordillera valley in the southern territories of the country to the Caribbean Sea. Privileged geographical location and economic prosperity has resulted in rapid population growth and densification over the past five decades — as today, Barranquilla and Soledad are the densest cities in the metropolitan region with average population density of about 7,970 and 9,790 residents per square kilometer, followed by Malambo (1,160 inhab/km2), Galapa (460 inhab/km2), and Puerto Colombia (290 inhab/km2).65 Despite economic and population growth, the Barranquilla's metropolitan area is also characterized by high levels of informality, urban segregation, and inequality. At the end of December of 2018, approximately 54 percent of the jobs were in the informal economy, and this figure includes non-authorized private transit services that are common in many areas of Barranquilla’s Metropolitan Area.66 The elite and middle-class residents live largely in the northern parts of the city, while most housing for the lower middle-class and poor is located peripheral areas of Barranquilla and in the municipalities of Soledad and Malambo located to the south of the metropolitan area.67 Rapid urbanization and economic growth in recent years have also resulted in higher motorization. Between 2000 and 2014, automobile ownership grew from 80 to 118 per 1,000 inhabitants.68 During the past decade, motorcycle ownership has also increased significantly, representing nearly 17 percent of the Barranquilla’s vehicle fleet in 2019.69 Increased motorization and urban growth have also resulted in greater congestion. Rapid population growth and motorization have contributed to exacerbating traffic congestion during the past decade. Results from perception surveys conducted in 2009 and 2013 have evidenced this problem.70 Despite the rapid motorization growth, most residents rely on a combination of public and private transit services. Private transit services available in the city include 64 Cámara de Comercio de Barranquilla, “Observatorio Urbano Local Del Área Metropolitana de Barraquilla.” 65 Cámara de Comercio de Barranquilla. 66 Departamento Nacional de Estadística, “Medición de Empleo Informal y Seguridad Social.” 67 Alcaldía de Barranquilla, Estratificación Socio-Económica. 68 El Heraldo, “Más Carros y Las Mismas Vías, Otra Causa de Los Trancones.” 69 Alcaldía de Barranquilla, “Informe General, Oficina de Registro de Tránsito.” 70 Barranquilla Como Vamos, “Como Vamos En Transporte e Infraestructura Vial 2008-2013.”
26
authorized, but loosely regulated, buses and minibuses, and non-authorized smaller vehicles such as two- and three-wheel motorcycles, and three-wheeler bicycle taxis. In 2010, Barranquilla implemented a trunk-feeder BRT locally known as Transmetro. The reasons for the introduction of Transmetro are complex. Certainly, part of the story is to reform what is seen as an inefficient and unsafe private transport system, but local leaders may have also felt encouraged to deploy a BRT due to the economic incentives offered the central government. Part of the private transport restructuring process that came with Transmetro included removing several of the pre-existing loosely regulated bus and minibus routes to reduce the apparent excess supply. Incumbent bus companies that now operate different Transmetro routes had to transform their business model. The public company Transmetro S.A. plans and oversees the BRT’s day-to-day operations. Companies that operate BRT routes are paid by Transmetro S.A. by kilometer and drivers received a fixed salary. This new model avoids competition for passengers on streets that resulted in the ‘penny war.’ Currently, the main separate-guideway Transmetro trunk line connects Barranquilla and Soledad with 14 kilometers of exclusive right-of-way along two primary trunk corridors with 16 stations with off-board fare payment and at-grade boarding —many of the features considered best practice for BRT design (Figure 2).71 There are also 190 kilometers of feeder routes.72 The current system represents only the first of three phases planned, with an uncertain future for the proposed second and third phases. Due to financial, political, and logistical constraints, Barranquilla has been able to manage only the implementation of a fraction of the planned system. A wide range of licensed and unlicensed privately provided transit services cover areas of the metropolitan area not well served by Transmetro. As in Cape Town, Jakarta, and Quito, Barranquilla’s BRT is not integrated with private transit.
71 “Global BRT Data”; “The BRT Standard.” 72 “Global BRT Data.”

27
Figure 2 Transmetro system map
Source: own elaboration with data provided by Transmetro S.A.
Hybrid Private-Public Transit: Operational Characteristics, Fragmentation, and Metropolitan Tensions Vehicles, mode share, fare structures, and coverage The metropolitan area of Barranquilla, Colombia hosts a hybrid and non-integrated transit system made of private transit and Transmetro. Prior to the introduction of Transmetro, Barranquilla metro area residents could choose from a variety of private transit modes including privately-run licensed, but loosely regulated, buses and minibuses; unlicensed taxi-like services provided by 2-wheeler motorcycle-taxis (locally referred as mototaxis), 3-wheeler motorcycle-taxis (motocarros), bicycle taxis (bicitaxis), non-authorized shared taxis (taxis colectivos), and licensed taxis to provide non-shared services (Figure 3).
28
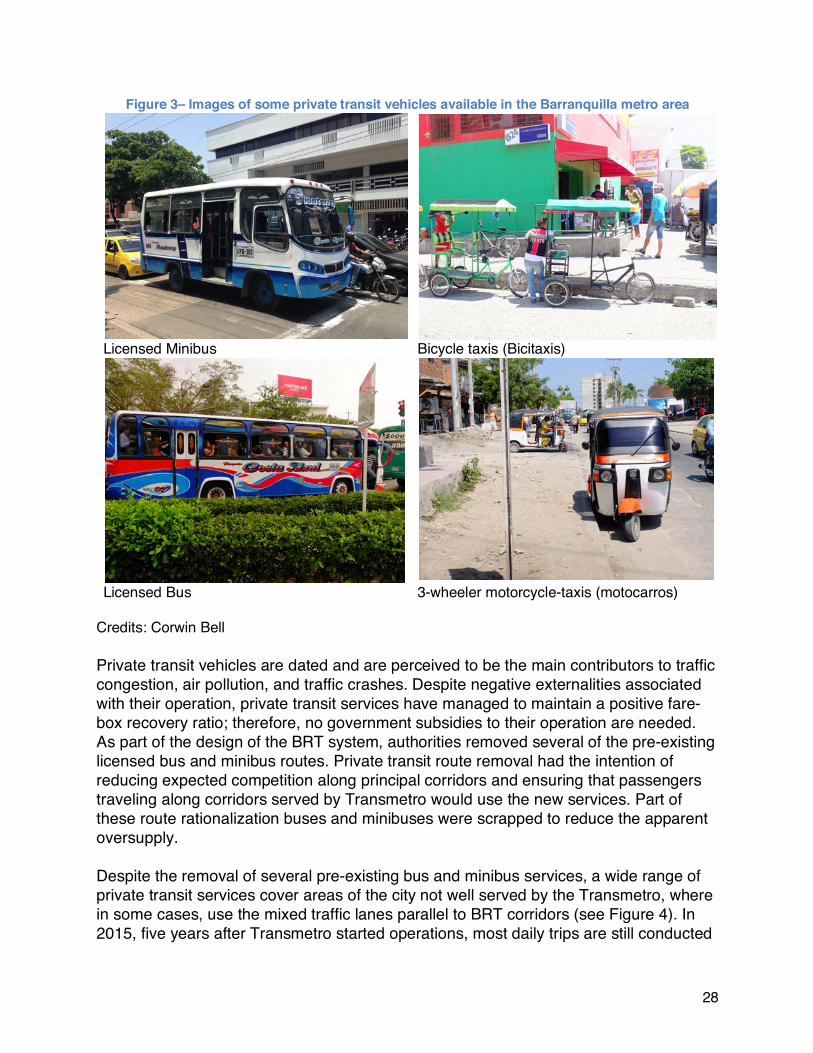
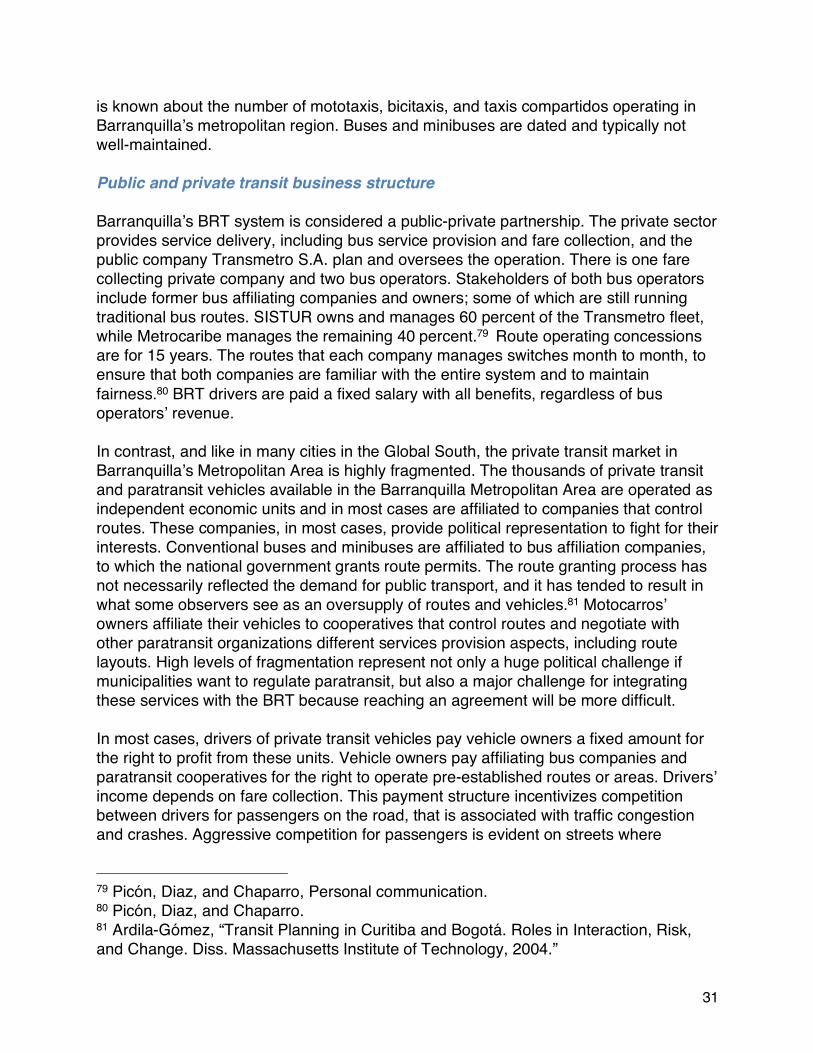
Figure 3– Images of some private transit vehicles available in the Barranquilla metro area
Licensed Minibus Bicycle taxis (Bicitaxis)
Licensed Bus 3-wheeler motorcycle-taxis (motocarros)
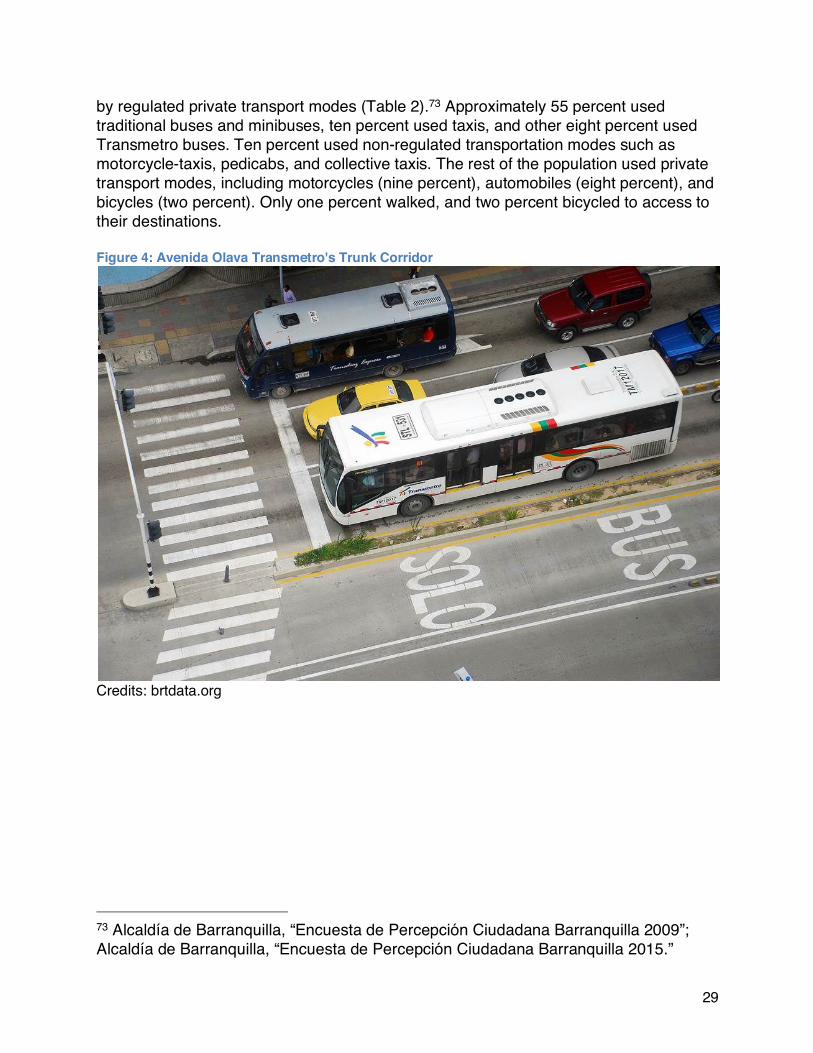
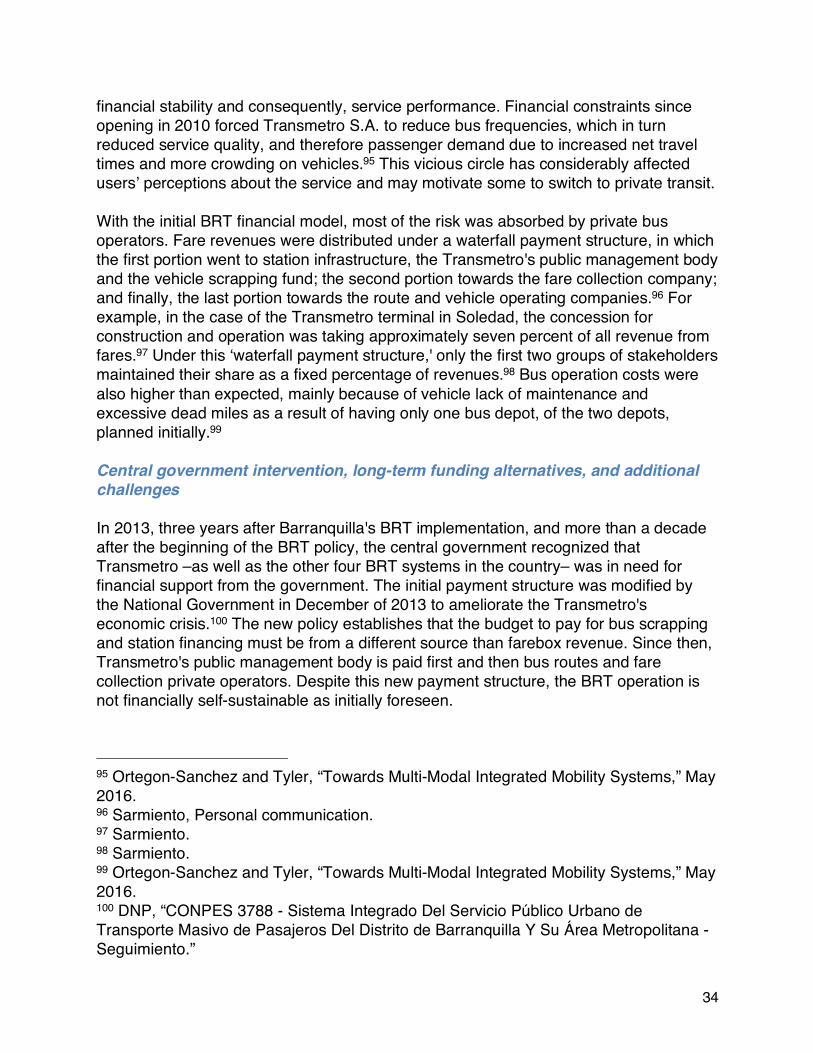
Credits: Corwin Bell Private transit vehicles are dated and are perceived to be the main contributors to traffic congestion, air pollution, and traffic crashes. Despite negative externalities associated with their operation, private transit services have managed to maintain a positive fare-box recovery ratio; therefore, no government subsidies to their operation are needed. As part of the design of the BRT system, authorities removed several of the pre-existing licensed bus and minibus routes. Private transit route removal had the intention of reducing expected competition along principal corridors and ensuring that passengers traveling along corridors served by Transmetro would use the new services. Part of these route rationalization buses and minibuses were scrapped to reduce the apparent oversupply. Despite the removal of several pre-existing bus and minibus services, a wide range of private transit services cover areas of the city not well served by the Transmetro, where in some cases, use the mixed traffic lanes parallel to BRT corridors (see Figure 4). In 2015, five years after Transmetro started operations, most daily trips are still conducted
29
by regulated private transport modes (Table 2).73 Approximately 55 percent used traditional buses and minibuses, ten percent used taxis, and other eight percent used Transmetro buses. Ten percent used non-regulated transportation modes such as motorcycle-taxis, pedicabs, and collective taxis. The rest of the population used private transport modes, including motorcycles (nine percent), automobiles (eight percent), and bicycles (two percent). Only one percent walked, and two percent bicycled to access to their destinations. Figure 4: Avenida Olava Transmetro's Trunk Corridor
Credits: brtdata.org
73 Alcaldía de Barranquilla, “Encuesta de Percepción Ciudadana Barranquilla 2009”; Alcaldía de Barranquilla, “Encuesta de Percepción Ciudadana Barranquilla 2015.”

30
Table 2: Mode share in the city of Barranquilla74 Mode 2009 2015 Automobile 12% 8% Bicycle 5% 2% Bus/Minibus 43% 55% Collective Taxi -- 1% Motorcycle 15% 9% Motorcycle-taxis and pedicabs 5% 5% Taxi 5% 10% Transmetro (BRT) -- 8% Walk 13% 2% Others 2% --
Source: Own elaboration with data obtained from Alcaldía de Barranquilla.75 Fare structure varies depending on transit alternative. Transmetro provides free transfers from feeder to trunk services within the system, while regular buses do not allow free transfers. These free transfers offer a competitive advantage of BRT over traditional buses for users who need to change vehicles to access to their destinations. No subsidies to low-income public transport users are currently provided. While Transmetro and conventional buses and minibuses offer fix fares (COP 1,800 and 1,700 respectively -- approximately 0.60 and 0.50 US Dollars) – fares in private transit can be negotiated with drivers. Fares in the smaller paratransit services can vary depending on where and how these services operate. In some cases, paratransit services have fixed fares and routes. In other instances, paratransit services employ a tier-based fare system that depends on the distance in cases where routes are not fixed. Distance based fares are set using service providers local knowledge. In most cases, fares on the paratransit market can be negotiated with drivers and may depend on the number of passengers being transported per ride. Two- and three-wheeler motorcycle taxis and bicycle taxis operate predominately in the municipalities located to the south of the city of Barranquilla. Despite there is no evidence on the nature of the trips these modes serve, some argue, are used mainly for short errands.76 Non-regulated shared taxis operate near BRT corridors.77 Only in Soledad there are approximately 6,000 motocarros affiliated to 12 cooperatives.78 Little 74 Main commute mode. There is no historical mode share data available for the entire metropolitan area 75 Alcaldía de Barranquilla, “Encuesta de Percepcion Ciudadana Barranquilla 2009”; Alcaldía de Barranquilla, “Encuesta de Percepcion Ciudadana Barranquilla 2015.” 76 Camargo, Ramos, and Llach, Personal communication. 77 Camargo, Ramos, and Llach. 78 El Heraldo, “Gobierno publica resolución que legaliza circulación de motocarros.”
31
is known about the number of mototaxis, bicitaxis, and taxis compartidos operating in Barranquilla’s metropolitan region. Buses and minibuses are dated and typically not well-maintained. Public and private transit business structure Barranquilla’s BRT system is considered a public-private partnership. The private sector provides service delivery, including bus service provision and fare collection, and the public company Transmetro S.A. plan and oversees the operation. There is one fare collecting private company and two bus operators. Stakeholders of both bus operators include former bus affiliating companies and owners; some of which are still running traditional bus routes. SISTUR owns and manages 60 percent of the Transmetro fleet, while Metrocaribe manages the remaining 40 percent.79 Route operating concessions are for 15 years. The routes that each company manages switches month to month, to ensure that both companies are familiar with the entire system and to maintain fairness.80 BRT drivers are paid a fixed salary with all benefits, regardless of bus operators’ revenue. In contrast, and like in many cities in the Global South, the private transit market in Barranquilla’s Metropolitan Area is highly fragmented. The thousands of private transit and paratransit vehicles available in the Barranquilla Metropolitan Area are operated as independent economic units and in most cases are affiliated to companies that control routes. These companies, in most cases, provide political representation to fight for their interests. Conventional buses and minibuses are affiliated to bus affiliation companies, to which the national government grants route permits. The route granting process has not necessarily reflected the demand for public transport, and it has tended to result in what some observers see as an oversupply of routes and vehicles.81 Motocarros’ owners affiliate their vehicles to cooperatives that control routes and negotiate with other paratransit organizations different services provision aspects, including route layouts. High levels of fragmentation represent not only a huge political challenge if municipalities want to regulate paratransit, but also a major challenge for integrating these services with the BRT because reaching an agreement will be more difficult. In most cases, drivers of private transit vehicles pay vehicle owners a fixed amount for the right to profit from these units. Vehicle owners pay affiliating bus companies and paratransit cooperatives for the right to operate pre-established routes or areas. Drivers’ income depends on fare collection. This payment structure incentivizes competition between drivers for passengers on the road, that is associated with traffic congestion and crashes. Aggressive competition for passengers is evident on streets where
79 Picón, Diaz, and Chaparro, Personal communication. 80 Picón, Diaz, and Chaparro. 81 Ardila-Gómez, “Transit Planning in Curitiba and Bogotá. Roles in Interaction, Risk, and Change. Diss. Massachusetts Institute of Technology, 2004.”

32
multiple bus and minibus routes coexist —a behavior known locally as the ‘guerra del centavo’ or ‘penny war.’82 Uneven regulation and enforcement Regulations that deal with non-authorized paratransit service, and the level of enforcement varies from city to city. Only the city of Barranquilla bans the circulation of two-wheeler motorcycle taxis in some areas of the city.83 Two-wheelers carrying passengers who are not part of the driver´s family core are also forbidden from circulating in certain areas.84 To enforce this law, motorcyclists must register with the local transport authority his-her family members and the motorcycle license number in a database. In contrast, the municipality of Soledad allows motocarros to provide passenger transport services, as long as the vehicles are affiliated to one of the 12 available cooperatives.85 However, motocarros are not recognized by the central government as a legitimate type of passenger transport service in cities. Lack of legitimacy has been used by BRT service providers and bus and minibus companies to pressure municipal authorities to dismantle paratransit operations beyond Barranquilla city limits. Beyond legal claims, demands to remove paratransit in Barranquilla’s Metropolitan Area have the objective of eliminating what they consider as unfair competition.86 Although some of these restriction measures may have a reduce informality locally, they may also have induced metropolitan-level spillover effects. The impact of the motorcycle ban policy Barranquilla apparently displaced mototaxis to other municipalities around Barranquilla.87 Lack of coordination among municipalities, but particularly between the of Barranquilla and surrounding towns also contribute to the challenges of integrating private transit with the BRT. Lack of inter-municipal coordination remains an issue for Barranquilla’s metropolitan area, despite being first, from a few, urban agglomerations in the country that created a metropolitan government body.88
82 Ardila-Gómez, “The Pressure Cooker of Public Transport in Bogotá”; Ortegon-Sanchez and Tyler, “Towards Multi-Modal Integrated Mobility Systems,” May 2016. 83 Camargo, Ramos, and Llach, Personal communication; Alcaldía de Barranquilla, “Distrito Prorroga Decretos de Motos Hasta El 30 de Junio de 2017.” 84 Camargo, Ramos, and Llach, Personal communication; Alcaldía de Barranquilla, “Distrito Prorroga Decretos de Motos Hasta El 30 de Junio de 2017.” 85 Emisora Atlántico, “Nuevo Decreto Reglamenta Circulación de Motocarros y Motocicletas En El Municipio de Soledad.” 86 Traditional bus route operators, Personal communication. 87 Traditional bus route operators, Personal communication. 88 Juan Ramírez and Rafael Parra-Peña, “Metrópolis de Colombia: Aglomeraciones y Desarrollo.”

33
Bus Rapid Transit in Barranquilla: Expectations, Financial Crisis, and Challenges Ahead Origins and expectations Part of the reason why Barranquilla introduced a BRT can be attributed to economic incentives provided by the central government and the apparent success of Bogota’s BRT first phase. Transmetro was conceived under a national public transport policy in which the central government co-financed 70 percent of the capital investment on infrastructure. Generally, infrastructure investments co-financed by the central government included main corridors, stations, and roads where feeder buses will run.89 One of the motivations of the central government for supporting BRT implementation was due to the impressive performance of Bogota's BRT first phase – locally known as TransMilenio. TransMilenio's first years of operation provided enough profits from fares to run the privately-operated buses and to finance the local public entity that oversees BRT planning and service provision.90 TransMilenio’s success influenced the design of all BRTs deployed in Colombia in the following years. The massive public transit national policy sanctioned after TransMilenio’s success stated that BRT systems must sustain their operations entirely via fare box revenues – in other words, that BRT ought to be financially self-sustainable. 91 Achieving self-sustainability required designing systems near to, or in worst case scenario at, maximum capacity.92 Bogota’s BRT reputation started diminishing as the system expanded and crowing became a problem. In the case of Barranquilla’s BRT, high occupancy levels set by design also brought as a consequence high levels of crowding. Overcrowding resulted in negative sentiments towards Transmetro, which may deter future politicians from supporting expanding the system as planned because if voters do not endorse any expansion. Transmetro financial crisis and short-term solutions Following the central government demands, Barranquilla’s BRT was designed to be a profitable business. Transmetro was predicted to attract approximately 300,000 passengers daily under Phase 1, yet patronage reached an initial maximum of 120,000 in 2012.93 Demand decreased to around 77,000 daily passengers in mid-2013 and peaked again at the end of the 2016 second period with an average weekday demand of 130,000 passengers.94 Lower than expected demand has affected Transmetro’s 89 Sarmiento, Personal communication. 90 Sarmiento. 91 Sarmiento. 92 Sarmiento. 93 “Restablecido el servicio de transporte masivo Transmetro”; Ortegon-Sanchez and Tyler, “Towards Multi-Modal Integrated Mobility Systems,” May 2016. 94 “Restablecido el servicio de transporte masivo Transmetro”; Ortegon-Sanchez and Tyler, “Towards Multi-Modal Integrated Mobility Systems,” May 2016.
34
financial stability and consequently, service performance. Financial constraints since opening in 2010 forced Transmetro S.A. to reduce bus frequencies, which in turn reduced service quality, and therefore passenger demand due to increased net travel times and more crowding on vehicles.95 This vicious circle has considerably affected users’ perceptions about the service and may motivate some to switch to private transit. With the initial BRT financial model, most of the risk was absorbed by private bus operators. Fare revenues were distributed under a waterfall payment structure, in which the first portion went to station infrastructure, the Transmetro's public management body and the vehicle scrapping fund; the second portion towards the fare collection company; and finally, the last portion towards the route and vehicle operating companies.96 For example, in the case of the Transmetro terminal in Soledad, the concession for construction and operation was taking approximately seven percent of all revenue from fares.97 Under this ‘waterfall payment structure,' only the first two groups of stakeholders maintained their share as a fixed percentage of revenues.98 Bus operation costs were also higher than expected, mainly because of vehicle lack of maintenance and excessive dead miles as a result of having only one bus depot, of the two depots, planned initially.99 Central government intervention, long-term funding alternatives, and additional challenges In 2013, three years after Barranquilla's BRT implementation, and more than a decade after the beginning of the BRT policy, the central government recognized that Transmetro –as well as the other four BRT systems in the country– was in need for financial support from the government. The initial payment structure was modified by the National Government in December of 2013 to ameliorate the Transmetro's economic crisis.100 The new policy establishes that the budget to pay for bus scrapping and station financing must be from a different source than farebox revenue. Since then, Transmetro's public management body is paid first and then bus routes and fare collection private operators. Despite this new payment structure, the BRT operation is not financially self-sustainable as initially foreseen.
95 Ortegon-Sanchez and Tyler, “Towards Multi-Modal Integrated Mobility Systems,” May 2016. 96 Sarmiento, Personal communication. 97 Sarmiento. 98 Sarmiento. 99 Ortegon-Sanchez and Tyler, “Towards Multi-Modal Integrated Mobility Systems,” May 2016. 100 DNP, “CONPES 3788 - Sistema Integrado Del Servicio Público Urbano de Transporte Masivo de Pasajeros Del Distrito de Barranquilla Y Su Área Metropolitana - Seguimiento.”

35
Currently, a modification of the national BRT policy is being discussed to provide provisions that help with the financial and operational crisis these transit systems faces. One of the most significant improvements is the recognition that operations cannot always be covered with fares.101 This change in the BRT policy would allow cities like Barranquilla to accept funds from other sources to cross-subsidize vehicle operation and maintenance.102 Some of the funding sources proposed by the central government include revenue from parking fees or congestion pricing; both non-existent in any Colombian city and which implementation is politically difficult. Once the national government allows BRTs to cross-subsidize the operation, urban or metropolitan administrative governments in Colombia will be responsible for determining what sources can become available for such purpose. Economic struggle and uncertainty challenge the future of Transmetro and any potential plan of integration with private transit. Whether new alternative funding sources can materialize and be enough to provide a high-quality service remains uncertain. As Transmetro services continue to deteriorate, the potential demand for private transit would increase. More demand, particularly for unregulated paratransit services, could create even more tensions between private and public transit service providers. As these tensions escalate, chances of reaching collaboration agreements diminish, which would make more difficult any plan that attempts to have a fully integrated private transit – BRT system. Formalization attempts and current BRT-private transit integration plan: Missing elements and further challenges Besides measures to better fund Transmetro, the Metropolitan Area of Barranquilla has plans to keep restructuring its dated private transit. This project is part of a national initiative called Integrated Public Transport Systems (SITP for its name in Spanish). Barranquilla’s metropolitan area integrated transit system is expected to transform the traditional bus industry in several ways. Existing buses will be replaced by new, larger, more energy-efficient vehicles, and services will have both fare and physical integration with BRT. Routes will also be reorganized, so they respond to the current demand for public transport and reducing overlap with the BRT. Public officials, traditional bus operators, and BRT service contractors anticipate that SITP will improve current conventional bus services and will help to consolidate BRTs demand.103 They also expect that traditional bus restructuring thought the SITP would reduce pollution, traffic congestion and traffic injury, and fatalities. Although it is not clear how many companies will operate the SITP, the contractual structure will likely be similar to the concession system employed for the BRT, in which
101 Sarmiento, Personal communication. 102 Sarmiento. 103 Sarmiento; Traditional bus route operators, Personal communication.
36
private companies are responsible for the route's operation under strict operating schedules and vehicle maintenance requirements. To improve system performance, planners envision some routes running dedicated lanes and in specific cases using BRT right of way, as some BRT direct routes currently operate. Drivers will be compensated based on the number of hours worked, not based on the number of passengers. Passengers who previously had to pay multiple fares when transferring between private transit buses or minibuses would spend just a fraction on transport. While the Metropolitan Area of Barranquilla works on the design of its integrated transit, the viability of the project is still uncertain for multiple reasons. The central government questions bus operators' technical and financial capacity.104 So far, the only experience with a city-wide transit restructuring in Colombia comes from Bogota, where its integrated transit system struggles to survive.105 Bogota’s SITP was designed to be financially self-sustainable. However, operating the vehicles resulted more expensive than planned, and demand is just a fraction of what the city forecasted.106 Two bus companies went bankrupt and the remaining struggle to maintain adequate service standards.107 Barranquilla’s integrated transit system may seem like a significant step towards a more inclusive and sustainable transportation system; however, small informal paratransit services are not considered in the integration plan. Some experts perceive the need for integration of two- and three-wheel motorcycle taxis to the transit system important, especially in areas where traditional buses and BRT are unable to operate because roads are too narrow, or the number of passengers is too small to justify a more costly, larger bus at a reasonable service frequency.108 Supporters of integrating small paratransit services with the BRT recognize that the former provide faster and in some cases more affordable mobility options for the poor that other regularized options, and that more education and better vehicle technology can help mitigate some of the negative externalities associated with their operation.109 The integration of small paratransit services with the future SITP may face even more challenges than integrating the BRT with the bus-minibus system. Integration with small paratransit vehicles may require that all service providers part of the system share revenues from fares and government subsidies. BRT private operators perceive any attempt of integration with small informal transit unfair because the informal transport sector neither comply with safety vehicle standards nor pay taxes, vehicle insurances,
104 Sarmiento, Personal communication. 105 El Tiempo, “Salvavidas al SITP le costará a Bogotá $ 1,7 billones en 10 años.” 106 El Tiempo, “Los 16 puntos claves del acuerdo para salvar el SITP.” 107 El Tiempo. 108 Picón, Diaz, and Chaparro, Personal communication; Camargo, Ramos, and Llach, Personal communication. 109 Picón, Diaz, and Chaparro, Personal communication.

37
and benefits to their drivers or follow fixed routes and schedules.110 However, paying for taxes, insurances, and drivers’ benefits may put some paratransit service providers out of business unless the government provides subsidies.111 Providing subsidies to small paratransit services under current financial pressures faced by the BRT seems to be politically unfeasible. Paratransit integration with the BRT requires negotiating between multiple actors and reaching consensus. However, a consensus is difficult to reach because the paratransit sector has a very atomized and fragmented business structure. Requiring fixed routes and schedule is also challenging because current informal paratransit operators put a high value on the flexibility of their business.112 Some operators do not have driver’s licenses and are some are not old enough to obtain one. This case study suggests that there will not be integration between paratransit and the BRT without formalization in Barranquilla. The formalization of paratransit is a complex and costly endeavor. Before Barranquilla transitions to an integrated transit network, even without including paratransit in this process, Transmetro needs to address many of its economic difficulties that affect service quality and residents’ perceptions about the system. While service quality can be marginally improved through low-cost operational improvements, only larger subsidies to the operation can increase the chances for Transmetro to perform as expected.
110 Traditional bus route operators, Personal communication; Picón, Diaz, and Chaparro, Personal communication. 111 Naranjo and Dautt, Personal communication. 112 Traditional bus route operators, Personal communication.
38
Chapter 5 Case study: Cape Town Located in the southwestern corner of South Africa, and with a population 3.7 million, Cape Town is South Africa's second most populous city and its second most economically important, after Johannesburg. Cape Town is characterized by relatively low density, with an average population density of about 1500 per square kilometer, and very high levels of racial and economic segregation.113 As the country's legislative capital and the capital of the Western Cape province, Cape Town holds political and economic importance. Historically a main center for trade and manufacturing, today the city owes its economic power to business and financial services, manufacturing, and tourism. Cape Town's central business district (CBD), located on the Atlantic coast near the historical port, is still the city's main economic and employment hub, although several other commercial and manufacturing centers have developed throughout the suburbs as well. The city's main tourism area lies along the coast south of the CBD, while manufacturing and commercial centers have spread along the highway corridors to the north and east. To the south, the historically white Southern Suburbs are home to much of the city's higher-income population. The mainly residential Metro Southeast houses a mostly lower-income non-white residents, a result of the city's history with policies to enforce racial segregation. Cape Town’s transportation system includes a mix of BRT (called MyCiTi), commuter rail, loosely regulated minibus taxis, and regulated but privately-operated conventional buses. The city intended for BRT to provide “basic mobility for the economically disadvantaged but also a competitive alternative to the private vehicle with reference to convenience, comfort, network coverage and geographical accessibility.” 114 In 2010 when the City of Cape Town debuted its “Integrated Rapid Transit” system, better known as MyCiTi, the term “integrated” conveyed multiple goals. First and foremost, city officials envisioned a system in which different public transport modes worked together as one efficient network, allowing users to transfer among them seamlessly. In addition, the city was working to integrate the existing paratransit (minibus taxi) operators into the new BRT transit system as shareholders and employees, creating a “unified service” that would eventually replace all paratransit.115 Furthermore, planning of the new network was to be integrated with land use goals, like achieving a “compact city.”116 Finally, the city intended the system to further social integration by ensuring that “all segments of society receive an equal, high-quality public transport experience,” 113 Christopher, “The Slow Pace of Desegregation in South African Cities, 1996-2001”; Stats SA, “South Africa Census.” 114 City of Cape Town, “Five-Year Plan for Cape Town - Integrated Development Plan 2007/8-2011/12.” 115 City of Cape Town, “Integrated Transport Plan 2006-2011 Review 2009.” 116 City of Cape Town.
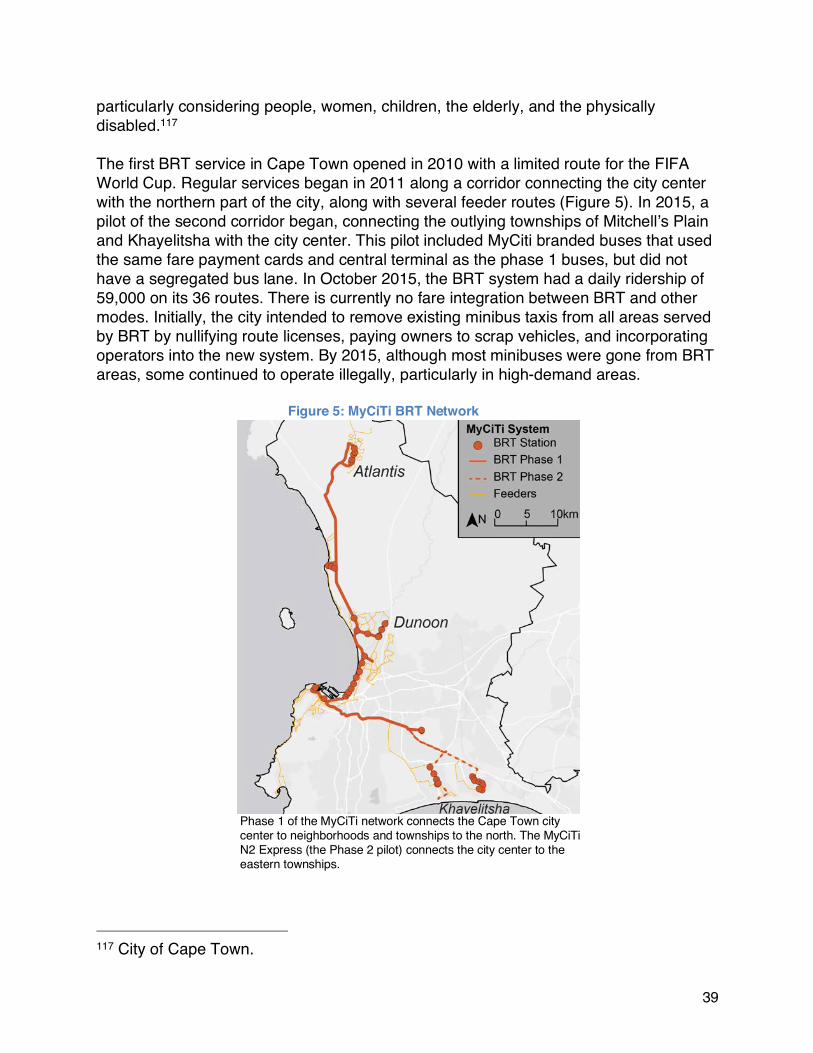
39
particularly considering people, women, children, the elderly, and the physically disabled.117 The first BRT service in Cape Town opened in 2010 with a limited route for the FIFA World Cup. Regular services began in 2011 along a corridor connecting the city center with the northern part of the city, along with several feeder routes (Figure 5). In 2015, a pilot of the second corridor began, connecting the outlying townships of Mitchell’s Plain and Khayelitsha with the city center. This pilot included MyCiti branded buses that used the same fare payment cards and central terminal as the phase 1 buses, but did not have a segregated bus lane. In October 2015, the BRT system had a daily ridership of 59,000 on its 36 routes. There is currently no fare integration between BRT and other modes. Initially, the city intended to remove existing minibus taxis from all areas served by BRT by nullifying route licenses, paying owners to scrap vehicles, and incorporating operators into the new system. By 2015, although most minibuses were gone from BRT areas, some continued to operate illegally, particularly in high-demand areas.
Figure 5: MyCiTi BRT Network
Phase 1 of the MyCiTi network connects the Cape Town city center to neighborhoods and townships to the north. The MyCiTi N2 Express (the Phase 2 pilot) connects the city center to the eastern townships.
117 City of Cape Town.

40
Compared with many other cities, Cape Town appears well-poised to deliver a successful BRT system, considering its relatively advanced economy, high-standard infrastructure, and capable municipal government. Yet socioeconomic divisions and land use patterns left by the former apartheid regime continue to present challenges. As a result of apartheid policies, large numbers of black and coloured118 residents live in far-flung, segregated townships with poor transport options. This settlement pattern is characterized by relatively low density, with on average about 1500 people per sq. km., and very high levels of residential segregation.119 White residents, who make up just 16% of the city’s 3.7 million residents, tend to live closer to the city center, the city’s largest employment hub. Black and coloured residents—39% and 42% of the population, respectively—are more likely to live in outlying townships, from which they must travel long distances to reach centrally located jobs.120 Indeed, the need to transport these workers once compelled the apartheid government to provide subsidized public trains and buses.121 Today, the government hopes the BRT will perform the same function, but with higher quality service. The BRT is also intended to alleviate traffic congestion, which is influenced by remote suburbs and the city’s increasing rate of auto ownership and use. While 39% of commuters travel by car as a driver or passenger, access to cars is predictably unequal.122 Ninety-three percent of white commuters travel by private car, while the car share for coloured residents is 46% and for blacks is 18%.123 Private car users (as well as all road users) face serious congestion during the morning peak period and along the main radial routes into the city center. According to an analysis of the TomTom Traffic Index, congestion adds an estimated 71% to morning peak travel time, making Cape Town the most congested city in South Africa.124 The City hoped BRT would provide an alternative to congested highways and thus attract drivers from their cars. Five years after the opening of Cape Town’s BRT, it is an opportune time to evaluate the extent to which it has achieved its goals. The evidence presented in Chapter 9 so far suggests the introduction of BRT is associated with small but significant travel time savings for users and slightly more equitable travel times and transport access—at great financial cost to the government. However, congestion is still a problem, and the city’s underlying land use pattern continues to make public transport provision difficult and expensive.
118 In South Africa the term “coloured” refers to people of mixed European and African ancestry and is typically considered a distinct race. 119 Christopher, “The Slow Pace of Desegregation in South African Cities, 1996-2001.” 120 Stats SA, “South Africa Census.” 121 Wilkinson, “The Regulatory Cycle Stalled?” 122 City of Cape Town, “Household Survey Report - Final Report.” 123 Statistics South Africa, “National Household Travel Survey February to March 2013.” 124 Phakathi, “Traffic Congestion in Cape Town Exceeds That of Johannesburg.”

41
Public transport and paratransit prior to BRT Prior to the introduction of BRT, the city’s public transport included a mix of commuter rail provided by the national state-owned Passenger Rail Agency of South Africa (PRASA), conventional buses run by the private Golden Arrow company under contract with the province, and authorized, but loosely regulated, paratransit in the form of minibus taxis (Figure 6). According to a household travel survey undertaken by the city in 2013, thirty percent of Cape Town commuters used public transport.125 Of these public transport users, about half used minibus taxi, and the other half was split between train and conventional bus (see Table 3).
Figure 6: Minibus taxi network coverage prior to BRT
125 City of Cape Town, “Household Survey Report - Final Report.”
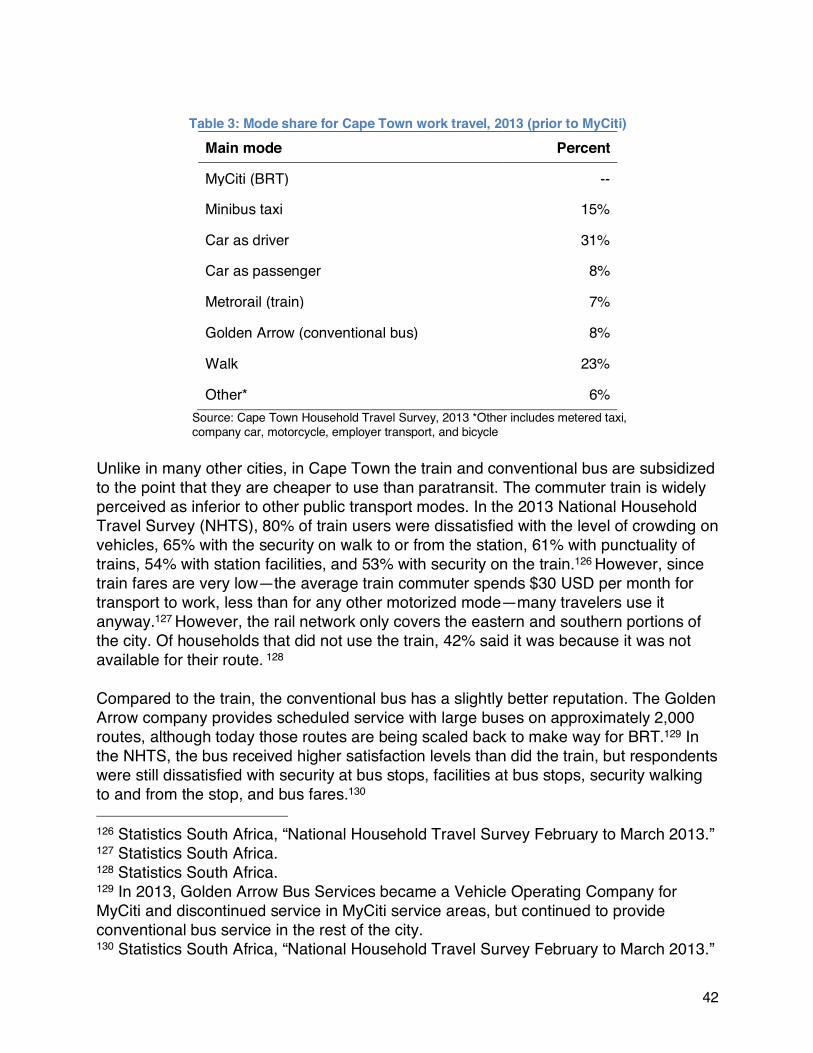
42
Table 3: Mode share for Cape Town work travel, 2013 (prior to MyCiti)
Main mode Percent
MyCiti (BRT) --
Minibus taxi 15%
Car as driver 31%
Car as passenger 8%
Metrorail (train) 7%
Golden Arrow (conventional bus) 8%
Walk 23%
Other* 6% Source: Cape Town Household Travel Survey, 2013 *Other includes metered taxi, company car, motorcycle, employer transport, and bicycle
Unlike in many other cities, in Cape Town the train and conventional bus are subsidized to the point that they are cheaper to use than paratransit. The commuter train is widely perceived as inferior to other public transport modes. In the 2013 National Household Travel Survey (NHTS), 80% of train users were dissatisfied with the level of crowding on vehicles, 65% with the security on walk to or from the station, 61% with punctuality of trains, 54% with station facilities, and 53% with security on the train.126 However, since train fares are very low—the average train commuter spends $30 USD per month for transport to work, less than for any other motorized mode—many travelers use it anyway.127 However, the rail network only covers the eastern and southern portions of the city. Of households that did not use the train, 42% said it was because it was not available for their route. 128 Compared to the train, the conventional bus has a slightly better reputation. The Golden Arrow company provides scheduled service with large buses on approximately 2,000 routes, although today those routes are being scaled back to make way for BRT.129 In the NHTS, the bus received higher satisfaction levels than did the train, but respondents were still dissatisfied with security at bus stops, facilities at bus stops, security walking to and from the stop, and bus fares.130 126 Statistics South Africa, “National Household Travel Survey February to March 2013.” 127 Statistics South Africa. 128 Statistics South Africa. 129 In 2013, Golden Arrow Bus Services became a Vehicle Operating Company for MyCiti and discontinued service in MyCiti service areas, but continued to provide conventional bus service in the rest of the city. 130 Statistics South Africa, “National Household Travel Survey February to March 2013.”
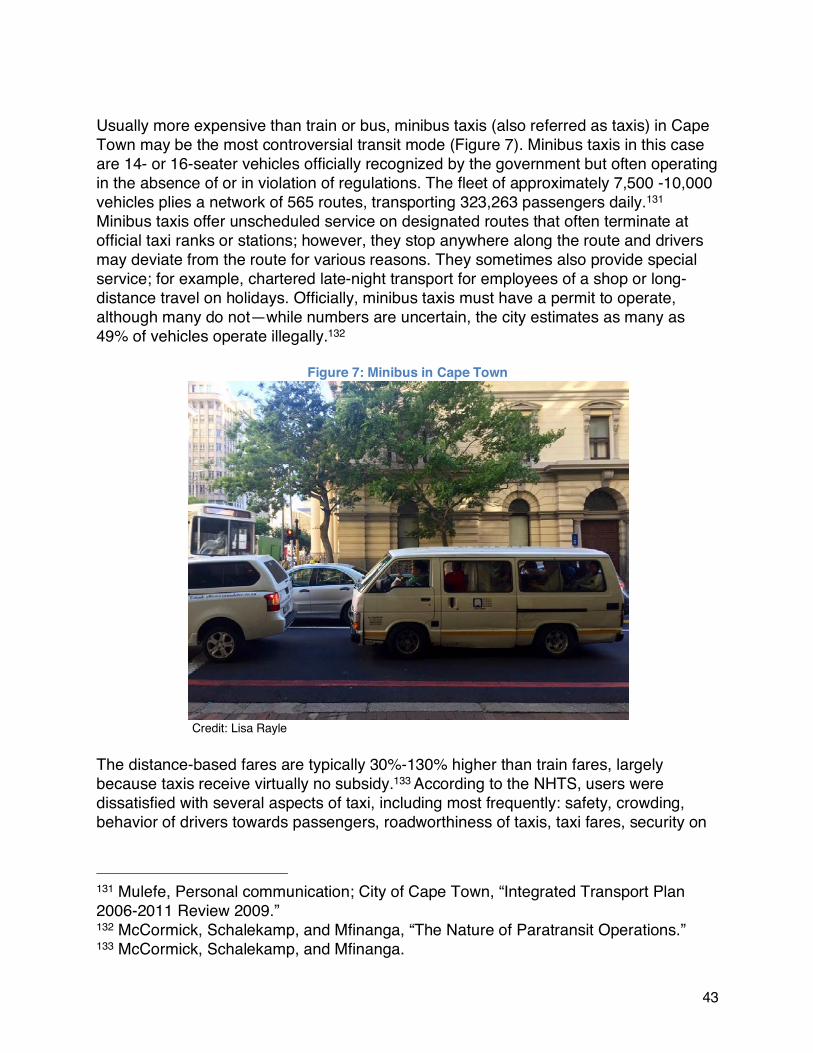
43
Usually more expensive than train or bus, minibus taxis (also referred as taxis) in Cape Town may be the most controversial transit mode (Figure 7). Minibus taxis in this case are 14- or 16-seater vehicles officially recognized by the government but often operating in the absence of or in violation of regulations. The fleet of approximately 7,500 -10,000 vehicles plies a network of 565 routes, transporting 323,263 passengers daily.131 Minibus taxis offer unscheduled service on designated routes that often terminate at official taxi ranks or stations; however, they stop anywhere along the route and drivers may deviate from the route for various reasons. They sometimes also provide special service; for example, chartered late-night transport for employees of a shop or long-distance travel on holidays. Officially, minibus taxis must have a permit to operate, although many do not—while numbers are uncertain, the city estimates as many as 49% of vehicles operate illegally.132
Figure 7: Minibus in Cape Town
Credit: Lisa Rayle
The distance-based fares are typically 30%-130% higher than train fares, largely because taxis receive virtually no subsidy.133 According to the NHTS, users were dissatisfied with several aspects of taxi, including most frequently: safety, crowding, behavior of drivers towards passengers, roadworthiness of taxis, taxi fares, security on
131 Mulefe, Personal communication; City of Cape Town, “Integrated Transport Plan 2006-2011 Review 2009.” 132 McCormick, Schalekamp, and Mfinanga, “The Nature of Paratransit Operations.” 133 McCormick, Schalekamp, and Mfinanga.
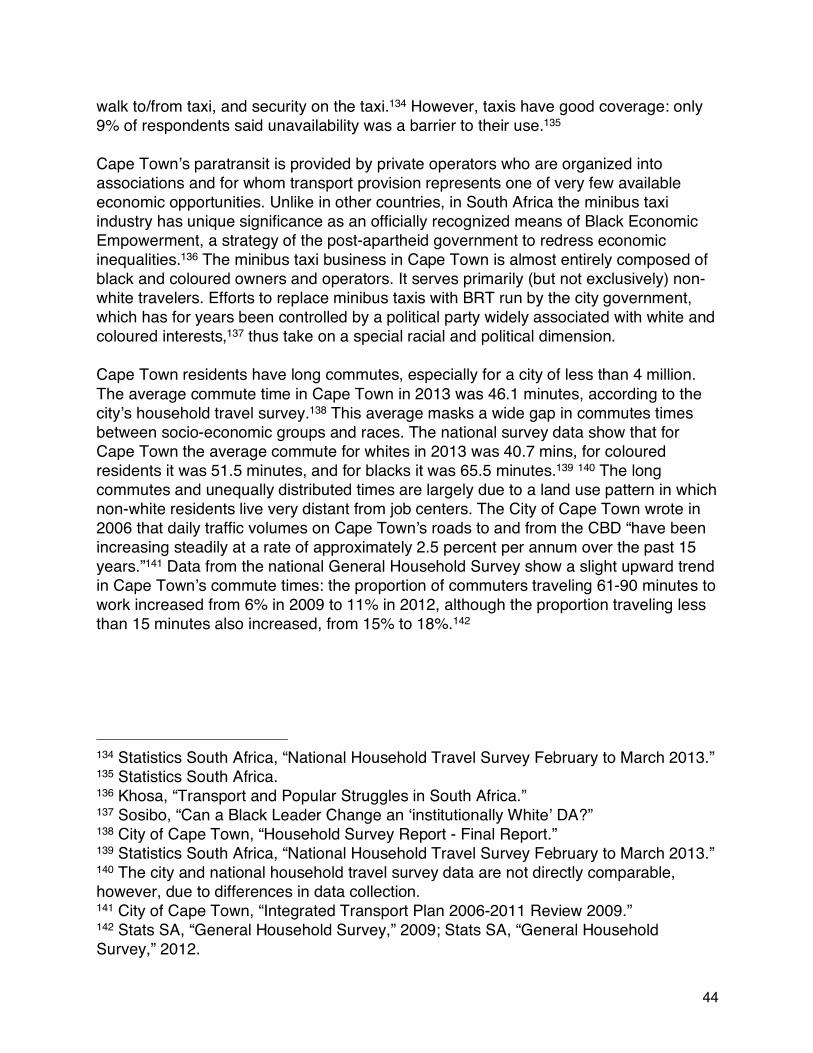
44
walk to/from taxi, and security on the taxi.134 However, taxis have good coverage: only 9% of respondents said unavailability was a barrier to their use.135 Cape Town’s paratransit is provided by private operators who are organized into associations and for whom transport provision represents one of very few available economic opportunities. Unlike in other countries, in South Africa the minibus taxi industry has unique significance as an officially recognized means of Black Economic Empowerment, a strategy of the post-apartheid government to redress economic inequalities.136 The minibus taxi business in Cape Town is almost entirely composed of black and coloured owners and operators. It serves primarily (but not exclusively) non-white travelers. Efforts to replace minibus taxis with BRT run by the city government, which has for years been controlled by a political party widely associated with white and coloured interests,137 thus take on a special racial and political dimension. Cape Town residents have long commutes, especially for a city of less than 4 million. The average commute time in Cape Town in 2013 was 46.1 minutes, according to the city’s household travel survey.138 This average masks a wide gap in commutes times between socio-economic groups and races. The national survey data show that for Cape Town the average commute for whites in 2013 was 40.7 mins, for coloured residents it was 51.5 minutes, and for blacks it was 65.5 minutes.139 140 The long commutes and unequally distributed times are largely due to a land use pattern in which non-white residents live very distant from job centers. The City of Cape Town wrote in 2006 that daily traffic volumes on Cape Town’s roads to and from the CBD “have been increasing steadily at a rate of approximately 2.5 percent per annum over the past 15 years.”141 Data from the national General Household Survey show a slight upward trend in Cape Town’s commute times: the proportion of commuters traveling 61-90 minutes to work increased from 6% in 2009 to 11% in 2012, although the proportion traveling less than 15 minutes also increased, from 15% to 18%.142
134 Statistics South Africa, “National Household Travel Survey February to March 2013.” 135 Statistics South Africa. 136 Khosa, “Transport and Popular Struggles in South Africa.” 137 Sosibo, “Can a Black Leader Change an ‘institutionally White’ DA?” 138 City of Cape Town, “Household Survey Report - Final Report.” 139 Statistics South Africa, “National Household Travel Survey February to March 2013.” 140 The city and national household travel survey data are not directly comparable, however, due to differences in data collection. 141 City of Cape Town, “Integrated Transport Plan 2006-2011 Review 2009.” 142 Stats SA, “General Household Survey,” 2009; Stats SA, “General Household Survey,” 2012.
45
Cape Town’s BRT, MyCiTi City officials in Cape Town had many reasons for adopting BRT, ranging from maintaining economic competitiveness to reducing congestion to preparing for the 2010 World Cup to serving those with physical disabilities who were left behind by existing modes.143 Officially, the city intended for BRT to provide “for basic mobility for the economically disadvantaged but also [provide] a competitive alternative to the private vehicle with reference to convenience, comfort, network coverage and geographical accessibility.”144 BRT was also national policy, with the Department of Transport providing guidance and funding for its implementation.145 The city’s Integrated Transport Plan (ITP) described the rationale for BRT:
“BRT has virtually all the performance and comfort of a modern rail-based transit system but at a reduced cost. The central defining feature of BRT is its focus on customer service. Dedicated, median trunk services provide customers with dramatically reduced travel times. Because the trunk vehicles move quickly in peak hour more people are encouraged to switch from private car use to public transport, which makes the whole system far more viable. The dedicated lanes also reduce operating costs so that fare levels are quite affordable.” 146
Among other things, BRT promised to reduce commuters’ travel time. In its Integrated Development Plan for 2006/7-2012, written just as scoping studies for BRT were getting underway, the City set a goal to reduce average commute travel time (during the peak period, by public transport) from a baseline of 45 minutes in 2007 to 35 minutes in 2012.147 National plans stated BRT would only be competitive with private cars if it could achieve a “door-to-door total journey time of under 60 minutes.”148 The first BRT service opened in 2010 with a limited route for the 2010 FIFA World Cup. Regular Phase 1 services began in 2011, connecting the city center with west coast suburbs and the Blaauwberg corridor to the north. The Phase 1 service area covers diverse parts of the city. The trunk corridor, with 23km of dedicated busway, runs from a shopping and tourist destination (Waterfront), through the central business district,
143 City of Cape Town, “2012 MyCiTi Business Plan: Phases 1A, 1B and N2 Express of Cape Town’s MyCiTi IRT System”; City of Cape Town, “Five-Year Plan for Cape Town - Integrated Development Plan 2007/8-2011/12.” 144 City of Cape Town, “Integrated Transport Plan 2006-2011 Review 2009,” 16. 145 Department of Transport, “Public Transport Strategy.” 146 City of Cape Town, “Integrated Transport Plan 2006-2011 Review 2009,” 302. 147 City of Cape Town, “Five-Year Plan for Cape Town - Integrated Development Plan 2007/8-2011/12.” 148 Transport for Cape Town, “MyCiTi Business Plan Update: Phase 1 and N2 Express.”
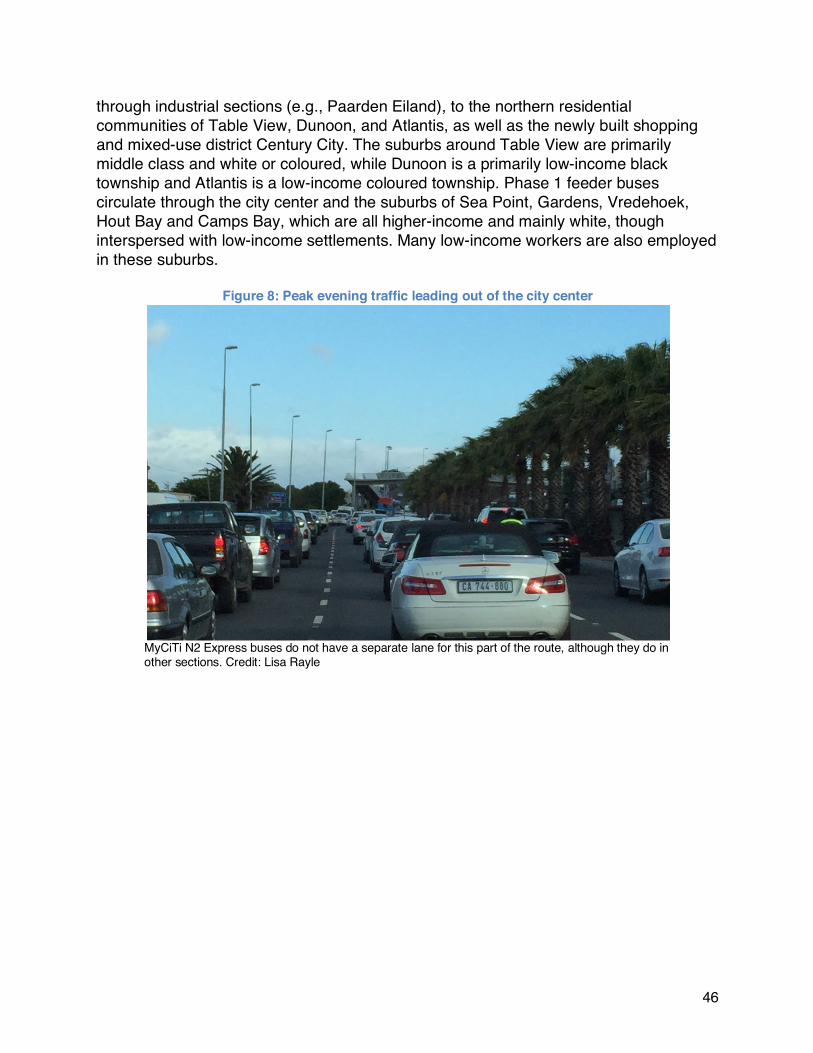
46
through industrial sections (e.g., Paarden Eiland), to the northern residential communities of Table View, Dunoon, and Atlantis, as well as the newly built shopping and mixed-use district Century City. The suburbs around Table View are primarily middle class and white or coloured, while Dunoon is a primarily low-income black township and Atlantis is a low-income coloured township. Phase 1 feeder buses circulate through the city center and the suburbs of Sea Point, Gardens, Vredehoek, Hout Bay and Camps Bay, which are all higher-income and mainly white, though interspersed with low-income settlements. Many low-income workers are also employed in these suburbs.
Figure 8: Peak evening traffic leading out of the city center
MyCiTi N2 Express buses do not have a separate lane for this part of the route, although they do in other sections. Credit: Lisa Rayle
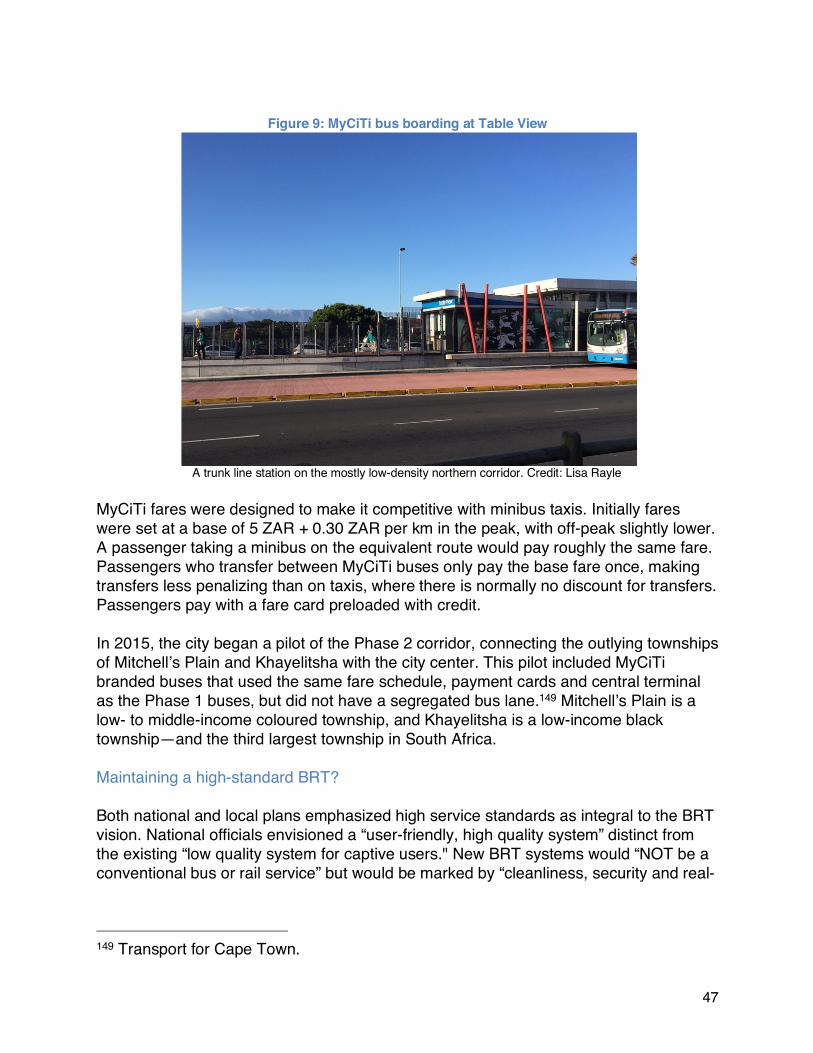
47
Figure 9: MyCiTi bus boarding at Table View
A trunk line station on the mostly low-density northern corridor. Credit: Lisa Rayle
MyCiTi fares were designed to make it competitive with minibus taxis. Initially fares were set at a base of 5 ZAR + 0.30 ZAR per km in the peak, with off-peak slightly lower. A passenger taking a minibus on the equivalent route would pay roughly the same fare. Passengers who transfer between MyCiTi buses only pay the base fare once, making transfers less penalizing than on taxis, where there is normally no discount for transfers. Passengers pay with a fare card preloaded with credit. In 2015, the city began a pilot of the Phase 2 corridor, connecting the outlying townships of Mitchell’s Plain and Khayelitsha with the city center. This pilot included MyCiTi branded buses that used the same fare schedule, payment cards and central terminal as the Phase 1 buses, but did not have a segregated bus lane.149 Mitchell’s Plain is a low- to middle-income coloured township, and Khayelitsha is a low-income black township—and the third largest township in South Africa. Maintaining a high-standard BRT? Both national and local plans emphasized high service standards as integral to the BRT vision. National officials envisioned a “user-friendly, high quality system” distinct from the existing “low quality system for captive users." New BRT systems would “NOT be a conventional bus or rail service” but would be marked by “cleanliness, security and real-
149 Transport for Cape Town.
48
time user information."150 The national government provided the Public Transport Infrastructure and Systems Grant (PTISG) to municipalities to help them implement systems that met the envisioned high standards. The initial business plan for MyCiTi named “quality” as its first design principle, meaning “a car-competitive service that is based around customer needs, including rapid travel times and frequent services, few transfers, safety and security, service integration, universal access, comfort and convenience, clean vehicles, and helpful staff.”151 The Phase 1 infrastructure and vehicles reflected the high standards--and so did the price tag. In 2010, the City admitted that implementation costs for Phase 1 would reach a total of R4.6 billion over six years, 250% more than originally estimated. The reasons for the cost increase were partially due to shortsightedness in initial estimates, but also in large part to design decisions that prioritized high quality service, such as additional feeder routes, universal access elements like tactile paving and level boarding, compliance with electronic fare management system standards, and automatic access gates rather than cheaper turnstiles.152 Other decisions, such as using 9m buses at higher frequencies for feeder routes rather than lower frequency 12m buses, were intended to improve service quality but increased operating costs. Phase 1 was thus rolled out with a relatively high standard of service. According to the 2010 Business Plan, trunk routes initially operated at peak-period headways of 3-4 minutes (9 minutes for the Airport route) and feeders had headways of 5-15 minutes. Stations were generously designed, and all were designed for universal access. However, in a departure from original plans, the main trunk corridor did not use existing roadway as it was deemed too disruptive to other vehicle traffic—instead it relied on road widening to create a dedicated busway. As a result, although the busway is segregated for most of the route, in a short section where the existing right-of-way was too narrow it operates in mixed traffic.
150 City of Cape Town, “Business Plan for Phase 1A of Cape Town’s MyCiTi Integrated Rapid Transit System,” 7. 151 City of Cape Town, “2012 MyCiTi Business Plan: Phases 1A, 1B and N2 Express of Cape Town’s MyCiTi IRT System,” 7. 152 City of Cape Town, 7.
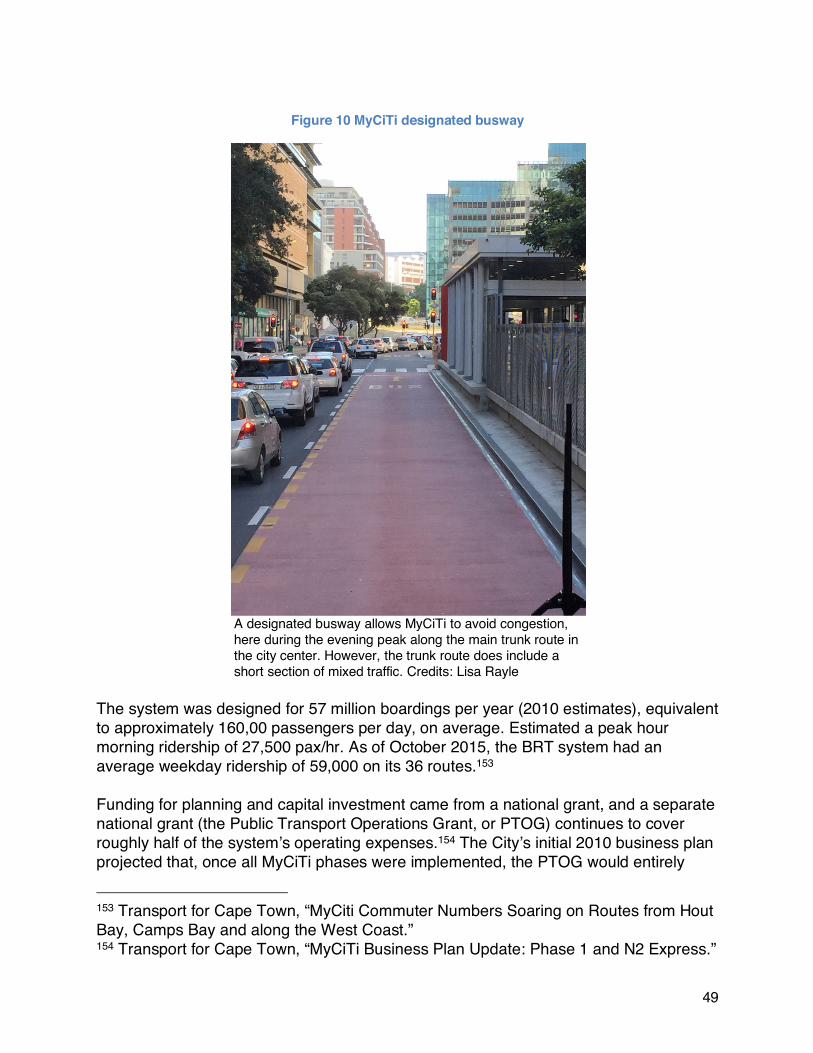
49
Figure 10 MyCiTi designated busway
A designated busway allows MyCiTi to avoid congestion, here during the evening peak along the main trunk route in the city center. However, the trunk route does include a short section of mixed traffic. Credits: Lisa Rayle
The system was designed for 57 million boardings per year (2010 estimates), equivalent to approximately 160,00 passengers per day, on average. Estimated a peak hour morning ridership of 27,500 pax/hr. As of October 2015, the BRT system had an average weekday ridership of 59,000 on its 36 routes.153 Funding for planning and capital investment came from a national grant, and a separate national grant (the Public Transport Operations Grant, or PTOG) continues to cover roughly half of the system’s operating expenses.154 The City’s initial 2010 business plan projected that, once all MyCiTi phases were implemented, the PTOG would entirely
153 Transport for Cape Town, “MyCiti Commuter Numbers Soaring on Routes from Hout Bay, Camps Bay and along the West Coast.” 154 Transport for Cape Town, “MyCiTi Business Plan Update: Phase 1 and N2 Express.”
50
cover operating expenses.155 Thus far, however, the city has had to supplement national subsidies for operating expenses. Furthermore, the deficit appears to be growing, rather than narrowing. The city reports that actual fare revenues have been lower than predicted, since ridership on some routes has fallen short of projections. Critically, the original travel demand model assumed all public transport users—including all minibus taxi passengers—would shift to MyCiTi, which has not happened. The original model, in the optimistic case also assumed 10% of current private transport users would switch to MyCiTi. Additionally, the negotiated vehicle operator contract costs were higher than initially estimated. In 2015 the city projected a R49 million deficit for 2016/2017, even after accounting for national and municipal funding sources.156 In response to the continued deficit in operating funding, in 2014 the City began “moderation exercises” to experiment with service cuts. The objective of these exercises was to test demand at various service levels. Several changes were tested, including reducing the number of peak buses, removing certain routes or time with low demand, increasing peak fares relative to off-peak fares, and optimizing routes to improve load factors. The city also increased enforcement of unlicensed minibus taxis. Before the moderation exercises, the overall system revenue cost ratio was 43%; after moderation it was improved to 69%. It’s not clear from available reports or sources the extent to which moderation affect service quality for passengers. A fundamental problem, which one could argue should have been anticipated in initial planning, is that travel demand in Cape Town is highly peaked, heavily one-directional, with very little diversity in destinations. This demand profile implies low seat turnover and requires a very high peak capacity, which will go underutilized at other times. While peaked demand is a problem common to virtually all transit systems, Cape Town planners have argued the city’s segregated and sprawling land use patterns make travel demand in this city unusually unbalanced.157 Intended and actual BRT-paratransit integration The 2012 MyCiTi Business Plan stated: “The City’s vision for public transport is driven by the need to integrate various modes of public transport into a single effective and seamless service.” The original vision, as laid out in the 2007 Integrated Transport Plan, was for BRT to eventually fully replace minibus taxis.158 Former minibus taxi routes would be replaced with a network of BRT trunk corridors and integrated feeders. The feeder routes would cover the existing minibus taxi service areas, but routes would be optimized for efficiency.
155 City of Cape Town, “Business Plan for Phase 1A of Cape Town’s MyCiTi Integrated Rapid Transit System.” 156 Transport for Cape Town, “MyCiTi Business Plan Update: Phase 1 and N2 Express.” 157 van Ryneveld, “Making MyCiTi Financially Sustainable.” 158 City of Cape Town, “Integrated Transport Plan 2006-2011 Review 2009,” 2006–11.
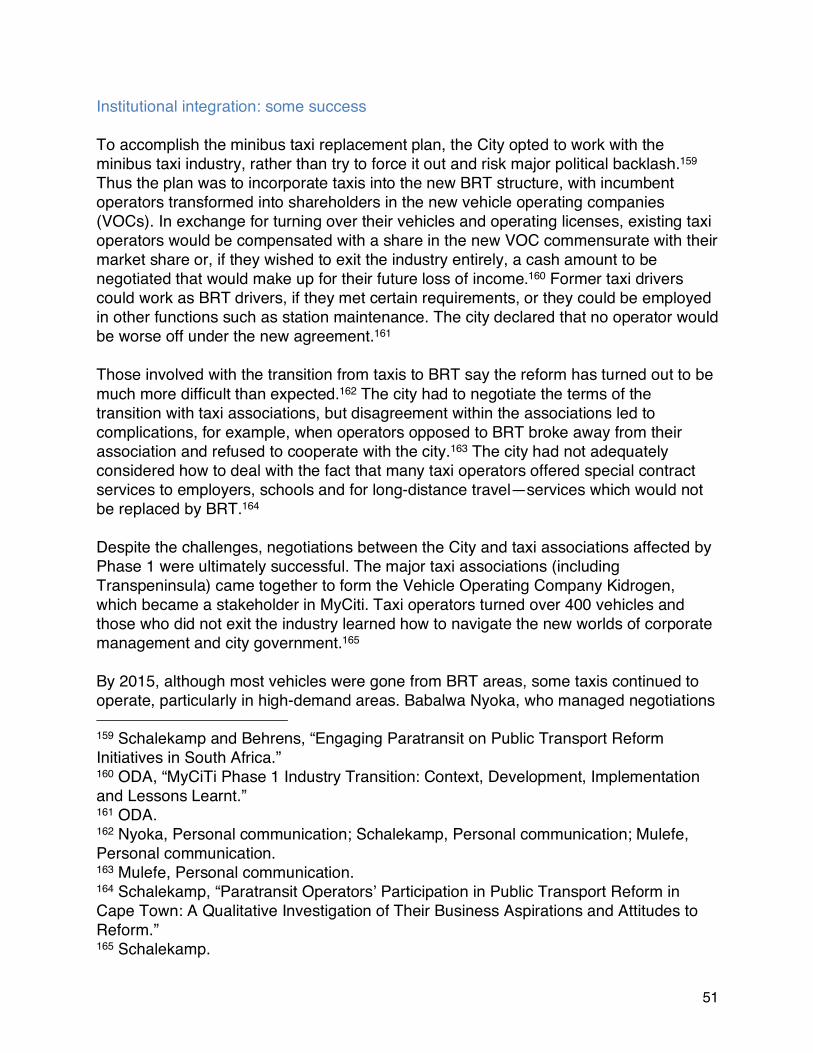
51
Institutional integration: some success To accomplish the minibus taxi replacement plan, the City opted to work with the minibus taxi industry, rather than try to force it out and risk major political backlash.159 Thus the plan was to incorporate taxis into the new BRT structure, with incumbent operators transformed into shareholders in the new vehicle operating companies (VOCs). In exchange for turning over their vehicles and operating licenses, existing taxi operators would be compensated with a share in the new VOC commensurate with their market share or, if they wished to exit the industry entirely, a cash amount to be negotiated that would make up for their future loss of income.160 Former taxi drivers could work as BRT drivers, if they met certain requirements, or they could be employed in other functions such as station maintenance. The city declared that no operator would be worse off under the new agreement.161 Those involved with the transition from taxis to BRT say the reform has turned out to be much more difficult than expected.162 The city had to negotiate the terms of the transition with taxi associations, but disagreement within the associations led to complications, for example, when operators opposed to BRT broke away from their association and refused to cooperate with the city.163 The city had not adequately considered how to deal with the fact that many taxi operators offered special contract services to employers, schools and for long-distance travel—services which would not be replaced by BRT.164 Despite the challenges, negotiations between the City and taxi associations affected by Phase 1 were ultimately successful. The major taxi associations (including Transpeninsula) came together to form the Vehicle Operating Company Kidrogen, which became a stakeholder in MyCiti. Taxi operators turned over 400 vehicles and those who did not exit the industry learned how to navigate the new worlds of corporate management and city government.165 By 2015, although most vehicles were gone from BRT areas, some taxis continued to operate, particularly in high-demand areas. Babalwa Nyoka, who managed negotiations 159 Schalekamp and Behrens, “Engaging Paratransit on Public Transport Reform Initiatives in South Africa.” 160 ODA, “MyCiTi Phase 1 Industry Transition: Context, Development, Implementation and Lessons Learnt.” 161 ODA. 162 Nyoka, Personal communication; Schalekamp, Personal communication; Mulefe, Personal communication. 163 Mulefe, Personal communication. 164 Schalekamp, “Paratransit Operators’ Participation in Public Transport Reform in Cape Town: A Qualitative Investigation of Their Business Aspirations and Attitudes to Reform.” 165 Schalekamp.
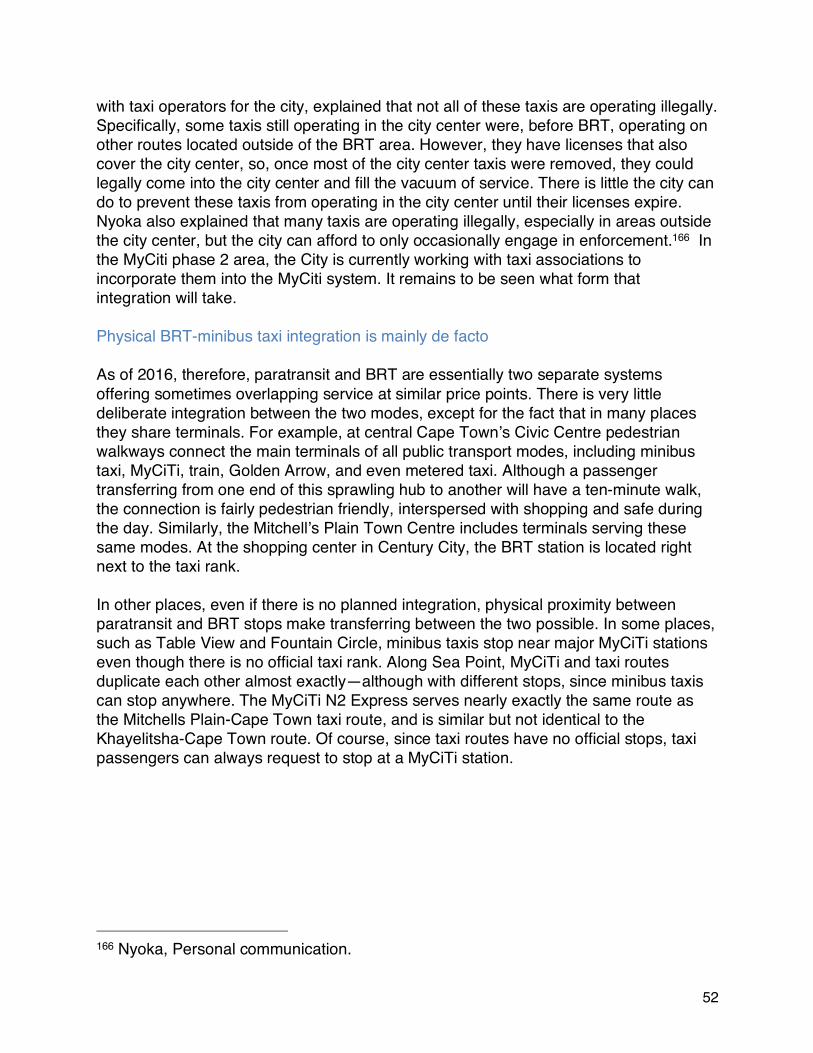
52
with taxi operators for the city, explained that not all of these taxis are operating illegally. Specifically, some taxis still operating in the city center were, before BRT, operating on other routes located outside of the BRT area. However, they have licenses that also cover the city center, so, once most of the city center taxis were removed, they could legally come into the city center and fill the vacuum of service. There is little the city can do to prevent these taxis from operating in the city center until their licenses expire. Nyoka also explained that many taxis are operating illegally, especially in areas outside the city center, but the city can afford to only occasionally engage in enforcement.166 In the MyCiti phase 2 area, the City is currently working with taxi associations to incorporate them into the MyCiti system. It remains to be seen what form that integration will take. Physical BRT-minibus taxi integration is mainly de facto As of 2016, therefore, paratransit and BRT are essentially two separate systems offering sometimes overlapping service at similar price points. There is very little deliberate integration between the two modes, except for the fact that in many places they share terminals. For example, at central Cape Town’s Civic Centre pedestrian walkways connect the main terminals of all public transport modes, including minibus taxi, MyCiTi, train, Golden Arrow, and even metered taxi. Although a passenger transferring from one end of this sprawling hub to another will have a ten-minute walk, the connection is fairly pedestrian friendly, interspersed with shopping and safe during the day. Similarly, the Mitchell’s Plain Town Centre includes terminals serving these same modes. At the shopping center in Century City, the BRT station is located right next to the taxi rank. In other places, even if there is no planned integration, physical proximity between paratransit and BRT stops make transferring between the two possible. In some places, such as Table View and Fountain Circle, minibus taxis stop near major MyCiTi stations even though there is no official taxi rank. Along Sea Point, MyCiTi and taxi routes duplicate each other almost exactly—although with different stops, since minibus taxis can stop anywhere. The MyCiTi N2 Express serves nearly exactly the same route as the Mitchells Plain-Cape Town taxi route, and is similar but not identical to the Khayelitsha-Cape Town route. Of course, since taxi routes have no official stops, taxi passengers can always request to stop at a MyCiTi station.
166 Nyoka, Personal communication.
53
Figure 11: MyCiTi feeder bus
Passengers board a MyCiTi feeder bus along the Sea Point route that is also served by minibus taxis. Credits: Lisa Rayle
Figure 12: Queue for minibus taxis
In morning peak hours, a queue forms in the city center for minibus taxis bound for Sea Point, a route also served by MyCiTi. Credits: Lisa Rayle)
54
No fare or information integration Initial plans called for an “integrated fare management system” for all public transport modes.167 However, there is currently no fare integration between BRT and taxis, or any other mode. Passengers transferring between modes must pay twice. Moreover, the two modes have completely different payment systems: MyCiTi uses a fare card exclusively, while taxis deal only with cash. Likewise, the information systems for each mode are completely separate and quite different. Information about the taxi system, meanwhile, is distributed mainly verbally; passengers who do not already know the routes can ask a rank marshal or a fellow passenger. MyCiTi maps and route schedules, meanwhile, are displayed at stations and the MyCiTi website, although MyCiTi workers at each station will also give information verbally. The “comprehensive passenger information system” the city had originally planned to integrate information about all modes does not yet exist.168
167 City of Cape Town, “Business Plan for Phase 1A of Cape Town’s MyCiTi Integrated Rapid Transit System,” 5. 168 City of Cape Town, “Business Plan for Phase 1A of Cape Town’s MyCiTi Integrated Rapid Transit System.”
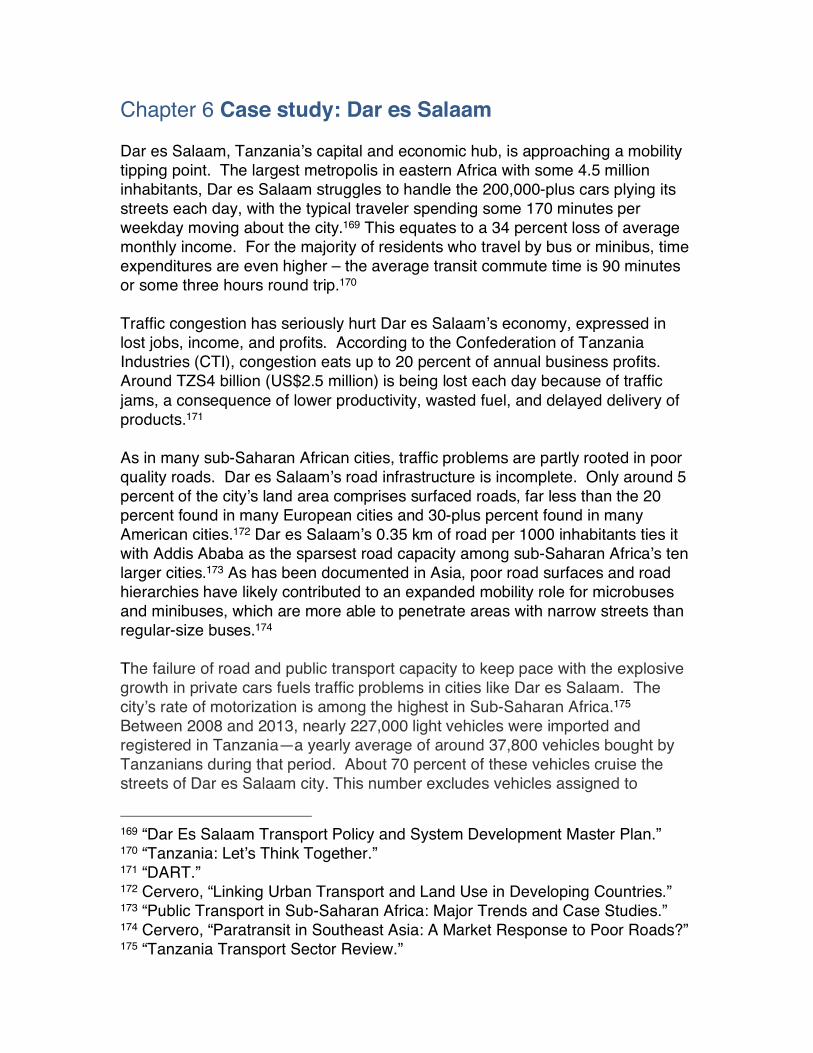
Chapter 6 Case study: Dar es Salaam Dar es Salaam, Tanzania’s capital and economic hub, is approaching a mobility tipping point. The largest metropolis in eastern Africa with some 4.5 million inhabitants, Dar es Salaam struggles to handle the 200,000-plus cars plying its streets each day, with the typical traveler spending some 170 minutes per weekday moving about the city.169 This equates to a 34 percent loss of average monthly income. For the majority of residents who travel by bus or minibus, time expenditures are even higher – the average transit commute time is 90 minutes or some three hours round trip.170 Traffic congestion has seriously hurt Dar es Salaam’s economy, expressed in lost jobs, income, and profits. According to the Confederation of Tanzania Industries (CTI), congestion eats up to 20 percent of annual business profits. Around TZS4 billion (US$2.5 million) is being lost each day because of traffic jams, a consequence of lower productivity, wasted fuel, and delayed delivery of products.171 As in many sub-Saharan African cities, traffic problems are partly rooted in poor quality roads. Dar es Salaam’s road infrastructure is incomplete. Only around 5 percent of the city’s land area comprises surfaced roads, far less than the 20 percent found in many European cities and 30-plus percent found in many American cities.172 Dar es Salaam’s 0.35 km of road per 1000 inhabitants ties it with Addis Ababa as the sparsest road capacity among sub-Saharan Africa’s ten larger cities.173 As has been documented in Asia, poor road surfaces and road hierarchies have likely contributed to an expanded mobility role for microbuses and minibuses, which are more able to penetrate areas with narrow streets than regular-size buses.174 The failure of road and public transport capacity to keep pace with the explosive growth in private cars fuels traffic problems in cities like Dar es Salaam. The city’s rate of motorization is among the highest in Sub-Saharan Africa.175 Between 2008 and 2013, nearly 227,000 light vehicles were imported and registered in Tanzania—a yearly average of around 37,800 vehicles bought by Tanzanians during that period. About 70 percent of these vehicles cruise the streets of Dar es Salaam city. This number excludes vehicles assigned to
169 “Dar Es Salaam Transport Policy and System Development Master Plan.” 170 “Tanzania: Let’s Think Together.” 171 “DART.” 172 Cervero, “Linking Urban Transport and Land Use in Developing Countries.” 173 “Public Transport in Sub-Saharan Africa: Major Trends and Case Studies.” 174 Cervero, “Paratransit in Southeast Asia: A Market Response to Poor Roads?” 175 “Tanzania Transport Sector Review.”

56
government officials, the police, the army and donor-funded projects. The failure to expand road infrastructure and public transport services in step with rising motorization lies at the root of the city’s mounting traffic congestion and environmental problems. Fragmented Mass Transit Dar es Salaam has long relied upon private operators for mass transportation services. Minibuses, called locally ‘Dala Dala’, carry some 3.5 million passengers each day along some 300-plus routes. In 2010, the annual ridership of 338 trips per person on private buses and minibuses and 58 percent market share of motorized trips by transit was among the highest of Sub-Saharan African cities.176 Consisting mostly of mid-size buses with a capacity of 40 passengers but also minibuses that carry half as many passengers, estimates of the number of Dala Dalas varies, from 5200 to as many as 9500.177 As with car and truck traffic, most Dala Dala routes converge on the core where most customers head each morning, creating exceedingly high traffic densities (Figure 13). Larger buses concentrate in the urban core while smaller ones serve outlying districts in addition to the core. Boarding and alighting occurs mostly on demand versus at designated bus stops. Many of the problems from a loosely regulated, highly competitive private minibus industry found in the developing world exist in Dar es Salaam – e.g., reckless driving, overloading vehicles, collecting and discharging passengers away from the curb, and over-concentration of vehicles at major access points, such as markets, roundabouts, and major intersections.178
176 “Public Transport in Sub-Saharan Africa: Major Trends and Case Studies.” 177 The estimated number of Dala Dala vehicles differ depending on the source. Official counts based on registered vehicles indicate some 5300 minibuses ply the streets of Dar es Salaam however unofficial estimates place the figure far higher, above 9000 on any given weekday 178 Cervero and Golub, “Informal Transport.”
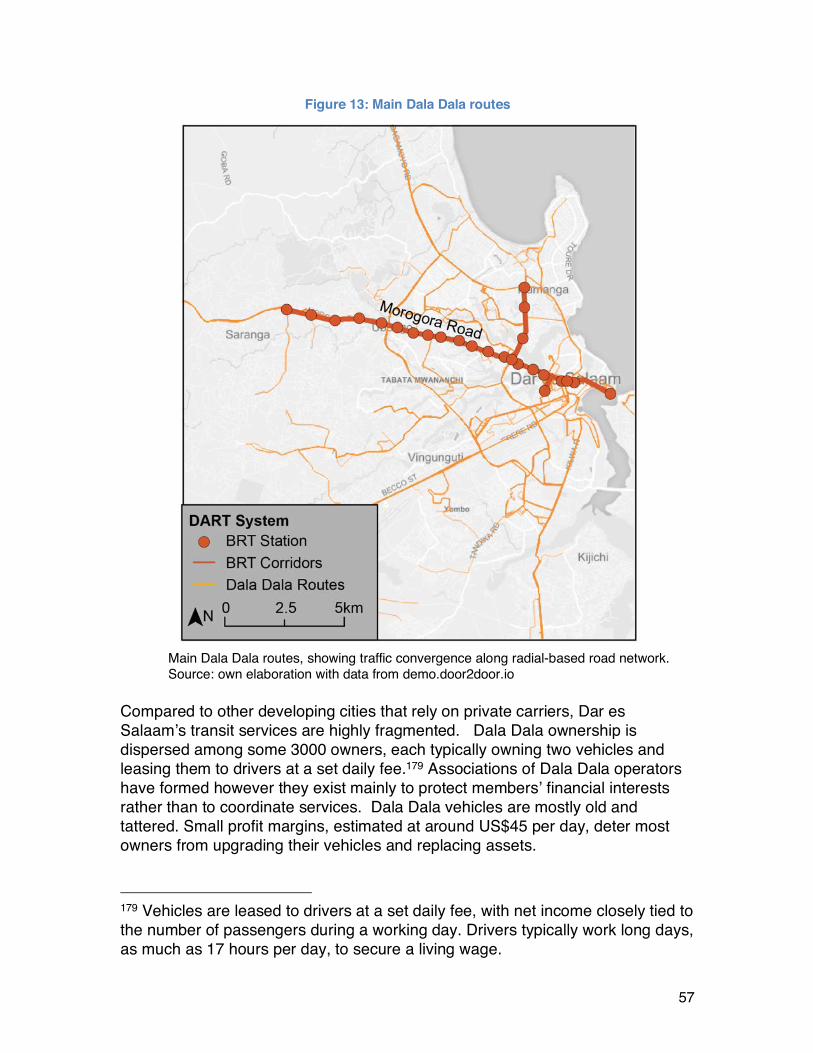
57
Figure 13: Main Dala Dala routes
Main Dala Dala routes, showing traffic convergence along radial-based road network. Source: own elaboration with data from demo.door2door.io
Compared to other developing cities that rely on private carriers, Dar es Salaam’s transit services are highly fragmented. Dala Dala ownership is dispersed among some 3000 owners, each typically owning two vehicles and leasing them to drivers at a set daily fee.179 Associations of Dala Dala operators have formed however they exist mainly to protect members’ financial interests rather than to coordinate services. Dala Dala vehicles are mostly old and tattered. Small profit margins, estimated at around US$45 per day, deter most owners from upgrading their vehicles and replacing assets. 179 Vehicles are leased to drivers at a set daily fee, with net income closely tied to the number of passengers during a working day. Drivers typically work long days, as much as 17 hours per day, to secure a living wage.

58
Other private transit services can be found on the streets of Dar es Salaam as well. Around 28,000 three-wheel bajas operate in the region, as do a smaller number of motorcycle taxis, called Bodas Bodas. Bajajs, imported from India, are fairly new, having first appeared in 2010. They have become increasingly popular in part because they are viewed as safer and more comfortable than Dala Dalas. Three-wheelers and motorcycle taxis often concentrate around Dala Dala stops and taxi stands in hopes of poaching customers. The role of full-size public buses, operated as UDA under a 25-year franchise concession, is fairly modest, comprising less than 5 percent of city’s fleet of medium to large size buses and an even smaller share of public-transport trips. Passenger and vehicle ferries as well as a limited commuter rail service make up the remainder of the city’s mass transportation system. Heavy reliance on private mass transit services has hurt Dar es Salaam’s poor financially. Taking a series of informal minibuses and motorized tricycles as well as passenger ferries to and from work can cost 30 percent of daily wages among low-income workers living on the periphery in Sub-Saharan African cities, including Dar es Salaam.180 Middle-income workers normally spend less than a tenth of their earnings on commuting.181 Modernizing Transit with BRT The most substantial public investment being made in Dar es Salaam today is a high-end Bus Rapid Transit (BRT) system. The Dar es Salaam Rapid Transit (DART) system will extend 130 km in length at build out, scheduled for 2022. Estimated to cost US$9 million per kilometer to build, DART offers unprecedented opportunities to not only upgrade and rationalize public transport services and reduce traffic congestion but also to shape future regional growth in a more sustainable, less car-dependent format. Figure 14 shows the planned 130 km DART system at built out, which is to unfold over six phases. A largely radial-circumferential BRT network will take form, serving the central city as well as outlying commercial and office precincts. Among the region’s major activity centers to be served are the central business district, maritime port, fish market, government center, major regional hospital, international airport, and commercial marketplaces.
180 Carruthers, Dick, and Saurkar, “Affordability of Public Transport in Developing Countries.” 181 Vasconcellos, Urban Transport Environment and Equity.
59
Figure 14: Six Phase DART BRT network
Source: Adapted from DART official website
BRT Operations, System Design and Interim Services DART is being built as a trunk-feeder system – i.e., feeder buses operating in mixed traffic that connect to dedicated-lane trunk corridors – modeled after Latin American BRT systems, notably Bogota’s TransMilenio. A closed BRT system will be operated, restricted to clean-fuel buses with designated DART logos that operate exclusively along dedicated running ways. Smaller buses that are part of the DART system will connect to stations, resulting in many passengers making a minibus-to-BRT transfer. As a high-end BRT system, DART is designed to handle high passenger volumes. The maximum capacity (for phase 1) of 28,000 passengers per direction per hour begins to match the throughputs of many metro-rail systems, albeit at a fraction of the cost. Dual-lanes at stations and centralized train monitoring to reduce bunching will make this possible. This projected passenger throughput is expected exceed that of many celebrated BRT systems worldwide, including Curitiba’s and Mexico City’s.
60
After several rounds of delays, tied to disagreements over operating contract provisions, the first phase of DART (along Morogora Road, shown in Figure 14) opened in May 2016. By mid-2017, a year into service, DART buses are routinely full and the system’s daily ridership of more than 160,000 well exceeds the first-year daily ridership target of 100,000 passengers. DART’s 2017 ridership productivity of 7,600 daily passengers per kilometer of BRT line is 6 to 7 times higher than BRT systems in Cape Town and Johannesburg South Africa and on a par with Africa’s other BRT service in Lagos, Nigeria.’182 As an entirely new form of transportation in the city, ‘teething problems’ have not unexpectedly surfaced. Within the first week of DART operations, 27 accidents were recorded, though no fatalities. Most accidents were between DART buses and motorcycles encroaching on lanes. Stepped up policy enforcement along DART corridors appears to have reduced such incidences. Other problems have surfaced that also need to be ironed out, like long queues to purchase bus tickets and bus bunching in peak periods. Notwithstanding such teething problems, preliminary assessments of DART suggest some positive outcomes. In a recent review of the first few months of DART services, ITDP writes:
“The DART system has dramatically reduced commute times for Dar es Salaam residents, who previously faced upwards of 4 hours stuck in traffic each day. For passengers taking DART, a trip from Kimara to Kivukoni or Gerezani or Kariokoo now takes only 45 minutes. In addition, most stations have overtaking lanes, allowing a portion of the fleet to provide express services to key destinations.”183
As of Spring 2017, some nine months into the phase-one implementation of DART, the World Bank estimates that BRT has reduced peak-period travel times by around 75 percent relative to Dala Dala minibus services.184 Travel time savings are mostly attributable to DART vehicles operating on a protected, dedicated running way. Paratransit Integration and Displacement A significant challenge in mounting a high-quality public transport system in Dar es Salaam is to successfully integrate private minibus and BRT services along
182 “Global BRT Data.” 183 ITDP, “Dar Es Salaam’s BRT Could Transform Urban Life in Tanzania.” 184 “Time Is Money: Transforming Dar Es Salaam’s Road Transport to Reduce Dense Traffic.”
61
DART corridors. Complicating matters is the historically fragmented and atomized nature of private bus services in Dar es Salaam. Cities like Johannesburg and Mexico City have successfully integrated minibus services with mainline BRT, largely by making former paratransit operators company share-holders and operators of private BRT services.185 However minibus operators in these and other BRT cities were better organized (through cooperatives and route associations) than in Dar es Salaam. The highly disjointed nature of Dala Dala services will complicate negotiations and consensus-building, impeding service-integration efforts. The 2008 Dar es Salaam Transport Policy and System Development Master Plan addressed the touchy topic of BRT-paratransit service integration. The plan called for a community-based decision-making approach that balances the interests of three stakeholder groups: the government, an owner/operator community group, and a management group. The plan characterizes Dala Dala as “unmanageable due to its fragmented nature (individual ownership) and operation style”.186 Official policy calls for the eventual elimination of private, small-vehicle carriers from the streets of Dar es Salaam. The DART system itself has few accommodations for private transit. Only terminal stations will accommodate Dala Dala feeders; at all other stations, access by Dala Dalas, three-wheelers, motorcycle-taxis, and regular taxis will occur off-site. Plans call for feeder buses to eventually become part of the formal DART network, identified by DART logos and driven by DART employees or subcontractors.187 DART hoped that within the first few years of operations, BRT services will lead to the removal of 1500 Dala Dala vehicles from the streets of Dar es Salaam, shrinking the number of operators by one-quarter to one-sixth.188 Dala Dala routes that run parallel to the DART trunk and feeder systems are to be eliminated altogether. Along the mixed traffic lanes of trunk corridors, no bus-bays are being built. If Dala Dalas were to continue operating along these corridors, they will be forced to stop in traffic lanes, thereby reduce the carrying
185 Behrens and Salazar Ferro, “Paratransit and Formal Public Transport Operational Complementarity: Imperatives, Alternatives and Dilemmas.” 186 “Dar Es Salaam Transport Policy and System Development Master Plan.” 187 BRT operators are to be paid by kilometers of operation for trunk-line services. For feeder services, payments to minibus operators will be on a per passenger basis. Past experiences suggest that when paid on the basis of passengers carried, minibus operators tend to aggressively compete with other carriers. 188 “Time Is Money: Transforming Dar Es Salaam’s Road Transport to Reduce Dense Traffic.”
62
capacity of these lanes. This, it was hoped, would in turn prompt more travelers to switch to BRT. The elimination of parallel Dala Dala routes will prompt some operators to relocate to other districts or Tanzanian cities while other workers are likely to pursue other employment opportunities.189, 190 For the most part, displaced operators will relocate in less lucrative suburban, exurban, and small-town markets. Job losses could be substantial. They will occur not only to operators of Dala Dala vehicles but also indirectly through the supply chain of subsidiary businesses – e.g., parts suppliers, repair shops, street vendors, and terminal operators (who sell customers to operators). These are mostly low-skilled jobs that will be hard to absorb in the formal economy. Mounting programs that offer existing Dala Dala operators job training and pathways to more productive employment will be critical to ensuring a smooth transition from the current fragmented system to a more formalized, high-quality public transport system organized around BRT. The need to address employment losses and incorporate incumbent operators into DART is a significant stumbling block in the way of implementing the Dar es Salaam plan.191 In the early stages of DART planning, working groups of Dala Dala owners and representatives of bus owner associations (DARCOBOA and UWADA) were formed to provide input on the project design.192 DART is legally obligated to enter into consultation with drivers and owners to minimize displacement effects. A private firm was hired to survey drivers on actionable strategies that would minimize negative impacts. The overwhelming preference expressed by incumbents was to incorporate Dala Dala owners and operators into private companies hired to operate and maintain BRT services. This could take the form of Data Dala operators becoming shareholders and subcontractors of firms contracted to operate the system. However, a survey of 388 Dala Dala routes by local government found that only 14 percent of drivers meet the qualifications to work for DART – under 40 years of age and at least an “O” Level Secondary School education.193 This means the remaining 86 percent will have to work on relocated Dala Dala routes or in areas unrelated to the BRT. Even if DART could hire Dala Dala drivers, many fear their net take-home pay will decline as a result. Moreover, an estimated two-thirds of Dala Dala vehicle 189 “DAR Resettlement of Commuter Buses (Dala Dala).” 190 The Resettlement Plan calls for government to cover the fees for vocational retraining of Dala Dala operators, up to an agreed maximum. 191 “DAR Resettlement of Commuter Buses (Dala Dala),” 21. 192 Two Dala Dala owners’ associations have formed: Dar es Salaam Commuter Bus Owners’ Association (DARCOBOA) -- 600 owners; and Association of Transporters in Dar es Salaam (UWADAR) -- 150 owners. 193 “DAR Resettlement of Commuter Buses (Dala Dala).”
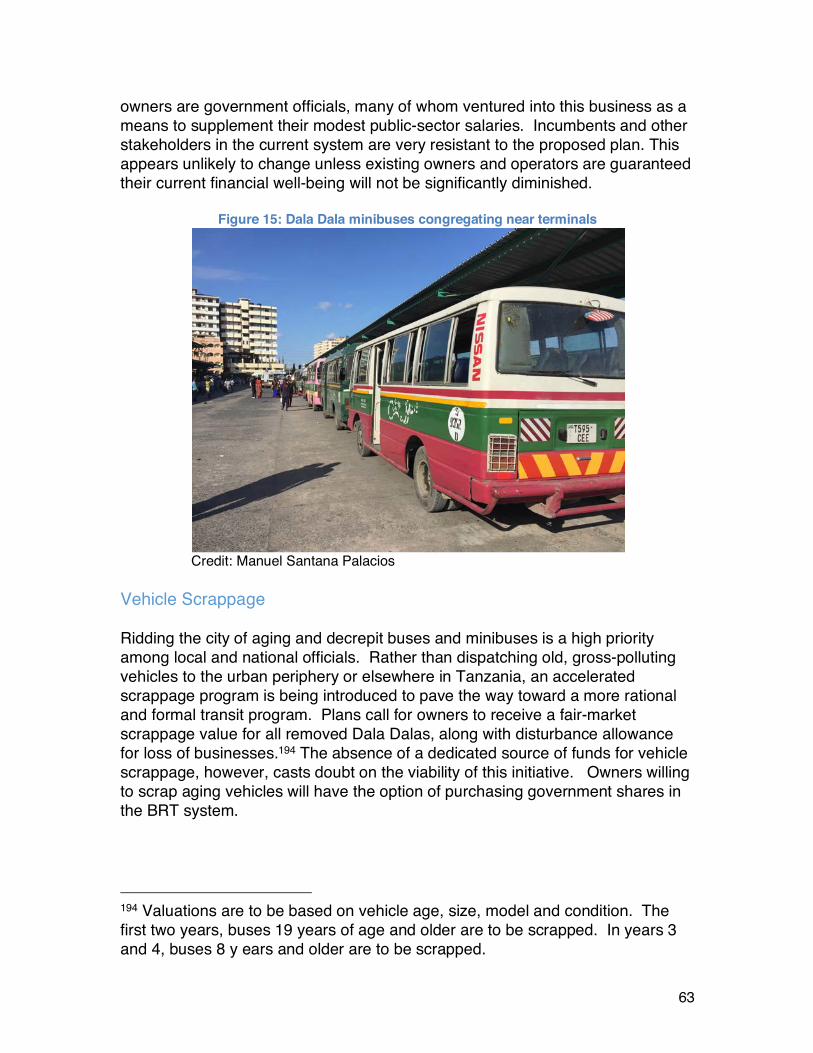
63
owners are government officials, many of whom ventured into this business as a means to supplement their modest public-sector salaries. Incumbents and other stakeholders in the current system are very resistant to the proposed plan. This appears unlikely to change unless existing owners and operators are guaranteed their current financial well-being will not be significantly diminished.
Figure 15: Dala Dala minibuses congregating near terminals
Credit: Manuel Santana Palacios
Vehicle Scrappage Ridding the city of aging and decrepit buses and minibuses is a high priority among local and national officials. Rather than dispatching old, gross-polluting vehicles to the urban periphery or elsewhere in Tanzania, an accelerated scrappage program is being introduced to pave the way toward a more rational and formal transit program. Plans call for owners to receive a fair-market scrappage value for all removed Dala Dalas, along with disturbance allowance for loss of businesses.194 The absence of a dedicated source of funds for vehicle scrappage, however, casts doubt on the viability of this initiative. Owners willing to scrap aging vehicles will have the option of purchasing government shares in the BRT system.
194 Valuations are to be based on vehicle age, size, model and condition. The first two years, buses 19 years of age and older are to be scrapped. In years 3 and 4, buses 8 y ears and older are to be scrapped.
64
Other Challenges to BRT-Paratransit Integration In addition to the organizational and institutional obstacles, other factors complicate the ability to successfully integrate BRT and paratransit in cities like Dar es Salaam. These include:
• Weak local governance and accountability. Both locally and nationally, transportation decision-making is highly fragmented and for the most part, uncoordinated. For example, public transport regulation and oversight in all Tanzanian metropolitan areas is presently spread over five separate institutions. Fragmentation exists not only across functions (e.g., regulations, revenue collection, planning) but also across tiers of government. A lack of technical capacity within public authorities further impedes progress.
• Minimal planning for redeployment. There is currently no local plan on how Dala Dala operators might be redistributed to other routes or parts of the city as complementary services to BRT. In the absence of a redeployment plan and adequate compensation to paratransit operators, Dala Dala drivers will likely continue aggressively competing for the most profitable routes. Poor road conditions, moreover, will deter many drivers from venturing outside the core area. With less than a quarter of outlying roads paved, drivers are apt to resist efforts to relocate to outlying areas, where roads are impassable during heavy rainfall and heavily rutted, increasing vehicle maintenance and tire replacement costs.
• Incomplete vehicle and driver registries. Registries on bus ownership and driver credentials are incomplete and out-of-date in much of Tanzania. Moreover, buses are often sold many times and have competing claims of ownership. High turn-over rates of drivers further complicate record-keeping.
• Lack of capital for Dala Dala owners to participate in tender process. Income from vehicle scrappage will be insufficient for many vehicle owners to bid for a stake in the DART organization.
• Possibilities for micro-transit integration has been mostly ignored. Little attention has been given to incorporating three wheelers (bajas) and motorcycle taxis (Boda Bodas) into the BRT network, as local officials are consumed by other more pressing issues. Absent a management plan, micro-vehicles will likely congregate a block or two away from DART stations, possibly obstructing regular bus access to stations.
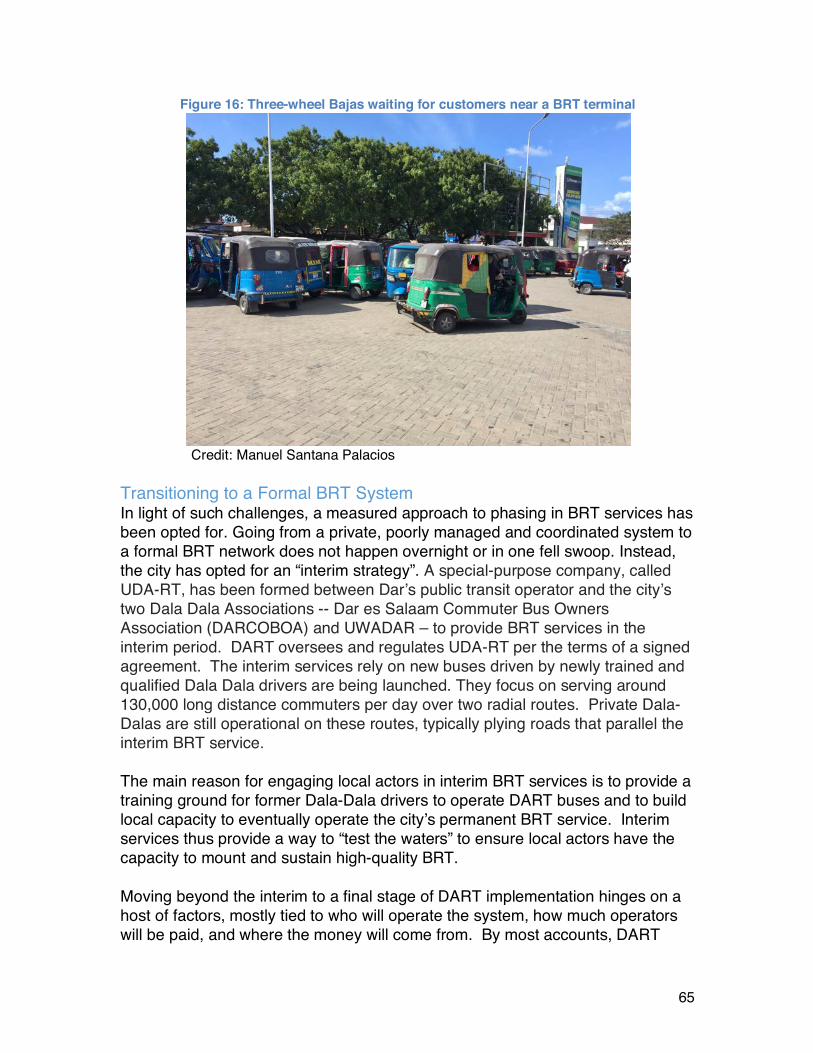
65
Figure 16: Three-wheel Bajas waiting for customers near a BRT terminal
Credit: Manuel Santana Palacios
Transitioning to a Formal BRT System In light of such challenges, a measured approach to phasing in BRT services has been opted for. Going from a private, poorly managed and coordinated system to a formal BRT network does not happen overnight or in one fell swoop. Instead, the city has opted for an “interim strategy”. A special-purpose company, called UDA-RT, has been formed between Dar’s public transit operator and the city’s two Dala Dala Associations -- Dar es Salaam Commuter Bus Owners Association (DARCOBOA) and UWADAR – to provide BRT services in the interim period. DART oversees and regulates UDA-RT per the terms of a signed agreement. The interim services rely on new buses driven by newly trained and qualified Dala Dala drivers are being launched. They focus on serving around 130,000 long distance commuters per day over two radial routes. Private Dala-Dalas are still operational on these routes, typically plying roads that parallel the interim BRT service. The main reason for engaging local actors in interim BRT services is to provide a training ground for former Dala-Dala drivers to operate DART buses and to build local capacity to eventually operate the city’s permanent BRT service. Interim services thus provide a way to “test the waters” to ensure local actors have the capacity to mount and sustain high-quality BRT. Moving beyond the interim to a final stage of DART implementation hinges on a host of factors, mostly tied to who will operate the system, how much operators will be paid, and where the money will come from. By most accounts, DART
66
operations are expected to involve a joint venture between local interests, represented by DARCOBA and UWADAR as well as some government financial stake, and a consortium from abroad with international experience in managing and operating BRT. Also delaying the transition to a final, permanent organizational structure for operating BRT are disagreements over the fare system and even the degree of fare automation. Delays are costly, not only in terms of lost opportunities to reduce traffic congestion but even in terms of asset management and system maintenance. The first two years of in-operation, when the DART running-ways and station infrastructure laid fallow, thieves stole metal parts from BRT stations, necessitating the replacement of missing components. Having a well-designed, smartly managed BRT system up-and-running as quickly as possible is the best way to avoid such dysfunctionalities and to put DART’s financial house as in good order as might be hoped for.
Chapter 7 Case study: Jakarta A recent survey of 78 global cities earned Indonesia’s capital city, Jakarta, the dubious distinction of being the most congested. Using data shared anonymously by millions of TomTom navigation device users, Jakarta drivers were found to average over 33,000 stops-and-starts per year, more than any city.195 One estimate pegs the total annual cost of traffic congestion -- measured in time delays, fuel consumption, and health impacts -- at US$ 1 billion, or US$100 per person.196 The absence of a high-quality, high-capacity public transportation system bears some of the blame for Jakarta’s perennial traffic woes. With more than 10 million inhabitants, Jakarta is one of the world’s largest and densest cities without a metrorail. The exodus of businesses and foreign investors from traffic-choked Jakarta, among other factors, prompted local and national officials to fast-track the construction of a mostly elevated metrorail system, slated to open in late-2017. An expansive BRT network is also part of the mix of inching toward a world-class transit network. The BRT system, TransJakarta, launched in 2004, thus preceding metrorail by well over a decade. However due to its minimalist design (e.g., no passing lanes), operational problems (e.g., widespread bus bunching), and failure to integrate paratransit services as feeders, the system has struggled to play a major mobility role, particularly among the growing legion of Jakarta’s car-owning, middle-class travelers. Partly because of Jakarta’s longstanding traffic problems, a substantial paratransit sector has evolved over the years.197 Jakarta’s paratransit offerings, which handle more than half of motorized transit trips in the city, span a wide array of services in terms of seating capacity and geographic coverage. The market has segmented into two groups. Small vehicles -- pedicabs (becaks), for-hire motorcycles (ojeks), and three-wheelers (bajas and bemos) -- offer door-to-door taxi-like services. Larger ones -- pickup sized microbuses (mikrolets) and slightly larger minibuses (MetroMini and Kopaja) -- mimic the operations of fixed-route transit. This hierarchy of small-to-medium-size carriers has allowed virtually every corner of the metropolis to be reached by some form of mass transit. Small-vehicle transit has been particularly vital in serving informal housing settlements (kampungs) that suffer limited road access and often are impenetrable by regular-size buses. Jakarta’s full-sized city-owned TransJakarta buses function as long-distance, mainline carriers, operating as much as possible along dedicated center-lane 195 Wardhani and Budiari, “Jakarta Has ‘the Worst Traffic in the World.’” 196 Rini, “Urban Public Transport System in Jakarta.” 197 Cervero, Informal Transport in the Developing World.
68
running-ways. Smaller paratransit services sometime serve as BRT feeders however larger minibuses – i.e., MetroMinim and Kopaja – often run parallel to and compete with TransJakarta. Historically Jakarta’s public and private realms of mass transit have operated independently of each other, with separate fares and uncoordinated services. Mega-cities like Jakarta require a robust, well-utilized mass transit sector to function and compete in the 21st century global economy. Currently, mass transit is used by only 56 percent of Jakarta’s commuters each workday.198 With a 9.5 percent annual growth rate in motorized vehicles -- compared to a less than 1 percent average annual increase in road capacity – mass transit must grab a much larger share of future trips if traffic congestion is be reversed or even held in check. Building a high-quality metrorail system will help but given the region’s spread-out settlement patterns, as important will be an extensive and well-integrated rubber-tire surface transit network, involving both TransJakarta BRT and private carriers. TransJakarta BRT Stretching 210 km in length, the TransJakarta BRT system is one of the world’s longest. With stations and running ways costing just over US$1 million per kilometer to build, it is also one of the cheapest. At build-out, the system is to span more than 250 km in length, operating along 12 corridors (Figure 17). Despite operating on a dedicated, exclusive running way, what might be called a ‘BRT lite’ design has constrained passenger throughputs. The system’s peak capacity of 3400 passengers per direction per hour is but one-twelfth that of Bogota’s BRT, what the Institute of Transportation Development and Policy (ITDP) calls the ‘Gold Standard’ of BRT.199 Recent years have seen a surge in TransJakarta ridership, climbing more than 40 percent from mid-2015 to mid-2017, when the daily count of passengers reached an all-time high of 450,000. Historically, TransJakarta has operated as closed trunk-only system, absent feeder buses that dock at stations (Figure 17). The absence of integrated feeder services has unavoidably also constrained ridership. A 2010 survey estimated that three-quarters of TransJakarta BRT riders transferred from medium-size or micro-buses, forced to pay multiple fares.200 By one estimate, daily BRT ridership has stagnated (at the time, at around 350,000 passengers), despite an expanding system and ever-worsening traffic, in part because of poorly integrated mainline and feeder services.201 Other problems have included bus
198 Rini, “Urban Public Transport System in Jakarta.” 199 “The BRT Standard.” 200 “Implementing Low Carbon Public Transportation - Direct Service Report.” 201 “TransJakarta Could Lose Yet More Passengers.”
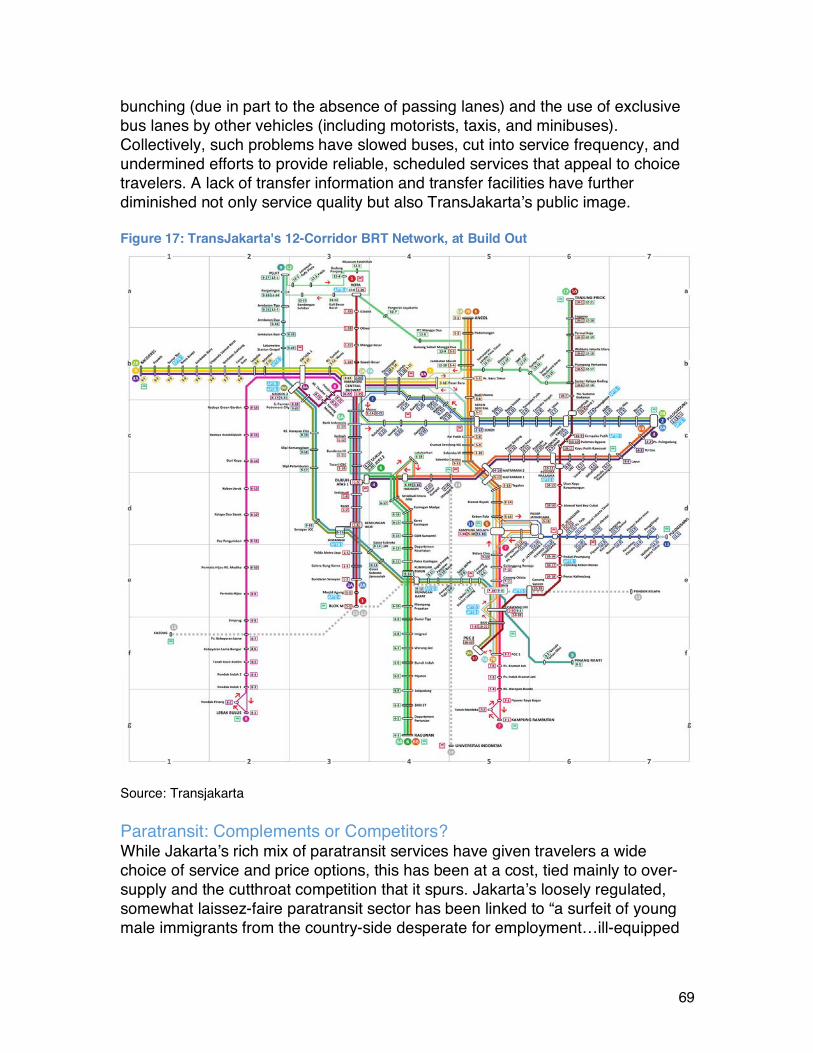
69
bunching (due in part to the absence of passing lanes) and the use of exclusive bus lanes by other vehicles (including motorists, taxis, and minibuses). Collectively, such problems have slowed buses, cut into service frequency, and undermined efforts to provide reliable, scheduled services that appeal to choice travelers. A lack of transfer information and transfer facilities have further diminished not only service quality but also TransJakarta’s public image. Figure 17: TransJakarta's 12-Corridor BRT Network, at Build Out
Source: Transjakarta Paratransit: Complements or Competitors? While Jakarta’s rich mix of paratransit services have given travelers a wide choice of service and price options, this has been at a cost, tied mainly to over-supply and the cutthroat competition that it spurs. Jakarta’s loosely regulated, somewhat laissez-faire paratransit sector has been linked to “a surfeit of young male immigrants from the country-side desperate for employment…ill-equipped
70
for the city’s highly competitive formal labor market”.202 Many newcomers view driving a three-wheeler, micro-bus, or minibus as a gateway job – a stepping-stone to one-day entering the formal economy and achieving financial success. Jakarta’s resulting paratransit sector is one of thousands and thousands of vehicle owners, operators, and ticket-collectors, and hundreds and hundreds of small firms and individuals who lease vehicles to drivers, whose main goal is to maximize daily profits. Setting the stage for cutthroat competition in Jakarta’s paratransit sector is the practice of setoran, Indonesian for ‘set fee’. Under setoran, drivers pay an agreed-upon set amount to vehicle owners each day, netting what is left after the daily fee is paid. To make enough to cover housing, food, and remittances to families back home, drivers work long hours and hustle for as many fare-paying customers as possible. Operationally, this translates into drivers waiting for customers to fill vehicles before departing curbsides, however long it might take. Some drive recklessly to beat other vehicles to waiting customers, contributing to traffic tie-ups and road accidents. While micro-vehicles like ojeks, bajajs, and bemos provide complementary feeder services to BRT stations, because of their limited geographic range in a sprawling metropolis, their overall mobility role is fairly limited. For the vast majority of out-of-neighborhood trips, larger minibuses take on a more substantial mobility role. For the most part, minibuses compete with BRT rather than complement it as a feeder. A common sight is 20-30 seat minibuses running parallel to TransJakarta routes, often stopping to pick up and drop off passengers near or in-between BRT stations. Although a competitor, the estimated 4,600 privately owned and operated minibuses that currently ply the streets of Jakarta also supplement BRT services. Despite being the world’s longest BRT system, TransJakarta does not serve the majority of kampungs, residential subdivisions, activity centers, and other major trip generators spread throughout the metropolis. Minibuses, on the other hand, do. Two cooperatives of minibus operators – Kopaja (1500 minibuses and 600 bus owners) and MetroMini (3,100 minibuses and over 1000 owners) – have been formed to coordinate and rationalize minibus services, in addition to the other things cooperative do (e.g., politically lobby for interests of minibus owners). A significant share of Kopaja and MetroMini routes criss-cross throughout metropolitan Jakarta, providing connectivity to areas – both residential and commercial – unserved by TransJakarta. Until recently, Jakarta’s minibus services suffered from many of the problems of a loosely regulated paratransit industry. Almost all vehicles were 12 years or 202 Cervero, “From Becaks and Ojeks to Microbuses and Minibuses: Jakarta, Indonesia.”

71
older. Lax environmental legislation and enforcement meant many were gross-polluters. With minibus drivers working under the setoran system, hyper-aggressive driving became the norm, especially along stretches paralleling TransJakarta routes. With minibuses carrying far more customers than TransJakarta but in mixed-traffic conditions, the majority of the city’s transit riders experience jam-packed conditions in stop-and-go traffic BRT-Minibus Integration The importance of better linking minibus and BRT services has not been lost on Jakarta policy-makers. In 2005, within a year of opening the BRT system, TransJakarta officials tried to expand paratransit feeder connections by offering discounted transfer tickets. Private companies were to be reimbursed for the difference between discounts and regular fares. However, the program never materialized because drivers and bus owners feared they would not be fully reimbursed by TransJakarta. A culture of mistrust among urban transport competitors and a lack of confidence in the capacity and wherewithal of government officials to implement the system thwarted implementation. A second attempt at BRT-minibus integration, spearheaded by an NGO – the Jakarta office of IDTP – proved more successful. Motivating this effort was not only a desire to link minibuses and BRT but also an interest in re-configuring transit services to better match the region’s travel patterns. Notably, ITDP’s professional staff argued that the reliance on trunk-feeder connectivity, as in Latin American systems, was cutting into potential BRT ridership. For many Jakartans, BRT lines are too far removed from their residences and their ultimate destinations. Rather than take a private minibus and transfer to BRT, incurring the costs of two fares, many travelers instead rely on private minibuses for the full trip, paying a single fare. MetroMini and Kopaja, in the quest of maximize profits, proceeded to align minibus routes to serve origin-destination combinations unserved by TransJakarta. ITDP argued that more vehicles operating on TransJakarta’s running-way need to provide direct-line service, offering near door-to-door connectivity, as found in many Chinese cities.203 While TransJakarta operates as a trunk-only system, MetroMini and Kopaja services are more akin to direct-line services – i.e., a combination of feeder and mainline connectivity, all in one vehicle and at one fare. However, the massive volumes of private minibuses, many converging on major thoroughfares that parallel TransJakarta lines, have contributed to Jakarta’s notorious traffic snarls. Intensive competition for curbside access, often near or at TransJakarta stops, have only worsened congestion.
203 Zeng, “China Transportation Briefing: Bus Rapid Transit in China - On the Way.”
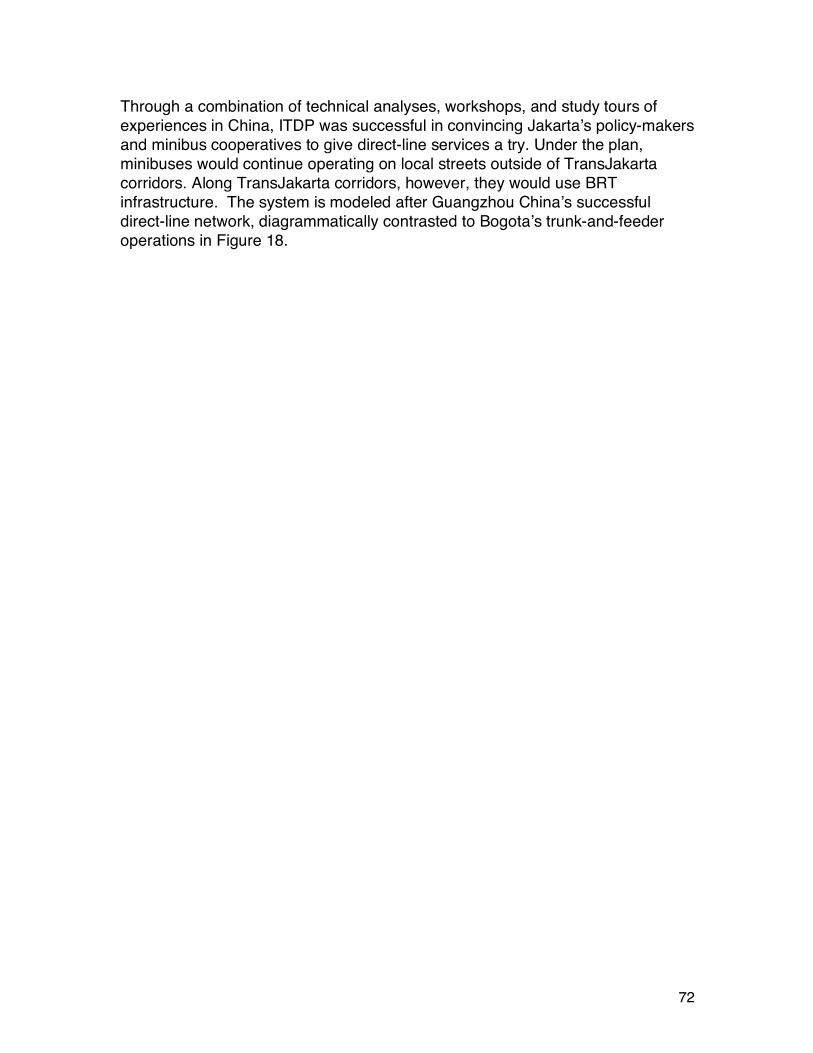
72
Through a combination of technical analyses, workshops, and study tours of experiences in China, ITDP was successful in convincing Jakarta’s policy-makers and minibus cooperatives to give direct-line services a try. Under the plan, minibuses would continue operating on local streets outside of TransJakarta corridors. Along TransJakarta corridors, however, they would use BRT infrastructure. The system is modeled after Guangzhou China’s successful direct-line network, diagrammatically contrasted to Bogota’s trunk-and-feeder operations in Figure 18.
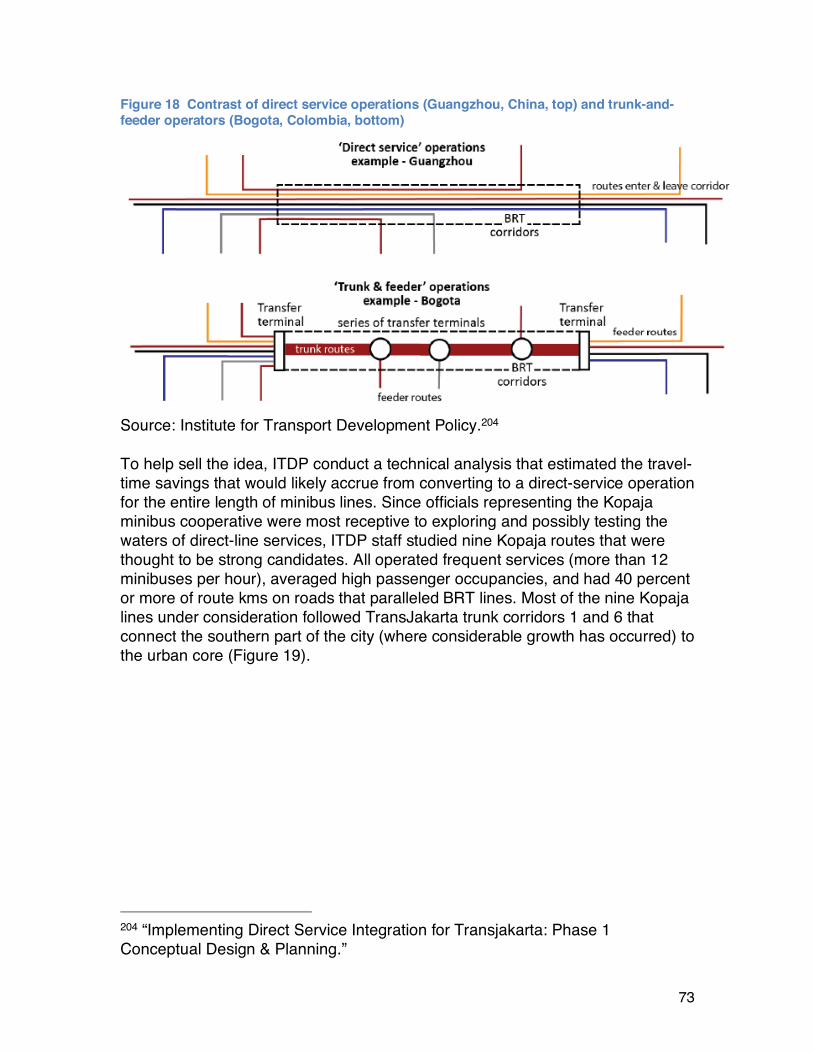
73
Figure 18 Contrast of direct service operations (Guangzhou, China, top) and trunk-and-feeder operators (Bogota, Colombia, bottom)
Source: Institute for Transport Development Policy.204 To help sell the idea, ITDP conduct a technical analysis that estimated the travel-time savings that would likely accrue from converting to a direct-service operation for the entire length of minibus lines. Since officials representing the Kopaja minibus cooperative were most receptive to exploring and possibly testing the waters of direct-line services, ITDP staff studied nine Kopaja routes that were thought to be strong candidates. All operated frequent services (more than 12 minibuses per hour), averaged high passenger occupancies, and had 40 percent or more of route kms on roads that paralleled BRT lines. Most of the nine Kopaja lines under consideration followed TransJakarta trunk corridors 1 and 6 that connect the southern part of the city (where considerable growth has occurred) to the urban core (Figure 19).
204 “Implementing Direct Service Integration for Transjakarta: Phase 1 Conceptual Design & Planning.”

74
Figure 19: TransJakarta BRT Lines 1 and 6
Contenders for Integrated Minibus Direct Services. Source: Adapted from ‘Implementing Direct Service Integration for Transjakarta: Phase 1 Conceptual Design & Planning’205
Using ITDP data on average peak-period travel times from end-to-end of nine Kopaja routes, Figure 20 summarizes estimated changes in current and direct-service travel times. For example, the figure shows that Kopaja route P 20, which takes an average of 3 hours and 30 minutes to travel from end-to-end (i.e., cycle time) on regular surface streets, would take an estimated 2 hours and 10 minutes if it operated part of the distance on TransJakarta exclusive running-ways. Further analysis revealed that new minibuses stopping at TransJakarta stations on Lines 1 and 6 could be, in most instances, physically accommodated and would not lead to serious saturation problems during peak hours.
205 “Implementing Direct Service Integration for Transjakarta: Phase 1 Conceptual Design & Planning.”
__ Corridor1__ Corridor6
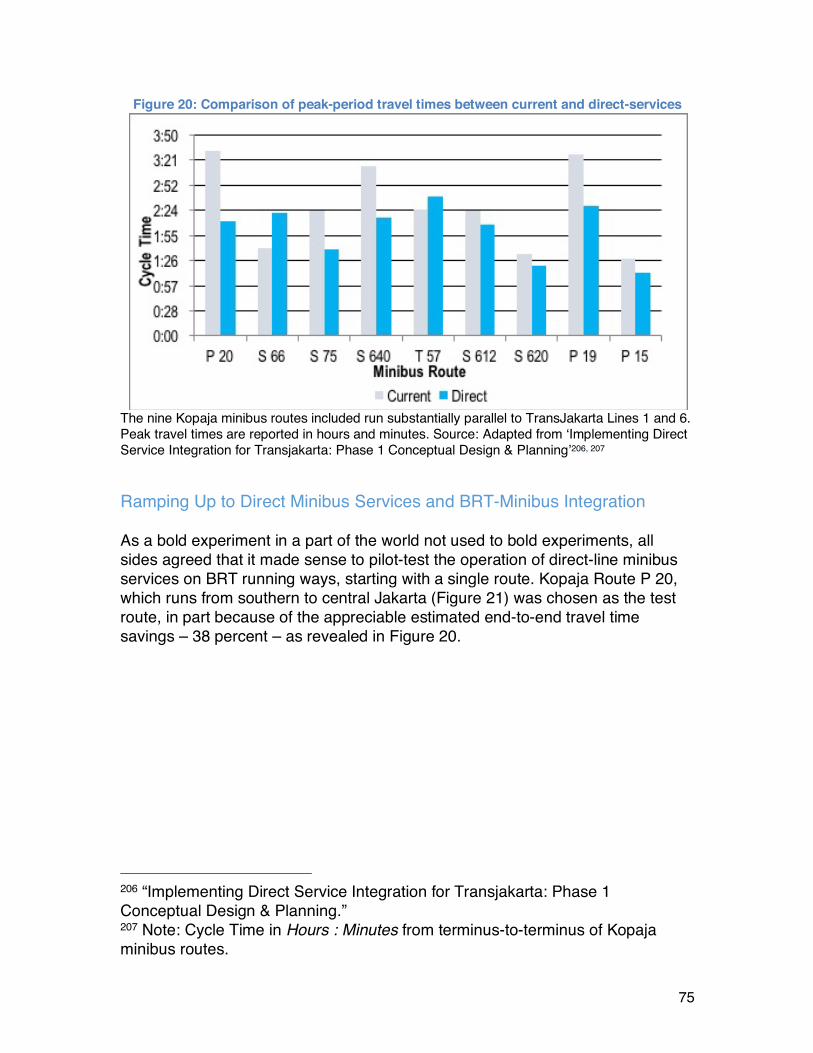
75
Figure 20: Comparison of peak-period travel times between current and direct-services
The nine Kopaja minibus routes included run substantially parallel to TransJakarta Lines 1 and 6. Peak travel times are reported in hours and minutes. Source: Adapted from ‘Implementing Direct Service Integration for Transjakarta: Phase 1 Conceptual Design & Planning’206, 207
Ramping Up to Direct Minibus Services and BRT-Minibus Integration As a bold experiment in a part of the world not used to bold experiments, all sides agreed that it made sense to pilot-test the operation of direct-line minibus services on BRT running ways, starting with a single route. Kopaja Route P 20, which runs from southern to central Jakarta (Figure 21) was chosen as the test route, in part because of the appreciable estimated end-to-end travel time savings – 38 percent – as revealed in Figure 20.
206 “Implementing Direct Service Integration for Transjakarta: Phase 1 Conceptual Design & Planning.” 207 Note: Cycle Time in Hours : Minutes from terminus-to-terminus of Kopaja minibus routes.
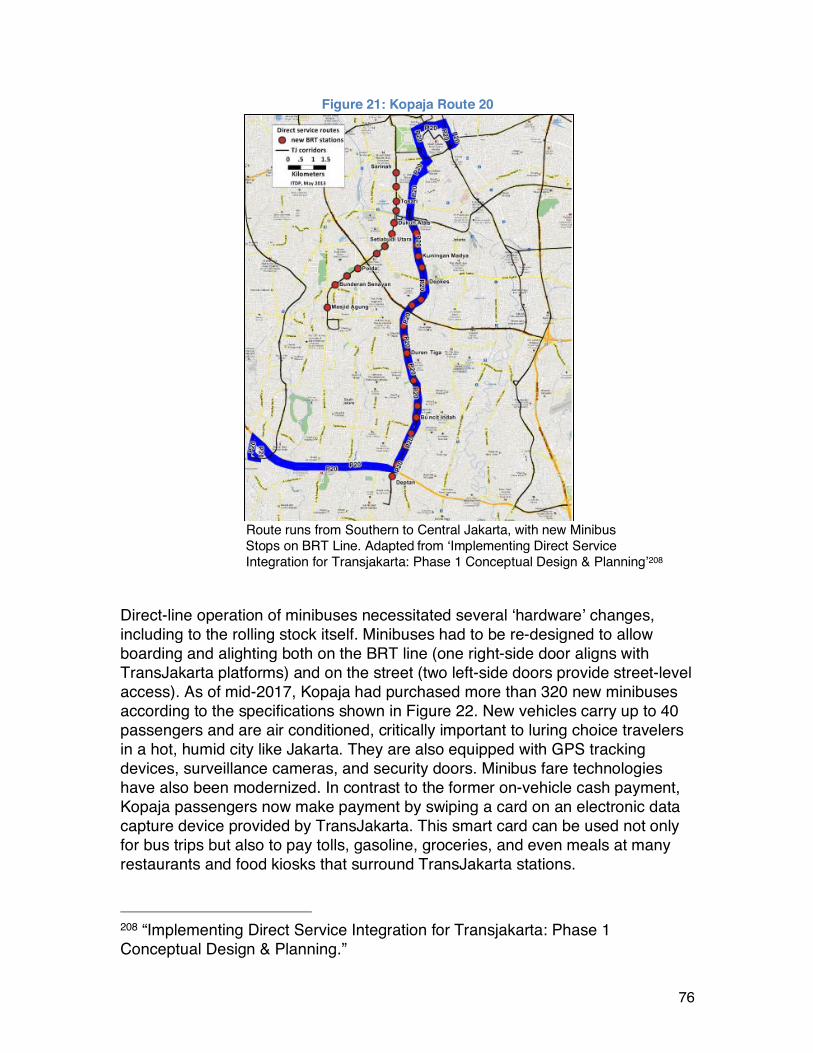
76
Figure 21: Kopaja Route 20
Route runs from Southern to Central Jakarta, with new Minibus Stops on BRT Line. Adapted from ‘Implementing Direct Service Integration for Transjakarta: Phase 1 Conceptual Design & Planning’208
Direct-line operation of minibuses necessitated several ‘hardware’ changes, including to the rolling stock itself. Minibuses had to be re-designed to allow boarding and alighting both on the BRT line (one right-side door aligns with TransJakarta platforms) and on the street (two left-side doors provide street-level access). As of mid-2017, Kopaja had purchased more than 320 new minibuses according to the specifications shown in Figure 22. New vehicles carry up to 40 passengers and are air conditioned, critically important to luring choice travelers in a hot, humid city like Jakarta. They are also equipped with GPS tracking devices, surveillance cameras, and security doors. Minibus fare technologies have also been modernized. In contrast to the former on-vehicle cash payment, Kopaja passengers now make payment by swiping a card on an electronic data capture device provided by TransJakarta. This smart card can be used not only for bus trips but also to pay tolls, gasoline, groceries, and even meals at many restaurants and food kiosks that surround TransJakarta stations. 208 “Implementing Direct Service Integration for Transjakarta: Phase 1 Conceptual Design & Planning.”
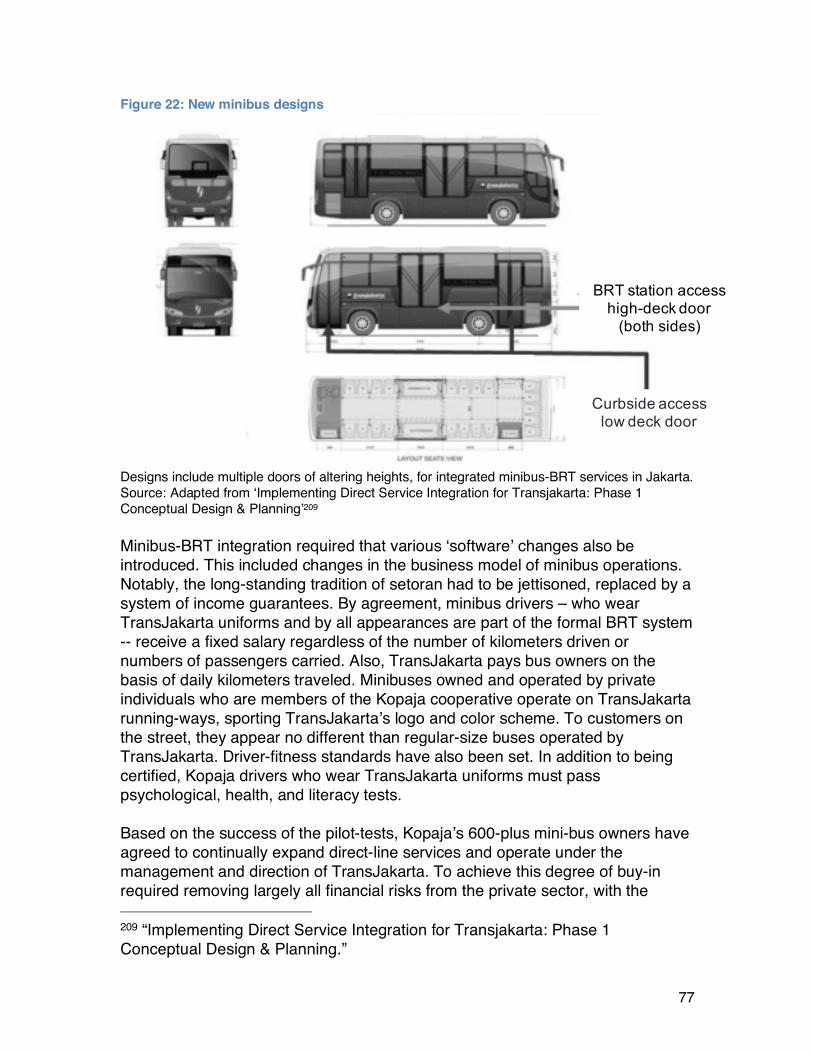
77
Figure 22: New minibus designs
Designs include multiple doors of altering heights, for integrated minibus-BRT services in Jakarta. Source: Adapted from ‘Implementing Direct Service Integration for Transjakarta: Phase 1 Conceptual Design & Planning’209 Minibus-BRT integration required that various ‘software’ changes also be introduced. This included changes in the business model of minibus operations. Notably, the long-standing tradition of setoran had to be jettisoned, replaced by a system of income guarantees. By agreement, minibus drivers – who wear TransJakarta uniforms and by all appearances are part of the formal BRT system -- receive a fixed salary regardless of the number of kilometers driven or numbers of passengers carried. Also, TransJakarta pays bus owners on the basis of daily kilometers traveled. Minibuses owned and operated by private individuals who are members of the Kopaja cooperative operate on TransJakarta running-ways, sporting TransJakarta’s logo and color scheme. To customers on the street, they appear no different than regular-size buses operated by TransJakarta. Driver-fitness standards have also been set. In addition to being certified, Kopaja drivers who wear TransJakarta uniforms must pass psychological, health, and literacy tests. Based on the success of the pilot-tests, Kopaja’s 600-plus mini-bus owners have agreed to continually expand direct-line services and operate under the management and direction of TransJakarta. To achieve this degree of buy-in required removing largely all financial risks from the private sector, with the 209 “Implementing Direct Service Integration for Transjakarta: Phase 1 Conceptual Design & Planning.”
BRT station accesshigh-deck door
(both sides)
Curbside accesslow deck door
78
Governor of Indonesia’s special capital district, DKI Jakarta, ultimately responsible for covering any and all deficits that might be encumbered. Experiences to Date and Lessons While the jury is still out on how successful Jakarta’s foray into private minibus/public-BRT integration will be, some are optimistic about the future.210 In mid-2016, more than 100 Kopaja minibuses were operating on TransJakarta dedicated busways, and one year later this number had more than tripled. Key to success has been securing the buy-in of incumbents, namely minibus drivers and vehicle owners. Kopaja drivers like being paid a fixed salary, which is at present more than double the Provincial Minimum Wage (UMP) for DKI Jakarta. Many believe they are earning more take-home pay than under the setoran system and that overall working conditions have improved. New unforeseen financial challenges, however, have surfaced, such as delayed salary payments. Whereas before drivers netted a cash take-home salary at the end of every workday, now they are paid every week or two. This has forced drivers to become more disciplined in managing personal funds, to ensure once they are paid they have sufficient reserves to cover ongoing expenses until they are paid again. Not all drivers have been able to make this transition. According to Kopaja and ITDP officials, minibus customers are also happy with the new arrangement. Many users feel that minibus services have markedly improved since the conversion to direct-line operations. They are thought to be faster (owing to operations on exclusive busways), more comfortable (owning to newer air-conditioned buses), and more spacious, at a fare no higher than before. Women particularly seem to be pleased with both TransJakarta BRT operations and integrated minibus services. The front portion of BRT buses are reserved for women and children while men stand in the accordion section and the more crowded rear. The Jakarta case underscores the critical importance of gaining the trust and confidence off incumbent operators when introducing minibus service reforms. With many minibus drivers barely getting by on daily earnings, most were understandably reluctant to risk the possibility of being financially even worse off as a result of new, unproven scheme. They would have never gotten on board with the revamped minibus program were it not for the salary guarantees offered by TransJakarta, underwritten by the provincial government, DKI Jakarta. Given where these inter-governmental transfer payments ended (e.g., in the pockets of
210 The Jakarta Post, “Kopaja Preparing to Join Transjakarta Management”; “Implementing Direct Service Integration for Transjakarta: Phase 1 Conceptual Design & Planning”; Adiwinarto, Personal Communication.

79
minibus drivers, operators, and users), it is likely the case they have been financially progressive, helping lower-income segments of Indonesian society. This case also highlights the critically important role played by an NGO, namely ITDP, as an honest broker in seeing this service reform through to implementation. Building on ITDP’s experiences in several Chinese cities, the organization worked earnestly to build trust and good will with TransJakarta officials as well as Kopaja representatives. By sponsoring study tours and carrying out objective empirical analyses, ITDP managed to convince high-level stakeholders from both TransJakarta and Kopaja to give the direct-line service concept a try. Even though the Jakarta region is served by a minibus cooperative, Metromini, that is larger than Kopaja, through discussion with TransJakarta and DKI officials it was agreed that Kopaja was organizationally better prepared to introduce the proposed service reforms. In contrast, Metromini has had internal strife and dissensions within the organization, not all tied to TransJakarta integration, that would have made negotiations difficult and protracted. For Kopaja itself, top officials had already seen the writing on the wall, believing it was only a matter of time before their minibus services would need to be part of the formal TransJakarta regional bus operations or else go out of business. As the quality of TransJakarta services steadily improve relative to private minibus and microbus services, many observers agree that travelers will continue shifting to the public bus services. Kopaja officials reasoned it is in their long-term financial interest to join TransJakarta, sooner than later, or be prepared to witness the eventual disappearance of their industry. As Jakarta continues to modernize, local governance improves, and standards-of-living rise, the expectation is that all private fixed-route services – minibuses as well as microbuses -- will be integrated into the formal TransJakarta operations. The first step toward full integration occurred in 2017 with the launch of 320 air-conditioned Kopaja minibuses as part of TransJakarta public transit services. The provincial government of Jakarta is committed to converting all private minibuses to city-owned public transit services fairly quickly, with all buses – whether BRT, regular coaches, or minibuses – operating under the TransJakarta banner. Taxi-like services, whether on four wheels (Silverbird taxis and Uber), three-wheelers (bajajs), or two-wheels (ojek motorcycle taxis and their app-based, ride-hail versions, called Gojek and Blujek), will remain private, both complementing and competing with fixed-route services. When metrorail services come on board in a few years, a robust network of mobility choices will become available to Jakartans, providing services offering both high-capacity economies-of-scale (metrorail and BRT) as well as complementary economies-of-scope (microbuses, minibuses, three-wheelers, and two-wheelers). The traveling public should benefit as a result.
80
It would be wrong to conclude that Jakarta’s experiences with BRT-minibus integration has been a smooth, linear process. As with any significant policy reform, it has unfolded in fits and starts, iteratively evolving as various course-corrections are made. Negotiating income guarantees for minibus owners and drivers was a drawn-out process. Convincing the Kopaja cooperative that it had to update and alter its minibus rolling stock so that it is BRT-compatible also took time. In all instances, public-sector absorption of risks was key in breaking log-jams. Ultimately this meant larger levels of government stepping forward and providing the financial guarantees needed to move things forward. With 100-plus minibuses now operating on TransJakarta exclusive bus lanes, advocates argue the momentum is in their favor and it is only a matter of time before all of the region’s fixed-route services are under the aegis of the formal public transport authority, TransJakarta. This could be an important step toward Jakarta relinquishing its title as one of the world’s most traffic-choked cities and advancing the city’s broader goal of becoming a more livable and sustainable national capital.
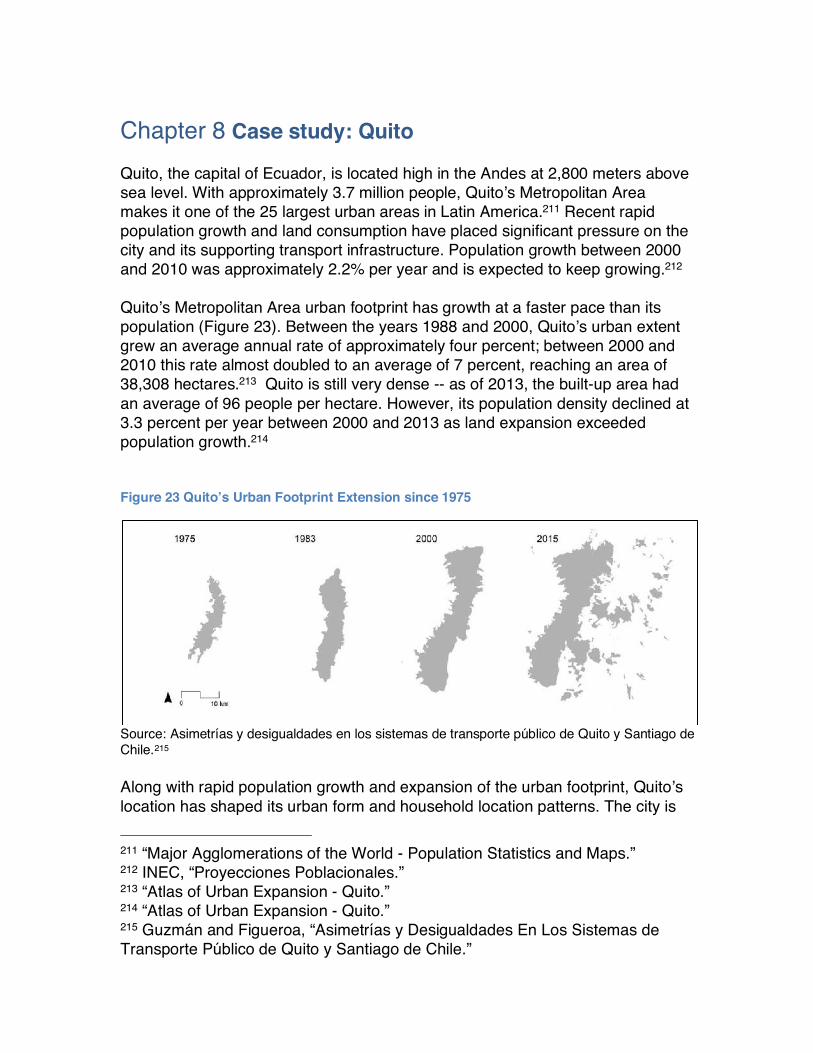
Chapter 8 Case study: Quito Quito, the capital of Ecuador, is located high in the Andes at 2,800 meters above sea level. With approximately 3.7 million people, Quito’s Metropolitan Area makes it one of the 25 largest urban areas in Latin America.211 Recent rapid population growth and land consumption have placed significant pressure on the city and its supporting transport infrastructure. Population growth between 2000 and 2010 was approximately 2.2% per year and is expected to keep growing.212 Quito’s Metropolitan Area urban footprint has growth at a faster pace than its population (Figure 23). Between the years 1988 and 2000, Quito’s urban extent grew an average annual rate of approximately four percent; between 2000 and 2010 this rate almost doubled to an average of 7 percent, reaching an area of 38,308 hectares.213 Quito is still very dense -- as of 2013, the built-up area had an average of 96 people per hectare. However, its population density declined at 3.3 percent per year between 2000 and 2013 as land expansion exceeded population growth.214 Figure 23 Quito’s Urban Footprint Extension since 1975
Source: Asimetrías y desigualdades en los sistemas de transporte público de Quito y Santiago de Chile.215 Along with rapid population growth and expansion of the urban footprint, Quito’s location has shaped its urban form and household location patterns. The city is 211 “Major Agglomerations of the World - Population Statistics and Maps.” 212 INEC, “Proyecciones Poblacionales.” 213 “Atlas of Urban Expansion - Quito.” 214 “Atlas of Urban Expansion - Quito.” 215 Guzmán and Figueroa, “Asimetrías y Desigualdades En Los Sistemas de Transporte Público de Quito y Santiago de Chile.”
82
situated in a narrow valley surrounded by mountains, giving rise to a primarily long, narrow linear settlement pattern. As a result of its urban form, Quito is characterized by long road corridors that transverse this urban area from south to north and shorter roads that connect neighborhoods located to the east and west of the metropolitan region. Although formerly high levels of poverty in Quito have declined, low-income residents still represent a significant proportion of the population. From 2010 to 2015, the poverty rate decreased from ten to seven percent.216 However, this latter figure means that there are still 200.000 people living in poverty in Quito. Low-income households live primarily in the northern and southern peripheral neighborhoods of the city, where land is inexpensive, but far away from main employment centers, mostly located in the downtown.217 This residential and employment location pattern, along with Quito’s linear urban form, results in long commutes for many lower income households. Rapid motorization and population growth have placed additional pressures on the city’s transport infrastructure. Between 1998 and 2014, the number of vehicles per thousand inhabitants grew from 121 to 192, representing an increment of almost 60 percent.218 Conventional privately operated and loosely regulated buses that made up the majority of transit service in Quito were perceived as major contributors to congestion and air pollution.219 Quito’s private transit system suffered from slow travel times, chaotic service levels, and overcrowding.220 Pollution continued to be a major issue, partly due to conventional diesel buses that do not operate efficiently at high altitude.221 Quito’s first BRT corridor, locally known as the Trolebús, was launched in 1995 in response to the negative externalities associated with transport. With the launch of the Trolebús, Quito was an early adopter of BRT, along with Curitiba in Brazil. Today, the BRT network in Quito consists of three main trunk corridors that run north-south throughout the city and are complemented by integrated feeder services (Figure 24), which combined carry over 745,000 passengers per day.222 216 “Reporte de Pobreza por Ingresos.” 217 Maldonado and Andrade, “Incidencia de La Pobreza Según Zonas Censales En Quito (2001 - 2006).” 218 DMQ, “Diagnóstico de La Movilidad En El Distrito Metropolitano de Quito Para El Plan Metropolitano de Desarrollo Territorial (PMOT).” 219 DMQ; DMQ, “Plan Maestro de Movilidad Para El Distrito Metropolitano de Quito 2009-2025.” 220 Hidalgo and Gradtieaux, “A Critical Look at Major Bus Improvements in Latin America and Asia: Case Study Metrobús-Q, Quito, Ecuador”; “Quito, Ecuador Brief: Tolebus Busway System.” 221 “Quito, Ecuador Brief: Tolebus Busway System.” 222 “Global BRT Data.”

83
Figure 24. Quito’s Metropolitan Area BRT corridors and feeder routes
Source: Asimetrías y desigualdades en los sistemas de transporte público de Quito y Santiago de Chile.223 Despite the continuous BRT expansion Quito has witnessed, private transit buses and small paratransit vehicles are still used by many residents. The boom of private transit can be attributed to political and economic dynamics that define the history of the metropolitan region and transport planning in Quito. Following Bogota’s efforts to overhaul its private transit bus system and integrate it with the BRT, Quito is working on a plan to develop an integrated transit network that includes incumbent paratransit bus companies. This case study examines the
223 Guzmán and Figueroa, “Asimetrías y Desigualdades En Los Sistemas de Transporte Público de Quito y Santiago de Chile.”
84
history of BRT in Quito, characterizes the private transit supply, and highlights the challenges the city faces to achieve a high-quality, integrated transit system. Quito’s Metropolitan Area Public-Private Transit System Overview Quito’s Metropolitan Area offers different private and private transit alternatives to its residents. Available modes include a BRT system, licensed and privately-operated buses, and small paratransit vehicles that operate with no government sanction. While we were writing this case, Quito’s first subway line was added to the system. Quito’s Bus Rapid Transit System Quito’s BRT is considered a feeder-trunk system and is locally known as Metrobus Q. The three corridors run from north to south of Quito’s metropolitan area: Troncal Central Trolebus, Troncal Oriental Ecovia, and Troncal Occidental (Figure 25). Quito’s BRT consists of approximately 72 kilometers of dedicated busways and 126 stations with off-board fare collection and platform-level boarding.224 Quito’s BRT is administered by the public company ‘Empresa Pública Metropolitana de Transporte de Pasajeros de Quito’ (EPMTPQ). The EPMTPQ oversees and operates the Troncal Central Trolebus and Troncal Oriental Ecovia. Troncal Occidental is the only corridor that currently involves private bus operators. Troncal Central Trolebus operates in a 22.5 km median busway that links the north and south of the city and runs through its historic center.225 This BRT corridor has 39 stations.226 In 2017, Trolebus carried approximately 235,000 passengers daily.227 Troncal Oriental Ecovia consists of a 22-kilometer segregated busway that also runs from north to south and has 22 stations. 228 In 2017, Ecovia carried approximately 229,000 passengers daily.229 The Troncal Occidental corridor consists of 28 kilometers of segregated busway with 43 stations. 230 The capacity of the trunk corridor BRT system is somewhat limited despite its expansion, because there are no overtaking lanes in any of the three corridors.
224 “Global BRT Data.” 225 “Global BRT Data.” 226 “Global BRT Data.” 227 Hidalgo and Gradtieaux, “A Critical Look at Major Bus Improvements in Latin America and Asia: Case Study Metrobús-Q, Quito, Ecuador”; “Global BRT Data.” 228 “Global BRT Data.” 229 “Global BRT Data.” 230 “Global BRT Data.”
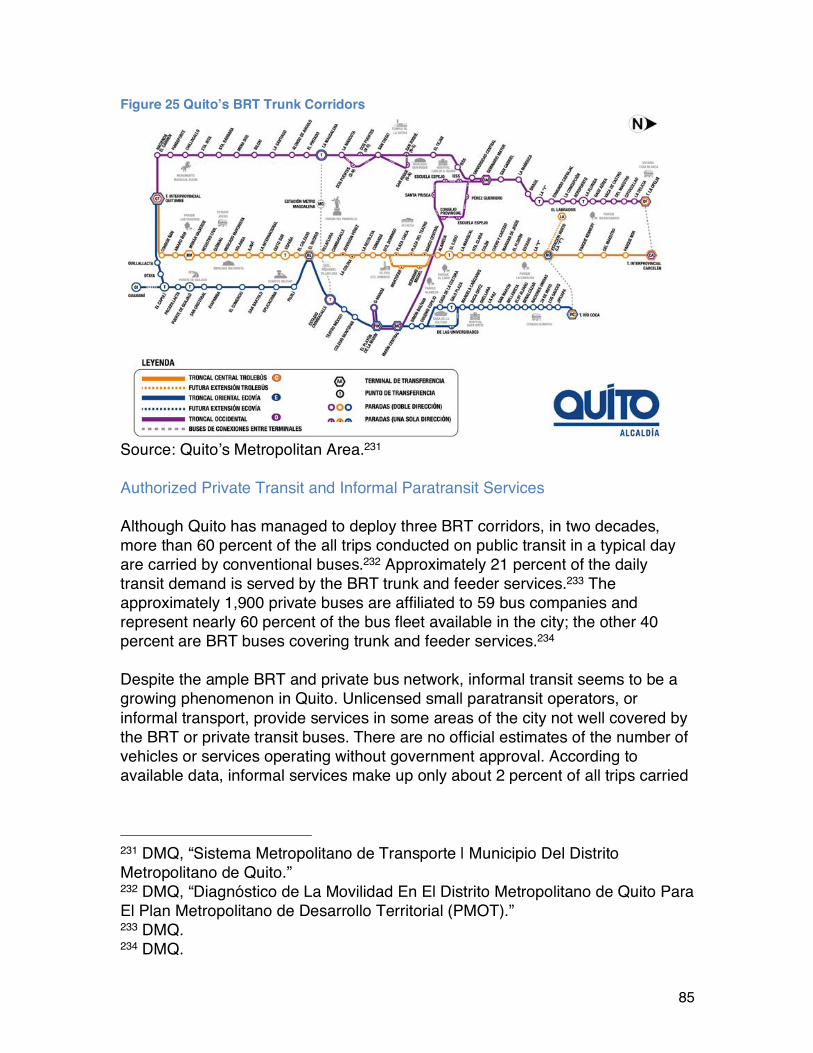
85
Figure 25 Quito’s BRT Trunk Corridors
Source: Quito’s Metropolitan Area.231 Authorized Private Transit and Informal Paratransit Services Although Quito has managed to deploy three BRT corridors, in two decades, more than 60 percent of the all trips conducted on public transit in a typical day are carried by conventional buses.232 Approximately 21 percent of the daily transit demand is served by the BRT trunk and feeder services.233 The approximately 1,900 private buses are affiliated to 59 bus companies and represent nearly 60 percent of the bus fleet available in the city; the other 40 percent are BRT buses covering trunk and feeder services.234 Despite the ample BRT and private bus network, informal transit seems to be a growing phenomenon in Quito. Unlicensed small paratransit operators, or informal transport, provide services in some areas of the city not well covered by the BRT or private transit buses. There are no official estimates of the number of vehicles or services operating without government approval. According to available data, informal services make up only about 2 percent of all trips carried
231 DMQ, “Sistema Metropolitano de Transporte | Municipio Del Distrito Metropolitano de Quito.” 232 DMQ, “Diagnóstico de La Movilidad En El Distrito Metropolitano de Quito Para El Plan Metropolitano de Desarrollo Territorial (PMOT).” 233 DMQ. 234 DMQ.
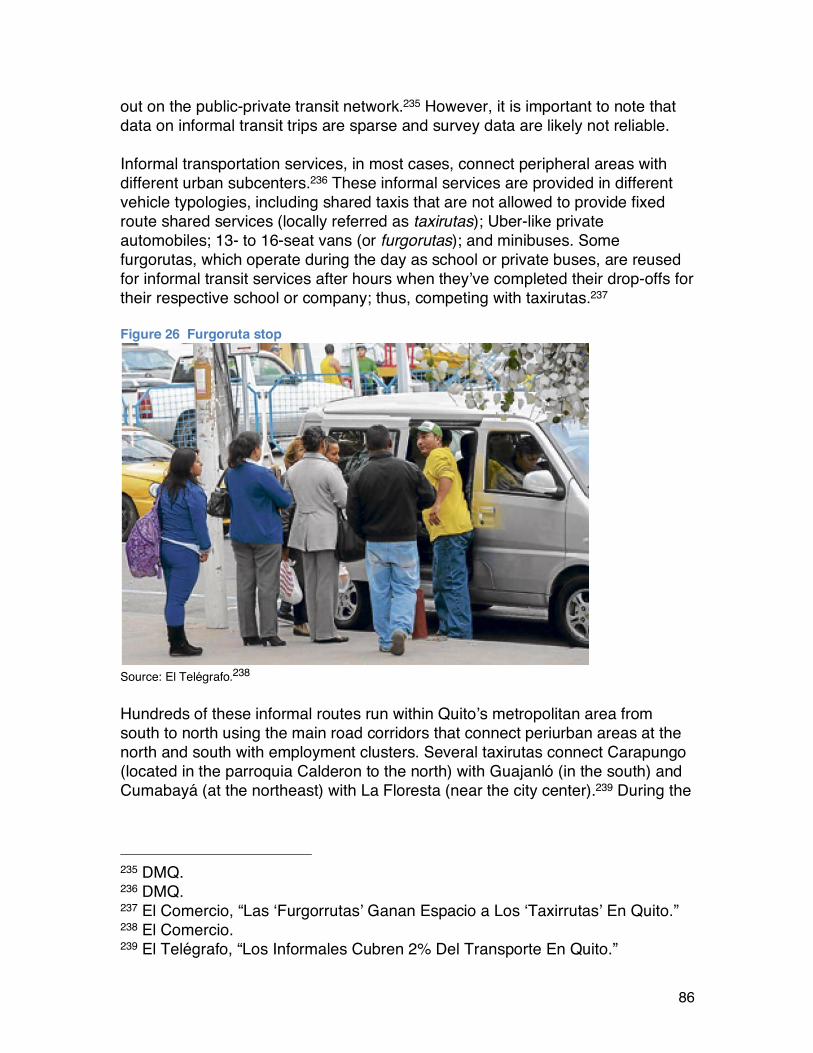
86
out on the public-private transit network.235 However, it is important to note that data on informal transit trips are sparse and survey data are likely not reliable. Informal transportation services, in most cases, connect peripheral areas with different urban subcenters.236 These informal services are provided in different vehicle typologies, including shared taxis that are not allowed to provide fixed route shared services (locally referred as taxirutas); Uber-like private automobiles; 13- to 16-seat vans (or furgorutas); and minibuses. Some furgorutas, which operate during the day as school or private buses, are reused for informal transit services after hours when they’ve completed their drop-offs for their respective school or company; thus, competing with taxirutas.237 Figure 26 Furgoruta stop
Source: El Telégrafo.238 Hundreds of these informal routes run within Quito’s metropolitan area from south to north using the main road corridors that connect periurban areas at the north and south with employment clusters. Several taxirutas connect Carapungo (located in the parroquia Calderon to the north) with Guajanló (in the south) and Cumabayá (at the northeast) with La Floresta (near the city center).239 During the
235 DMQ. 236 DMQ. 237 El Comercio, “Las ‘Furgorrutas’ Ganan Espacio a Los ‘Taxirrutas’ En Quito.” 238 El Comercio. 239 El Telégrafo, “Los Informales Cubren 2% Del Transporte En Quito.”
87
day, paratransit services are provided primarily by some taxirutas and furgorutas; during the night, more furgorutas emerge to provide service.240 Despite strict rules, paratransit is a growing business in Quito. Illegal paratransit vehicles can be retained by the local authorities for 15 days and owners have to pay a fine equivalent to approximately $945 US in 2015.241 However, paratransit in Quito exists in part because of inefficiencies in the services provided by licensed private buses and the BRT system, which together have not grown enough to cover the expanding metropolitan region. Why Informal Paratransit Exist and Persist: Restrictive Measures, System Fragmentation, and Wrong Incentives The metropolitan administration has attributed the growth of informal services to different causes.242 First, the BRT and conventional buses provide poor service quality in terms of on-time performance and passenger comfort.243 About 50% of the conventional bus routes do not run on time, and about 80% of public transport services exceed maximum capacity during peak hours.244 The lack of capacity is especially an issue on the BRT trunk corridors, where passengers may have to wait for multiple buses before they can board. There are several possible reasons for the inefficiencies of the formal transit system. The BRT corridors were conceived as standalone projects and not as part of a system. As of 2016, there was no integration among corridors and between the BRT and the conventional bus routes. Lack of fare integration meant users had to pay each time they switched BRT corridors or conventional bus routes. A non-coordinated and -integrated formal system provides a competitive advantage for informal operators who fill the gaps in the network and provide door-to-door services. Another contributor to the low service quality is the system of financial incentives. Historically, the private transit bus sector received high subsidies that aimed to maintain low fares and ensure companies can cover assigned routes. But despite increasing operational costs due to inflation and fluctuating fuel prices, the private transit bus fare has remained unchanged for more than a decade. In January 2018, the fare for private transit buses was 25 cents, where it had been for 15 years, being in 2017 one of lowest in Latin America.245 240 El Comercio, “Las ‘Furgorrutas’ Ganan Espacio a Los ‘Taxirrutas’ En Quito.” 241 El Telégrafo, “El transporte informal cubre las falencias del sistema regular de movilidad.” 242 DMQ, “Diagnóstico de La Movilidad En El Distrito Metropolitano de Quito Para El Plan Metropolitano de Desarrollo Territorial (PMOT).” 243 DMQ. 244 DMQ. 245 El Comercio, “El Subsidio al Transporte Público En Quito Está En Estudio.”
88
Meanwhile, transit subsidies cost the city approximately $20 million US per year.246 Another $40 million is used to fund the public company that runs the BRT.247 Subsides paid to private bus companies are not subject to quality standards, representing a possible missed opportunity to incentivize service quality improvements.248 Also, this type of supply-side subsidy is a regressive policy instrument because all passengers, regardless of income, receive the same benefit.249 Additionally, bus companies argue that revenue from fares and subsidies are not enough to run the buses with high-quality standards and profit from the operations.250 However, there is no public information regarding how much it costs to operate a bus unit. Quito’s transport planners and some decision makers have articulated a need to link subsidies with service quality standards. In May 2017, Quito’s decision makers, transit advocates, and bus company representatives were working on a plan to reform the subsidy and fare policy in Quito.251 The parties agree that quality should be prioritized and were working on designing a service quality index.252 Experts argue that this first step towards better service quality and a more sustainable fare and subsidy policy must be accompanied by a complete overhaul of the private transit bus system including fleet and fare collection modernization, route rationalization, and integration among private transit routes and with the BRT.253 While Quito invests significant resources in public and private transit with the objective of mitigating negative externalities from transport, it has simultaneously designed and enforced policies that promote private motorization that increase negative externalities. The country has kept a high gas subsidy, thus incentivizing motorized travel and contributing to air pollution and road congestion. In 2015, the gas subsidy was approximately $1.50 US per gallon.254 On-street parking is regulated, but prices are not set to incentivize motorists to ration automobile use.255 In 2001, Quito changed its off-street parking regulations 246 El Comercio. 247 El Comercio. 248 Echeverría, Personal communication. 249 Serebrisky et al., “Affordability and Subsidies in Public Urban Transport.” 250 El Comercio, “El Subsidio al Transporte Público En Quito Está En Estudio.” 251 Echeverría, Personal communication; El Comercio, “El Subsidio al Transporte Público En Quito Está En Estudio.” 252 El Comercio, “El Subsidio al Transporte Público En Quito Está En Estudio.” 253 El Comercio, “Quito Apuesta Por Un Sistema Integrado”; Agencia d’Ecologia Urbana de Barcelona, “Restructuración de La Red de Transporte Público de Pasajeros Del Distrito Metropolitano de Quito.” 254 Paredes, Personal communication. 255 Carrión, Personal communication.

89
to accommodate the demand for automobiles in residential and commercial land uses.256 Before 2001, there were no parking requirements for residential buildings. After 2001, parking minimums were set, which provide additional incentive for private auto ownership and use.257 Pro-automobile policies incentivize high- and middle-income residents to buy and use automobiles that compete for limited road infrastructure, exacerbating traffic congestion, which in turn negatively impacts private transit operational speeds and reliability. The poor performance of the private transit – BRT hybrid system represents an opportunity for informal paratransit vehicles to fill the gaps in the network by adding more frequent and direct routes to the public-private transit network. Bus Rapid Transit Evolution: Local Politics and System Fragmentation Public transport planning is a political process as much as it is technical. Quito’s BRT expansion process and fragmentation is an example of transport planning as a political process. Quito’s BRT was implemented in different phases over almost two decades, in which different corridors segments were added in an uncoordinated fashion. This piecemeal approach left the city with a fragmented network for more than a decade. Figure 27 depicts the timeline of the project that involves the implementation of eight corridor segments with names not associated corridors each segment was extending. Figure 27: Quito's BRT timeline
Source: Own elaboration
256 Carrión. 257 Carrión.
90
The first BRT corridor, the Trolebús, opened in 1995. The Tolebus corridor conceptualization was led by the mayor, Rodrigo Paz, from the Democracia Popular party during his tenure from 1988 to 1992.258 Paz was limited to one four-year term in office, leaving him ultimately unable to act on the projects his team envisioned, including the Trolebus corridor.259 The next mayor of Quito, Jamil Mahuad, came from also from the Democracia Popular party.260 Mahuad served as mayor from 1992 to 1998. During his tenure, Mahuad continued Paz’s Trolebus project, building approximately 13 kilometers of dedicated right-of-way for electric buses that promised to reduce air pollution and significantly cut travel times for Quito’s residents.261 Mahuad used the Trolebus and Ecovia projects as a symbol of his success as mayor to campaign for the country’s presidency, winning the election in 1998. Quito’s BRT system expanded in part thanks to political continuity. In 1998, Roque Sevilla, another Democracia Popular party candidate, was elected as mayor of Quito’s Metropolitan Area. Sevilla decided to continue with the BRT by planning a second corridor called Ecovia.262 While Sevilla managed to build the infrastructure for the corridor, his tenure was not long enough to buy buses or arrange any concessions to operate the corridor.263 The fate of Quito’s BRT was left in the hands of Paco Moncayo, elected as mayor in 2000, and who served for two four-year terms. Moncayo was the first mayor in 12 years not from the Democracia Popular; he was affiliated with the Democratic Left party.264 His first task was to finish the work on the Ecovia project which had been left at a stage advanced enough that was too difficult for a politician not to finish.265 Moncayo inaugurated Ecovia in 2002. While Ecovia represented a step forward in the expansion of Quito’s BRT, political turmoil changed the fate of the system. Mahuad, the elected president, former mayor of Quito, and champion of Trolebus and Ecovia, was facing falling presidential approval ratings by the time Moncayo was elected for the first time as mayor of Quito. 258 Guzmán, Personal communication; Gamble, “Visioning a Transit City: Citizen Participation and Transit Planning in Quito, Ecuador.” 259 Guzmán, Personal communication. 260 Gamble, “Visioning a Transit City: Citizen Participation and Transit Planning in Quito, Ecuador.” 261 Guzmán, Personal communication. 262 Guzmán. 263 Guzmán. 264 Guzmán; Gamble, “Visioning a Transit City: Citizen Participation and Transit Planning in Quito, Ecuador.” 265 Guzmán, Personal communication.

91
Because of Mahuad’s low political approval, Moncayo’s strategy was not to associate himself with BRT projects promoted by Mahuad or his predecessors.266 This strategy included not investing in Trolebus and Ecovia service improvements and planning a completely new BRT corridor called Corredor Central Norte, which now runs parallel to the Ecovia and Tolebus corridors. Corredor Central Norte opened to the public in 2005.267 Three corridor extensions were added since Moncayo finished his tenure as mayor of Quito in 2009. The first segment, initially called Corredor Sur Oriental, opened in 2010, extending the Ecovia trunk corridor to the south of the metropolitan region. A second addition to the system was opened in 2012 under the name of Corredor Sur Occidental; this extended the Central Norte Corridor to the south of the metropolitan area. In 2016, Ecovia was also extended to the south. Present day planners for Quito’s BRT have moved forward with the idea of having an integrated transit system, now called Metrobus Q. Empresa Pública Metropolitana de Transporte de Pasajeros de Quito, the public company that manages the BRT, now describes the five BRT corridors as a feeder-trunk system with three longitudinal and interconnected trunk corridors: Troncal Central Trolebus, Troncal Oriental Ecovia, and Troncal Occidental. Troncal Occidental is comprised of what was known as Sur Occidental and Central Norte Corridors built under different administration and with different political affiliations. In 2016, Ecovia was extended to the south. That corridor is now called Troncal Oriental Ecovia. Private-Public Transit Integration Plan: Description, Challenges, and Missing Links An uncoordinated incremental private-public transit planning process left Quito’s metropolitan region with a non-integrated hybrid BRT-private transit system at the end of the past decade. Planners and decision-makers recognize the need for a more cohesive and higher-quality transit system that is in a better position to compete with private motorization. By 2009, Quito’s Metropolitan Regional started conceiving a vision for the future of its transit system.268 In 2017, the city commissioned the Barcelona’s Urban Ecologic Agency to design a Transit
266 Guzmán. 267 Guzmán. 268 DMQ, “Plan Maestro de Movilidad Para El Distrito Metropolitano de Quito 2009-2025.”
92
Restructuring plan that reduces the increasing motorization rate and inefficiencies in the private transit bus system.269 One of the main operational inefficiencies identified in the private bus system consists of route segment overlaps. The plan proposes reducing route overlap by restructuring the entire private transit network in a way that routes work in a complementary fashion, instead of competing for passengers and clogging the limited road infrastructure. This route restructuring plan also aims to achieve better coordination between transit services. Better coordination represents one step towards having an integrated transit network. The metropolitan government expects that incumbent private bus companies participate in the new system. Route rationalization and coordination, according to the restructuring plan, consider route hierarchies. Quito’s’ BRT, or Metrobus-Q, and the subway line represent the system backbone as these transverse Quito’s connecting the historic center with urban districts located to the north and south of the metropolitan region. North-South longitudinal services will be complemented with routes that operate on parallel corridors running on bus-only lanes to improve operational speeds. In addition, longitudinal services will be complemented with feeder services that run perpendicular to the BRT corridors and subway line and that connect peripheral urban districts with mass transit lines. The plan also proposes adding diagonal bus services that will improve connectivity between employment centers, along with metropolitan bus routes that connect rural peripheral districts with mass transit centers and employment clusters. Another consideration made in Quito’s public transport restructuring plan is to advance towards an integrated fare collection system, called ‘caja única’ or ‘caja común,’ in which revenue from fares are transferred to a common fund, from which monies are shared between participating actors based on a pre-established agreement. The integrated fare collection system is mandated by law with the aim of eliminating aggressive competition for passengers by bus drivers.270 Although bus companies were given until 2013 to migrate from a single to an integrated fare collection system, only 47 of 67 bus companies had implemented the caja única scheme. The transit restructuring plan aims to continue with the implementation of caja única and then transitioning from a common pooled fund per bus company, to a single common fund for the entire integrated system. Other provisions in the restructuring plan include fleet replacement and acquisition of advanced communication technologies that make route planning and fleet control easier.
269 Agencia d’Ecologia Urbana de Barcelona, “Restructuración de La Red de Transporte Público de Pasajeros Del Distrito Metropolitano de Quito.” 270 El Comercio, “La Caja Común Busca Mejorar El Transporte Público.”

93
Quito’s transit route restructuring and integration plans come at a high cost, which represents one of the biggest challenges of integrating mass transit with private transit. It is estimated that the project will cost the city approximately $100 million US.271 This price ticket must be added to the subsidies the city has to pay private companies to operate the routes. Although Quito’s private transit has historically been highly subsidized, it is possible that the improved bus system will require even higher subsidies. A more formalized operation, including restricting drivers to work for no more than eight hours, pay for employee’s benefits, and providing a better maintained to the fleet is expensive if compared common informal practices found in most private transit organizations. For now, the future of Quito’s integrated transit system appears to be still uncertain. Meanwhile, informal paratransit services will have a competitive advantage as these small vehicles provide door-to-door services at sometimes a fraction of the cost for both users and service providers. Small paratransit routes are currently working with local leaders to reach formalization agreements.272
271 Agencia d’Ecologia Urbana de Barcelona, “Restructuración de La Red de Transporte Público de Pasajeros Del Distrito Metropolitano de Quito.” 272 El Comercio, “Las ‘Furgorrutas’ Ganan Espacio a Los ‘Taxirrutas’ En Quito.”

94
SECTION III: Data Collection and Analysis in Barranquilla and Cape Town Of the five cases, we chose two, Barranquilla and Cape Town, for more intensive data collection, including surveys and interviews of city residents. Understanding the challenges and opportunities of integrating BRT with paratransit requires an exploration of who benefited from BRT implementation, how paratransit performed pre- and post-BRT, and how users perceived the changes brought by the BRT – including traditional bus route changes – as well as the role of non-regularized shared transit in these cities. Through the retrospective survey, we collected data on travel behavior before and after the implementation of BRT, including changes in transportation mode and commute and non-commute time. Additionally, the survey collected data on respondents’ home and work locations and socioeconomic status, which allowed for analysis of changes in travel conditions along socioeconomic lines and among people that moved their home or work location and those that did not. To explore who benefited and who did not via travel time savings as intended, we examined changes on travel times using hypothesis tests. To complement our quantitative analysis, we conducted dozens of open-ended interviews, which can be particularly effective in illuminating travel behavior because they allow researchers to gather rich information and conduct in-depth analysis, without necessarily requiring a large number of respondents.273 Open-ended, semi-structured interviews can allow researchers to identify important information that may motivate travel patterns in complex hybrid transportation systems like Barranquilla’s and Cape Town’s. In our specific case, qualitative in-depth interviews provided additional information about people’s experiences with the wide range of transportation options available, included the BRT, as well as their perspectives on the changes that the reconfigured transport system brought to their lives. In Chapter 9, below, we describe our survey data collection, methods and findings for Barranquilla and Cape Town, drawing comparisons between the two along the way. In the following Chapters 10 and 11, we describe our qualitative interview methods and results for first Barranquilla and then Cape Town
273 Hagen, Pardo, and Valente, “Motivations for Motorcycle Use for Urban Travel in Latin America.”
Chapter 9 Survey data analysis: Comparing travel time changes in Barranquilla and Cape Town Understanding changes to travel time is an important component of understanding BRT reforms because many arguments for replacing private transit with BRT are founded on the assumption that the latter will reduce users’ travel times. It is expected that features that distinguish BRT from conventional bus services, such as segregated busways, level boarding platforms, fare pre-payment, and signal prioritization, should enable faster speeds, which in turn will benefit BRT users who previously used private transit or automobiles. While the trunk-feeder configuration, as those implemented in Barranquilla and Cape Town, often results in an increase in the number of transfers, the faster in-vehicle speeds on the trunk corridors are expected to compensate transfer times, resulting in overall time savings. Nevertheless, these expectations might not always be met for all and depend on the context in which the system was implemented as our findings suggest. Methods Sample frame, sampling strategy, and survey instrument The sample frame includes all adults who had been living in Cape Town and Barranquilla for at least five years. This criterion guaranteed the research team would survey who have lived in the area both before and after the introduction of BRT. In Cape Town, the target population included BRT (MyCiTi) and minibus-taxi users, but also those that travel by train, publicly owned and operated buses (Golden Arrow), automobile, and non-motorized modes. In Barranquilla, the survey targeted BRT (Transmetro) users, regularized and non-regularized minibuses, collective and individual taxis, motorcycle, motorcycle-taxi (two- and three-wheelers), bicycle-taxi, car users, as well as users of non-motorized modes. We designed and administered two questionnaires, one for work or study related trips and one for non-work trips. Except for questions about trip purpose and destination, the two questionnaires were nearly identical. While all potential participants were eligible to answer the non-work questionnaire, only those who work or study were administered the work travel questionnaire. We asked in the work travel survey participants about the trip they usually make to reach their place of work or study. The non-work travel survey included questions about the trip the respondent would normally make to go shopping, visiting a friend or a relative, among other trip purposes. Survey respondents were intercepted at public transport stations and other areas that have a high volume of travelers, especially BRT and paratransit users.
96
Shopping centers and markets were included to capture non-public transport users. In Barranquilla also public parks, small neighborhood stores, and universities were included. Surveyors approached potential survey participants, explained broadly what the research was about and asked whether or not they wanted to participate. Language In Barranquilla, the questionnaire was translated into Spanish, and all surveys were conducted in the same language. In Cape Town, surveys were written in English, and administer in Xhosa and Afrikaans when necessary. A Xhosa translation of the questionnaire was tested during the pre-test, but fieldworkers found it most natural to use an English questionnaire and to speak in Xhosa when appropriate. This is not surprising, given that most Xhosa speakers colloquially use a mixture of both English and Xhosa. An Afrikaans translation was also considered, but due to limited resources and the fact that virtually all Afrikaans speakers also speak English, the Afrikaans translation was forgone. There were no reports of any potential respondents being unable to participate due to language barriers, though it is possible that Afrikaans speakers would have felt more comfortable and been more open if the questionnaire had been administered in their first language. Survey team, training, pre-testing and quality control In Barranquilla, the survey team was comprised of undergraduate and graduate students in the engineering program at the Universidad del Norte (UdN) and residents of Soledad that had experience working with professors at UdN on other research projects that included survey work. In total, the team consisted of 42 part-time fieldworkers, one supervisor, and one data quality checker. Fieldworkers were typically sent out in pairs of two or four. For most surveying sessions, teams were sent out to three or four locations within the metropolitan area. In Cape Town, the survey team consisted of nine full-time fieldworkers, including one supervisor. Cape Town’s demographics and segregated settlement pattern necessitated two separate fieldwork teams. Four fieldworkers were University of Cape Town (UCT) students. The student team conducted surveys in English only and focused on locations in Cape Town, the North Coast, and Mitchell’s Plain (Figure 28). The second survey team consisted residents chosen for experience in community work in the areas of Khayelitsha and the North Coast as well as fluency in both English and Xhosa. In Cape Town, it was necessary to use fieldworkers from the community because Khayelitsha, like other Black townships, is often perceived to be dangerous for those of other races and foreign citizens. As local residents, the Khayelitsha
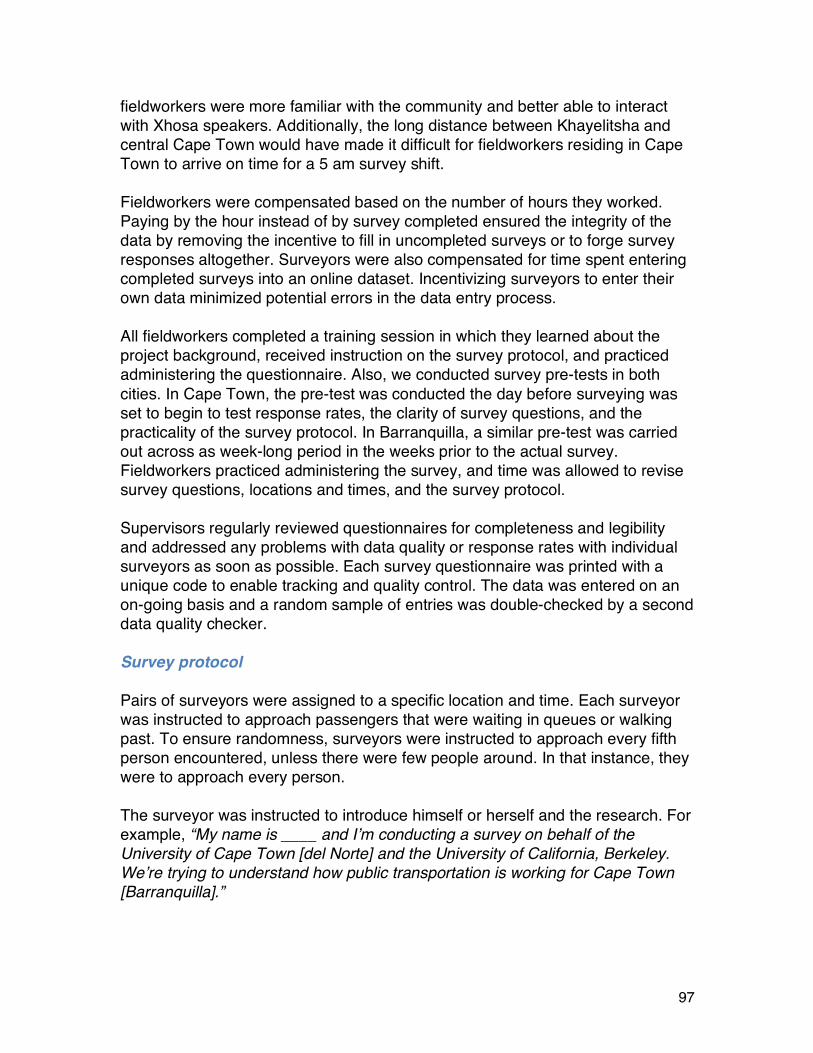
97
fieldworkers were more familiar with the community and better able to interact with Xhosa speakers. Additionally, the long distance between Khayelitsha and central Cape Town would have made it difficult for fieldworkers residing in Cape Town to arrive on time for a 5 am survey shift. Fieldworkers were compensated based on the number of hours they worked. Paying by the hour instead of by survey completed ensured the integrity of the data by removing the incentive to fill in uncompleted surveys or to forge survey responses altogether. Surveyors were also compensated for time spent entering completed surveys into an online dataset. Incentivizing surveyors to enter their own data minimized potential errors in the data entry process. All fieldworkers completed a training session in which they learned about the project background, received instruction on the survey protocol, and practiced administering the questionnaire. Also, we conducted survey pre-tests in both cities. In Cape Town, the pre-test was conducted the day before surveying was set to begin to test response rates, the clarity of survey questions, and the practicality of the survey protocol. In Barranquilla, a similar pre-test was carried out across as week-long period in the weeks prior to the actual survey. Fieldworkers practiced administering the survey, and time was allowed to revise survey questions, locations and times, and the survey protocol. Supervisors regularly reviewed questionnaires for completeness and legibility and addressed any problems with data quality or response rates with individual surveyors as soon as possible. Each survey questionnaire was printed with a unique code to enable tracking and quality control. The data was entered on an on-going basis and a random sample of entries was double-checked by a second data quality checker. Survey protocol Pairs of surveyors were assigned to a specific location and time. Each surveyor was instructed to approach passengers that were waiting in queues or walking past. To ensure randomness, surveyors were instructed to approach every fifth person encountered, unless there were few people around. In that instance, they were to approach every person. The surveyor was instructed to introduce himself or herself and the research. For example, “My name is ____ and I’m conducting a survey on behalf of the University of Cape Town [del Norte] and the University of California, Berkeley. We’re trying to understand how public transportation is working for Cape Town [Barranquilla].”
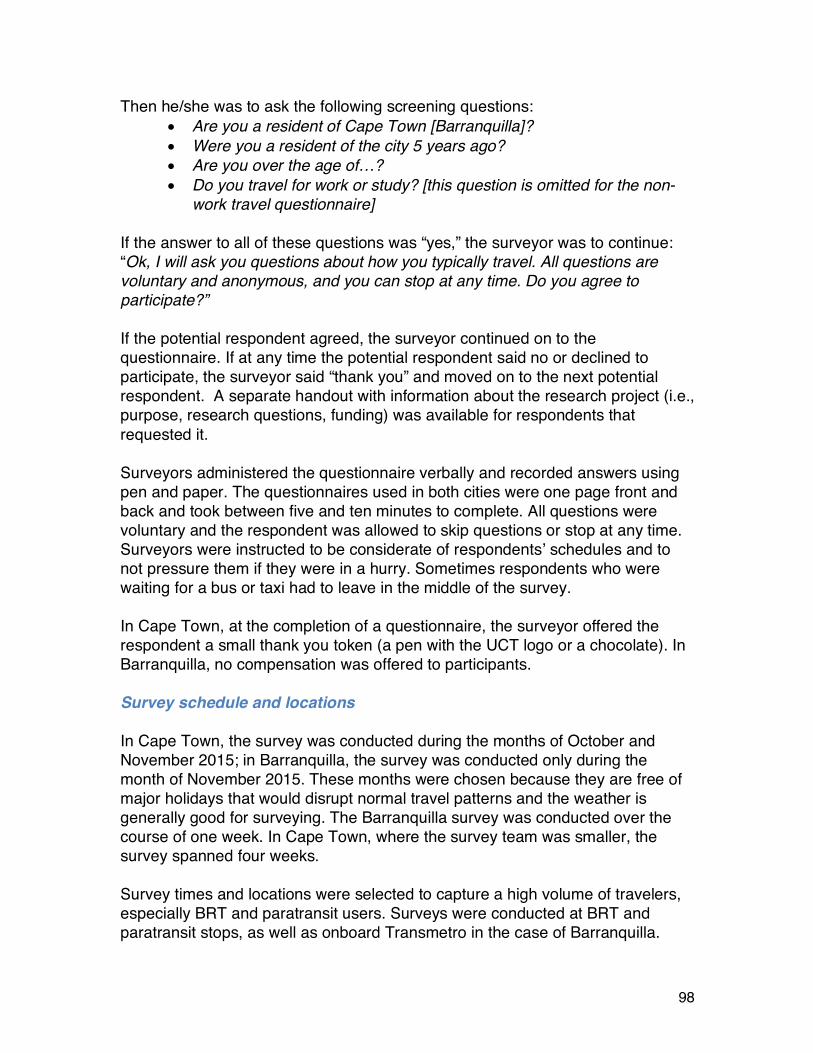
98
Then he/she was to ask the following screening questions: • Are you a resident of Cape Town [Barranquilla]? • Were you a resident of the city 5 years ago? • Are you over the age of…? • Do you travel for work or study? [this question is omitted for the non-
work travel questionnaire] If the answer to all of these questions was “yes,” the surveyor was to continue: “Ok, I will ask you questions about how you typically travel. All questions are voluntary and anonymous, and you can stop at any time. Do you agree to participate?” If the potential respondent agreed, the surveyor continued on to the questionnaire. If at any time the potential respondent said no or declined to participate, the surveyor said “thank you” and moved on to the next potential respondent. A separate handout with information about the research project (i.e., purpose, research questions, funding) was available for respondents that requested it. Surveyors administered the questionnaire verbally and recorded answers using pen and paper. The questionnaires used in both cities were one page front and back and took between five and ten minutes to complete. All questions were voluntary and the respondent was allowed to skip questions or stop at any time. Surveyors were instructed to be considerate of respondents’ schedules and to not pressure them if they were in a hurry. Sometimes respondents who were waiting for a bus or taxi had to leave in the middle of the survey. In Cape Town, at the completion of a questionnaire, the surveyor offered the respondent a small thank you token (a pen with the UCT logo or a chocolate). In Barranquilla, no compensation was offered to participants. Survey schedule and locations In Cape Town, the survey was conducted during the months of October and November 2015; in Barranquilla, the survey was conducted only during the month of November 2015. These months were chosen because they are free of major holidays that would disrupt normal travel patterns and the weather is generally good for surveying. The Barranquilla survey was conducted over the course of one week. In Cape Town, where the survey team was smaller, the survey spanned four weeks. Survey times and locations were selected to capture a high volume of travelers, especially BRT and paratransit users. Surveys were conducted at BRT and paratransit stops, as well as onboard Transmetro in the case of Barranquilla.
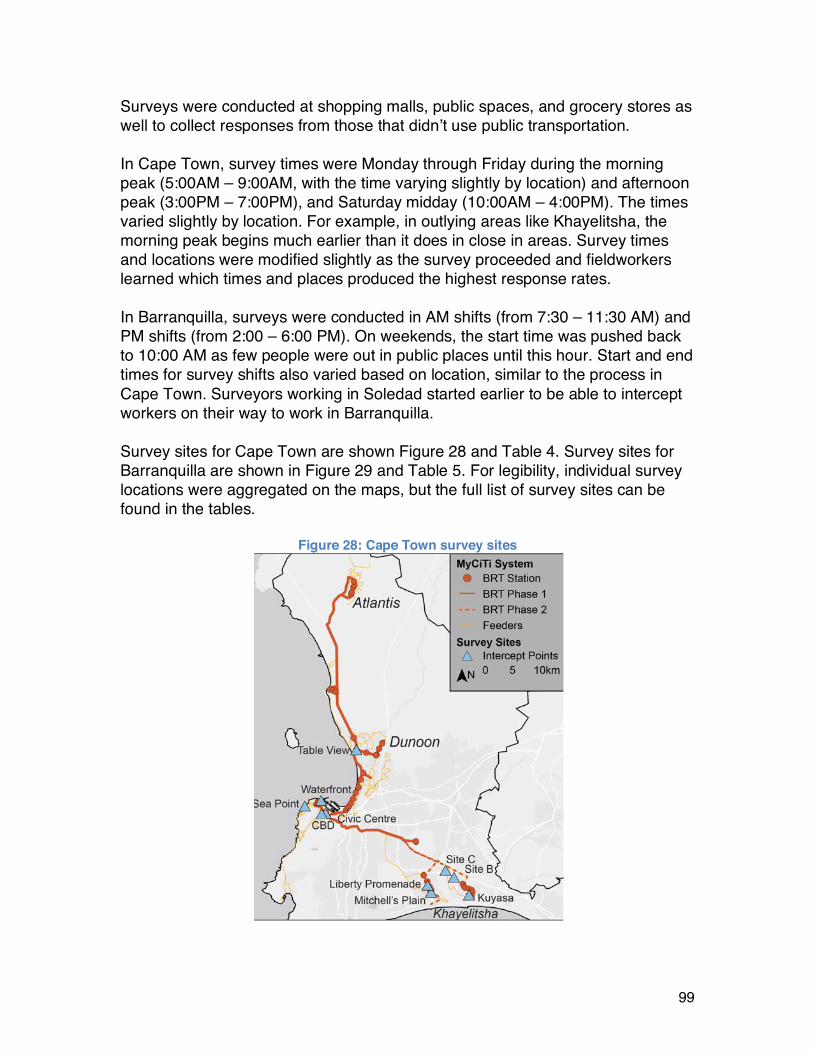
99
Surveys were conducted at shopping malls, public spaces, and grocery stores as well to collect responses from those that didn’t use public transportation. In Cape Town, survey times were Monday through Friday during the morning peak (5:00AM – 9:00AM, with the time varying slightly by location) and afternoon peak (3:00PM – 7:00PM), and Saturday midday (10:00AM – 4:00PM). The times varied slightly by location. For example, in outlying areas like Khayelitsha, the morning peak begins much earlier than it does in close in areas. Survey times and locations were modified slightly as the survey proceeded and fieldworkers learned which times and places produced the highest response rates. In Barranquilla, surveys were conducted in AM shifts (from 7:30 – 11:30 AM) and PM shifts (from 2:00 – 6:00 PM). On weekends, the start time was pushed back to 10:00 AM as few people were out in public places until this hour. Start and end times for survey shifts also varied based on location, similar to the process in Cape Town. Surveyors working in Soledad started earlier to be able to intercept workers on their way to work in Barranquilla. Survey sites for Cape Town are shown Figure 28 and Table 4. Survey sites for Barranquilla are shown in Figure 29 and Table 5. For legibility, individual survey locations were aggregated on the maps, but the full list of survey sites can be found in the tables.
Figure 28: Cape Town survey sites
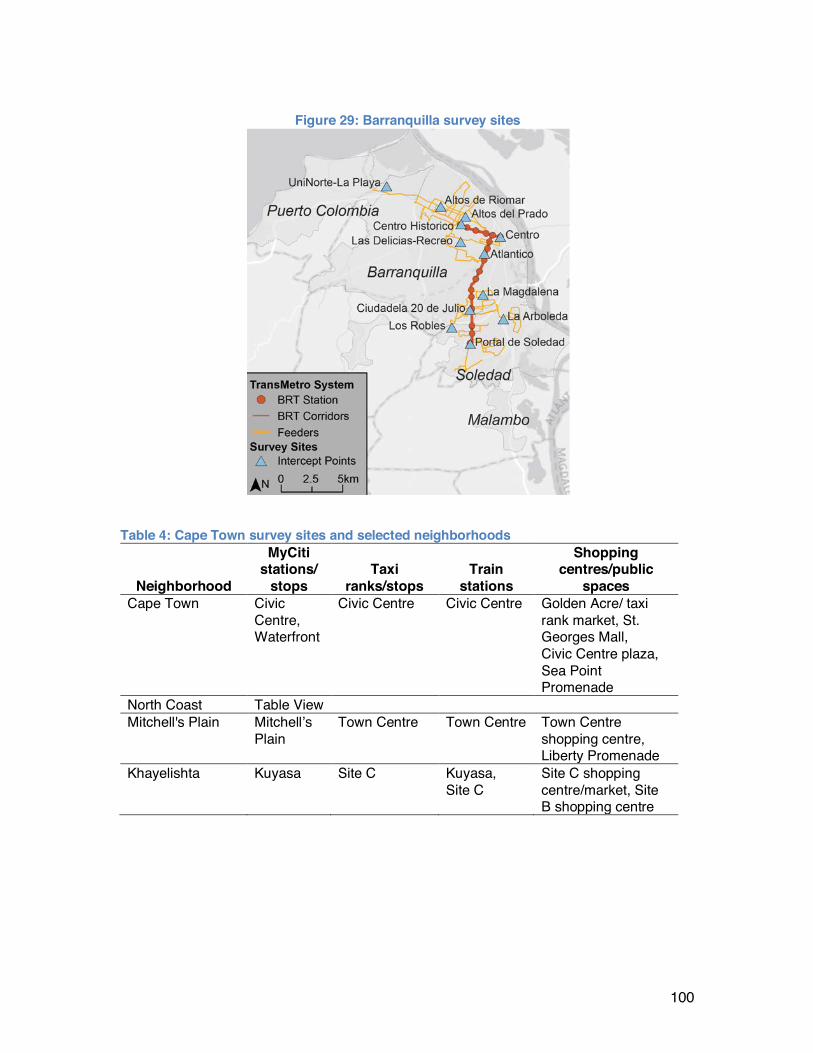
100
Figure 29: Barranquilla survey sites
Table 4: Cape Town survey sites and selected neighborhoods
Neighborhood
MyCiti stations/
stops Taxi
ranks/stops Train
stations
Shopping centres/public
spaces Cape Town Civic
Centre, Waterfront
Civic Centre Civic Centre Golden Acre/ taxi rank market, St. Georges Mall, Civic Centre plaza, Sea Point Promenade
North Coast Table View Mitchell's Plain Mitchell’s
Plain Town Centre Town Centre Town Centre
shopping centre, Liberty Promenade
Khayelishta Kuyasa Site C Kuyasa, Site C
Site C shopping centre/market, Site B shopping centre
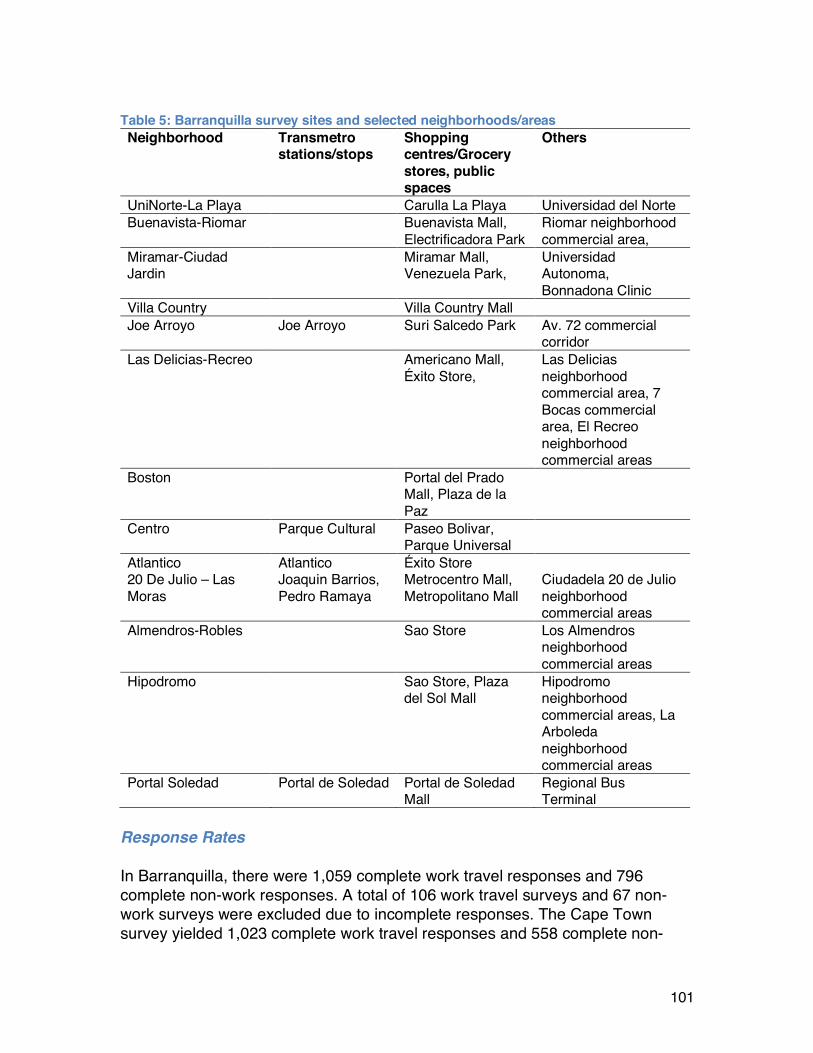
101
Table 5: Barranquilla survey sites and selected neighborhoods/areas Neighborhood Transmetro
stations/stops Shopping centres/Grocery stores, public spaces
Others
UniNorte-La Playa Carulla La Playa Universidad del Norte Buenavista-Riomar Buenavista Mall,
Electrificadora Park Riomar neighborhood commercial area,
Miramar-Ciudad Jardin
Miramar Mall, Venezuela Park,
Universidad Autonoma, Bonnadona Clinic
Villa Country Villa Country Mall Joe Arroyo Joe Arroyo Suri Salcedo Park Av. 72 commercial
corridor Las Delicias-Recreo Americano Mall,
Éxito Store, Las Delicias neighborhood commercial area, 7 Bocas commercial area, El Recreo neighborhood commercial areas
Boston Portal del Prado Mall, Plaza de la Paz
Centro Parque Cultural Paseo Bolivar, Parque Universal
Atlantico Atlantico Éxito Store 20 De Julio – Las Moras
Joaquin Barrios, Pedro Ramaya
Metrocentro Mall, Metropolitano Mall
Ciudadela 20 de Julio neighborhood commercial areas
Almendros-Robles Sao Store Los Almendros neighborhood commercial areas
Hipodromo Sao Store, Plaza del Sol Mall
Hipodromo neighborhood commercial areas, La Arboleda neighborhood commercial areas
Portal Soledad Portal de Soledad Portal de Soledad Mall
Regional Bus Terminal
Response Rates In Barranquilla, there were 1,059 complete work travel responses and 796 complete non-work responses. A total of 106 work travel surveys and 67 non-work surveys were excluded due to incomplete responses. The Cape Town survey yielded 1,023 complete work travel responses and 558 complete non-
102
work responses. 75 work surveys and 52 non-work surveys were marked incomplete. Another 47 work and 39 non-work responses had to be excluded because a fieldworker was suspected of fabricating data. In Barranquilla, surveyors averaged 4.4 surveys per hour. Supermarkets, malls, and on-board surveys yielded the highest number of surveys per hour, while parks yielded the lowest, especially during weekday surveying sessions. Response rates were not recorded, but in general, surveyors noted they had little trouble intercepting participants. One place where surveyors did experience challenges was on-board Transmetro buses, as some participants needed to alight before the survey was completed. In Cape Town, fieldworkers collected 3.8 surveys per hour. Peak times and busy transit hubs yielded the most responses. Response rates ranged from about 20% at shopping centers and public spaces to about 50% at bus and taxi queues. It was determined that it was too burdensome to ask survey workers to record each time they approached a potential resident, so exact data on response rates is not available. Instead, fieldworkers were asked to report the number of people they approached on a few randomly selected days. Data analysis methods To explore whether or not BRT implementation in Barranquilla and Cape Town positively affected users via travel time savings as intended, we examined differences in means of travel times for both work- and non-work-related trips pre- and post BRT implementation. Assessing whether the differences in travel time can be attributed to BRT, required us to conduct paired t-tests and compare the statistical test results for BRT and non-BRT users and controlling for whether or not survey respondents changed home and work location since 2010. We assume benefits from BRT can only be attributed to survey respondents who did not change home or work location (hereafter referred to as “non-movers”) and therefore did not change their trip origin and destination. Breaking down the analysis by transportation mode used previous to the BRT implementation, provided us with a clearer understanding of the mechanisms behind the patterns observed. We conducted several unpaired t-tests on changes in travel times between different socioeconomic characteristics to explore travel time savings distributional effects. To conduct this analysis, the sample was subdivided using proxies for socioeconomic status. In Cape Town, we used as a proxy survey respondent’s race, based on the fact that the racial stratification that was institutionalized during apartheid is still in effect today. Within this structure, whites are the most advantaged, followed by coloured people and then black
103
people.274 Respondents in Barranquilla were classified using the national strata classification, which quantifies socioeconomic status on a scale from 1 to 6, with 6 being the highest. Survey participants were grouped into two subgroups; low-strata (1 and 2) and non-low strata (3, 4, 5 and 6). Commute time changes Descriptive statistics Data on sample demographics and mode share for the work survey sample are presented in Table 6 and
274 Seekings and Nattrass, Class, Race, and Inequality in South Africa.
104
Table 7, respectively. In Table 6, Census data are also included to compare how our sample differs from the entire population distribution. The Barranquilla sample reflects the city’s demographics well overall, except for age, where we oversampled people younger than 55 years. The Cape Town sample is comprised of younger people, more female, and more blacks than the general population, though this was expected, given that this mirrors the demographic profile of a typical public transportation passenger in Cape Town. Even accounting for intentional over-sampling of public transportation users, the Cape Town survey underrepresents car users and white respondents. In the past, researchers have documented the difficulty of surveying white South Africans. Although we oversampled BRT users in both cities, oversampling was higher in Cape Town.

105
Table 6: Demographic data for work subsample Our Survey Census
dataa Variable Category All Movers Non-movers All Perce
nt Freq
. Percen
t Freq Percen
t Freq Percent
Barranquilla survey All 100.0
%% 1,05
99 100.0% 580 100.0% 479 100.0%
Sex
Female 49.8% 527 52.4% 304 46.6% 223 51.2% Male 49.3% 522 46.4% 269 52.8% 253 48.8% No response 0.9% 10 1.2% 7 0.6% 3 -
Age (years)
17- 25 30.6% 324 15.0% 72 43.4% 252 21.8% 26-54 61.6% 652 73.5% 352 51.7% 300 56.7% 55 or more 6.8% 72 9.6% 46 4.5% 26 21.5% No response 1.0% 11 1.9% 9 0.3% 2 -
Socioeconomic strata (1-6)
Low 1-2 57.5% 609 58.5% 280 56.7% 329 63.4% Medium 3-4 35.8% 379 34.2% 164 37.1% 215 29.7% High 5-6 6.4% 68 7.3% 35 5.7% 33 7.0% No response 0.3% 3 0.0% 0 0.5% 3 -
Cape Town survey All 100.0
% 1,02
3 100.0% 405 100.0% 618 100.0%
Sex Female 58.8% 602 54.8% 222 61.5% 380 51% Male 39.9% 408 43.7% 177 37.4% 231 49% No response 1.3% 13 1.5% 6 1.1% 7 - Age (years) 20-34 50.4% 516 67.4% 273 39.3% 243 44.3%b
35-59 47.2% 483 32.1% 130 57.1% 353 43.1% 60 or more 1.1% 11 0.5% 2 1.5% 9 12.6% No response 1.3% 13 0.0% 0 2.1% 13 - Race Black
African 59.3% 607 46.2% 187 68.0% 420 38.6%
Coloured 28.6% 293 39.3% 159 21.7% 134 42.4% Indian/Asian 1.2% 12 2.2% 9 0.5% 3 1.4% White 6.6% 68 8.4% 34 5.5% 34 15.7% No response 4.2% 43 4.0% 16 4.4% 27 -c
a Data from Barranquilla correspond to our own calculations based on population projections to 2015 published by DANE. Socioeconomic strata correspond to household distribution as of 2008. Data for Cape Town come from the 2011 Census. b As a percentage of population 20 years of age or more. c In the census data, 1.9% of the population is classified as “other.”
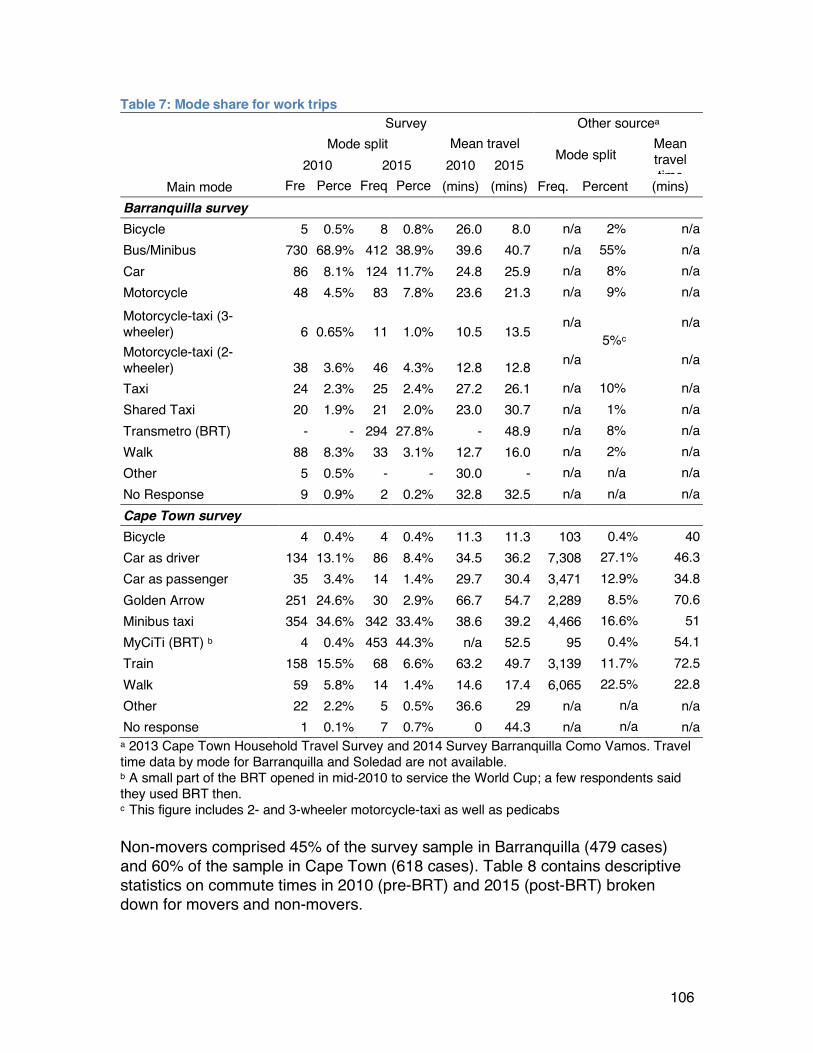
106
Table 7: Mode share for work trips Survey Other sourcea
Main mode
Mode split Mean travel time Mode split
Mean travel time
2010 2015 2010 2015 Freq.
Percent
Freq.
Percent
(mins) (mins) Freq. Percent (mins) Barranquilla survey Bicycle 5 0.5% 8 0.8% 26.0 8.0 n/a 2% n/a Bus/Minibus 730 68.9% 412 38.9% 39.6 40.7 n/a 55% n/a Car 86 8.1% 124 11.7% 24.8 25.9 n/a 8% n/a Motorcycle 48 4.5% 83 7.8% 23.6 21.3 n/a 9% n/a Motorcycle-taxi (3-wheeler) 6 0.65% 11 1.0% 10.5 13.5 n/a
5%c n/a
Motorcycle-taxi (2-wheeler) 38 3.6% 46 4.3% 12.8 12.8 n/a n/a
Taxi 24 2.3% 25 2.4% 27.2 26.1 n/a 10% n/a Shared Taxi 20 1.9% 21 2.0% 23.0 30.7 n/a 1% n/a Transmetro (BRT) - - 294 27.8% - 48.9 n/a 8% n/a Walk 88 8.3% 33 3.1% 12.7 16.0 n/a 2% n/a Other 5 0.5% - - 30.0 - n/a n/a n/a No Response 9 0.9% 2 0.2% 32.8 32.5 n/a n/a n/a Cape Town survey Bicycle 4 0.4% 4 0.4% 11.3 11.3 103 0.4% 40 Car as driver 134 13.1% 86 8.4% 34.5 36.2 7,308 27.1% 46.3 Car as passenger 35 3.4% 14 1.4% 29.7 30.4 3,471 12.9% 34.8 Golden Arrow 251 24.6% 30 2.9% 66.7 54.7 2,289 8.5% 70.6 Minibus taxi 354 34.6% 342 33.4% 38.6 39.2 4,466 16.6% 51 MyCiTi (BRT) b 4 0.4% 453 44.3% n/a 52.5 95 0.4% 54.1 Train 158 15.5% 68 6.6% 63.2 49.7 3,139 11.7% 72.5 Walk 59 5.8% 14 1.4% 14.6 17.4 6,065 22.5% 22.8 Other 22 2.2% 5 0.5% 36.6 29 n/a n/a n/a No response 1 0.1% 7 0.7% 0 44.3 n/a n/a n/a
a 2013 Cape Town Household Travel Survey and 2014 Survey Barranquilla Como Vamos. Travel time data by mode for Barranquilla and Soledad are not available. b A small part of the BRT opened in mid-2010 to service the World Cup; a few respondents said they used BRT then. c This figure includes 2- and 3-wheeler motorcycle-taxi as well as pedicabs Non-movers comprised 45% of the survey sample in Barranquilla (479 cases) and 60% of the sample in Cape Town (618 cases). Table 8 contains descriptive statistics on commute times in 2010 (pre-BRT) and 2015 (post-BRT) broken down for movers and non-movers.

107
Table 8: Descriptive statistics of commute time
Groups Year Meana Mediana Std Dev. Mina Maxa
Barranquilla survey
All (n=1,059) 2010 33.6 30 20.7 3 125 2015 36.8 30 22.1 2 150
change 3.2 0 23.6 -80 105
Non-movers (n=479) 2010 34.5 30 20.7 3 125 2015 34.9 30 20.6 2 120
change 0.4 0 15.7 -75 75
Movers (n=580) 2010 32.8 30 20.7 3 90 2015 38.3 35 23.2 5 150
change 5.6 0 28.2 -80 105 Cape Town survey
All (n=1,023) 2010 47.0 45 28.7 0 180 2015 45.5 45 22.1 4 150
change -1.5 0 27.8 -95 105
Non-movers (n=618) 2010 52.3 45 29.1 10 180 2015 46.4 45 22.1 10 150
change -5.9 0 25.1 -95 105 2010 38.8 30 26.1 0 120 Movers (n=405) 2015 44.1 45 22.1 4 120 change 5.3 5 30.3 -75 100
a Travel time in minutes. Overall changes in commute time Overall, survey respondents in Barranquilla increased their commute time by 3 minutes, going from 33 minutes in 2010 to 36 minutes in 2015 (Table 9). This increase is in line with expectations for a city with a growing population, urban footprint, and in general the local economy. In Cape Town, survey respondents, as a whole, slightly reduced their commute time from 47 minutes in 2010 to 46 minutes in 2015. Cape Town is also experiencing population and economic growth, which should be expected to result in increases in travel time like what was seen in Barranquilla. However, this discrepancy could be explained by the fact that MyCity in Cape Town has considerably longer trunk corridors than Transmetro in Barranquilla, allowing for more travel time savings, on average. Another plausible reason is that oversampling of BRT users in Cape Town was higher than in Barranquilla, and these are the population that is likely to see reductions to travel times. Relocation of home or work place may also play a role in explaining the changes in commute times in both cities. Table 9 groups respondents into movers and non-movers. In the case of Barranquilla, the increase in travel time was driven by those that moved home or work location. From those classified as movers, 46% reported changing the

108
location of their workplace, which was associated with an average commute time increase of 6 minutes. Our Barranquilla data suggests that there was no change in commute time for those who did not move home or work location between 2010 and 2015 – the average travel time increase identified was not statistically significant. Cape Town residents that did not move their home or work location reported reducing their commute time by about 6 minutes, while those that changed their home or work location increased commute time by about 5 minutes. Table 9: Changes in commute time for movers and non-movers
Freq. Mean travel time
Mean change in travel time
Percent change
p-value
2010 2015 Barranquilla survey All respondents 1,059 33.6 36.8 3.2 9.6% 0.0000 Non-movers 479 34.5 34.9 0.4 1.0% 0.6195 Movers 580 32.8 38.3 5.6 17.0% 0.0000
Changed home location 96 35.1 37.0 1.9 5.5% 0.4647 Changed work location 484 32.3 38.6 6.3 19.4% 0.0000
Cape Town survey All respondents 1,023 46.9 45.5 -1.5 -3.2% 0.0899 Non-movers 618 52.3 46.4 -5.9 -11.3% 0.0000 Movers 405 38.8 44.1 5.3 13.5% 0.0005
Changed home location 191 38.0 42.6 4.6 12.2% 0.0414 Changed work location 330 37.5 44.8 7.3 19.5% 0.0000
Commute time changes in commute time for BRT users When breaking down the analysis by transportation mode, we found that respondents in Barranquilla that used BRT as their main commute mode in 2015 did not observe a statistically significant change in travel time either. Although this figure goes against what planners expect, no reductions in commute time can be a result of a higher number of transfers that increments on average commute time and longer waiting times at stations, mainly caused by service unreliability and high levels of crowding the system face. In contrast, BRT users in Cape Town did experience a reduction in commute time of approximately 5 minutes on average. Table 10 presents data on non-movers by main mode in 2010 and 2015, which allows for closer examination of on where time savings occurred. In Barranquilla, while paratransit users that switched to BRT did report a reduction in travel time of 2 minutes on average, the difference was not statistically significant. In contrast, those who switched from paratransit to motorcycle reported time savings of over 20 minutes on average. Similarly, data collected in Cape Town show that respondents reduced travel time when switching from other public transportation options -Golden Arrow and
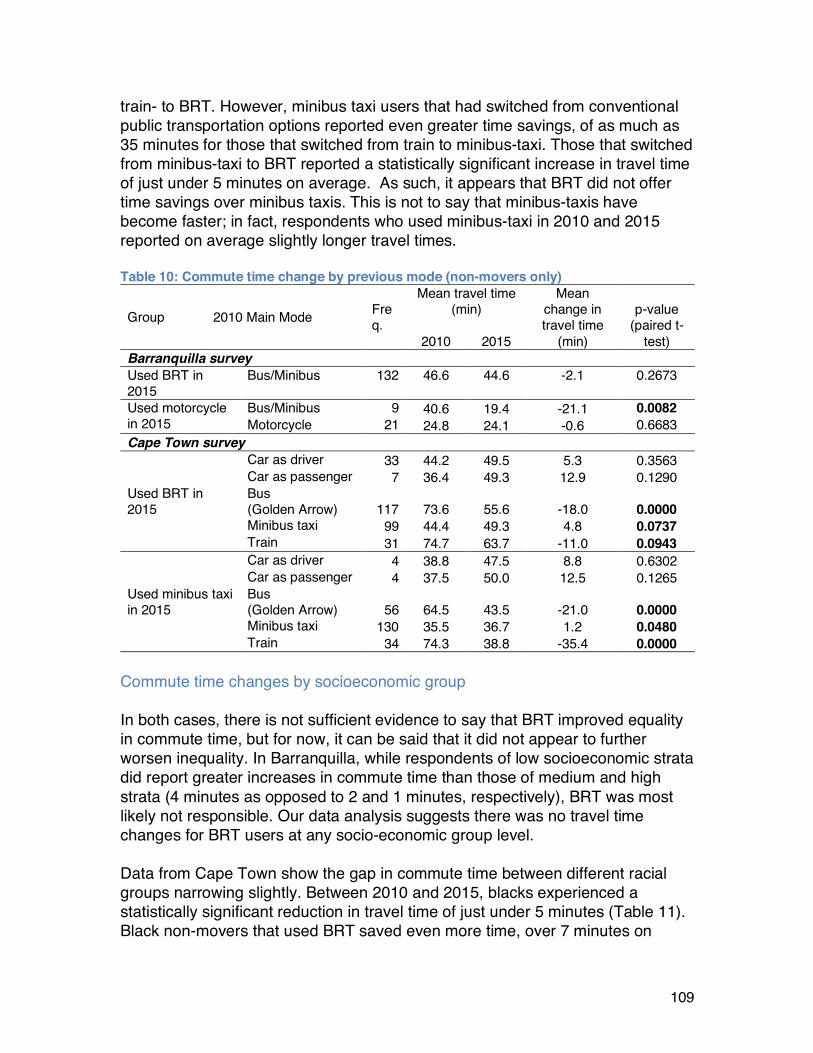
109
train- to BRT. However, minibus taxi users that had switched from conventional public transportation options reported even greater time savings, of as much as 35 minutes for those that switched from train to minibus-taxi. Those that switched from minibus-taxi to BRT reported a statistically significant increase in travel time of just under 5 minutes on average. As such, it appears that BRT did not offer time savings over minibus taxis. This is not to say that minibus-taxis have become faster; in fact, respondents who used minibus-taxi in 2010 and 2015 reported on average slightly longer travel times. Table 10: Commute time change by previous mode (non-movers only)
Group 2010 Main Mode Freq.
Mean travel time (min)
Mean change in p-value
(paired t-test) 2010 2015
travel time (min)
Barranquilla survey Used BRT in 2015
Bus/Minibus 132 46.6 44.6 -2.1 0.2673
Used motorcycle in 2015
Bus/Minibus 9 40.6 19.4 -21.1 0.0082 Motorcycle 21 24.8 24.1 -0.6 0.6683
Cape Town survey
Used BRT in 2015
Car as driver 33 44.2 49.5 5.3 0.3563 Car as passenger 7 36.4 49.3 12.9 0.1290 Bus (Golden Arrow) 117 73.6 55.6 -18.0 0.0000 Minibus taxi 99 44.4 49.3 4.8 0.0737 Train 31 74.7 63.7 -11.0 0.0943
Used minibus taxi in 2015
Car as driver 4 38.8 47.5 8.8 0.6302 Car as passenger 4 37.5 50.0 12.5 0.1265 Bus (Golden Arrow) 56 64.5 43.5 -21.0 0.0000 Minibus taxi 130 35.5 36.7 1.2 0.0480 Train 34 74.3 38.8 -35.4 0.0000
Commute time changes by socioeconomic group In both cases, there is not sufficient evidence to say that BRT improved equality in commute time, but for now, it can be said that it did not appear to further worsen inequality. In Barranquilla, while respondents of low socioeconomic strata did report greater increases in commute time than those of medium and high strata (4 minutes as opposed to 2 and 1 minutes, respectively), BRT was most likely not responsible. Our data analysis suggests there was no travel time changes for BRT users at any socio-economic group level. Data from Cape Town show the gap in commute time between different racial groups narrowing slightly. Between 2010 and 2015, blacks experienced a statistically significant reduction in travel time of just under 5 minutes (Table 11). Black non-movers that used BRT saved even more time, over 7 minutes on
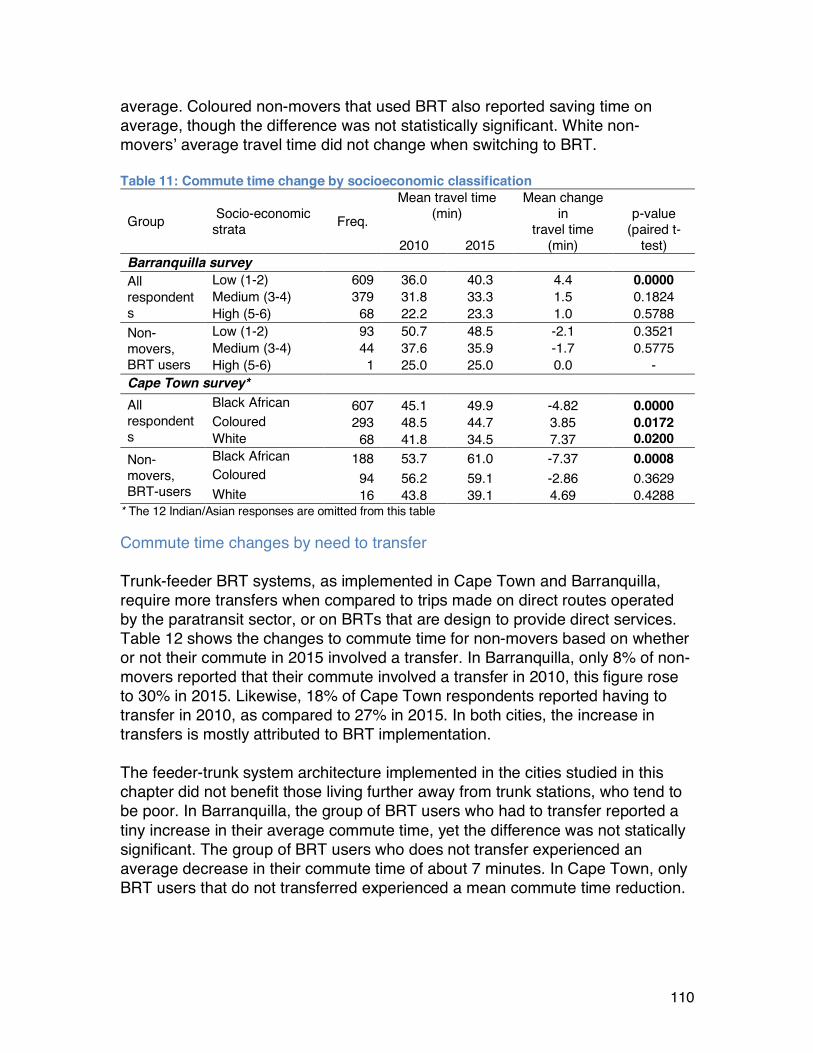
110
average. Coloured non-movers that used BRT also reported saving time on average, though the difference was not statistically significant. White non-movers’ average travel time did not change when switching to BRT. Table 11: Commute time change by socioeconomic classification
Group Socio-economic strata Freq.
Mean travel time (min)
Mean change in p-value
2010 2015 travel time
(min) (paired t-
test) Barranquilla survey All respondents
Low (1-2) 609 36.0 40.3 4.4 0.0000 Medium (3-4) 379 31.8 33.3 1.5 0.1824 High (5-6) 68 22.2 23.3 1.0 0.5788
Non-movers, BRT users
Low (1-2) 93 50.7 48.5 -2.1 0.3521 Medium (3-4) 44 37.6 35.9 -1.7 0.5775 High (5-6) 1 25.0 25.0 0.0 -
Cape Town survey* All respondents
Black African 607 45.1 49.9 -4.82 0.0000 Coloured 293 48.5 44.7 3.85 0.0172 White 68 41.8 34.5 7.37 0.0200
Non-movers, BRT-users
Black African 188 53.7 61.0 -7.37 0.0008 Coloured 94 56.2 59.1 -2.86 0.3629 White 16 43.8 39.1 4.69 0.4288
* The 12 Indian/Asian responses are omitted from this table Commute time changes by need to transfer Trunk-feeder BRT systems, as implemented in Cape Town and Barranquilla, require more transfers when compared to trips made on direct routes operated by the paratransit sector, or on BRTs that are design to provide direct services. Table 12 shows the changes to commute time for non-movers based on whether or not their commute in 2015 involved a transfer. In Barranquilla, only 8% of non-movers reported that their commute involved a transfer in 2010, this figure rose to 30% in 2015. Likewise, 18% of Cape Town respondents reported having to transfer in 2010, as compared to 27% in 2015. In both cities, the increase in transfers is mostly attributed to BRT implementation. The feeder-trunk system architecture implemented in the cities studied in this chapter did not benefit those living further away from trunk stations, who tend to be poor. In Barranquilla, the group of BRT users who had to transfer reported a tiny increase in their average commute time, yet the difference was not statically significant. The group of BRT users who does not transfer experienced an average decrease in their commute time of about 7 minutes. In Cape Town, only BRT users that do not transferred experienced a mean commute time reduction.
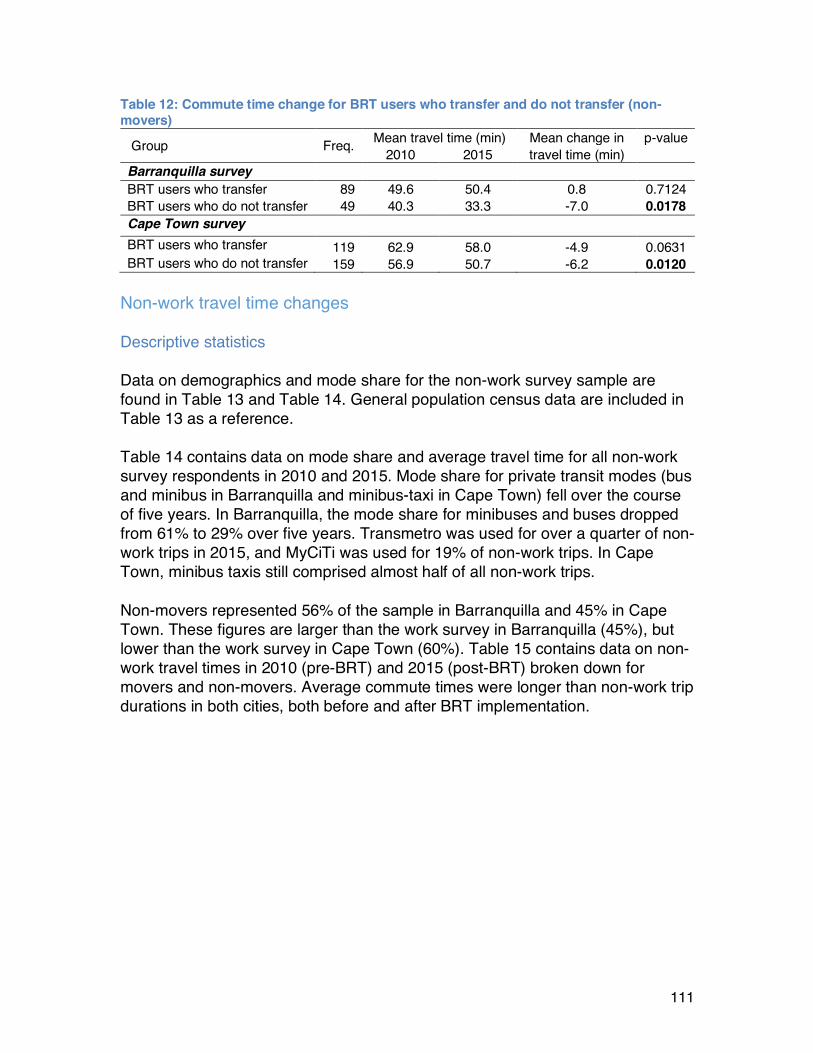
111
Table 12: Commute time change for BRT users who transfer and do not transfer (non-movers)
Group Freq. Mean travel time (min) Mean change in p-value 2010 2015 travel time (min)
Barranquilla survey BRT users who transfer 89 49.6 50.4 0.8 0.7124 BRT users who do not transfer 49 40.3 33.3 -7.0 0.0178 Cape Town survey BRT users who transfer 119 62.9 58.0 -4.9 0.0631 BRT users who do not transfer 159 56.9 50.7 -6.2 0.0120
Non-work travel time changes Descriptive statistics Data on demographics and mode share for the non-work survey sample are found in Table 13 and Table 14. General population census data are included in Table 13 as a reference. Table 14 contains data on mode share and average travel time for all non-work survey respondents in 2010 and 2015. Mode share for private transit modes (bus and minibus in Barranquilla and minibus-taxi in Cape Town) fell over the course of five years. In Barranquilla, the mode share for minibuses and buses dropped from 61% to 29% over five years. Transmetro was used for over a quarter of non-work trips in 2015, and MyCiTi was used for 19% of non-work trips. In Cape Town, minibus taxis still comprised almost half of all non-work trips. Non-movers represented 56% of the sample in Barranquilla and 45% in Cape Town. These figures are larger than the work survey in Barranquilla (45%), but lower than the work survey in Cape Town (60%). Table 15 contains data on non-work travel times in 2010 (pre-BRT) and 2015 (post-BRT) broken down for movers and non-movers. Average commute times were longer than non-work trip durations in both cities, both before and after BRT implementation.

112
Table 13: Demographic data for non-work sample Survey Census
dataa Category All Movers Non-movers All Percent Freq. Percent Freq. Percent Freq. Percent Barranquilla survey Sex All 100.0% 796 100.0% 348 100.0% 448 100.0% Female 56.3% 448 58.1% 202 54.9% 246 51.2% Male 42.6% 339 41.1% 143 43.8% 196 48.8% No response 1.1% 9 0.9% 3 1.3% 6 - Age 17-25 19.2% 153 26.7% 93 13.4% 60 21.8% 26-54 59.1% 470 56.3% 196 61.2% 274 56.7% 55 or more 21.1% 168 17.0% 59 24.3% 109 21.5% No response 0.6% 5 0.0% 0 1.1% 5 - Socio-economic strata
Low (1-2) 48.7% 387 53.2% 185 45.2% 202 63.4% Medium (3-4) 42.4% 337 36.2% 126 47.2% 211 29.7% High (5-6) 8.9% 71 10.6% 37 7.6% 34 7.0% No response 0.0% 1 0 0.0% 0.0% 1 -
Cape Town survey
Sex
All 100.0% 558 100.0% 309 100.0% 249 100.0% Female 53.6% 299 54.4% 168 52.6% 131 51.0% Male 44.4% 248 44.0% 136 45.0% 112 49.0% No response 2.0% 11 1.6% 5 2.4% 6 -
Age
20-34 50.0% 279 53.4% 165 45.8% 114 44.3%b 35-59 46.8% 261 43.7% 135 50.6% 126 43.1% 60 or more 2.5% 14 1.9% 6 3.2% 8 12.6% No response 0.7% 4 0.1% 3 0.4% 1 -
Black 65.1% 363 70.2% 217 58.6% 146 38.6% Coloured 22.4% 125 18.1% 56 27.7% 69 42.4% Race Indian/Asian 1.4% 8 1.9% 6 0.8% 2 1.4% White 8.1% 45 6.1% 19 10.4% 26 15.7% No response 3.0% 17 3.6% 11 2.4% 6 -c
a Data for Barranquilla correspond to our own calculations based on population projections to 2015 published by DANE. Socio-economic strata correspond to household distribution as of 2008. Data for Cape Town come from the 2011 Census. b As a percentage of the population 20 years of age or more c In the Census data, 1.9% of the population is classified as “other.”
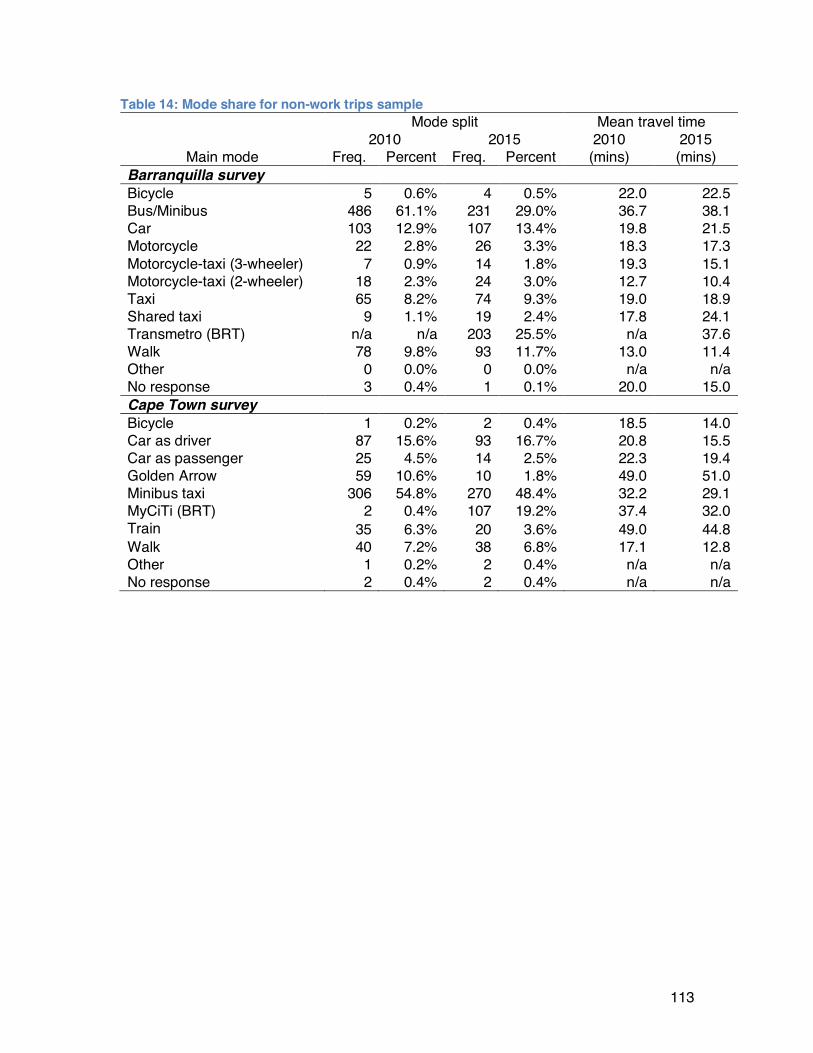
113
Table 14: Mode share for non-work trips sample Mode split Mean travel time 2010 2015 2010 2015
Main mode Freq. Percent Freq. Percent (mins) (mins) Barranquilla survey Bicycle 5 0.6% 4 0.5% 22.0 22.5 Bus/Minibus 486 61.1% 231 29.0% 36.7 38.1 Car 103 12.9% 107 13.4% 19.8 21.5 Motorcycle 22 2.8% 26 3.3% 18.3 17.3 Motorcycle-taxi (3-wheeler) 7 0.9% 14 1.8% 19.3 15.1 Motorcycle-taxi (2-wheeler) 18 2.3% 24 3.0% 12.7 10.4 Taxi 65 8.2% 74 9.3% 19.0 18.9 Shared taxi 9 1.1% 19 2.4% 17.8 24.1 Transmetro (BRT) n/a n/a 203 25.5% n/a 37.6 Walk 78 9.8% 93 11.7% 13.0 11.4 Other 0 0.0% 0 0.0% n/a n/a No response 3 0.4% 1 0.1% 20.0 15.0 Cape Town survey Bicycle 1 0.2% 2 0.4% 18.5 14.0 Car as driver 87 15.6% 93 16.7% 20.8 15.5 Car as passenger 25 4.5% 14 2.5% 22.3 19.4 Golden Arrow 59 10.6% 10 1.8% 49.0 51.0 Minibus taxi 306 54.8% 270 48.4% 32.2 29.1 MyCiTi (BRT) 2 0.4% 107 19.2% 37.4 32.0 Train 35 6.3% 20 3.6% 49.0 44.8 Walk 40 7.2% 38 6.8% 17.1 12.8 Other 1 0.2% 2 0.4% n/a n/a No response 2 0.4% 2 0.4% n/a n/a
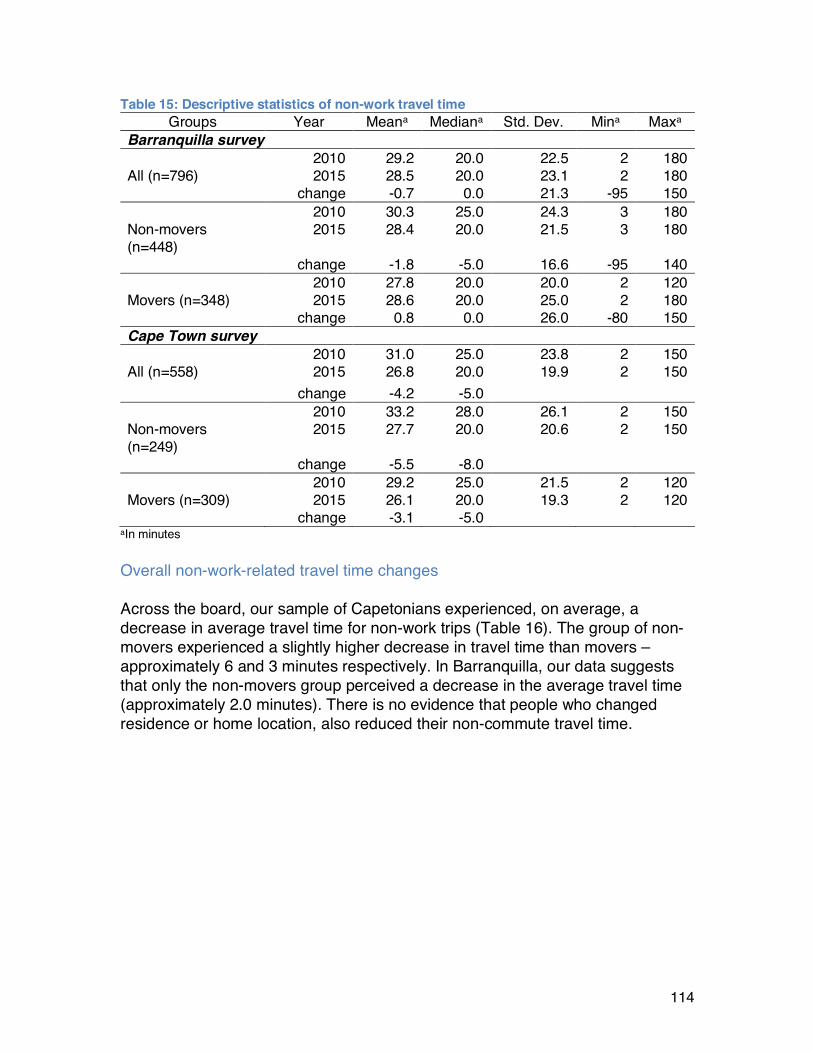
114
Table 15: Descriptive statistics of non-work travel time Groups Year Meana Mediana Std. Dev. Mina Maxa
Barranquilla survey 2010 29.2 20.0 22.5 2 180 All (n=796) 2015 28.5 20.0 23.1 2 180 change -0.7 0.0 21.3 -95 150 2010 30.3 25.0 24.3 3 180 Non-movers (n=448)
2015 28.4 20.0 21.5 3 180
change -1.8 -5.0 16.6 -95 140 2010 27.8 20.0 20.0 2 120 Movers (n=348) 2015 28.6 20.0 25.0 2 180 change 0.8 0.0 26.0 -80 150 Cape Town survey 2010 31.0 25.0 23.8 2 150 All (n=558) 2015 26.8 20.0 19.9 2 150 change -4.2 -5.0 2010 33.2 28.0 26.1 2 150 Non-movers (n=249)
2015 27.7 20.0 20.6 2 150
change -5.5 -8.0 2010 29.2 25.0 21.5 2 120 Movers (n=309) 2015 26.1 20.0 19.3 2 120 change -3.1 -5.0
aIn minutes Overall non-work-related travel time changes Across the board, our sample of Capetonians experienced, on average, a decrease in average travel time for non-work trips (Table 16). The group of non-movers experienced a slightly higher decrease in travel time than movers – approximately 6 and 3 minutes respectively. In Barranquilla, our data suggests that only the non-movers group perceived a decrease in the average travel time (approximately 2.0 minutes). There is no evidence that people who changed residence or home location, also reduced their non-commute travel time.

115
Table 16: Non-work travel time change for movers and non-movers Freq. Mean travel
time Mean
change in travel time
Percent change
p-value
2010 2015 Barranquilla survey All respondents 796 29.2 28.5 -0.7 -2.3% 0.3667 Non-movers 448 30.3 28.4 -1.8 -6.1% 0.0198 Movers 348 27.8 28.6 0.8 2.9% 0.5613 Cape Town survey All respondents 558 31.0 26.8 -4.2 -15.6% 0.0000 Non-movers 249 33.2 27.7 -5.5 -20.0% 0.0000 Movers 309 29.2 26.1 -3.1 -11.8% 0.0238
Changes in non-work travel time for BRT users Barranquilla survey respondents who in 2015 used the BRT as their main mode for non-work trips, and who did not move their home or destination location, experienced travel time savings, followed by motorcyclists and shared taxi users (Table 17). Reductions in average travel time for non-mover survey respondents in Barranquilla was driven by people switching from traditional buses to BRT or motorcycles (Table 18). Similarly, in Cape Town, non-mover survey respondents that reported using the BRT as their main mode for non-work trips experienced travel time savings, followed by automobile drivers and minibus taxi users. Non-work travel time savings here were also driven by people switching from conventional public transportation alternatives such as Golden Arrow or train (Table 18).
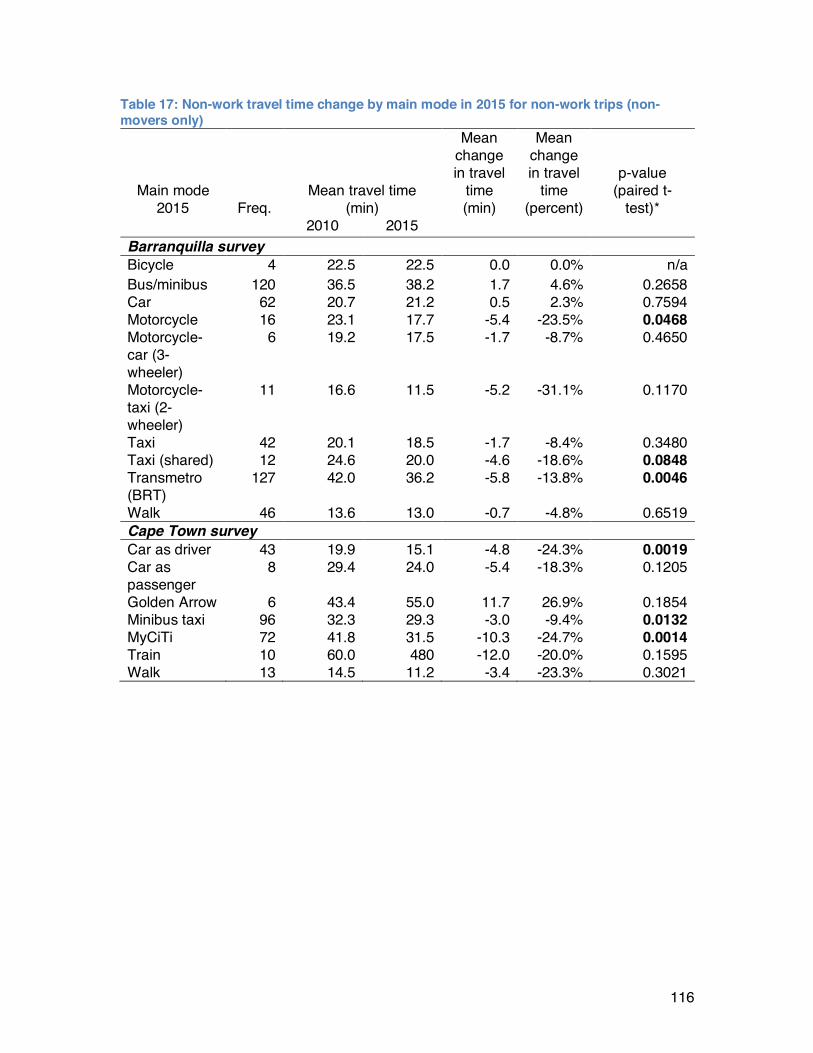
116
Table 17: Non-work travel time change by main mode in 2015 for non-work trips (non-movers only)
Main mode 2015 Freq.
Mean travel time (min)
Mean change in travel
time (min)
Mean change in travel
time (percent)
p-value (paired t-
test)* 2010 2015 Barranquilla survey Bicycle 4 22.5 22.5 0.0 0.0% n/a Bus/minibus 120 36.5 38.2 1.7 4.6% 0.2658 Car 62 20.7 21.2 0.5 2.3% 0.7594 Motorcycle 16 23.1 17.7 -5.4 -23.5% 0.0468 Motorcycle-car (3-wheeler)
6 19.2 17.5 -1.7 -8.7% 0.4650
Motorcycle-taxi (2-wheeler)
11 16.6 11.5 -5.2 -31.1% 0.1170
Taxi 42 20.1 18.5 -1.7 -8.4% 0.3480 Taxi (shared) 12 24.6 20.0 -4.6 -18.6% 0.0848 Transmetro (BRT)
127 42.0 36.2 -5.8 -13.8% 0.0046
Walk 46 13.6 13.0 -0.7 -4.8% 0.6519 Cape Town survey Car as driver 43 19.9 15.1 -4.8 -24.3% 0.0019 Car as passenger
8 29.4 24.0 -5.4 -18.3% 0.1205
Golden Arrow 6 43.4 55.0 11.7 26.9% 0.1854 Minibus taxi 96 32.3 29.3 -3.0 -9.4% 0.0132 MyCiTi 72 41.8 31.5 -10.3 -24.7% 0.0014 Train 10 60.0 480 -12.0 -20.0% 0.1595 Walk 13 14.5 11.2 -3.4 -23.3% 0.3021
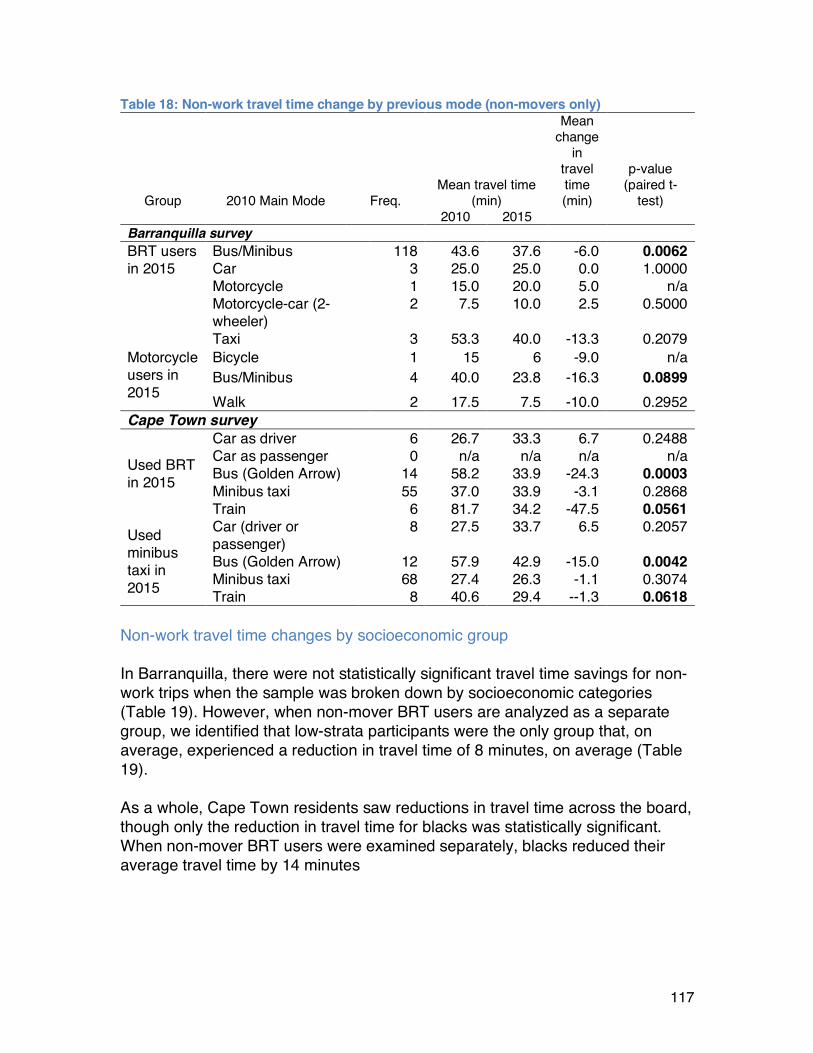
117
Table 18: Non-work travel time change by previous mode (non-movers only)
Group 2010 Main Mode Freq. Mean travel time
(min)
Mean change
in travel time (min)
p-value (paired t-
test) 2010 2015 Barranquilla survey BRT users in 2015
Bus/Minibus 118 43.6 37.6 -6.0 0.0062 Car 3 25.0 25.0 0.0 1.0000 Motorcycle 1 15.0 20.0 5.0 n/a Motorcycle-car (2-wheeler)
2 7.5 10.0 2.5 0.5000
Taxi 3 53.3 40.0 -13.3 0.2079 Motorcycle users in 2015
Bicycle 1 15 6 -9.0 n/a Bus/Minibus 4 40.0 23.8 -16.3 0.0899 Walk 2 17.5 7.5 -10.0 0.2952
Cape Town survey
Used BRT in 2015
Car as driver 6 26.7 33.3 6.7 0.2488 Car as passenger 0 n/a n/a n/a n/a Bus (Golden Arrow) 14 58.2 33.9 -24.3 0.0003 Minibus taxi 55 37.0 33.9 -3.1 0.2868 Train 6 81.7 34.2 -47.5 0.0561
Used minibus taxi in 2015
Car (driver or passenger)
8 27.5 33.7 6.5 0.2057
Bus (Golden Arrow) 12 57.9 42.9 -15.0 0.0042 Minibus taxi 68 27.4 26.3 -1.1 0.3074 Train 8 40.6 29.4 --1.3 0.0618
Non-work travel time changes by socioeconomic group In Barranquilla, there were not statistically significant travel time savings for non-work trips when the sample was broken down by socioeconomic categories (Table 19). However, when non-mover BRT users are analyzed as a separate group, we identified that low-strata participants were the only group that, on average, experienced a reduction in travel time of 8 minutes, on average (Table 19). As a whole, Cape Town residents saw reductions in travel time across the board, though only the reduction in travel time for blacks was statistically significant. When non-mover BRT users were examined separately, blacks reduced their average travel time by 14 minutes
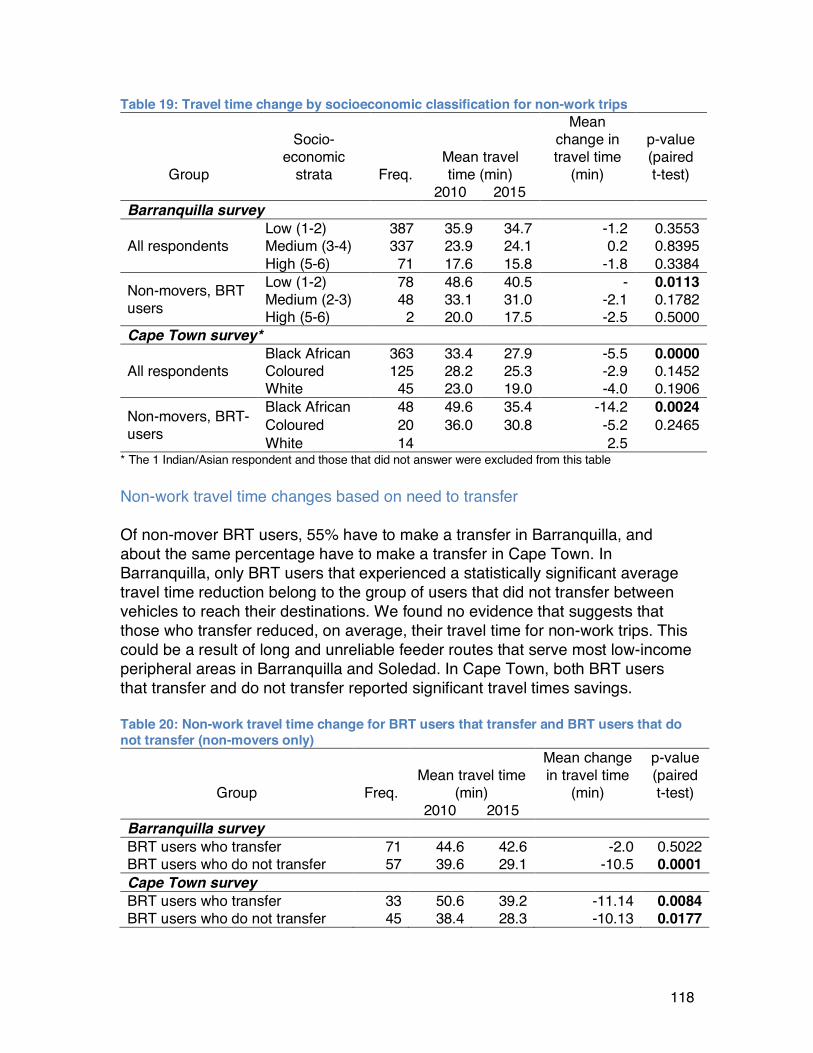
118
Table 19: Travel time change by socioeconomic classification for non-work trips
Group
Socio-economic
strata Freq. Mean travel time (min)
Mean change in travel time
(min)
p-value (paired t-test)
2010 2015 Barranquilla survey
All respondents Low (1-2) 387 35.9 34.7 -1.2 0.3553 Medium (3-4) 337 23.9 24.1 0.2 0.8395 High (5-6) 71 17.6 15.8 -1.8 0.3384
Non-movers, BRT users
Low (1-2) 78 48.6 40.5 - 0.0113 Medium (2-3) 48 33.1 31.0 -2.1 0.1782 High (5-6) 2 20.0 17.5 -2.5 0.5000
Cape Town survey*
All respondents Black African 363 33.4 27.9 -5.5 0.0000 Coloured 125 28.2 25.3 -2.9 0.1452 White 45 23.0 19.0 -4.0 0.1906
Non-movers, BRT-users
Black African 48 49.6 35.4 -14.2 0.0024 Coloured 20 36.0 30.8 -5.2 0.2465 White 14 2.5
* The 1 Indian/Asian respondent and those that did not answer were excluded from this table Non-work travel time changes based on need to transfer Of non-mover BRT users, 55% have to make a transfer in Barranquilla, and about the same percentage have to make a transfer in Cape Town. In Barranquilla, only BRT users that experienced a statistically significant average travel time reduction belong to the group of users that did not transfer between vehicles to reach their destinations. We found no evidence that suggests that those who transfer reduced, on average, their travel time for non-work trips. This could be a result of long and unreliable feeder routes that serve most low-income peripheral areas in Barranquilla and Soledad. In Cape Town, both BRT users that transfer and do not transfer reported significant travel times savings. Table 20: Non-work travel time change for BRT users that transfer and BRT users that do not transfer (non-movers only)
Group Freq. Mean travel time
(min)
Mean change in travel time
(min)
p-value (paired t-test)
2010 2015 Barranquilla survey BRT users who transfer 71 44.6 42.6 -2.0 0.5022 BRT users who do not transfer 57 39.6 29.1 -10.5 0.0001 Cape Town survey BRT users who transfer 33 50.6 39.2 -11.14 0.0084 BRT users who do not transfer 45 38.4 28.3 -10.13 0.0177
Chapter 10 Perspectives from Barranquilla residents In this chapter, we describe how the travel experiences of Barranquilla, Colombia residents have changed since the implementation of the BRT trunk-and-feeder system in 2010. Using an intercept recruitment methodology at more than 15 locations, we conducted dozens of interviews of Barranquilla residents. Interviewees had mixed feelings about the new system, depending partly on their socioeconomic status and their habitual mode choices. Many interviewees were pleased about reductions in travel time, particularly when referring to the trunk line services; the air conditioning on BRT vehicles; and an increased sense of safety from crime. Most interviewees identified significant drawbacks of the system as well, most notably overcrowding, especially at peak hours; the insufficiency and complexity of feeder routes; and the elimination of several bus routes that accompanied Transmetro’s implementation. The free transfer between Transmetro’s trunk and feeder routes reduced some users’ out-of-pocket costs. Yet some interviewees, mostly low income, expressed disappointment at losing the ability to bargain over fares with Transmetro. Finally, our interviews reveal a complex interaction between the BRT, private licensed buses, and largely illegal paratransit, in which these services complement one another through feeder relationships, and compete with one another for riders, under different circumstances. Transmetro has hopes of expanding and improving the system. These results suggest the need to focus on better integrating Transmetro with private buses and transit, and making the system easier to understand and use, while maintaining the relative safety of the system and keeping operating speeds on the trunk line at current levels. Methods Number of interviews, recruitment approach and site selection We collected data through semi-structured interviews with BRT and non-BRT users over 18 years old (n=65) during the first week of August 2015. Interviews were conducted by a group of 18 interviewers, including the authors of this chapter and other graduate students from University of California, Berkeley (U.C. Berkeley) and Universidad del Norte (UN) (see acknowledgements). We recruited participants by approaching individuals at public places in different parts of Barranquilla and Soledad. Interviewers worked in pairs, often comprised of either one woman and one man, or two women, to reduce any intimidation that potential interviewees might experience. Recruitment locations were generally in the proximity of BRT stations or feeder route stops, as we were interested in
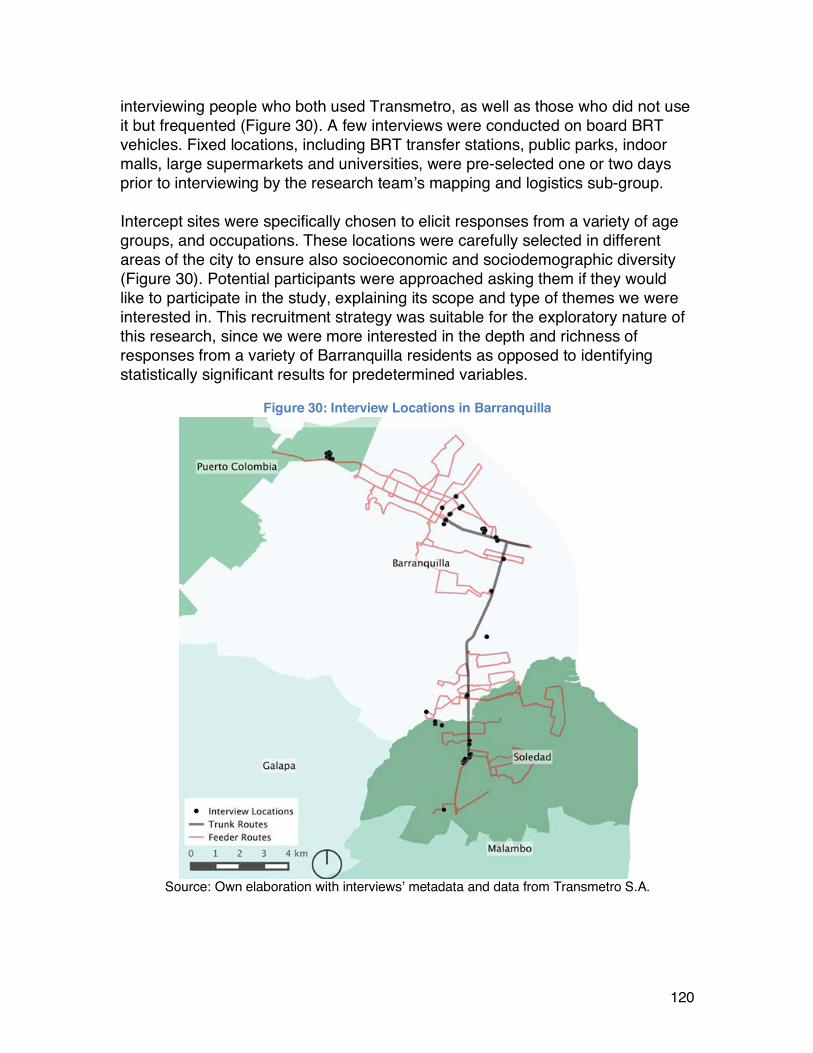
120
interviewing people who both used Transmetro, as well as those who did not use it but frequented (Figure 30). A few interviews were conducted on board BRT vehicles. Fixed locations, including BRT transfer stations, public parks, indoor malls, large supermarkets and universities, were pre-selected one or two days prior to interviewing by the research team’s mapping and logistics sub-group. Intercept sites were specifically chosen to elicit responses from a variety of age groups, and occupations. These locations were carefully selected in different areas of the city to ensure also socioeconomic and sociodemographic diversity (Figure 30). Potential participants were approached asking them if they would like to participate in the study, explaining its scope and type of themes we were interested in. This recruitment strategy was suitable for the exploratory nature of this research, since we were more interested in the depth and richness of responses from a variety of Barranquilla residents as opposed to identifying statistically significant results for predetermined variables.
Figure 30: Interview Locations in Barranquilla
Source: Own elaboration with interviews’ metadata and data from Transmetro S.A.

121
Interview protocol design We designed an interview protocol around five main topics on which we posed predominantly open-ended questions, to maintain uniformity in information collected while allowing respondents to guide the interview based on their own experience. For example, many of our interviews began with the open-ended question, “How has the city changed during the last five years?”—the period after which Transmetro began service. Most of our interviews touched upon what interviewees liked about their neighborhoods and how their neighborhoods had changed; what their daily routine was like, including daily travel; the important changes that they perceived in the city in the previous five years; and how their travel patterns had changed after BRT implementation, if at all. We also asked a few demographic questions, including their home location, age, and occupation, to get a better sense of how and whether our interview set was roughly representative of the metropolitan area population. Data collection and processing All interviews in Barranquilla were conducted in Spanish. They ranged between 15 minutes to 50 minutes in length, and were all audiotaped given consent of the interviewees. Interview metadata including interview location, interviewee’s home location, demographic characteristics, and modes used were recorded and analyzed daily to plan next day interview locations and potential interviewees to guarantee a diverse sample of respondents. We revised the interview topic guide and recruitment script over the five-day period to reflect feedback from interviewers and interviewees. Many of the interviews were very short or otherwise uninformative. We focused on a subset of 28 that contained large amounts of relevant information to the study question. We transcribed these interviews, translated them into English, and analyzed them both in Spanish and English. Simultaneously to the interview transcription-translation process, the non-interviewing group members developed a codebook containing different topics and perceptions identified from the interviews. The codebook designed for this research was inspired from grounded theory and the coding methods described in The Coding Manual for Qualitative Researchers,275 but coding was done iteratively and collaboratively. Coding collaboratively is a recommended technique to “generate new and richer codes”, providing a “reality check” often referred to as intercoder agreement or interpretive convergence.
275 Saldana, The Coding Manual for Qualitative Researchers.
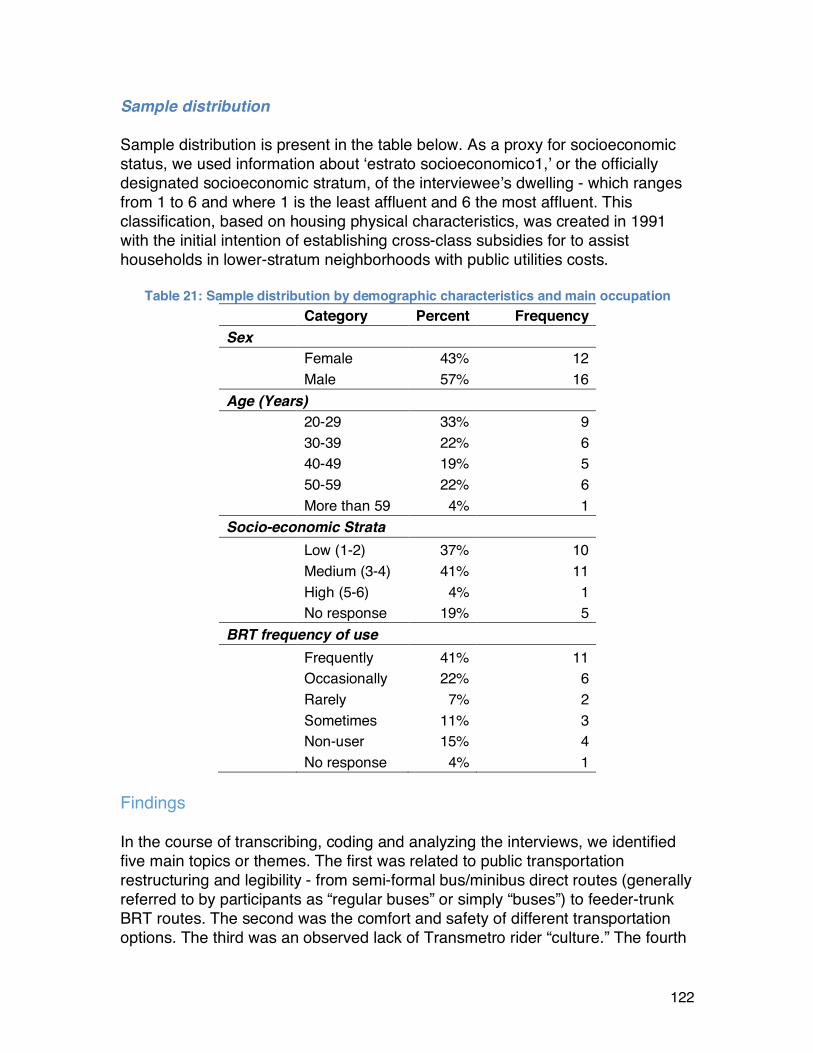
122
Sample distribution Sample distribution is present in the table below. As a proxy for socioeconomic status, we used information about ‘estrato socioeconomico1,’ or the officially designated socioeconomic stratum, of the interviewee’s dwelling - which ranges from 1 to 6 and where 1 is the least affluent and 6 the most affluent. This classification, based on housing physical characteristics, was created in 1991 with the initial intention of establishing cross-class subsidies for to assist households in lower-stratum neighborhoods with public utilities costs.
Table 21: Sample distribution by demographic characteristics and main occupation Category Percent Frequency Sex Female 43% 12
Male 57% 16 Age (Years) 20-29 33% 9
30-39 22% 6 40-49 19% 5 50-59 22% 6 More than 59 4% 1
Socio-economic Strata
Low (1-2) 37% 10 Medium (3-4) 41% 11 High (5-6) 4% 1 No response 19% 5
BRT frequency of use
Frequently 41% 11 Occasionally 22% 6 Rarely 7% 2 Sometimes 11% 3 Non-user 15% 4 No response 4% 1
Findings In the course of transcribing, coding and analyzing the interviews, we identified five main topics or themes. The first was related to public transportation restructuring and legibility - from semi-formal bus/minibus direct routes (generally referred to by participants as “regular buses” or simply “buses”) to feeder-trunk BRT routes. The second was the comfort and safety of different transportation options. The third was an observed lack of Transmetro rider “culture.” The fourth
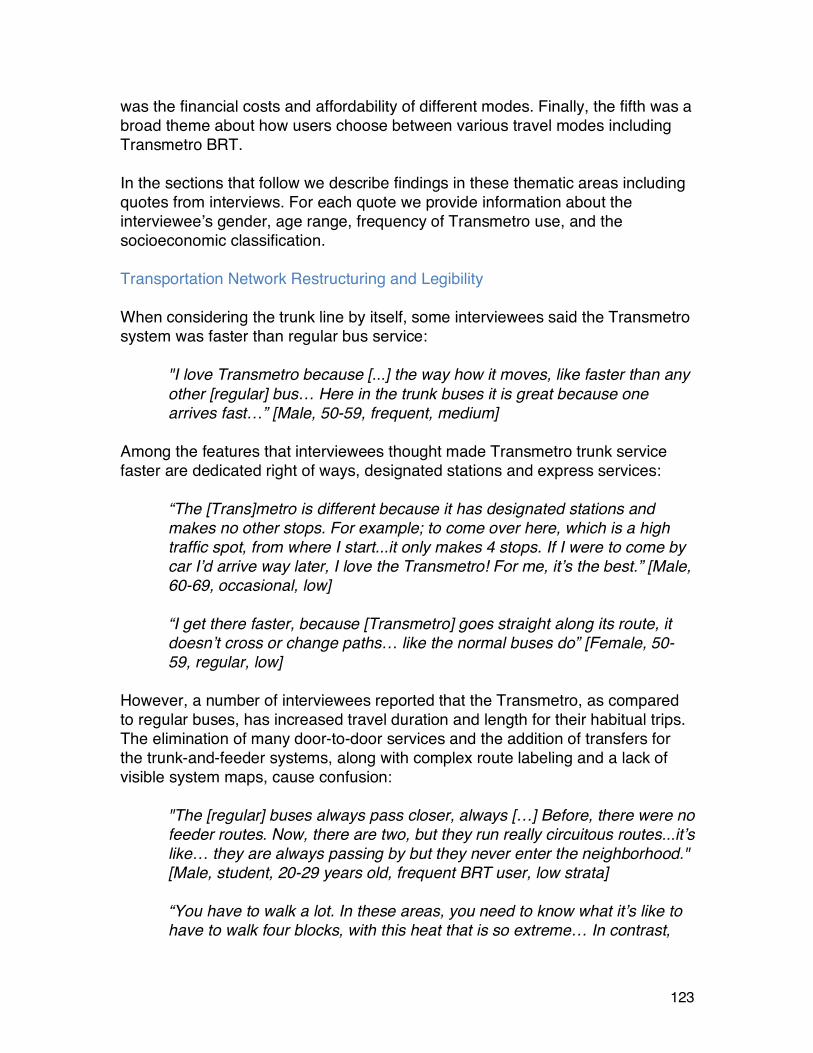
123
was the financial costs and affordability of different modes. Finally, the fifth was a broad theme about how users choose between various travel modes including Transmetro BRT. In the sections that follow we describe findings in these thematic areas including quotes from interviews. For each quote we provide information about the interviewee’s gender, age range, frequency of Transmetro use, and the socioeconomic classification. Transportation Network Restructuring and Legibility When considering the trunk line by itself, some interviewees said the Transmetro system was faster than regular bus service:
"I love Transmetro because [...] the way how it moves, like faster than any other [regular] bus… Here in the trunk buses it is great because one arrives fast…” [Male, 50-59, frequent, medium]
Among the features that interviewees thought made Transmetro trunk service faster are dedicated right of ways, designated stations and express services:
“The [Trans]metro is different because it has designated stations and makes no other stops. For example; to come over here, which is a high traffic spot, from where I start...it only makes 4 stops. If I were to come by car I’d arrive way later, I love the Transmetro! For me, it’s the best.” [Male, 60-69, occasional, low] “I get there faster, because [Transmetro] goes straight along its route, it doesn’t cross or change paths… like the normal buses do” [Female, 50-59, regular, low]
However, a number of interviewees reported that the Transmetro, as compared to regular buses, has increased travel duration and length for their habitual trips. The elimination of many door-to-door services and the addition of transfers for the trunk-and-feeder systems, along with complex route labeling and a lack of visible system maps, cause confusion:
"The [regular] buses always pass closer, always […] Before, there were no feeder routes. Now, there are two, but they run really circuitous routes...it’s like… they are always passing by but they never enter the neighborhood." [Male, student, 20-29 years old, frequent BRT user, low strata] “You have to walk a lot. In these areas, you need to know what it’s like to have to walk four blocks, with this heat that is so extreme… In contrast,
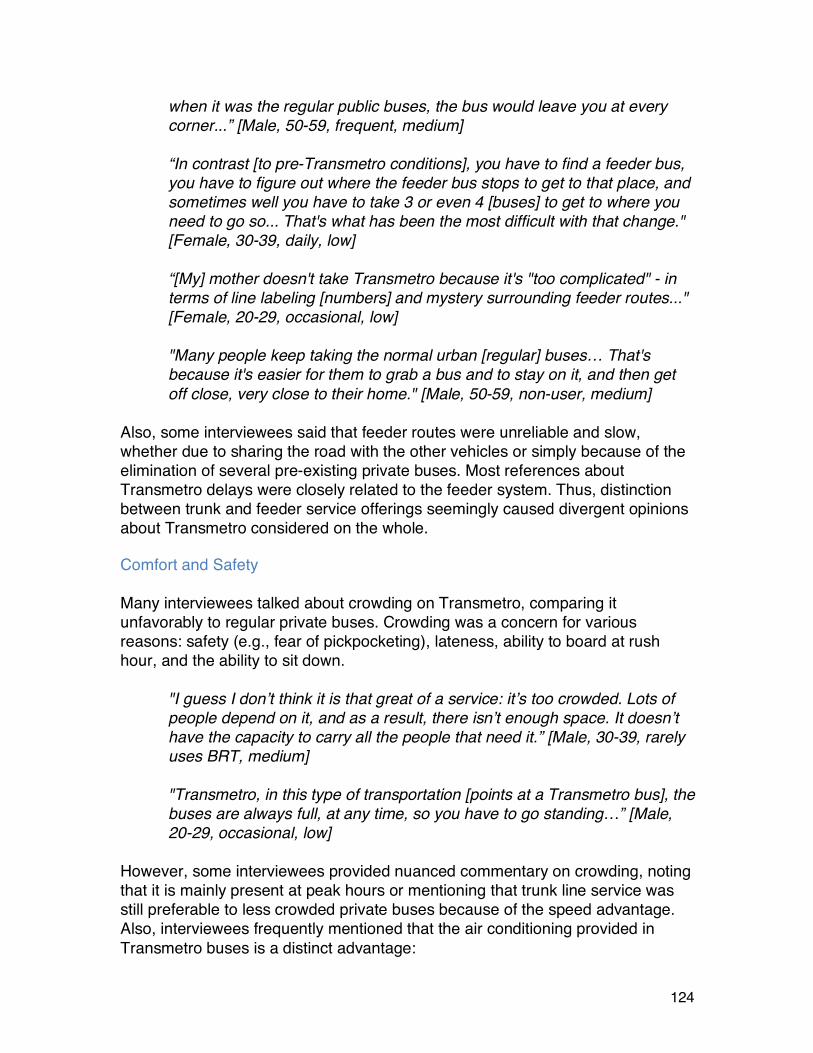
124
when it was the regular public buses, the bus would leave you at every corner...” [Male, 50-59, frequent, medium] “In contrast [to pre-Transmetro conditions], you have to find a feeder bus, you have to figure out where the feeder bus stops to get to that place, and sometimes well you have to take 3 or even 4 [buses] to get to where you need to go so... That's what has been the most difficult with that change." [Female, 30-39, daily, low] “[My] mother doesn't take Transmetro because it's "too complicated" - in terms of line labeling [numbers] and mystery surrounding feeder routes..." [Female, 20-29, occasional, low] "Many people keep taking the normal urban [regular] buses… That's because it's easier for them to grab a bus and to stay on it, and then get off close, very close to their home." [Male, 50-59, non-user, medium]
Also, some interviewees said that feeder routes were unreliable and slow, whether due to sharing the road with the other vehicles or simply because of the elimination of several pre-existing private buses. Most references about Transmetro delays were closely related to the feeder system. Thus, distinction between trunk and feeder service offerings seemingly caused divergent opinions about Transmetro considered on the whole. Comfort and Safety Many interviewees talked about crowding on Transmetro, comparing it unfavorably to regular private buses. Crowding was a concern for various reasons: safety (e.g., fear of pickpocketing), lateness, ability to board at rush hour, and the ability to sit down.
"I guess I don’t think it is that great of a service: it’s too crowded. Lots of people depend on it, and as a result, there isn’t enough space. It doesn’t have the capacity to carry all the people that need it.” [Male, 30-39, rarely uses BRT, medium] "Transmetro, in this type of transportation [points at a Transmetro bus], the buses are always full, at any time, so you have to go standing…” [Male, 20-29, occasional, low]
However, some interviewees provided nuanced commentary on crowding, noting that it is mainly present at peak hours or mentioning that trunk line service was still preferable to less crowded private buses because of the speed advantage. Also, interviewees frequently mentioned that the air conditioning provided in Transmetro buses is a distinct advantage:
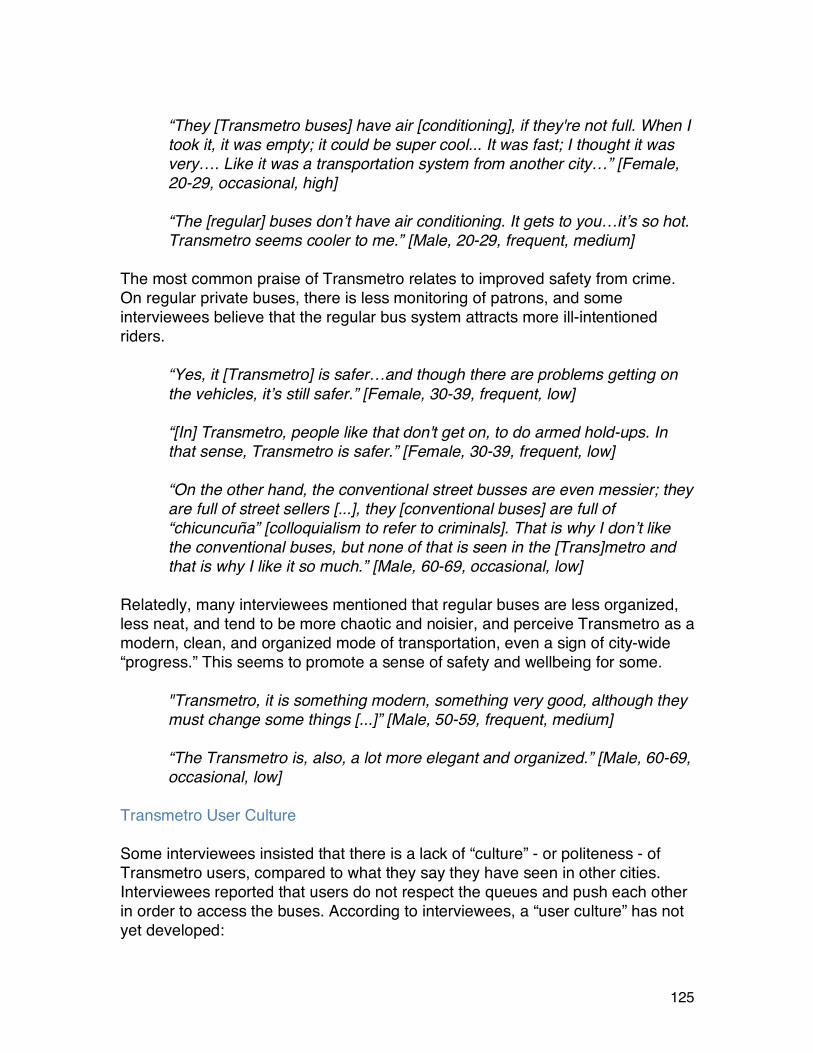
125
“They [Transmetro buses] have air [conditioning], if they're not full. When I took it, it was empty; it could be super cool... It was fast; I thought it was very…. Like it was a transportation system from another city…” [Female, 20-29, occasional, high] “The [regular] buses don’t have air conditioning. It gets to you…it’s so hot. Transmetro seems cooler to me.” [Male, 20-29, frequent, medium]
The most common praise of Transmetro relates to improved safety from crime. On regular private buses, there is less monitoring of patrons, and some interviewees believe that the regular bus system attracts more ill-intentioned riders.
“Yes, it [Transmetro] is safer…and though there are problems getting on the vehicles, it’s still safer.” [Female, 30-39, frequent, low] “[In] Transmetro, people like that don't get on, to do armed hold-ups. In that sense, Transmetro is safer.” [Female, 30-39, frequent, low] “On the other hand, the conventional street busses are even messier; they are full of street sellers [...], they [conventional buses] are full of “chicuncuña” [colloquialism to refer to criminals]. That is why I don’t like the conventional buses, but none of that is seen in the [Trans]metro and that is why I like it so much.” [Male, 60-69, occasional, low]
Relatedly, many interviewees mentioned that regular buses are less organized, less neat, and tend to be more chaotic and noisier, and perceive Transmetro as a modern, clean, and organized mode of transportation, even a sign of city-wide “progress.” This seems to promote a sense of safety and wellbeing for some.
"Transmetro, it is something modern, something very good, although they must change some things [...]” [Male, 50-59, frequent, medium] “The Transmetro is, also, a lot more elegant and organized.” [Male, 60-69, occasional, low]
Transmetro User Culture Some interviewees insisted that there is a lack of “culture” - or politeness - of Transmetro users, compared to what they say they have seen in other cities. Interviewees reported that users do not respect the queues and push each other in order to access the buses. According to interviewees, a “user culture” has not yet developed:
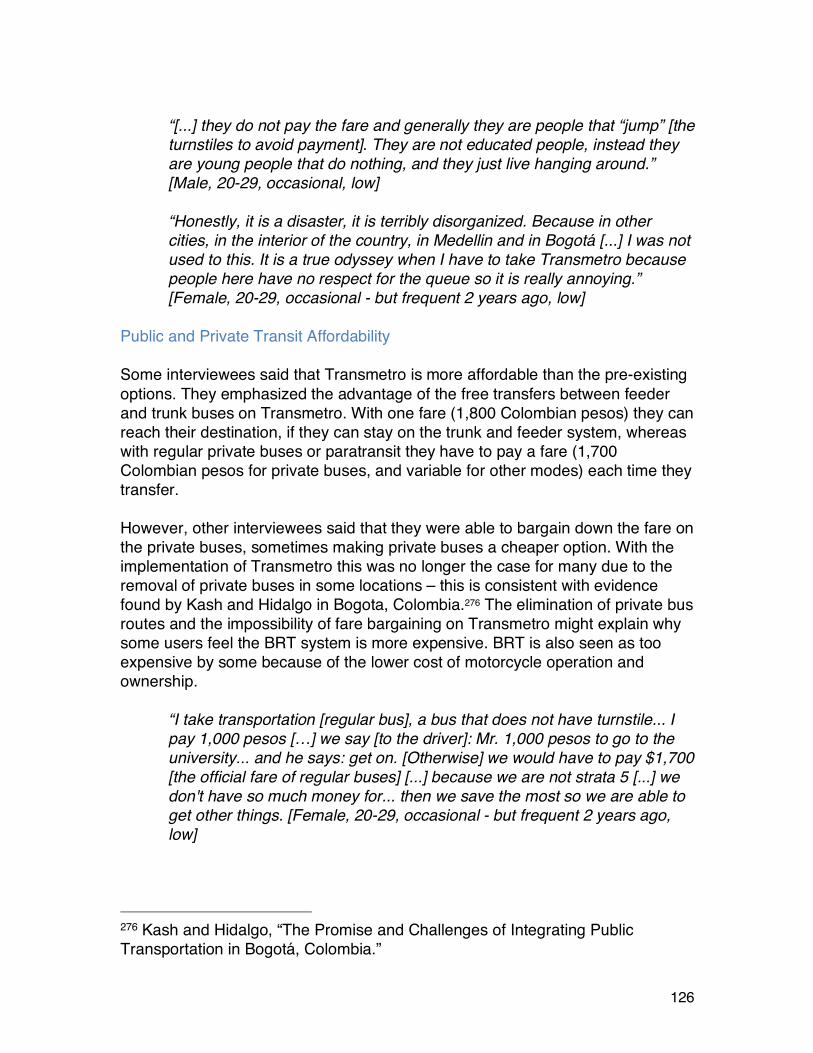
126
“[...] they do not pay the fare and generally they are people that “jump” [the turnstiles to avoid payment]. They are not educated people, instead they are young people that do nothing, and they just live hanging around.” [Male, 20-29, occasional, low] “Honestly, it is a disaster, it is terribly disorganized. Because in other cities, in the interior of the country, in Medellin and in Bogotá [...] I was not used to this. It is a true odyssey when I have to take Transmetro because people here have no respect for the queue so it is really annoying.” [Female, 20-29, occasional - but frequent 2 years ago, low]
Public and Private Transit Affordability Some interviewees said that Transmetro is more affordable than the pre-existing options. They emphasized the advantage of the free transfers between feeder and trunk buses on Transmetro. With one fare (1,800 Colombian pesos) they can reach their destination, if they can stay on the trunk and feeder system, whereas with regular private buses or paratransit they have to pay a fare (1,700 Colombian pesos for private buses, and variable for other modes) each time they transfer. However, other interviewees said that they were able to bargain down the fare on the private buses, sometimes making private buses a cheaper option. With the implementation of Transmetro this was no longer the case for many due to the removal of private buses in some locations – this is consistent with evidence found by Kash and Hidalgo in Bogota, Colombia.276 The elimination of private bus routes and the impossibility of fare bargaining on Transmetro might explain why some users feel the BRT system is more expensive. BRT is also seen as too expensive by some because of the lower cost of motorcycle operation and ownership.
“I take transportation [regular bus], a bus that does not have turnstile... I pay 1,000 pesos […] we say [to the driver]: Mr. 1,000 pesos to go to the university... and he says: get on. [Otherwise] we would have to pay $1,700 [the official fare of regular buses] [...] because we are not strata 5 [...] we don't have so much money for... then we save the most so we are able to get other things. [Female, 20-29, occasional - but frequent 2 years ago, low]
276 Kash and Hidalgo, “The Promise and Challenges of Integrating Public Transportation in Bogotá, Colombia.”
127
Selected participants also mentioned economic constraints and access limitations to BRT or regular buses. For some, walking or taking informal modes comprised their only travel options due to cost as well as route coverage:
“I went to the doctor, at the clinic that is nearby [this shopping mall]. I came by foot…I didn’t have the money for the bus [to get to the mall] … [Conventional] buses that enter [my neighborhood] don’t pass by the clinic either. Nor do the Transmetro buses…going from my house to the doctor’s office I took a motocarro.” [Female, 30-39, non-user, low]
Private Mobility: Aspirations and Use Interviewees almost universally noted that motorization and traffic congestion has increased throughout the day over the previous five years, particularly affecting conventional private buses, automobiles and taxis:
“The number of vehicles in the city has grown so much in the past few years that getting around in car or bus is difficult [...] Before that, there was a free flow of cars and buses [...]” [Male, 60-69, occasional, low]
“The traffic [congestion] now is constant… Even if you go out at 8, 9, 10, or 11pm, the city is always congested [knotted – "enredada"].” [Male, 50-59, non-user, medium]
Nevertheless, auto ownership seemed to be a desired good by most interviewees. Many aspired to own a car one day, perceiving this mode as privileged:
“We only take public transportation. We’d say that [buying a car] is a project for the future. You have to build slowly [...] that’s the projection.” [Female, 50-59, regular, low]
Some motorists said that parking is difficult to find in several areas of the city, with the exception of shopping malls. Off-street parking is generally banned by the local authorities, yet law is apparently not always enforced. One respondent mentioned that because of the lack of parking spaces, he prefers to take Transmetro, regular buses or taxi:
“There are places where you can’t even think of going in car. Because there are lots of cars and you would never find a place to park. So sometimes it is better to go in Transmetro, or in a taxi [...] And other times, where I can, I go in bus, and if not, in my car.” [Male, 50-59, frequent, medium]
128
“Parking? If I'm going to a mall, there's no problem, but yes if I'm going downtown then parking is difficult…We used to be allowed to leave the car, parked like that, on the street. But nowadays we can't do that anymore because there are surveillance vehicles… They take good photos and will give you a fine [...]” [Male, 50-59, non-user, medium]
The main benefit that interviewees perceived in owning a vehicle was convenience, including the ability to carry heavy loads or many passengers comfortably:
“I don’t like it when ‘transporte colectivo’ [regular buses] carries all these kids, because lots of times these cars have very poor air conditioning for this climate, so the kids get really hot, the kids turn into a mess… In contrast, there [in a private car] they travel more comfortably.” [Male, 50-59, frequent, medium]
The issue of safety was mentioned regarding private vehicles, as well. There is a sense that being in a private car late at night or early in the morning is safer than having to wait at a bus stop or station. One interviewee did not feel comfortable sending his children on a regular bus to and from school, so he paid his next-door neighbor to give them a ride.
“I'm thinking about buying a car [...]It is quite tiresome without one. It can also be unsafe early in the morning [when it's still dark] to be waiting for [public] transportation [buses].” [Male, 50-59, frequent, medium]
Interactions Between Private Transit, Paratransit, and the BRT As for taxis and taxi colectivos, they were used often by our interviewees but perceptions about these modes were mixed. For interviewees in carless households, taxis seemed to be valuable as a “second-best” option to a private automobile, especially given time constraints, convenience advantages (e.g., 24 hour and point-to-point service, advantageous when carrying goods), or if the destination was not well served by public transportation. Others value the fact that you can negotiate the fare with taxi drivers to obtain a discount rate, which can make it cost-competitive with public transit.
“Sometimes I take taxis, because, for instance, if I already have all my groceries or other items, it’s more complicated to return by bus.” [Female, 30-39, frequent, n.a.] “There are also taxi services in PC [Puerto Colombia], which is good because it's 24 hours-a-day, but it does cost a lot.” [Male, 50-59, frequent, medium]
129
“People used to take the bus more because the taxis were more expensive and now you can negotiate with them” [Female, 20-29, occasional, low] “[Thank] God I have always had enough to afford a taxi. But, whenever there isn’t enough for taxi, well I use the Transmetro and that’s it.” [Male, 40-49, rarely uses BRT, low]
Interestingly, one interviewee mentioned the proliferation of collective taxis is associated with the elimination of regular bus routes after BRT implementation:
“Now on these Transmetro routes where the buses were removed, collective taxis have begun to operate alongside Transmetro.” [Male, 30-39, rarely uses BRT, medium]
Finally, with regard to private motorcycles, mototaxis and motocarros, there is a shared sentiment that these modes, especially motorcycle-taxis, are faster and more convenient than public transportation. Mototaxis and motocarros are generally used, and thus valued among participants, for quick short trips, usually within the neighborhood to run errands:
“I, however, like the mototaxi because this zone is too hot sometimes to walk home. I also use them to run errands and, sometimes, even to grab my lunch for me, you know, when they are people I know. The fare is about 2 thousand [Colombian pesos] and it takes longer for you to take the money out of your pocket than what it takes them to run the errand.” [Male, 60-69, occasional, low] “[I use mototaxi] maybe to get to the supermarket, which is close by here. Or maybe if I need to go buy something that isn’t in my immediate area, if I needed to do something elsewhere in the neighborhood.” [Male, 20-29, frequent, medium]
One interviewee said she sometimes uses a mototaxi as a substitute for the Transmetro’s feeder bus, especially on days when the feeder service is running late. The interviewee noted that mototaxi drivers frequently wait at Transmetro feeder stops to provide this service.
“Well… because at times the feeder bus can be really delayed, so I take one [mototaxi] towards the main road.” [Female, 30-39, frequent, low]
Despite these benefits, many interviewees shared that they would never consider boarding a mototaxi due to the perceived traffic danger. Some participants had

130
already experienced an accident aboard a motorcycle. Others had heard stories about neighbors having bad experiences using mototaxi services, and, as a result, have refrained from using them, even for short trips:
"They [mototaxi drivers] are always trying to pass the other buses, and accidents happen all the time.” [Female participant, 30-39, frequent, low]
“[Taking mototaxis] is a danger, because the buses pass close to the side of the motorcycle, the other vehicle honks, taxis get in your way. Then, if your child is in front of you...a fall is fatal. Then, I prefer to take a motocarro so that if it crashes, the impact is received by the vehicle and not by my child.” [Female participant, 20-29, occasional - but frequent 2 years ago, low]
One interviewee said she used motocarros to take her kids to school and preferred motocarros for greater safety and affordability compared to two-wheelers:
“I took them [my children] to the school [in motocarro], because they start at 7:00 AM. And they charge me $1300, because we are three. Then I carry on my legs, and sit the other by my side, then they charge me $1,300 [...] On other motorcycles [two-wheelers], I can also take them but it is more dangerous [...] As a mother I would choose more [a motorcarro] than a normal motorcycle…for safety reasons, because I know that my children will not be falling down.” [Female, 20-29, occasional - but frequent 2 years ago, low]
Similarly, participants from higher income groups associate mototaxis with chaos, unsafe behavior, and crime; which is in line with the recent policy that bans their circulation on some areas of the city.
“Yeah, also motorcycle transportation is very unorganized, lots of people break the rules, people don’t respect right of way... so I’m not really attracted to them.” [Male, 40-49, non-user, medium] “Mototaxi services, and how they have been growing like a cancer. No one is really controlling it either.” [Male, 50-59, frequent, medium] “They [motorcyclist] have inundated the roads and through that, insecurity [due to robberies/illegal activity] has increased.” [Male, 50-59, non-user, medium]
131
"By God's grace the mayors have restricted motorcycle access in certain parts of the city and on certain roads, so that has increased safety a lot." [Male, 50-59, non-user, medium]
Barranquilla residents’ perceptions of Transmetro are mixed. Some interviewees stressed that Transmetro reduced their travel time, and it was more comfortable than the regular buses. However, other users lamented the removal of some of the previous conventional bus routes and the more direct service they offered. This is apparently due to the fact that while Transmetro provides travel time savings for those who can use trunk lines for a large share of their trip, many of those who must rely on feeder routes are disadvantaged by the need to transfer, and by the fact that road traffic has worsened since BRT implementation. Many interviewees suggested that conventional buses (and to a lesser extent collective taxis) compete more with Transmetro than they do with the smaller informal modes such as mototaxis and motocarros. Interviewees reported using motorcycle taxis and motocarros predominantly for short trips at the neighborhood level, and sometimes to or from BRT stations. This is interesting because the conventional buses, often in direct competition with Transmetro, operate for the most part legally and with licenses, while the largely complementary informal motorcycle taxis and motocarros operate illegally. Monetary travel costs were an important theme. For those more fortunate, the Transmetro fare structure provided cost savings. Other Transmetro users reported that the fares were unaffordable. Regarding issues of comfort, many interviewees brought up overcrowding on Transmetro during peak commute periods, which translates into longer waiting times at stations and undesirable on-board conditions. Likewise, several interviewees complained about a “lack of culture” among Transmetro users as a deterrent to ridership. Transmetro users seem to believe the service has less crime than other travel options. Interestingly, interviewees did not identify a reduction in collisions or lowered levels of pollution as benefits of BRT implementation. These benefits have been highlighted during planning and evaluation of Transmetro, as well as BRT lines elsewhere in the world. This observation suggests a divide in expectations about the purpose of Transmetro.
Chapter 11: Perspectives from Cape Town residents Qualitative interviews with travelers were conducted by a team of three led by Lisa Rayle in Cape Town after the intercept survey was conducted there. The purpose of these interviews was twofold: to understand why users chose the mode they did, and to understand how they related to the transport provider. These interviews targeted public transport users who traveled in MyCiTi service areas, with emphasis on those using minibus taxis and MyCiTi. Between September 19th and 23th, 2016, semi-structured interviews were completed with 54 individuals. Interviews were conducted with subjects while they were waiting in line for either taxis or MyCiTi buses, or while on-board the vehicle. Interestingly, most people were receptive to being interviewed while on route, and many had sufficient time to talk while waiting in line or while on the vehicle. As with the intercept survey, this approach made it easier to interview people taking longer trips or traveling busy routes at peak times, while there was less likely to intercept people taking shorter trips or using fewer common routes. The interviews conducted reflect this bias, although some individuals with shorter trips and less common routes were also intercepted. To overcome language, racial and cultural barriers two assistants were hired, a coloured Afrikaans-speaking woman, and a black Xhosa-speaking man. Only a few subjects we approached chose to use Afrikaans; most said they were comfortable with English. Many Xhosa-speaking individuals chose to proceed with the interview in their first language. Interviews were conducted during periods that mostly coincided with peak travel times: 6:30am to 9:30am for the morning peak, and 3:30pm to 6:00pm for the afternoon peak. Each of these periods is a half hour outside the main peak time (a half hour later in the morning and a half hour earlier in the afternoon). Most of the people interviewed were traveling in the peak commute direction, but some traveling in the opposite direction were also intercepted. Thus, while the majority of interview respondents were "typical" peak commuters, a minority were not. Most were traveling for work or school; a few were not.
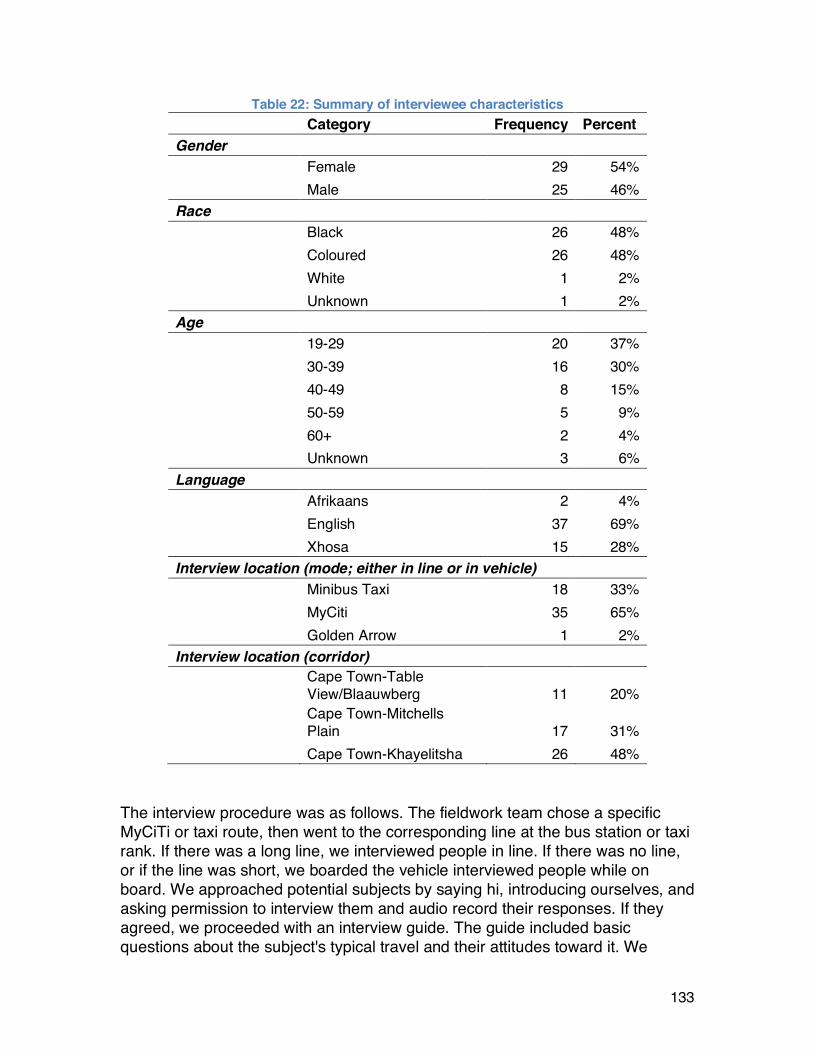
133
Table 22: Summary of interviewee characteristics Category Frequency Percent Gender Female 29 54%
Male 25 46% Race Black 26 48%
Coloured 26 48%
White 1 2%
Unknown 1 2% Age 19-29 20 37%
30-39 16 30%
40-49 8 15%
50-59 5 9%
60+ 2 4% Unknown 3 6%
Language Afrikaans 2 4%
English 37 69%
Xhosa 15 28% Interview location (mode; either in line or in vehicle) Minibus Taxi 18 33%
MyCiti 35 65%
Golden Arrow 1 2% Interview location (corridor)
Cape Town-Table View/Blaauwberg 11 20%
Cape Town-Mitchells Plain 17 31%
Cape Town-Khayelitsha 26 48% The interview procedure was as follows. The fieldwork team chose a specific MyCiTi or taxi route, then went to the corresponding line at the bus station or taxi rank. If there was a long line, we interviewed people in line. If there was no line, or if the line was short, we boarded the vehicle interviewed people while on board. We approached potential subjects by saying hi, introducing ourselves, and asking permission to interview them and audio record their responses. If they agreed, we proceeded with an interview guide. The guide included basic questions about the subject's typical travel and their attitudes toward it. We
134
adapted questions based on the situation and their responses. Interviews lasted from 5 to 25 minutes, depending on the respondents' receptiveness to continued questions and on the time available. Sometimes interviews had to end when the subject reached his or her stop or moved ahead to board the vehicle. Where an interviewee’s age is not provided, it is usually because the interview had to end abruptly (I asked their age at the end). At the end of the interview, I offered the subject a granola bar as a thank you. The aim was to represent a broad spectrum of users. As much as possible, we tried to alternate between interviewing men and women, and younger and older individuals. Where appropriate, we simply interviewed the last person in line, or simply the person sitting next to us on the taxi or bus. As with the survey, interviewees were required to be at least 20 years of age. (Although we made one exception for a 19-year-old.) Interviews were conducted during a typical week, with mild weather and during a non-holiday period. However, it turned out to be slightly atypical in that from Tuesday afternoon through Friday, Metrorail canceled all trains on its Central Line, which serves Mitchell's Plain, Khayelitsha, and much of the eastern part of the city. The trains were canceled due to infrastructure damage from violent demonstrations in the township of Langa that were unrelated to train service. (The protests were about housing conditions in that township.) As a result of the service disruption, the volume of passengers on taxis and MyCiTi buses was higher than usual and lines much longer. This made it easier to interview people waiting in line, and several travelers who normally used trains but were forced to use alternative modes this week. At the same time, people who normally do not use the train were interviewed. One might argue the responses received were less "representative" of typical travel. However, interviewees made it clear canceled train service was in fact not that unusual, and although this disruption affected an unusually large number of trains, frequent delays and cancellations were typical of Metrorail service. The interviews were audio recorded and later transcribed. Then the transcripts were coded the transcripts for themes relating to reasons for choosing one mode over another and to users’ perceptions of transport modes and their relationships with them. Next, responses were grouped by code and looked for common themes. Note that the quotations included in the following section cite the interviewee’s gender, age, race, and the location of the interview.
135
Findings Generally positive perceptions of MyCiTi as a replacement for taxis Initially I was most interested in comparing MyCiTi to taxis, but I quickly realized those who used MyCiTi had switched from all other modes, not just taxi but also from Golden Arrow, train, and car – a point also illustrated in Chapter X. That point in itself is notable, since according to some city officials, it was previously unthinkable for public transit to attract both people from cars and people from train. In the Phase 1 area, where taxis were replaced with MyCiTi, I expected to find mixed perceptions of MyCiTi among those who would otherwise use taxis. For some it would be an improvement over taxis and for others it would be less convenient, but they would be forced to switch anyway. On the whole, though, users expressed positive perceptions of MyCiTi, particularly in terms of speed and comfort.
We’re only taking the buses now because the taxis stopped for the buses to drive. So that’s why we’re travelling with the MyCiti bus…. The bus stop is just up the road from my house so it’s quick-quick. It’s like a minute or two tops to get to the bus stop. [Male, 25, Black, MyCiTi queue]
A university student said he felt his commute with MyCiTi was better than before with taxi:
[Using a taxi] was quite stressful as well because there’s no schedule that you have to follow…. The taxi driver is always rude. [Male, 25, Coloured, on MyCiTi bus]
For some though, the removal of taxis meant longer walks. One man, who commuted from Steenberg (outside the MyCiTi area) to Montague Gardens (in the Phase 1 area) by a combination of train and taxi said he had to walk an extra ten minutes at the Montague Gardens end after taxis were removed.
Actually I have to walk there where the taxi picked me up now [near Montague Gardens], I have to walk from Montague Drive so we’re quite far down there so I have to walk up to that garage, and otherwise I don’t get a taxi there in the Main Road. I don’t know for some reason they don’t come down there anymore. [Male, 40-49, Coloured, in taxi]

136
Perhaps because he lived far from the MyCiTi area, he was only vaguely informed about the reasons taxis were removed. A lot of users also felt MyCiTi was an improvement on Golden Arrow. A woman who had switched from Golden Arrow to MyCiTi for her commute from Table View to Civic Centre told me:
This [MyCiti] is very comfortable. And what works for me is that I host foreign students so it’s peace of mind for me. I teach them to use MyCiti and they can get on everywhere. It’s the best thing they could have done for South Africa. [Female, 47, Coloured, MyCiTi bus] What I like about MyCiti (is) you sit comfortable. Everything is comfortable… The (MyCiti) bus drops me in front of my workplace. If I use Golden Arrow I have to walk; 22 minutes, 25 minutes’ walk. [Male, 29, Coloured, MyCiTi bus]
Users shed light on determinants of travel time surprisingly, most users named some aspect of travel time as a top priority in their travel choices, regardless of which mode they chose. Their explanations, though, reveal a more complicated set of factors than conveyed by travel time alone. Many respondents said they preferred taxis because they could reach their destination faster than by other modes, but recognized taxis’ speed was a result of unsafe driving. Indeed, many respondents associated taxis with being unsafe, regardless of whether they used taxis regularly. They said drivers drove recklessly, and explained drivers were just trying to maximize fares.
I take a bus but if I run late I take a taxi…. The main thing is because they drive faster than the bus…. The way the taxis drive; sometimes they drive very recklessly. [Female, 20-29, Coloured, taxi queue] Yes [I worry about accidents] because during the peak they want to drive to get money and they drive as they want to, so for me a taxi is a bit dangerous but sometimes I have to take a taxi; I don’t have a choice. [Male, 45, Coloured, MyCiTi queue]
Now and then I like taking taxi because it’s faster and quicker, but it’s just a bit dangerous…. The taxi drivers don’t care how they drive, which way they go around. [Male, 39, Coloured, taxi queue]
137
You want to get to work fast but not die on the way to work. [Female, 20-29, Coloured, taxi queue]
Several interviewees chose MyCiTi over taxis because they perceived taxis as dangerous.
It’s safer to travel with the buses than with taxis. Taxis will drive over you and don’t care for your safety, whereas buses will first wait for each car to drive past and then leave the stop. Taxis just want to get home and make their target. [Male, 25, Black, MyCiTi bus]
At least one interviewee felt taxis were unsafe because the vehicles were “unroadworthy.” All other modes were seen as relatively safe, at least from an accident perspective. Still, for some residents MyCiTi was faster than taxi, especially in Khayelitsha, likely because of the express route with few stops.
The reason I’m using MyCiti is because the taxi makes me late. I am no longer late ever since I use MyCiti so I’m always early at work. [Female, 20-29, Black, MyCiTi queue] MyCiti’s much faster than a taxi. [Female, (age not available), Black, MyCiTi queue]
Those in the MyCiTi Phase 1 area often compared MyCiTi to driving their own car, rather than to taxis, and said they chose MyCiTi because it was faster, as it allowed them to avoid heavy traffic. Of course, I interviewed only those who chose MyCiTi, not those who chose to drive, so driving is still probably faster for many residents.
I used to travel by car but now I use public transport because it’s much quicker …. A journey by car would take me approximately an hour to an hour and 15 minutes and the bus takes me somewhere between 35 to 45 minutes. [Female, 31, White, on MyCiTi bus]
For the same reason, many users said MyCiTi was faster than other public transport modes, especially Golden Arrow, which users agreed was very slow because of the many stops it made.
138
I don’t want to use Golden Arrow because there are many stops. I want to go straight to Town. [Female, (age not available), Black, taxi queue] Taxis are faster than the [Golden Arrow] bus. Every bus stop, they stop. [Male, 40-49, Coloured, in taxi]
As discussed in the chapter on survey findings, I was surprised to find very large reductions in travel times, even among respondents who did not move. These findings are corroborated by some interviewees, who described how switching to MyCiTi resulted in dramatic travel time savings.
Normally when I took Golden Arrow I used to take about two hours from Khayelitsha to here in Town because it passes Langa and all those places but MyCiti… it’s only about 30 minutes or so. [Male, 27, Black, MyCiTi queue]
Opinions and wait times for MyCiTi varied. Some MyCiTi users complained about long lines at MyCiTi stations, which increased travel time. However, for most MyCiTi users the lines were not that long, except when something unusual happened; for example, if buses were canceled or there were more users because trains were not working. Long lines formed during peak periods even when buses ran with high frequencies, simply because demand exceeded capacity, especially on the N2 Express routes. Users who waited in these lines liked MyCiTi, but their chief complaint was that there were not enough vehicles to meet high demands, resulting in long waits. A user on the MyCiTi Mitchell’s Plain route said:
User: Sometimes I have to wait up to half an hour to get into a bus. Interviewer: Is the morning like this too? User: Exactly the same in the morning. That has been my biggest challenge. I wait up to half an hour to get a seat on the bus. [Male, 51, Coloured, on MyCiTi bus]
And on the Khayelitsha route:
At the moment I’m happy [with MyCiTi] but the only problem is the line. You always wait for a long time. [Female, 30-39, Black, MyCiTi queue]
139
Specifically, several interviewees complained that a particular and to express route, the D01, which runs between the city center and the east side of Khayelitsha, received a lot of buses at high frequency, whereas other N2 Express routes like the D02, which serves the west side of Khayelitsha, did not. These respondents expressed a sense of unfairness, and blamed the city for not allocating bus resources in an equitable manner.
The one thing for the last month or so that they can improve though is get us more buses on this route – compared to that side (pointing to Khayelitsha). They have more buses than us and I’ve seen a more than 50% increase in the commuters on the Mitchell’s Plain line over the last two years. [Male, 51, Coloured, on MyCiTi bus]
MyCiti has a lot of problems. They don’t know how to control especially this queue. They only care about D01…. What’s happening to this D01 is sometimes they can give four buses while we are in the queue. The one who’s operating there knows that we have been standing there waiting for a bus for long. If D01 comes, they can take D01… and the next bus they can change it to be D02 instead. They don’t do that. They allow it. [Male, 38, Black, MyCiTi queue]
In this comment, the interviewee is expressing frustration with the rigid schedules. He understands that he would have a shorter wait if MyCiTi operated like taxis, where if there is a higher demand in another route (still within the taxi's operating license), rank marshalls will direct some vehicles to move to that route. Many users chose modes so as to reduce risk of crime The interviews suggest users’ decisions are very sensitive to walk time, regardless of mode, in large part because of security concerns. Most respondents reported walking between five and 10 minutes to access public transport. Many respondents said they chose their particular mode because it was a very short walk from their home or work. It seemed that a large reason for preferring a short walk time was that people felt unsafe walking longer distances. No mode was immune from this concern. Respondents felt less safe early in the morning and at night after dark, although they acknowledged crimes could happen at any time. For example, when in town, where it's relatively safe, people seemed to be willing to walk further even 15 or 20 minutes.
I walk from work but if I still have time in the mornings, I walk to Adderley Street, or take the small [MyCiTi] bus. I prefer to walk. [Male, 20-29, Black, MyCiTi queue]
140
User: From Town, I take the taxi sometimes to Granger Bay and sometimes I walk; 30 minutes to walk. Interviewer: [asks to clarify] User: Yes, I walk from Town to Granger Bay, depending on if I’m early. Granger Bay is in the Waterfront. [Female, 30-39, Black, in taxi queue]
In comparison, in less safe areas, users often felt unsafe walking even 10 minutes. For this reason – i.e., because the fear of crime – many respondents seemed to choose their travel mode so as to minimize their walking time. Those who walked further said they did so even though it was unsafe because they could not afford to take a taxi instead.
I’m very fortunate in where I live. I walk past the police station so it leaves me with a sense of security. I don’t ever feel unsafe. And, I’m very fortunate in the CBD that my office is directly opposite the [MyCiti] station so I don’t have to walk far. [Female, 31, White, MyCiTi bus] Like I took the 5:10 AM bus. You know obviously Mitchell’s Plain is terrible; the Tik [crystal methamphetamine] monsters walk around so it’s always behind the houses. You can’t look around you. You have to stand by the bus. [Female, (age not provided), Coloured, on MyCiTi bus]
User: [The train is] convenient for me because I stay opposite the station. If I have to take the bus then I have to walk a distance and they’re shooting in Bonteheuwel, so if I take the bus, I have to pass the gangsters. Interviewer: How long is the walk? User: The walk [to the bus stop] is about 10 minutes, but to the [train] station it’s three minutes because I stay opposite the station. It’s safer for me because I’m in the train, out of the train and in my house. I don’t need to walk through the gang. [Female, 39, Coloured, in taxi]
…if I start 9:00 I’m going to have to wake up 6:30 and then I’m going to have to walk over, so it is slightly a bit dangerous with some of the gangs and stuff like that in the areas. [Male, 31, Coloured, in taxi] Interviewer: Do you feel safe walking [to MyCiTi]?
141
User: It’s not safe at all but because I don’t have enough money I always walk in the morning; just like now I’m going to walk to my house. [Female, 30-39, Black, in MyCiTi queue]
Security was also a concern on vehicles. Several interviewees had stories about vehicles being robbed while they were on the vehicle. Golden Arrow buses, taxis, private cars, and even sometimes MyCiTi buses were at risk of being hijacked or held up by gangs. When it came to on vehicle crime, weekends were most problematic, when fewer people were in the vehicle and on the road. The train was seen as the most dangerous mode. Some respondents had stories about seeing passengers get stabbed and robbed while on the train. Many who still use the train despite the danger felt unsafe, but did so because it was still cheaper than other modes.
Interviewer: Have you ever witnessed a crime while taking a taxi? User: Not really. In the [Golden Arrow] buses [I have]. I was on my way to work and then they stopped the bus and then they robbed the people that were in the bus. L: Really, the whole Golden Arrow bus? The entire bus? U5: There weren’t a lot of people but they always do it when it’s quiet, just Sundays. That’s the time when not a lot of people go to work... [Male, 20-29, Coloured, on taxi] User: Taxi’s safe. No crime. Interviewer: Compared to the train? User: Train is not safe. There’s always somebody getting on at a station, doing something, stabbing someone, taking their bags. Interviewer: Have you seen that happen? User: Yes, many times over weekends. Interviewer: What do you do when that happens? User: What can you do? They just get in, stab somebody, grab it, and get out. Even phones; they just get in and take. One is keeping the doors open. [Male, 39, Coloured, taxi queue]
142
[The train is] cheaper but it’s full and dangerous. There are delays and it’s not safe because of the skollies [gangsters]. You get mugged in the train. You can’t escape. [Male, 20-29, Black, in MyCiTi queue]
User: The problem is in the section where I am, people get robbed. Interviewer: Even though it’s only a five minute walk? User: People get robbed in the [Golden Arrow] bus. Interviewer: Has that happened to you? User: No, but I witnessed someone get robbed.... They stopped the bus and took everybody’s belongings. [Female, (age not provided), Black, MyCiTi queue]
Most users felt safer on MyCiTi than in other transport modes. Still, one interviewee was worried about crime while on MyCiTi buses, but felt other options were even worse, especially since he was a Coloured man living in a mostly black area.
I feel safe in the [MyCiTi] bus. You can relax and you don’t have to worry about anything and it’s safe to sit on your phone. [Male, 28, Coloured, on MyCiTi bus] User: Just the two incidents where they robbed the [MyCiTi] buses in Khayelitsha once or twice. Interviewer: How did it happen? User: I wasn’t in the bus; I was in the next bus but we got the message while we were standing here – that they robbed the people in the bus…. At the moment I’ll just have to get into the MyCiti bus. As you know I’m a Coloured living in Khayelitsha so I don’t have any other options at the moment. MyCiti is safer for me at the moment. [Male, 58, Coloured, MyCiTi queue].
And even if MyCiTi vehicles are safer, the large spacing of stops was a problem for those worried about walking:
First there were a few stops in Mitchell’s Plain but they’ve made more stops now, especially for people who travel at night because it’s a bit dangerous. The stops are very far apart. They have put on more stops for the people to make it more convenient for the people. [Male, 45, Coloured, on MyCiTi bus]
143
Service design affected mode choice in predictable ways Users opinions about schedules and service frequency reflected trade-offs inherent in designing service operations. Many users compared MyCiTi – which has relatively few routes with high frequency peak service – with Golden Arrow – which has many different routes but with relatively low frequencies. Some users found Golden Arrow’s schedules useful in knowing when a bus would arrive, but most users felt burdened by the schedules, worrying that if they missed a bus they faced a long wait.
Golden Arrow was actually a good experience. It’s just the fact that you also need to wake up much, much earlier in order to get that specific transportation, and the express buses are the buses that drive no stop. In order for you to get an express bus is actually tough because you need to wake up at, at least 4:30AM to get done by 05:00AM, leave the [Mitchell's Plain] Town Centre by 05:30 and then get the bus at 06:00. It’s like a half an hour time frame that you already have so you schedule yourself in the evening already so you’re more exhausted when you come at home because now you need to prepare yourself for the next day so you rather shower in the evening. Yeah, you need to change your whole cycle. It’s quite hectic, it’s quite hectic. [Male, 31, Coloured, in taxi]
In comparison, users felt that MyCiTi was much more convenient than Golder Arrow, mainly because a BRT vehicle would come every five or 10 minutes, so missing a particular bus was no big deal.
For example, the Golden Arrow bus this morning was supposed to rock up at 6:45am. He arrived at 7am and that’s the only bus from where I live into Town so you’re going to be late if the [Golden Arrow] driver is late. Whereas if you take the MyCiti, there are frequent buses all the time. [Female, 25, Coloured, on MyCiTi bus]
However, those who had to commute in the off-peak and weekends were less happy with MyCiTi frequencies.
Like now when they change the [MyCiTi] times to an hour apart during certain hours, so now it’s an hour apart from there in Sea Point, and when you miss the bus then it’s another hour and when you get here then you maybe just missed the bus and it’s another hour you have to wait, especially in my hours. It’s
144
different because we work in retail so we are always going to work; whether it’s a public holiday, whether it’s a Sunday. [Female, 30-39, Coloured, in MyCiTi bus]
In the Phase 1 area where Golden Arrow service was removed, some missed the company’s specialized routes. Transport for Cape Town regulation director Abdul Bassier explained how Golden Arrow previously ran two or three buses specifically for his son’s school, but with the route’s removal, students now had to walk further to overcrowded MyCiTi buses, or, more frequently, pay for an Uber ride. Some interviewees chose taxi over Golden Arrow for the same reason, and felt that taxis were easier than other modes because of the lack of schedule.
I take the taxi because it’s much quicker, ‘cause I tend to miss the [Golden Arrow] bus all the time. [Female, 20-29, Coloured, in taxi]
Transfers were more of a burden for taxi users than MyCiTi users I expected to find the MyCiTi network, as a trunk-and-feeder network, to make it more difficult for users who had transferred, compared to taxi. Thus I was surprised to find interviewees generally did not think transfers on MyCiTi were a burden. A lot of users said they use MyCiTi because it allowed them to have direct service, especially the N2 Express bus. Respondents did not complain about having to transfer on MyCiTi.
[MyCiTi is] much easier because when I get off here [at Civic Centre] in the mornings, I just get into the other bus – into the Camps Bay one. [Female, 60-69, Coloured, in MyCiTi station] It’s easy because you just get onto the station and into another bus. It’s not a walking distance or having to get out of that particular station. [Female, 25, Coloured, in MyCiTi bus]
In fact, one interviewee didn’t even consider taking two MyCiTi buses as a transfer:
Interviewer: So why do you use MyCiti? User: For me it’s more convenient. Interviewer: How so? User: With taxis, I must take two taxis. With MyCiti, it’s just one.
145
Interviewer: But that is two [buses] because you have to take the bus from Salt River to here and then from here [to Mitchell’s Plain]. User: But it’s cheaper. Interviewer: How much would a taxi cost? User: From here to Mitchell’s Plain, it’s R15 and from Town Centre another taxi costs R7 so it’s R22. [Male, 45, Coloured, in MyCiTi bus]
They did however complain about having to transfer on taxis – not because of the travel time but because of the cost. Unlike MyCiTi, on taxis one has to pay for each leg of the trip.
Our fares [on MyCiTi] would be seven points which is R7, so I can come from my area and pay R7 from there until here and still travel further on for R7. So I can take any [MyCiTi] bus from here and still pay that same fee, so that’s nice about the buses. [Male, 25, Black, MyCiTi queue]
Even one man who commuted for 3.5 to 4 hours, each way, from Mitchell’s Plain to Bloubergstrand, said it was faster and cheaper now with MyCiTi than it was before with taxis. Even though he now had to take two different MyCiTi buses, the transfers were quick compared to taxis where he would have to wait for the vehicles to fill each time he transferred.
Interviewer: Why do you use MyCiti and not something else? User: It’s easy for me to get to work, direct, straight to my workplace, direct to my workplace. Interviewer: If MyCiti did not exist, how would you do that [get to work]? User: Probably use taxi but more expensive [and] take four taxis. [Male, 29, Coloured, on MyCiTi bus]
Thus given that users’ origins and destinations were within the MyCiTi service area, the transfers did not seem to negatively affect perceptions of travel. The trunk-and-feeder network might still be less optimal than a taxi network if its coverage area is less, and indeed I did talk to a few who said they would use MyCiTi if it only stopped near their house.
146
Affordability was a top concern, and responses to cost varied Besides travel time, the most important factor for respondents in choosing a travel mode was cost. Cost was mentioned more often than any other factor in the interviews – a total of 58 times, while the next most common factor, walk time, was mentioned 51 times. Many respondents referred to the exact fares of different modes available to them, suggesting they had done the calculations to compare different modes. They reported taking cost into account when choosing a mode, although it didn’t necessarily mean choosing the least expensive option. All agreed train was by far the cheapest. Most respondents thought that MyCiTi was relatively affordable, although some complained that fares seemed to be increasing. Still, MyCiTi was far more expensive than the train, as much as 10 times more. Taxis were generally cheaper than Golden Arrow and MyCiTi, except for users who had to transfer, because they had to pay a separate fare for each taxi. That said, users could more clearly state fares for taxi, train, and Golden Arrow than MyCiTi, probably because the last has a more complicated an opaque payment method.
Train is fine for me because it’s not that expensive. You can buy a monthly for R150 and that’s fine, that’s good. [Male, 40, Coloured, in taxi] Taxi was more expensive…. The only thing I like about it [MyCiTi] is affordability. [Male, 26, Black, MyCiTi queue] My monthly [train ticket] is R194…. If I take [taxi] three times the same route, it’s R180 for three days. [Male, 39, Coloured, taxi queue]
Interviewer: What made you change [from taxi to MyCiTi]? User: The problem is the taxis are too expensive. I was using R1000 per month; at least this side sometimes it’s R500 per month. [Female, 30-39, Black, MyCiTi queue] For me, MyCiti is about R700 [monthly] and train is R190. Golden Arrow is about R600…. Golden Arrow is better than MyCiti for me. [Female, 25, Black, taxi queue] I thought MyCiti was much more affordable compared to Golden Arrow when it started but now with this peak hour time and after hours. For instance, now R30 lasts only a day. It won’t last till tomorrow – so it’s getting expensive. [Male, 20-29, Black, MyCiTi queue]
147
User: Yes, that’s also another reason, because with MyCiti I think I’ll pay about R12.50 and a taxi is R16.50. Interviewer: So within the month, the [MyCiTi] is R600? User: I haven’t checked how much exactly because I just put in R100. Interviewer: How much was Golden Arrow? User: Golden Arrow was R132 per week; Monday to Friday. [Male, 27, Black, MyCiTi queue]
It was striking that many respondents had a car at home, but claimed to only use it on the weekends because it was too expensive to drive during the week. The cost came from paying for gas, as well as sometimes parking (although for many parking was free).
It costs about R600 a week to drive whereas this (MyCiti) costs R600 per month. [Male, 28, Coloured, on MyCiTi bus]
For some respondents, it was important to have a way to budget for transport expenses. That is, they liked to be able to buy one pass for the entire month, or load a certain amount of money on a card so that they would not run out of cash. When asked why she always took MyCiTi and sometimes not a taxi, a MyCiTi user responded:
Sometimes you budget, because this is the transport that you take, so I load one time for the whole month. Because you don't have always that extra money to take a taxi, especially on Sundays. [Female, 30-39, Coloured, MyCiTi bus] [The MyCiTi card] is better than the clip cards [weekly and monthly fare cards for Golden Arrow] because with the card system of MyCiti, if you have a spare R50 in the pocket, you can load it up on the MyCiti card. You can’t preload a Golden Arrow bus ticket. Take for example the Golden Arrow clip card; if you didn’t go to work for a week, then that card is a waste. With MyCiti I can use it the following month or the following week. [Male, 20-29, Black, MyCiTi queue]
MyCiTi is seen as reliable, but this status may be slipping After travel time and cost, reliability was the next most important factor for interviewees. Nearly all agreed the train was unreliable, and many refused to use the train for this reason. Some complained about major delays with Golden Arrow, which were a problem because the low frequencies meant users often relied on a single bus being on time. Many MyCiTi users described the service as reliable, using phrases like, “Always on time, reliable,” “it brings me on time here in Town”, “Arrives on time.”
148
Some also complained about delays with MyCiTi although those complaints were fewer. There was some suggestion that MyCiTi reliability was getting worse. For example some said that when MyCiTi first opened the buses were new and everything worked well. But now, buses break down more often.
It [MyCiTi] was okay at the beginning but now the buses are also a bit late. [Male, 20-29, Black, MyCiTi queue] The only things I don’t like sometimes are the delays…. Sometimes it can take over 15 minutes. [Male, 25, Coloured, on MyCiTi bus]
One interviewee who happened to be a former MyCiTi intern explained the delays on the Table View route were due to the type of buses, whereas the N2 Express Volvo buses were more reliable, at least so far.
Scania buses like to break down and it causes delays… you have to wait for a mechanic from the depot to come and fix that; and imagine it’s peak hour. The Volvo bus I haven’t experienced problems. [Male, 20-29, Black, MyCiTi queue]
One interviewee complained the MyCiTi doors would sometimes break down and cause delays.
I suppose the maintenance of the buses and the actual stations and the doors could be improved…. Often times the doors don’t open, there’s a problem with the doors. It’s on MyCiti’s part; they need to maintain it. [Female, 31, White, on MyCiTi bus]
Another less frequent complaint was that sometimes the fare machines were broken and would cause delays.
The only thing I don’t like about MyCiti is when you put points on your card, the machine is very, very slow. [Female, 47, Coloured, MyCiTi bus]
Worsening train service motivated many mode switches A constant theme throughout the interviews was the poor quality of train. There was unanimous agreement that the train was unreliable and getting worse. Perhaps this was because I happened to conduct some of the interviews on days when the train was canceled due to protests at one station, but interviewees described the problems as typical. Problems cited included delays, cancellations, crowding, and crime. People said the train was always late and some refused to use it because it was too unreliable.
149
As the years went by it got worse. Metro[rail] wasn’t so but like now... Even now like today also, they are striking and half of the staff is not at work so the trains are really bad now. [Female, 30 – 39, Coloured, MyCiTi bus] Normally when I went for [job] interviews taking the train, it caused me problems because of coming late, and most of the trains are delayed and people are overcrowded in the trains. [Male, 20 – 29, Coloured, taxi queue] I don’t like train because it’s very full sometimes…. It’s risky when it’s full so I prefer a taxi. [Female, 30 – 39, Black, taxi queue] Compared to [train], MyCiti is much better because trains are always crowded regardless of the time of day. [Male, 20-29, Black, MyCiTi queue]
Reasons for delays with the train included: equipment breakdowns, civic protests, worker strikes, and theft of cables (that the train needs to run). One respondent told us the train, Metrorail, is frequently called “Metrofail.” Another respondent said that he was using taxi on that particular day because the train was canceled and, with the recent declines in train service, he was going to look into permanently switching from train to another mode:
User: I’ll first look at the prices of either Golden Arrow or MyCiti and then decide between the two because I don’t want to continue with the train anymore. Interviewer: Why not? User: The train is unreliable. When I go to work I don’t know what time I’m going to get to work. [Male, 30 – 39, Black, in a taxi]
More than one interviewee started their commute very early – as early as 4 AM – not just because they had to work early, but because their commutes were so unreliable.
I take the first train out in the morning from Steenberg Station, that’s what 4:50 so I take that one…. That’s actually why I take that first train out because everything after that--normally there are delays after that. That’s why I tend to take that one, the

150
earliest one there is. There’s hardly ever a problem. [Male, 40, Coloured, in taxi]
As a result, he said he would usually arrive at work one hour early, and he would use that hour to “relax, coffee, whatever.” Still some respondents used the train because it was so much cheaper than other modes, and it was fast as long as there were no delays.
Interviewer: How often does this [train cancellations] happen to you? User: This is the first time it’s affecting us, with this protest. Other times it was just striking from the drivers. It happened once, a few months back. The others (instances) were just like trains that had broken down and must be fixed. That’s the only thing; and out of service. Other than that trains are okay; it’s convenient, cheaper. It’s convenient for me because I stay opposite the station. [Female, 39, Coloured, taxi queue] It’s just the fact that, because they fail you all the time, you tend not to want to travel train but you do have their reliable customers…. Look, I used to work in various areas, so where it is convenient, I would then take the train. [Male, 31, Colored, taxi queue]
MyCiTi and taxis each have advantages in off-peak hours I initially expected taxis would have an advantage over MyCiTi because they might be widely available for more hours in the day. Indeed, some interviewees said they liked that it was easy to get a taxi at any time during service hours, particularly in midday and weekends when MyCiTi frequencies were lower.
Interviewer: How easy is it to use a taxi to say, visit your family or go shopping? User: It’s easy; there are a lot of taxis during the day. [Male, 40-49, Coloured, in taxi]
Users said MyCiTi schedules were not well suited for people who worked in off-peak, especially on weekends. However, MyCiTi in fact runs longer hours compared to taxis, especially in more dangerous areas like Mitchell's Plain. Specifically, users said they used MyCiTi because it ran until 10 PM, whereas taxis stopped service at 7- 8 PM,
151
MyCiti you can go where you want to any time of the day and night. You don’t have to worry about for example taxis driving till 18H00 and having to get a taxi home by then. With MyCiti it’s convenient because they drive until 22H00. [Male, 45, Coloured, in MyCiTi bus]
Users perceived a negative relationship with taxis and a lack of relationship with MyCiTi Few interviewees had anything good to say about customer service from taxis. Most complained that drivers were rude, treated passengers with disrespect, and were sometimes dishonest.
Sometimes [taxi drivers] will smoke certain things in front of you and even in the taxi then you have to get in a taxi that smells horrible. Now you have to still take all that intoxications in—and the way they attire themselves as well. [Female, 20 – 29, Coloured, in taxi]
Interviewer: Anything you can think of that would make your commute easier? User: If they don’t overload the taxi and they are more respectful to the passengers. And they must know they are the drivers, they’ve got people’s lives in their hands so they must be responsible when they drive the vehicle. [Male, 40 – 49, Coloured, in taxi]
The way [taxi drivers] behave towards passenger and the way they drive should change for the better. They don’t treat people in a good manner when they talk to them. [Male, 40 – 49, Black, in taxi queue]
One interviewee said she once took the wrong taxi because the driver gave her incorrect information.
I was upset too much. I was angry at that driver…because he said he knew the place. [Female, 30 – 39, Black, in taxi queue]
Another woman said she did not like to take taxis, because taxi drivers "do not represent the community." [Female, 43, Coloured, MyCiTi queue]. A MyCiTi user said one time she was on a taxi and the driver figured out one passenger didn't pay their fare. The driver took the entire taxi to a "black area" and stopped the
152
vehicle to make the passenger pay. She felt very nervous and almost wanted to pay for that one person so everyone else could go. [Female, 50-59, Coloured, in MyCiTi bus]. Only one interviewee, who had moved to Cape Town from Zimbabwe one year ago, said taxi drivers were helpful. She explained, for example, if you have a new job you can ask the drivers to help find out how to get there. [Female, 30, Black, in taxi] Interviewees had both positive and negative things to say about the MyCiTi service, but the most often sentiment was the lack of a relationship. Of the things people did not like about MyCiTi, common complaints were the payment system and the faceless customer service. Although some liked how the MyCiTi card payment system allowed them to budget, many found the payment system to be inconvenient and confusing. One respondent said it was a problem that she could only load the cards at certain locations, and sometimes those locations did not work.
The other thing I don’t like is that you need to come to Town to load [the MyCiTi fare card]. If they could have more loading zones because sometimes you don’t have enough and you still have to spend money to get to the Adderley station that’s the nearest and then take another bus. If they can just get more loading zones so you can see how much points you have. [Female, 30 – 39, Coloured, in MyCiTi bus]
Others are confused by the point system, which with which the fare is different depending on the distance, the time of day, and the payment method. They did not like the only way to see how much value is on the card, was to use the special machines at MyCiTi kiosks. Some respondents had experienced arriving at the station to find that their card did not have any credit on it, or that their credit had apparently disappeared without explanation. They were also confused by the penalties. Relatedly, some respondents felt that it was very difficult to have their voice heard with MyCiTi. Some said that they had complained to the system or to the city, to no avail. They perceived that the complaints went nowhere, and they were powerless to do anything about things they were dissatisfied with.
The card system is not working right and nobody is doing anything about that. And then we spend a lot of money having to buy points each and every time and basically they just vanish
153
and there’s no explanation for that. They give us a story that we can sign in a form and that will help and they will come back to you. They never get back to you. [Male, 26, Black, in MyCiTi queue] I always phone the toll-free [customer service] number. They look into it. They always tell us that the more people phone-- They can’t change the buses for one person. [Female, 30 – 39, Coloured, in MyCiTi bus] They’ve been telling us to use the internet if anyone has a query; we must email. We’ve been doing that but there’s no response. Even if we tell them we are short of buses from D02 buses [a Khayelitsha route], they don’t care. They just say okay, we are going to look at this thing. They don’t do it at all. [Male, 38, Black, in MyCiTi queue] I think it was when I said about sending more buses on routes so it’s less crowded they told me to go to the offices and speak to the people there but I must go with the crowd, because if I go singly nothing happens; nothing will be solved. [Male, 25, Black, in MyCiTi queue]
Many did find that individual agents at stations were helpful, for example with giving directions, but if they had a complaint about a broader issue with the system, there was no way to make that complaint heard. Taxis and MyCiTi each fill specific niches A few interviews illustrated how taxi and MyCiTi each filled niches by meeting specific needs. MyCiTi was designed to accommodate a range of physical abilities, which multiple passengers in wheelchairs, as well as others making use of the extra space. One woman said she liked using MyCiTi because it was easy for her to bring her baby on the bus. I witnessed someone else bring a bicycle in a MyCiTi bus. A man in a wheelchair said that MyCiTi had improved transport for him quite a bit, because previously his only options were to use the Dial-a-Ride, which required scheduling a week in advance, or getting a ride with friends or family, who would charge him excessively for the gas used.
With the advent of the MyCiti buses in Mitchell’s Plain five years back it has improved things for people in wheelchairs, but it’s still a problem that only one wheelchair at a time can be accommodated on the MyCiti bus - then the other one is set a whole hour back. The other two [men in wheelchairs, with whom
154
he was waiting] had to wait one hour for the next bus. [Male, 54, Coloured, in MyCiTi bus]
Taxis were able to accommodate other specific needs by being flexible. One woman said that she likes to use the taxi to go shopping because she could pay the driver R4 extra to drop her and her groceries directly at her house. Public transport vs. private car I was struck by how many users said they had a car home, but did not drive, whether because of the cost or the level of traffic congestion. Instead, interviewees used taxi or MyCiTi or even train.
I’ve driven before and it’s not fun. You sit in traffic for over an hour, an hour and a half actually and it costs about R600 a week to drive whereas this [MyCiti] costs R600 per month. [Male, 28, Coloured, on MyCiTi bus] Interviewer: So why don’t you use your car? User: Because of traffic – I’ll have to leave at 05:00 [to reach work at 8:30]. MyCiti is very convenient because sometimes when there’s no traffic on the road, it’s always on time. [Female, 20-29, Black, MyCiTi queue]
Interviewer: How do you normally go out shopping or visit friends? User: With the car. Interviewer: Is there a reason you didn’t drive here today? User: For the peak. I start past 7:00 and finish now, so coming to Town, it’s peak and going home, it’s peak. I don’t do it [drive] in the peak. [Female, 30, Coloured, taxi queue]
For some, the cost of parking was prohibitive; for example, one user said he would have to pay R75 per day; another said R1300 a month. Even if it wasn’t necessarily about travel time, some users said they preferred their time on the bus to sitting in traffic.
Interviewer: Why don’t you drive? User: [MyCiTi is] more convenient. I don’t like sitting in traffic and it’s a nightmare to sit in traffic from Town from Mitchell’s Plain Interviewer: Even with this wait wouldn’t it be faster to drive?
155
User: The reason I travel on this bus is so I can read my emails and whatsapp messages. Leave the headaches to the driver. [Male, 51, Coloured, on MyCiTi bus] Well, it was more stressful [before MyCiTi] because of traffic and looking for parking also. [With] MyCiti, no parking—you can get out of the bus; you don’t have to worry about parking and traffic. [Male, 39, Coloured, in MyCiTi bus]
One woman who was using a taxi for the first time felt she didn’t need a car anymore:
Interviewer: In all the years that you’re staying in Mitchell’s Plain, you’ve always used your car? User: Yes, but when I turned 60 I sold the car because I’m old now. What do I want to do with a car? The children have cars. [Female, 64, Coloured, in taxi queue]
Interviews touched on a few other themes as well. Respondents associated MyCiTi with comfort, except when it was crowded, and people had to stand. Taxis were also uncomfortable when they were overloaded. No one associated the train with comfort – trains were always seen as too crowded. In general, respondents found out about new transport modes through friends, family, coworkers, and neighbors. If they had questions while traveling, they asked employees or drivers. Some respondents I spoke to didn't know about MyCiTi, or how to use it. Discussion MyCiTi was designed as a one-size-fits-all alternative to the city's other transport modes from private car to the train. Deservedly, it faced a lot of skepticism about whether it could actually fulfill such a wide range of needs. These interviews demonstrate that in many cases MyCiTi was sufficiently attractive compared to other modes for at least many of these interviewees to make the switch. Of course, many continue to use the other modes. These interviews revealed that the reasons for switching or not switching are complex and specific to people's individual circumstances. Still some common themes emerged. Nearly everyone is very concerned with security and risk of crime. This concern does not necessarily privilege any one mode over another – but often leads people to choose the mode closest to their origin and destination. Still, at least when it came to crime in the vehicle, MyCiTi was seen as relatively safe. Overall travel
156
time and costs were of course still very important, but balanced with other factors. I initially expected transfers on MyCiTi to be a problem, but in fact they were rarely a burden for interviewees, were because they were free of cost and relative easy. There was expected to hear more complaints regarding the removal of taxis. However, most expressed neutral to positive opinions about the change. Perhaps this is because so many people harbored negative feelings toward taxis to start with, and they felt no sentimentality about their replacement. While plenty of people found taxis convenient and suited to their travel needs, they viewed the drivers’ interests as at odds with those of passengers – and those of the community. Many interviewees felt MyCiTi authorities worked on their side either – but it was not because of an actively antagonistic relationship, but because of the perceived lack of interest on the part of the authorities.
SECTION IV: Conclusions In this final section we synthesize findings from both the institutionally-oriented case studies and the resident-oriented data collection and analysis. We conclude by offering policy and planning recommendations consistent with our findings—aimed towards equity and sustainability goals in managing urban growth using hybrid BRT-paratransit transport systems.
158
Chapter 12 Summary of Findings A new BRT system can be expected to significantly alter household mode choices when introduced to a city that formerly did not have significant publicly-operated high-quality transit. Planners strive to structure BRT trunk-and-feeder services so that they indeed provide superior quality transport along corridors that are congested; so that they reduce choke points where private transit vehicles compete for passengers; and so that accidents are reduced by reducing chaotic interactions among drivers of numerous vehicles. BRT planners also typically restructure existing private transit services, at least to the extent that they are institutionally capable of doing so, and to the extent that transit agencies and police are effective in enforcing the regulations. Due both to an increase in the speed of transit service along trunk corridors, and to the removal of private services that formerly served those corridors, BRT can often experience healthy ridership gains. A number of studies have explored how and whether BRT systems can be more or less successful in this effort, as measured primarily by ridership and other trunk level operational measures. A number of other, related studies have argued that high-ridership BRT also reduces pollution, GHG emissions, and accidents, and BRT does seem likely to do so at least when impacts are measured along and near trunk and feeder corridors. A separate set of questions, and the focus of this report, has to do with which metropolitan area residents benefit when BRT is introduced and existing private transit is restructured. BRT planners hope that the introduction of BRT into a transit market formerly dominated by private operators, whether tightly or loosely regulated, will broadly improve travel conditions for residents, but particularly the less affluent; will provide travel times that are lower than, or at least competitive with, private transit vehicles and informal paratransit; and will in the long run lead to greater environmental and economic sustainability by reducing the move to automobility, thereby reducing congestion and pollution. Evaluating these important claims requires two main kinds of analysis. The first is to understand the institutional issues involved with implementing BRT and the challenges faced in providing a system that, in addition to achieving healthy ridership and decreasing congestion, pollution, and accidents on targeted corridors, also broadly improves accessibility that will lead to the hoped-for outcomes. The second kind of analysis is to specifically understand, quantitatively and qualitatively, how the travel patterns of metropolitan area residents change when a BRT system is introduced, and private transit services are restructured. These effects will likely depend on where residents live, work, and travel; their socioeconomic status; and their previous habitual mode choices.

159
Case study findings Using a case study approach, with interviews and using publicly available data and documents, we studied the implementation of BRT in Barranquilla, Colombia; Quito, Ecuador; Cape Town, South Africa; Dar es Salaam, Tanzania; and Jakarta, Indonesia. These five cities presented a range of economic and institutional settings with some commonalities and differences. In all cases, the BRT infrastructure itself was of relatively high quality according to conventional measures, including off-board fare payment, substantial portions of separated right-of-way (at least in design if not in enforcement), and vehicles that enabled rapid boarding. And, in all cases, the management of existing private transit has been a critical part of BRT system deployment. Across our cases there was a consensus among planning agencies, interviews and other sources that traditional private buses, minibuses and paratransit vehicles contributed greatly to traffic congestion, air pollution, and traffic accidents and that BRT was seen as a partial solution to those problems. There was also some acknowledgment from our interviewees, mainly at governmental agencies and among BRT operators, that residents using private transit services do value a number of its features despite the problems that private transit services cause. These positive features vary from place to place but tend to include more fare flexibility and (sometimes) better affordability; route directness; (sometimes) shorter headways; and higher spatial density of coverage than BRT. Our sources expressed an additional and separate concern, but one that could not be so directly addressed with regulatory policies, about how and whether a new BRT system would compete with private automobiles and motorcycles, and particularly among more affluent residents of the metropolitan area. P erhaps the most striking difference among the case study areas was variance in the types of public and private transit services that were provided prior to BRT being introduced. The metropolitan areas of Barranquilla and Quito had a particularly high share of moderately-regulated buses in the 50-seat and 24-seat size range before BRT started to make its mark. These traditional private bus companies were seen to lead to problematic outcomes such as high road congestion, unsafe conditions for motorists, pedestrians and passengers, and over-competition. Interestingly, though the story in Cape Town and Dar es Salaam is quite different—there, private transit has been dominated by 14 to 16-seat vans and even smaller vehicles, operating with more flexibility and more point-to-point service— yet in those places the very same public issues have arisen. And in Jakarta as well the same issues are seen, though in this much larger city, almost every type of public and private transit is available, including private transit and paratransit vehicles ranging from large buses to very small two-wheeler motorcycle taxis.
160
Across our cases, both regulated/formal and unregulated/informal private transit tended to follow a driver payment system based on either the number of passengers or a daily set-fee lease with fares exceeding that amount accruing to the driver. This system is seen to lead to over-competition, congestion, and accidents, and BRT is seen partly as a solution to these problems by offering centralized payment systems, driver training, and time-based rather than ridership-based driver compensation. Interestingly, only Quito and Barranquilla are working to directly regulate the payment system of licensed but loosely regulated private bus operators by requiring a different type of payment system as part of an integrated transit system plan. What the case studies also make clear is that private transit-BRT integration requires that the incumbents – notably drivers, but also vehicle owners, association, and users – perceive that they are not worse off financially as a result of the change and see a possibility of being better off. Many drivers work hard and long hours to eke out an existence, hoping for enough to earnings and savings to send remittances to family members and maybe one-day buy their own vehicles. Many vehicle owners depend on private transit earners as a way to achieve a middle-class lifestyle. And most many customers are transit-dependent, having few alternatives to buses and minibuses for moving around the city. For all of these groups, money matters. Cases like Dar es Salaam and Jakarta underscore the importance of government entities and sponsors putting in place safeguards and guarantees that protect the financial standing of incumbents if much headway is to be made in successfully integrating private paratransit and public BRT. Public agencies in the rapidly growing metropolitan areas constituting our five case studies have found it difficult or impossible to expand road infrastructure and public transport services in step with rising motorization and population growth. Under such constraints it is not surprising that traffic congestion and environmental problems would worsen over time and that BRT would be a hoped-for panacea because of its expected low cost and high efficiency. Municipalities typically operate at a disadvantage when negotiating with private transit operators either for concessions or for buyoff approaches to paratransit reform. The problem is particularly acute in places like Dar es Salaam and Barranquilla, with relatively restricted public resources due to low income as well as their second-tier status within their respective countries. As with any major policy reform, among the major challenges of integrating private transit and informal paratransit services with BRT are:
• Spreading risks and rewards in such a way that major stakeholders and incumbents – drivers, vehicle owners, transit-dependent users, governments, and BRT project sponsors – are collectively supportive.
161
Based on case experiences, this often means those with the ‘deepest pockets’ – governments, foreign-lenders, international aid agencies, and the like – absorb some of the near-term risks and incur some of the immediate costs (e.g., income guarantees to and vocational re-training of informal operators; fare subsidies to users; mini-loans for private vehicle upgrades) in return for longer term, hoped-for benefits, notably congestion relief and better urban environments, both of which are critical to regional income growth and economic well-being. Moreover, integrating informal paratransit services with the formal mass transit network requires cities engage in an expensive and politically complex formalization process that cannot be underestimated.
• Building the institutional and governing capacity to manage, regulate, and oversee the operations of private service-providers to ensure a well-run and efficient integrated service takes form. In addition to vocational training and fair compensation to ensure the presence of a competent civil-servant talent pool, it is essential that open, transparent, and accountable rules, procedures, and regulations are in place for tendering contracts, enforcing operating standards, and all purchases and procurements.
• Conceptualizing, configuring, and implementing the integrated service. As
discussed in the opening chapter, multiple arrangements exist for integrating BRT and private bus and paratransit services and fares. One fundamental distinction is whether to rely on a trunk-feeder arrangement, as found in most Latin American cities, wherein BRT operates as a mainline, closed system and private buses, minibuses, and micro-transit feed into BRT stations. Besides issues of interface designs and schedule coordination, a decision must be reached on whether riders can transfer from a feeder to a BRT vehicle free-of-charge or at a substantial discount. In contrast is the configuration of an open system wherein private bus and minibus operators share running-ways with mainline BRT, sometimes in a direct-line configuration, as found with many Chinese BRT systems and being tested in Jakarta and Barranquilla. Many factors can weigh in on whether to implement one system or the other, such as urban form and settlement patterns that shape the geography of travel and physical design considerations (e.g., whether there is sufficient land to design private bus and minibus staging and interchange areas). Unfortunately, there is a dearth of empirical research and ex-post evaluations that offer guidance on what conditions favor one approach versus another. As a result, historical practices and the views of management might decide how to configure and design integrated services, even if the results are far from optimal.
162
Many cities of the Global South that have built or are building BRT are sprawled, marked by poorly planned land development and squatter settlements on the periphery and beyond. This has given rise to dispersed and fairly complex geographic patterns of travel. The mismatch between the geography of travel and the geometry of often-radial BRT networks means that BRT trunk-lines usually serve a small share of regional trips, particularly among those living in outlying peripheral low-income settlements. Furthermore, few BRT systems are being designed to reshape regional growth, such as by leveraging compact, mixed-use transit-oriented development (TOD) in and around stations.277 As a result, now and in the foreseeable future, the dispersed, lateral nature of trips of many BRT users will likely continue to rely on some form of private bus, minibus, and micro-vehicle feeder – to bridge the ‘first-mile, last-mile’ gap. Thus, the travel market will likely continue to call for new and improved private paratransit-BRT integration. Whether the public sector is leading or lagging in this regardless will significantly determine the success, of lack thereof, of BRT-paratransit integration for years to come. Many knowledge gaps remain about BRT and private transit integration, making it difficult to shape policy and set standards. This is partly due to the historically informal nature of private transit and paratransit operations throughout the Global South, making data collection difficult, in terms of both quantity and quality. Moreover, the rapid pace of BRT implementation coupled with the many phased transformations systems often undergo complicate efforts to evaluate impacts. For these and other reasons, it is essential that more resources be devoted conducting tightly designed ex-post evaluations of BRT systems and the private bus and paratransit services tied to them. Building a knowledge base on the distribution of costs and benefits of different approaches to service and tariff integration, tendering contracts, and public-sector service management and planning – ideally across a range of contexts and settings – should inform and improve policy decisions and real-world practices. This is especially so for areas like sub-Saharan Africa, which is expected to urbanize and motorize more rapidly than anywhere over the next few decades yet which continue to suffer from shortages of data, reliable policy assessments, and governing capacity to ensure cost-effective BRT investment decisions. Findings from survey data in Barranquilla and Cape Town Quantitative analyses of our intercept survey data in Barranquilla and Cape Town suggest that the impact of BRT on travel times mostly depend on the context in which the system was implemented. Survey data in both metropolitan areas showed that the travel time savings associated with (trunk-feeder) BRT were somewhat limited, typically to those with very good trunk access. Respondents
277 Cervero and Dai, “BRT TOD.”
163
who moved home or work increased their commute time in both cities, suggesting that the BRT is not the main motivation for relocation – or that their expectations of travel time reductions were not met by the BRT. A notable trend in Barranquilla was the large reduction in commute and non-work-related travel time among those who switched from bus/minibus to motorcycle – those who shifted to the BRT were also mostly bus/minibus users. In Cape Town, commute time savings was reported primarily from users that switched from slower public transportation modes to BRT and private transit. The travel time savings provided by new BRT were not greater than that realized by residents who switched to minibus taxis in Cape Town and were even smaller in comparison to the travel time savings for those who switched in Barranquilla from private transit to motorcycles over the study period. We separately analyzed data from survey respondents who did not move the location of home or work over the five-year period of interest to eliminate the indirect effects induced by relocation. In Barranquilla, only 8% of non-movers reported that their commute involved a transfer in 2010, this figure rose to 30% in 2015. Likewise, 18% of Cape Town respondents reported having to transfer in 2010, as compared to 27% in 2015. In both cities, the increase in transfers is mostly attributed to BRT implementation. Among non-movers, those living close to the BRT trunk corridors experienced higher average travel time savings than the remaining respondents in this group. In Barranquilla metro area, only BRT users who did not have to transfer either among BRT trunk or from feeder to trunk services had statistically significant mean travel time reductions compared to pre-BRT conditions. Meanwhile, in Cape Town, both groups of those using BRT—users of feeder services, as well as those who only used the trunk lines and did not have to transfer—experienced a reduction in travel time but this reduction was not as large as those who switched from slow and unreliable transit to faster minibus taxis. BRT did not offer time savings over minibus taxis; those that switched from minibus-taxi to BRT reported increase in travel time. Looking more closely at socioeconomic differences we found that neither in Barranquilla nor in Cape Town did the implementation of BRT make existing inequalities worse. In Cape Town, the evidence suggests that BRT reduced the average commute duration and non-work trip duration of Black residents more than for other groups. In Barranquilla, we found no evidence of commute time reduction of either low-strata or non-low-strata BRT users. However, because those BRT users who live in the peripheries are mostly low-income residents and more likely to transfer, it is likely that BRT did not in improve travel outcomes for the very poor.
164
In both cities, a substantial fraction of respondents switched to non-BRT alternatives to achieve travel time savings. A notable trend in Barranquilla was the large reduction in commute and non-work-related travel time among those who switched from bus to motorcycle. Those who shifted to the BRT were formerly mostly users of private buses. In Cape Town, commute time savings were reported primarily from users that switched from slower public transportation modes (train and Golden Arrow bus) to either BRT or minibus taxis. Although those who started using BRT experienced a time savings on average, those who switched to private minibuses had an even larger time savings. There are several potential explanations for the trend toward switching to either motorcycles or private transit in the two cities at the same time BRT was implemented. In Barranquilla, some users may have switched to motorcycles because previously existing direct buses were replaced by BRT requiring one or more transfers, and some part of the trend is certainly due to a larger push toward motorization as a result of an increase in incomes. In Cape Town, the train was notoriously unreliable and dangerous while the Golden Arrow bus services were slow and infrequent—and their reputation worsened between 2010 and 2015. Users could have been pushed to other modes including private transit for that reason, although clearly, they also reduced average travel times in addition to achieving higher reliability and greater safety. In Cape Town, the average travel time increased for respondents who reported that they switched their commute from paratransit to BRT. This suggests either that people were motivated to switch for reasons other than travel time, or that routes were replaced and BRT was the next-best option for them with the restructuring. Findings from qualitative interviews with residents in Barranquilla and Cape Town Findings from qualitative interviews with residents of the Barranquilla and Cape Town complement the quantitative analysis on changes in travel behavior and expand the understanding of how residents experienced the transition to a hybrid BRT - private transit system. Some interviewees in Barranquilla stressed that the BRT reduced their travel time, it was more comfortable than the regular buses, and provided free transfers within the BRT system. However, other users lamented the removal of some of the previous conventional bus routes, the more direct service they offered, and ability to bargain for fares. Many interviewees brought up overcrowding on Transmetro during peak commute periods, which translates into longer waiting times at stations and undesirable on-board conditions.

165
Many participants suggested that conventional buses (and to a lesser extent collective taxis) compete more with Barranquilla’s BRT than they do with the smaller informal modes such as mototaxis and motocarros. Interviewees reported using motorcycle taxis and motocarros predominantly for short trips at the neighborhood level, and sometimes to or from BRT stations. Interestingly, interviewees did not identify a reduction in collisions or lowered levels of pollution as benefits of BRT implementation. Interviews with Cape Town residents demonstrate that in many cases MyCiTi was sufficiently attractive compared to other modes for at least many of these participants to make the switch. Of course, many continue to use the other modes perhaps for other more reasons that simply service features. For example, nearly all interviewees were very concerned with security and risk of crime, which often leads them to avoid long walks and therefore choose the mode closest to their origin and destination. When it came to crime in the vehicle, MyCiTi was seen as relatively safe. Overall travel time and costs were of course still very important but balanced with other factors in Cape Town. In contrast to what interview findings in Barranquilla suggests, transfers on MyCiTi were rarely a burden for interviewees in part because changing between BRT vehicles was free of cost and relatively easy. This can be explained by the fact that while Cape Town’s BRT has trunk routes that are significantly longer than feeder routers, Barranquilla’s BRT has feeder routes that are almost as long as trunk-corridors routes. Thus, in Cape Town, travel times onboard of feeder buses and transfer times can be offset with faster travel on trunk corridors; in Barranquilla this is less likely because the configuration of the system. In contrast to what interviewees said in Barranquilla about private transit removal, complaints regarding the removal of minibus taxis in Cape Town were minimal. Most interviewees expressed neutral to positive opinions about the change. Perhaps this is because so many people harbored negative feelings toward minibus taxis to start with, and they felt no sentimentality about their replacement. Apparently, this was not an issue with conventional buses for residents in Barranquilla. While plenty of people found minibus taxis convenient and suited to their travel needs, they viewed the drivers’ interests as at odds with those of passengers – and those of the community. Many interviewees felt MyCiTi authorities worked on their side either – but it was not because of an actively antagonistic relationship, but because of the perceived lack of interest on the part of the authorities
Chapter 13 Policy Implications, Research Needs, and Conclusions Implementing BRT and reforming private transit services is a challenging project; one that has been attempted and accomplished with varying degrees of success in cities all over the world. There are no easy choices, and all of them are costly, requiring significant commitments from national governments or well-heeled municipal governments. It is expensive to buy out paratransit operators; it is expensive to formalize and include them as operators within a system; and it’s expensive to construct and to operate a high-quality BRT system. In the face of these challenges, our study reinforces the idea that private transit has important advantages that should be considered when designing BRT. This advantage was evident, for example, in our quantitative analysis of Cape Town survey data, where minibus taxis provided significant travel savings and would possibly play even a greater role in the city if physical and operational integration between those services and the BRT could be managed. Another important set of comparisons is between BRT, private transit, and private automobile and motorcycle use. A large fraction of private transit and paratransit vehicles are multiple occupancy and require less parking even when they are single occupancy, compared to private automobile/motorcycle ownership and use. Thus, retaining private transit and paratransit ridership has the potential for important environmental and efficiency benefits by forestalling private vehicle use, if its negative externalities can be properly managed. At least two responses present themselves to the problem of improving mobility in metropolitan areas whose transit services have been traditionally provided primarily by the private sector. One solution is to restructure and reduce private transit services, perhaps eventually removing private transit services altogether, while substituting BRT. Another solution is to directly fix the problems of private transit. In practice, the second solution seems much more difficult. Yet private transit, and in particular, competition among transportation providers, clearly has some benefits for users and perhaps even some long-term environmental benefits, in addition to causing problems. It appears to be much harder for governments to successfully regulate, monitor and police existing private transit services than to create new governance structures in charge of a public system that abolishes the services. The background here is important. If, as has been argued in the literature, the private transit sector is fragmented, and self-interested, without any hope of real reform, then it is understandable that in some cases BRT would be seen as meeting several needs simultaneously, only one of those being (ostensibly) to improve transportation.
167
That said, the most common BRT structure, the trunk-and-feeder system, does not always work very well. In particular, the existing literature, our case studies, and our data collection all suggest that there are winners and losers among metropolitan area residents who experience the implementation of trunk-and-feeder BRT systems whenever there is also the concomitant removal or restructuring of private transit services. Thus, we find a strong argument for good integration or preservation of existing paratransit as much as possible in order to forestall motorcycle or automobile adoption, not least in places where there cannot be a wholesale full-fledged network overnight. Even in those places, like Barranquilla and perhaps Jakarta, that is no panacea for the rise in motorcycle and auto use either; nor in Quito, with its strong BRT trunk-and-feeder network with high current ridership and market share. Policy implications We found that BRT reduced travel times for some, yet for who depended on characteristics of pre-existing transportation alternatives, urban form, and BRT system design. Cities where the poorest live in the outskirts (a trend in the global south) would likely benefit from either shorter or more reliable feeder services. Another intervention that will likely benefit peripheral communities consists on implementing direct BRT services as planners in Jakarta and Barranquilla are doing, and by better regulating but continuing to allow private transit and paratransit services. Increase in smartphones penetration in many developing countries opens new opportunities to use this GPS-enabled technology to better plan and regulate private transit and paratransit. Bus-only lanes for feeder and direct service routes are a low-cost intervention that would likely provide even faster, and more reliable service. In most cases, these interventions require removing road infrastructure space used by primarily by automobiles, such as parking or the curbside mixed-traffic lane, to accommodate only buses. Bus-only lanes design must carefully consider possible conflicts with other road users such as right turns for motorists. While removing lanes from automobiles is not a trivial task, some cities, including New York, London, San Francisco, and Boston, managed to permanently install bus-only lanes. Some of these cities started with non-permanent bus-only lane, also called ‘tactical transit lanes’, pilots during peak hours to gain political approval.278
278 Bliss, “To Build a Better Bus Lane, Just Paint It”; Gahbauer and Matute, “Best Practices in Implementing Tactical Transit Lanes”; Streetsblog, “Boston Makes Its Bus Lane Experiment Permanent.”
168
BRT services are costly, even though cheaper than fixed rail services. They may be unsustainable in poorer cities both for the financial reality and for the expertise and staff time required to implement them property. Cities should consider alternative approaches to BRT given their existing transport services, their population and employment size, their financial capability, and other factors. BRT planners should consider building in the cost of fare subsidies for lower-income travelers to take advantage of BRT services, because previously-existing private transit services typically enabled fare bargaining and, in most cases, cover all their operational expenses with revenue from fares. Finally, there do appear to be some BRT planning steps that would not increase financial costs at all, or be of relatively low cost, including a greater focus on participatory planning when preparing a BRT plan, and emphasizing fare integration between BRT and other transportation modes. There is also some promise in carrying out aggressive, high-visibility information campaigns to improve user understanding of wayfinding, transferring, and purchasing fares when the system is introduced; to gain early traction rather than kill momentum. Cape Town had such a plan but it may not have been emphasized enough since many residents were still confused about the system during our field work. Such a campaign could have been particularly helpful in Barranquilla, where aspects of the system pose barriers to many users. Finally, our case studies emphasize the importance of planned negotiations with private paratransit owners and drivers that include financial education for them—while making very sure that buyout plans do not bankrupt the BRT agency as seems to have occurred in Cape Town.279 Research needs There is a lack of analysis, and indeed of data needed for the analysis, as to how accidents and other impacts change, now or in the future, outside the corridors on which trunk-line BRT runs. The emphasis of research to date has been almost exclusively on impacts measured very near trunk corridors or trunk-and-feeders, using in most cases data that come from demand forecasting exercises that do not represent reality. Part of the issue from a planning perspective is knowing what measures to use, and which impacts to foresee and monitor, in order to understand the best tailored approach to take when planning transport service modifications that include BRT. There is so much significant variance in different metropolitan characteristics ranging from urban form to financial and technical capacity (such
279 Schalekamp, “Paratransit Operators’ Participation in Public Transport Reform in Cape Town: A Qualitative Investigation of Their Business Aspirations and Attitudes to Reform.”
169
as experience with negotiating contracts); regulatory capacity; and official corruption. These factors impede or enable a “successful” BRT to be implemented, when measuring “success” from system measures such as ridership and average speed. And yet there is an additional step in order to also measure the social welfare impacts for the metropolitan area population. Ideally one would estimate accessibility metrics for different populations before and after proposed changes and compare how different population segments and places are impacted. Doing this work is not at all simple because it requires link-by-link travel times by different modes before and after the transport service modifications, along with data on spatial patterns of population (which are typically crude) and of employment and/or destinations (which are typically non-existent in administrative data in our experience). Another important research topic is rapidly changing technology and its effects on proposed BRT systems. BRT planning efforts worldwide do not seem particularly cognizant of the impending autonomous vehicle revolution and how that could change the cost equation across the board, including for the small shared-vehicle sector. Centralized, trunk services are possibly going the way of the dinosaur given the advent of electric, solar charged autonomous shared ride automobiles, and even for that matter autonomous private transit or paratransit vehicles. What should BRT planners do? Finally, land use policies such as parking requirements and building height limits are an important part of the equation that we know relatively little about in cities adopting BRT. Not permitting market forces to further densify development in fast-growing cities like our five case study metros is reducing BRT competitiveness even further. Conclusions According to international advocates like EMBARQ and ITDP, prevailing best practice in BRT is the “all-at once” implementation. The most successful system as measured by ridership and mode share, among our five case studies, is also the longest-established and densest system, in Quito, Ecuador. Yet Quito, too, has significant problems with financial sustainability and failure to compete on price and speed with private autos and taxis, and the future sustainability is uncertain, even given infusions of capital from the central government to build a metro that is underway. Even highly successful BRT has significant long-term challenges to confront. Private transit vehicles are seen as increasing local road congestion along main travel corridors. But private transit may not increase road congestion regionally, particularly in comparison to private vehicles. It is even possible that private transit would help forestall auto and motorcycle use and ownership for some

170
metropolitan area residents more than a restructured, BRT-centered system would. In a pessimistic view, under the right (wrong) conditions, banning paratransit vehicles and running BRT on select trunk corridors could even, in theory, make both global/regional and future conditions worse. This is because BRT systems are typically structured in trunk-and-feeder systems that often cause more inconvenience and higher cost for some residents. This can result in declining ridership over time; unsustainable financial commitments by local/regional/federal governments, since BRT services are almost always more expensive than existing services; a stronger push over time from metropolitan area residents to own and use private autos or motorcycles; and thus, perhaps years later, the possibility of even higher road congestion and air pollution—when measured regionally or globally—even though conditions along BRT corridors will likely indeed be improved in many cases. Thus, we end with a critical question about the sustainability and equity of cities planning BRT: Can a better integrated system of BRT and private transit compete with the private auto and motorcycle? Are other policies more effective? Charging congestion prices for all vehicles, and introducing market priced parking, might in some places be a better way to achieve environmental and fiscal sustainability, and social transportation equity. Market-priced parking and congestion-charged roads are sometimes conceived as being supportive policies for BRT. But perhaps BRT should be conceived as a supportive policy for pricing—the London congestion charging area is a good example of this. Without such larger systemic pricing reform both BRT and private transit may lose the competition against personal autos, private motorcycles, shared and individually-owned autonomous vehicles, and other mobility innovations that are potentially environmentally damaging and inequitable.

171
References Adiwinarto, Yoga. Personal Communication, 2015. Agencia d’Ecologia Urbana de Barcelona. “Restructuración de La Red de Transporte
Público de Pasajeros Del Distrito Metropolitano de Quito.” Municipio del Distrito Metropolitano de Quito, July 2017.
Alcaldía de Barranquilla. “Distrito Prorroga Decretos de Motos Hasta El 30 de Junio de 2017.” Secretaria Disitrital de Tránsito y Seguridad Vial de Barranquilla, December 2016. http://www.barranquilla.gov.co/transito/index.php?option=com_content&view=article&id=12416:distrito-prorroga-decretos-de-motos-hasta-ell-30-de-junio-de-2017&catid=36:boletines&Itemid=30.
———. “Encuesta de Percepción Ciudadana Barranquilla 2009,” 2009. https://www.barranquilla.gov.co/control-y-rendicion-de-cuentas/barranquilla-como-vamos.
———. “Encuesta de Percepción Ciudadana Barranquilla 2015,” 2015. https://www.barranquilla.gov.co/control-y-rendicion-de-cuentas/barranquilla-como-vamos.
———. Estratificación Socio-Económica. February 2014. Digital map. file:///Users/manuelsantana/Downloads/G418U18_Estratificacion.pdf.
———. “Informe General, Oficina de Registro de Tránsito,” January 2019. https://www.barranquilla.gov.co/.
Ardila, Arturo. “Limitation of Competition in and for the Public Transportation Market in Developing Countries: Lessons from Latin American Cities.” Transportation Research Record: Journal of the Transportation Research Board 2048 (September 16, 2008): 8–15. https://doi.org/10.3141/2048-02.
Ardila-Gómez, Arturo. “The Pressure Cooker of Public Transport in Bogotá.” Revista de Ingeniería, no. 21 (May 2005): 56–67.
———. “Transit Planning in Curitiba and Bogotá. Roles in Interaction, Risk, and Change. Diss. Massachusetts Institute of Technology, 2004.” Doctoral Dissertation, Massachusetts Institute of Technology, 2004.
“Atlas of Urban Expansion - Quito.” Atlas of Urban Expansion, 2016. http://www.atlasofurbanexpansion.org/cities/view/Quito.
Barranquilla Como Vamos. “Como Vamos En Transporte e Infraestructura Vial 2008-2013.” Barranquilla Como Vamos, 2013. http://www.barranquillacomovamos.co/bcv/index.php/component/k2/item/328-cómo-vamos-en-transporte-e-infraestructura-vial-2008-2013.
Behrens, Roger, and Pablo Salazar Ferro. “Paratransit and Formal Public Transport Operational Complementarity: Imperatives, Alternatives and Dilemmas.” Rio de Janeiro, Brazil, 2013. http://www.wctrs-society.com/wp-content/uploads/abstracts/rio/selected/1466.pdf.

172
Bliss, Laura. “To Build a Better Bus Lane, Just Paint It.” CityLab (blog), March 1, 2019. https://www.citylab.com/transportation/2019/03/bus-commute-tactical-transit-lanes-traffic-congestion/583798/.
Cámara de Comercio de Barranquilla. “Observatorio Urbano Local Del Área Metropolitana de Barraquilla,” 2015. http://www.ambq.gov.co/wp-content/uploads/2017/07/Observatorio-metropolinato-2017.pdf.
Camargo, Sindry, Raul Ramos, and Euclides Llach. Personal communication, n.d. Carrión, Diego. Personal communication, March 27, 2015. Carruthers, R., M. Dick, and A. Saurkar. “Affordability of Public Transport in Developing
Countries.” Washington, D.C.: The World Bank, 2005. Cervero, R. “Linking Urban Transport and Land Use in Developing Countries.” Journal of
Transport and Land Use 6, no. 1 (April 10, 2013): 7–24. Cervero, Robert. “Bus Rapid Transit (BRT): An Efficient and Competitive Mode of Public
Transport.” Working Paper. Institute of Urban and Regional Development; University of California, Berkeley, 2013.
———. “From Becaks and Ojeks to Microbuses and Minibuses: Jakarta, Indonesia.” In Informal Transport in the Developing World, 147. Nairobi: United Nations Centre for Human Settlements (Habitat), 2000.
———. Informal Transport in the Developing World. UN-HABITAT, 2000. ———. Paratransit in America: Redefining Mass Transportation. Greenwood Publishing
Group, 1997. ———. “Paratransit in Southeast Asia: A Market Response to Poor Roads?” Review of
Urban and Regional Development Studies 3, no. 1 (1991): 3–27. Cervero, Robert, and Danielle Dai. “BRT TOD: Leveraging Transit Oriented
Development with Bus Rapid Transit Investments.” Transport Policy 36 (November 1, 2014): 127–38. https://doi.org/10.1016/j.tranpol.2014.08.001.
Cervero, Robert, and Aaron Golub. “Informal Transport: A Global Perspective.” Transport Policy 14, no. 6 (November 2007): 445–57. https://doi.org/10.1016/j.tranpol.2007.04.011.
Christopher, A. J. “The Slow Pace of Desegregation in South African Cities, 1996-2001.” Urban Studies 42, no. 12 (November 1, 2005): 2305–20. https://doi.org/10.1080/00420980500332122.
City of Cape Town. “2012 MyCiTi Business Plan: Phases 1A, 1B and N2 Express of Cape Town’s MyCiTi IRT System.” Cape Town: City of Cape Town, September 2012.
———. “Business Plan for Phase 1A of Cape Town’s MyCiTi Integrated Rapid Transit System.” Cape Town: City of Cape Town, July 2010.
———. “Five-Year Plan for Cape Town - Integrated Development Plan 2007/8-2011/12.” Cape Town: City of Cape Town, 2007.
———. “Household Survey Report - Final Report.” City of Cape Town, January 2014.
173
———. “Integrated Transport Plan 2006-2011 Review 2009.” Cape Town: City of Cape Town, 2009.
“Dar Es Salaam Transport Policy and System Development Master Plan.” Japan International Cooperative Agency (JICA), 2008. http://open_jicareport.jica.go.jp/pdf/11897527.pdf.
“DAR Resettlement of Commuter Buses (Dala Dala).” DART, 2014. Darbéra, Richard. “Deregulation of Urban Transport in Chile: What Have We Learned in
the Decade 1979–1989?” Transport Reviews 13, no. 1 (January 1, 1993): 45–59. https://doi.org/10.1080/01441649308716834.
“DART.” Dar Rapid Transit - DART. Accessed June 21, 2017. http://dart.go.tz/en/. Deng, Taotao, and John D. Nelson. “Recent Developments in Bus Rapid Transit: A
Review of the Literature.” Transport Reviews 31, no. 1 (November 10, 2010): 69–96. https://doi.org/10.1080/01441647.2010.492455.
Departamento Nacional de Estadística. “Medición de Empleo Informal y Seguridad Social.” Departamento Nacional de Estadística, April 11, 2019. https://www.dane.gov.co/files/investigaciones/boletines/ech/ech_informalidad/bol_ech_informalidad_dic18_feb19.pdf.
Department of Transport. “Public Transport Strategy.” South Africa Department of Transport, 2007.
DMQ. “Diagnóstico de La Movilidad En El Distrito Metropolitano de Quito Para El Plan Metropolitano de Desarrollo Territorial (PMOT).” Distrito Metropolitano de Quito, October 30, 2014. http://gobiernoabierto.quito.gob.ec/wp-content/uploads/documentos/pdf/diagnosticomovilidad.pdf.
———. “Plan Maestro de Movilidad Para El Distrito Metropolitano de Quito 2009-2025,” 2009.
———. “Sistema Metropolitano de Transporte | Municipio Del Distrito Metropolitano de Quito.” Accessed June 11, 2019. http://www.quito.gob.ec/index.php/municipio/245-sistema-metropolitano-de-transporte.
DNP. “CONPES 3788 - Sistema Integrado Del Servicio Público Urbano de Transporte Masivo de Pasajeros Del Distrito de Barranquilla Y Su Área Metropolitana - Seguimiento.” Departamento Nacional de Planeación, December 9, 2013. https://colaboracion.dnp.gov.co/CDT/Conpes/Econ%C3%B3micos/3788.pdf.
Dugard, Jackie. “From Low Intensity War to Mafia War: Taxi Violence in South Africa (1987 - 2000).” Violence and Transition Series 4 (2001). http://www.csvr.org.za/wits/papers/papvtp4.htm.
Echeverría, Julio. Personal communication, March 27, 2015. El Comercio. “El Subsidio al Transporte Público En Quito Está En Estudio.” El Comercio.
May 2019. https://www.elcomercio.com/actualidad/subsidio-transportepublico-quito-estudio-pasajes.html.

174
———. “La Caja Común Busca Mejorar El Transporte Público.” El Comercio. Accessed June 11, 2019. https://www.elcomercio.com/actualidad/ecuador/caja-comun-busca-mejorar-transporte.html.
———. “Las ‘Furgorrutas’ Ganan Espacio a Los ‘Taxirrutas’ En Quito.” El Comercio. June 14, 2016. https://www.elcomercio.com/actualidad/busetas-taxis-quito-transporte-informal.html.
———. “Quito Apuesta Por Un Sistema Integrado.” El Comercio. November 2014. https://www.elcomercio.com/actualidad/quito-apuesta-sistema-integrado-1.html.
El Heraldo. “Más Carros y Las Mismas Vías, Otra Causa de Los Trancones.” El Heraldo, May 10, 2016. http://www.elheraldo.co/local/mas-carros-y-las-mismas-vias-otra-causa-de-los-trancones-152121.
El Telégrafo. “El transporte informal cubre las falencias del sistema regular de movilidad.” El Telégrafo, March 15, 2015. https://www.eltelegrafo.com.ec/noticias/quito/1/el-transporte-informal-cubre-las-falencias-del-sistema-regular-de-movilidad.
———. “Los Informales Cubren 2% Del Transporte En Quito.” El Telégrafo. March 16, 2015. http://www.eltelegrafo.com.ec/noticias/quito/11/los-informales-cubren-2-del-transporte-en-quito.
El Tiempo. “Los 16 puntos claves del acuerdo para salvar el SITP.” El Tiempo, June 1, 2019. https://www.eltiempo.com/bogota/puntos-clave-del-acuerdo-para-salvar-el-sitp-compromisos-de-transmilenio-y-beneficios-370000.
———. “Salvavidas al SITP le costará a Bogotá $ 1,7 billones en 10 años.” El Tiempo, May 29, 2019. https://www.eltiempo.com/bogota/costo-para-salvar-el-sitp-en-bogota-368860.
Emisora Atlántico. “Nuevo Decreto Reglamenta Circulación de Motocarros y Motocicletas En El Municipio de Soledad.” Emisora Atlántico, June 7, 2016. http://emisoraatlantico.com.co/superior/nuevo-decreto-reglamenta-circulacion-motocarros-motocicletas-municipio-soledad/.
Ernst, John. “Initiating Bus Rapid Transit in Jakarta, Indonesia.” Transportation Research Record: Journal of the Transportation Research Board 1903 (January 2005): 20–26. https://doi.org/10.3141/1903-03.
Estache, Antonio, and Andrés Gómez-Lobo. “Limits to Competition in Urban Bus Services in Developing Countries.” Transport Reviews 25, no. 2 (March 1, 2005): 139–58. https://doi.org/10.1080/0144164042000289654.
Fernández, J. Enrique, and Juan Carlos Muñoz. “Privatisation and Deregulation of Urban Bus Services: An Analysis of Fare Evolution Mechanisms.” Journal of Transport Economics and Policy 41, no. 1 (2007): 25–49.
Flores Dewey, Onésimo Alberto. “Expanding Transportation Planning Capacity in Cities of the Global South : Public-Private Collaboration and Conflict in Chile and Mexico.” Thesis, Massachusetts Institute of Technology, 2013. http://dspace.mit.edu/handle/1721.1/84427.
Gahbauer, John, and Juan Matute. “Best Practices in Implementing Tactical Transit Lanes.” Los Angeles, CA: Institute of Transport Studies, University of California,
175
Los Angeles, March 1, 2019. http://www.its.ucla.edu/publication/best-practices-in-implementing-tactical-transit-lanes/.
Gamble, Julie. “Visioning a Transit City: Citizen Participation and Transit Planning in Quito, Ecuador.” University of California, Berkeley, 2015. http://repositorio.educacionsuperior.gob.ec/handle/28000/3460.
Gilbert, Alan. “Bus Rapid Transit: Is Transmilenio a Miracle Cure?” Transport Reviews 28, no. 4 (July 1, 2008): 439–67. https://doi.org/10.1080/01441640701785733.
“Global BRT Data.” Accessed June 14, 2016. http://www.brtdata.org/. Golub, A., Roger Behrens, and P. Salazar Ferro. “Planned and Paratransit Service
Integration through Trunk and Feeder Arrangements: An International Review.” SATC 2012, 2012. http://www.repository.up.ac.za/handle/2263/20419.
Guzmán, Alvaro. Personal communication, March 3, 2015. Guzmán, Alvaro, and Cristhian Figueroa. “Asimetrías y Desigualdades En Los Sistemas
de Transporte Público de Quito y Santiago de Chile.” Madrid, Spain, 2016. http://contested-cities.net/working-papers/2016/asimetrias-y-desigualdades-en-los-sistemas-de-transporte-publico-de-quito-y-santiago-de-chile/.
Hagen, Jonas Xaver, CarlosFelipe Pardo, and Johanna Burbano Valente. “Motivations for Motorcycle Use for Urban Travel in Latin America: A Qualitative Study.” Transport Policy 49 (July 2016): 93–104. https://doi.org/10.1016/j.tranpol.2016.04.010.
Hensher, David A. “Sustainable Public Transport Systems: Moving towards a Value for Money and Network-Based Approach and Away from Blind Commitment.” Transport Policy 14, no. 1 (January 2007): 98–102. https://doi.org/10.1016/j.tranpol.2006.10.004.
Hidalgo, Dario, and Aileen Carrigan. “Modernizing Public Transportation, Lessons Learned from Major Bus Improvements in Latin America and Asia.” Washington, D.C.: EMBARQ the WRI Center for Sustainable Transport, 2010.
Hidalgo, Darío, and Pierre Gradtieaux. “A Critical Look at Major Bus Improvements in Latin America and Asia: Case Study Metrobús-Q, Quito, Ecuador.” World Bank Publications. Accessed June 22, 2017. http://siteresources.worldbank.org/INTURBANTRANSPORT/Resources/Hidalgo-Graftieaux-QUITO.pdf.
Hidalgo, Dario, and Pierre Graftieaux. “Bus Rapid Transit Systems in Latin America and Asia: Results and Difficulties in 11 Cities.” Transportation Research Record: Journal of the Transportation Research Board 2072 (December 2008): 77–88. https://doi.org/10.3141/2072-09.
Hidalgo, Dario, and Luis Gutierrez. “BRT and BHLS around the World: Explosive Growth, Large Positive Impacts and Many Issues Outstanding.” Research in Transportation Economics 39, no. 1 (March 2013): 8–13. https://doi.org/10.1016/j.retrec.2012.05.018.
Hidalgo, Dario, and Gabrielle Hermann. “The Bogotá Model for Sustainable Transportation; Inspiring Developing Cities throughout the World.” Trialog 82 (2004): 11–15.
176
Hook, Walter. “Institutional and Regulatory Options for Bus Rapid Transit in Developing Countries: Lessons from International Experience.” Transportation Research Record: Journal of the Transportation Research Board 1939 (January 1, 2005): 184–91. https://doi.org/10.3141/1939-21.
“Implementing Direct Service Integration for Transjakarta: Phase 1 Conceptual Design & Planning.” Institute for Transport Development Policy (ITDP), July 2013.
“Implementing Low Carbon Public Transportation - Direct Service Report.” Jakarta, Indonesia: Institute for Transportation and Development Policy, 2010. http://www.itdp-indonesia.org/reeep-report/.
INEC. “Proyecciones Poblacionales.” Instituto Nacional de Estadística y Censos. Accessed June 11, 2019. http://www.ecuadorencifras.gob.ec/proyecciones-poblacionales/.
ITDP. “Dar Es Salaam’s BRT Could Transform Urban Life in Tanzania,” August 9, 2016. https://www.itdp.org/dar-es-salaams-dart/.
Joewono, Tri Basuki, and Hisashi Kubota. “User Satisfaction with Paratransit in Competition with Motorization in Indonesia: Anticipation of Future Implications.” Transportation 34, no. 3 (May 1, 2007): 337–54. https://doi.org/10.1007/s11116-007-9119-7.
Juan Ramírez, and Rafael Parra-Peña. “Metrópolis de Colombia: Aglomeraciones y Desarrollo.” CEPAL, April 2013. https://repositorio.cepal.org/bitstream/handle/11362/4820/1/LCL3610_es.pdf.
Kahn, Alfred Edward. The Economics of Regulation: Principles and Institutions. Vol. 1. MIT Press, 1988.
Khosa, Meshack M. “Transport and Popular Struggles in South Africa.” Antipode 27, no. 2 (April 1, 1995): 167–88. https://doi.org/10.1111/j.1467-8330.1995.tb00271.x.
Lindau, Luis Antonio, Dario Hidalgo, and Daniela Facchini. “Curitiba, the Cradle of Bus Rapid Transit.” Built Environment 36, no. 3 (October 13, 2010): 274–82. https://doi.org/10.2148/benv.36.3.274.
Lindau, Luis Antonio, Cristina Modeira da Silva, and Daniela Facchini. “Global Overview of BRT and Bus Corridors.” In Restructuring Public Transport Through Bus Rapid Transit: An International and Interdisciplinary Perspective. Policy Press, 2016.
“Major Agglomerations of the World - Population Statistics and Maps.” City Population. Accessed June 11, 2019. https://www.citypopulation.de/world/Agglomerations.html.
Maldonado, Paola, and Diego Andrade. “Incidencia de La Pobreza Según Zonas Censales En Quito (2001 - 2006).” Quito, Ecuador: Universidad Andina Simón Bolívar, 2009. http://www.uasb.edu.ec/UserFiles/372/File/pdfs/NOTICIASYSUCESOS/2009/quito_pobreza_zonas03.pdf.
McCormick, Dorothy, Herrie Schalekamp, and David Mfinanga. “The Nature of Paratransit Operations.” In Paratransit in African Cities. New York: Routledge, 2016.

177
Montero, Sergio. “Study Tours and Inter-City Policy Learning: Mobilizing Bogotá’s Transportation Policies in Guadalajara.” Environment and Planning A, September 19, 2016, 0308518X16669353. https://doi.org/10.1177/0308518X16669353.
Mulefe, Thabang. Personal communication, 2015. Naranjo, Maria Marlene, and Lizardo Dautt. Personal communication, March 24, 2015. Nyoka, Babalwa. Personal communication, May 29, 2015. ODA. “MyCiTi Phase 1 Industry Transition: Context, Development, Implementation and
Lessons Learnt.” City of Cape Town, 2014. Ortegon-Sanchez, Adriana, and Nick Tyler. “Towards Multi-Modal Integrated Mobility
Systems: Views from Panama City and Barranquilla.” Research in Transportation Economics, May 2016. https://doi.org/10.1016/j.retrec.2016.03.001.
———. “Towards Multi-Modal Integrated Mobility Systems: Views from Panama City and Barranquilla.” Research in Transportation Economics, May 2016. https://doi.org/10.1016/j.retrec.2016.03.001.
Paget-Seekins, Laurel, Onesimo Flores Dewey, and Juan Carlos Muñoz. “Examining Regulatory Reform for Bus Operations in Latin America.” Urban Geography 36, no. 3 (April 3, 2015): 424–38. https://doi.org/10.1080/02723638.2014.995924.
Paget-Seekins, Laurel, Onesimo Flores Dewey, and Juan Carlos Muñoz. “Examining Regulatory Reform for Bus Operations in Latin America.” Urban Geography 36, no. 3 (April 3, 2015): 424–38. https://doi.org/10.1080/02723638.2014.995924.
Paget-Seekins, Laurel, and Manuel Tironi. “The Publicness of Public Transport: The Changing Nature of Public Transport in Latin American Cities.” Transport Policy 49 (July 2016): 176–83. https://doi.org/10.1016/j.tranpol.2016.05.003.
Paredes, Freddy. Personal communication, March 3, 2015. Phakathi, Bekezela. “Traffic Congestion in Cape Town Exceeds That of Johannesburg.”
Business Day Live, March 24, 2016. http://www.bdlive.co.za/business/transport/2016/03/24/traffic-congestion-in-cape-town-exceeds-that-of-johannesburg.
Picón, José, Federico Diaz, and Carlos Chaparro. Personal communication, March 25, 2015.
Portes, Alejandro. “The Informal Sector.” Review 7, no. 1 (1983): 151–174. “Public Transport in Sub-Saharan Africa: Major Trends and Case Studies.” International
Association of Public Transport, 2010. https://www.uitp.org/public-transport-sub-saharan-africa-major-trends-and-case-studies.
“Quito, Ecuador Brief: Tolebus Busway System.” Accessed June 22, 2017. http://onlinepubs.trb.org/onlinepubs/tcrp/tcrp90v1_cs/Quito.pdf.
“Reporte de Pobreza por Ingresos.” Quito, Ecuador: Instituto Nacional de Estadística y Censos, March 2015. http://www.ecuadorencifras.gob.ec/documentos/web-inec/POBREZA/2015/Marzo/Reporte_pobreza_desigualdad_marzo15.pdf.
178
“Restablecido el servicio de transporte masivo Transmetro.” El Heraldo. December 22, 2012. http://www.elheraldo.co/local/restablecido-el-servicio-de-transporte-masivo-transmetro-94071.
Rini, Daryati Asriring. “Urban Public Transport System in Jakarta.” presented at the United Nations Forum on Climate Change Mitigation, Fuel Economy, and Sustainable Development of Urban Transport, March 2010. https://sustainabledevelopment.un.org/content/dsd/susdevtopics/sdt_pdfs/meetings2010/egm0310/presentation_Rini.pdf.
Rivasplata, Charles. “Public Transport Integration in a Privatised Market: Recent Policy Lessons from Abroad.” Ho Chi Minh City, Vietnam, n.d. http://www.codatu.org/wp-content/uploads/Public-transport-integration-in-a-privated-market-recent-policy-lessons-from-abroad-Charles-RIVASPLATA.pdf.
Rojas Ricaurte, SSebastián. “Transmilenio, el ‘metro’ barato que nos vendió Peñalosa, fracasó.” El Espectador, October 3, 2018. https://www.elespectador.com/opinion/transmilenio-el-metro-barato-que-nos-vendio-penalosa-fracaso-columna-815884.
Ryneveld, Philip van. “Making MyCiTi Financially Sustainable.” Cape Town: City of Cape Town, 2014.
Salazar Ferro, Pablo, and Roger Behrens. “From Direct to Trunk-and-Feeder Public Transport Services in the Urban South: Territorial Implications.” Journal of Transport and Land Use 8, no. 1 (January 13, 2015): 123. https://doi.org/10.5198/jtlu.2015.389.
Salazar Ferro, Pablo, Roger Behrens, and Peter Wilkinson. “Hybrid Urban Transport Systems in Developing Countries: Portents and Prospects.” Research in Transportation Economics, THREDBO 12: Recent developments in the reform of land passenger transport, 39, no. 1 (March 2013): 121–32. https://doi.org/10.1016/j.retrec.2012.06.004.
Saldana, Johnny. The Coding Manual for Qualitative Researchers. SAGE, 2015. Sarmiento, Adriana. Personal communication, March 24, 2015. Schalekamp, Herrie. “Paratransit Operators’ Participation in Public Transport Reform in
Cape Town: A Qualitative Investigation of Their Business Aspirations and Attitudes to Reform.” PhD Thesis, University of Cape Town, 2015.
———. Personal communication, 2015. Schalekamp, Herrie, and Roger Behrens. “Engaging Paratransit on Public Transport
Reform Initiatives in South Africa: A Critique of Policy and an Investigation of Appropriate Engagement Approaches.” Research in Transportation Economics, Reforming Public Transport throughout the World, 29, no. 1 (2010): 371–78. https://doi.org/10.1016/j.retrec.2010.07.047.
Serebrisky, Tomás, Andrés Gómez‐Lobo, Nicolás Estupiñán, and Ramón Muñoz‐Raskin. “Affordability and Subsidies in Public Urban Transport: What Do We Mean, What Can Be Done?” Transport Reviews 29, no. 6 (November 2009): 715–39. https://doi.org/10.1080/01441640902786415.
179
Sosibo, Kwanele. “Can a Black Leader Change an ‘institutionally White’ DA?” The Mail & Guardian, April 13, 2015. http://mg.co.za/article/2015-04-13-can-a-black-leader-change-an-institutionally-white-da/.
Statistics South Africa. “National Household Travel Survey February to March 2013.” Pretoria, South Africa: Statistics South Africa, 2014.
Stats SA. “General Household Survey,” 2009. ———. “General Household Survey,” 2012. ———. “South Africa Census,” 2011. Streetsblog. “Boston Makes Its Bus Lane Experiment Permanent.” Streetsblog USA
(blog), June 8, 2018. https://usa.streetsblog.org/2018/06/08/boston-makes-its-bus-lane-experiment-permanent/.
“Tanzania: Let’s Think Together.” The World Bank Blog (blog), May 14, 2013. http://blogs.worldbank.org/category/tags/tanzania-lets-think-together.
“Tanzania Transport Sector Review.” Abidjan, Ivory Coast: African Development Bank, 2013. https://www.afdb.org/fileadmin/uploads/afdb/Documents/Project-and-Operations/Tanzania_-_Transport_Sector_Review.pdf.
“The BRT Standard.” New York, N.Y., United States: ITDP, 2014. The Jakarta Post. “Kopaja Preparing to Join Transjakarta Management.” The Jakarta
Post, June 25, 2015. https://www.thejakartapost.com/news/2015/06/25/kopaja-preparing-join-transjakarta-management.html.
“Time Is Money: Transforming Dar Es Salaam’s Road Transport to Reduce Dense Traffic.” Text/HTML. World Bank (blog). Accessed June 21, 2017. http://www.worldbank.org/en/news/feature/2017/03/27/time-is-money-transforming-dar-es-salaams-road-transport-to-reduce-dense-traffic.
Traditional bus route operators, Personal communication, March 24, 2015. “TransJakarta Could Lose Yet More Passengers.” The Jakarta Post. May 8, 2013.
http://www.thejakartapost.com/news/2013/05/08/transjakarta-could-lose-yet-more-passengers.html.
Transport for Cape Town. “MyCiTi Business Plan Update: Phase 1 and N2 Express.” City of Cape Town, March 2015.
———. “MyCiti Commuter Numbers Soaring on Routes from Hout Bay, Camps Bay and along the West Coast.” MyCiTi, October 12, 2015. http://www.myciti.org.za/en/about/media-marketing/myciti-news/myciti-commuter-numbers-soaring-on-routes-from-hout-bay-camps-bay-and-along-the-west-coast/.
Vasconcellos, Eduardo Alcantara. Urban Transport Environment and Equity: The Case for Developing Countries. New York: Earthscan, 2001.
Wardhani, D., and I. Budiari. “Jakarta Has ‘the Worst Traffic in the World.’” The Jakarta Post. February 5, 2015. http://www.thejakartapost.com/news/2015/02/05/jakarta-has-worst-traffic-world.html.
180
Wilkinson, Peter. “The Regulatory Cycle Stalled? An Assessment of Current Institutional Obstacles to Regulatory Reform in the Provision of Road-Based Public Transport in Cape Town, South Africa.” Research in Transportation Economics, Reforming Public Transport throughout the World, 29, no. 1 (2010): 387–94. https://doi.org/10.1016/j.retrec.2010.07.049.
Wood, Astrid. “Moving Policy: Global and Local Characters Circulating Bus Rapid Transit through South African Cities.” Urban Geography 35, no. 8 (November 17, 2014): 1238–54. https://doi.org/10.1080/02723638.2014.954459.
Wright, Lloyd, and Walter Hook. “Bus Rapid Transit Planning Guide.” Institute for Transportation and Development Policy, New York, 2007.
Yin, Robert K. Case Study Research and Applications: Design and Methods. SAGE Publications, 2017.
Zeng, H. “China Transportation Briefing: Bus Rapid Transit in China - On the Way.” The City Fix (blog), May 9, 2013. http://thecityfix.com/blog/bus-rapid-transit-brt-china-transportation-briefing-series-guangzhou-beijing-heshuang-zeng.