Embed Size (px)
Citation preview

Sustainability Report 2011

Snam transports, transforms, preserves and distributes a future.
A future where Italy is a pioneer.
And where Europe is even closer.
That future already exists.
Uniting the community. Connecting people.
Bringing innovation.
It is the network that goes everywhere and that will always go farther.
It is the thread that joins genius and passion.
Development and sustainability.
With Snam,
discover the network that creates value.

Message from the CEO 4
Global Compact 6
Sustainability indices 8
1. The Snam group 10
Identity 11
Ethics and corporate governance 15
Stakeholders 18
2. Development and sustainability 24
Sustainability in business 25
Toward the creation of shared value 29
3. A network serving Italy with eyes on Europe 32
Investments and network development 34
Service security and continuity 36
4. Responsibility and transparency in the markets 38
Relations with the Authority for electricity and gas 39
Value for customers 41
Financial performance 43
Ethics and responsibility in procurement 45
5. Operating with communities in territories 48
Infrastructure sustainability 54
Biodiversity 56
Environmental management 59
Carbon footprint and energy efficiency 60
Other environmental performance 65
6. People and work as drivers of development 70
Developing and making the most of human capital 72
Health and safety 78
7. Appendix 86
Note on methodology 86
Performance indicators 88
GRI Table 91
Global Compact reconciliation table 98
Letter of assurance 99

4
Dear Stakeholders,
Even in a scenario characterised by extreme market
volatility and dampened growth prospects for the
world economy, Snam achieved significant operat-
ing and financial results in 2011. Confirming Snam’s
operating efficiency, operating profit and earnings be-
fore tax last year were up 5.2% and 3.5% respectively
compared to 2010.
Operating profit for 2011 stood at €1,958 million, in-
creasing by €96 million compared to 2010. Net profit
for 2011 was €790 million, down by €316 million. This
result is strongly correlated with recent fiscal measures
passed by the government to repair the public finances
and, in particular, with the application of the additional
IRES income tax (the “Robin Hood tax”) being extended
to entities operating in the natural gas transportation
and distribution sector. The continual focus on operat-
ing efficiency also enabled us to reach the cost-cutting
target announced for 2012 a year early.
Snam shares ended 2011 at an official price of €3.39,
dropping 9.1% from the previous year. The Company’s
annual share performance was affected by the nega-
tive performance of Italian and European financial
markets in general and in particular by the extension
of the “Robin Hood tax” to regulated companies in the
domestic energy sector. The shares nevertheless out-
performed the Italian market (FTSE MIB: -25.2%) and
the European utilities sector (Stoxx Europe 600 Utili-
ties: -16.6%), buoyed by interest in shares of compa-
nies with solid business fundamentals and long-term
earnings and cash flow visibility.
Besides staying in the major sustainability indices, in-
cluding the Dow Jones Sustainability Index World, the
share joined the Stoxx Global ESG Leaders indices, a
new group of indices of 1,800 listed companies world-
wide based on a transparent performance selection
process, in terms of sustainability. This result validates
Snam’s ongoing focus on sustainable growth, which is
also expressed through its active support of the Glob-
al Compact, its principles and of the Millennium De-
velopment Goals in general.
December 2011 saw the completion of the process for
the new organisational structure, which went into ef-
fect on 1 January 2012. Placed at the helm under the
group’s new corporate structure is Snam S.p.A., which
holds 100% of the share capital of the four operating
companies (Snam Rete Gas S.p.A., GNL Italia S.p.A.,
Stogit S.p.A and Italgas S.p.A.) focused on managing
and developing their respective businesses: natural gas
transportation and dispatching, regasification, storage
and distribution. It is a fundamental changeover, rati-
fying compliance with the EU provisions contained in
the “Third Energy Package” by implementing the ITO
(Independent Transmission Operator) model, which
calls for the separation of the transporter in terms of
both functioning and decision-making from the ver-
tically integrated company (Eni) operating in the gas
sales sector.
During the year just ended, Snam continued its com-
mitment to increasing system security and flexibility,
in order to diversify supply sources and be able to
meet needs associated with gas demand growth over
the medium and long term. This commitment will
continue to support and inform the 2012-2015 four-
year development strategy, which calls for €6.7 billion
in planned investments in gas transportation, storage
and distribution.
MESSAgE fROM ThE CEO
Snam Sustainability Report 2011 / Message from the CEO

5
The Company has continued to pay the utmost heed
toward social responsibility and local issues in its op-
erations, making investments for the installation of
low-emission gas turbines at gas compression sta-
tions, implementing environmental restoration op-
erations after the building of methane pipelines,
launching programmes for the containment of natu-
ral gas emissions, maintaining and increasing certi-
fications for corporate operating systems, and en-
suring that high safety levels are maintained. Equal
importance has been given to maximum transpar-
ency in governance processes, personal growth and
appreciation, the involvement of local communities,
and constructive relations with shareholders, author-
ities, customers and suppliers. The results achieved
are illustrated in this report which obtained the A+
level of compliance to GRI reporting guidelines, cer-
tified by GRI itself.
In 2011, Snam also launched a process that sees
sustainability as a combination of two elements:
risk reduction and the creation of shared value. The
first element is geared precisely toward controlling
risks and factors that impact stakeholders and future
generations negatively. The second element, which
stands alongside the first, is centred on creating
shared value and thus on multiplying the opportuni-
ties generated by Snam’s presence in local areas and
in the value chain.
Shared value defines the manner in which Snam will
interpret its own commitment in the coming years,
and the operating methods to further strengthen
sustainability in corporate processes.
Some projects already carried out in 2011 and men-
tioned in this document (e.g. the Suppliers’ Day for
Sustainability, Social Impact Assessment pilot stud-
ies, biodiversity and Objective Safety programme)
are a distinct starting point for the creation of shared
value. This approach is also described in a document
attached to the Sustainability Report.
The commitment to sustainable development there-
fore remains a central topic at Snam, just as it will
be for governments and institutions within the inter-
national community. The Rio + 20 Conference, com-
ing 20 years after the one that defined the Agenda
for the 21st Century, will be an important occasion
for the United Nations member countries to define
long-term sustainable development objectives. For
companies, it will be a time to evaluate the consist-
ency of the approach undertaken with respect to the
dual challenge they face: meeting cross-border and
global needs and, on the other hand, developing an
effective and efficient model of local citizenship.
Carlo MalacarneCEO
The CEO
Snam Sustainability Report 2011 / Message from the CEO

6 Snam Bilancio di Sostenibilità 2011
GLOBALCOMPACT
Since 2009, Snam has been a member
of the Global Compact, the largest worldwide
voluntary initiative on sustainability issues.
Started in 1999, its members include
governments, companies, and civil society
organisations.

7
Those who join the Global Compact commit themselves in an ongoing manner to disseminat-
ing, both internally and externally, the Global Compact’s ten principles, which concern human
rights, labour, the environment and the fight against corruption and, in general, supporting the
Millennium Development Goals.
Snam’s activities have always emphasised respect for and protection of human and labour rights,
environmental protection and the search for a sustainable development model. In particular:
•itadoptsacodeofethics,containingthemostmodernguidelinesonethicsandcorporatesus-
tainability;
•itimplementsthebestinternationalstandardsinthefightagainstcorruption;
•itadherestotheInternationalGasUnion’s“guidelinesforsustainabledevelopment”;
•itcommunicateswithstakeholdersthroughsustainabilityreporting
In 2011, Snam’s commitment to the Global Compact continued with many activities for en-
gagement and disclosure of the ten principles, including:
•activelyparticipatinginmeetingsoftheworkinggroupontheenvironmentandhumanrights,
as a member of the Global Compact Network Italy.
•participatingintheproductionofthecompendiumofcorporatebestpracticeswithanarticle
on cooperation for the environment between for profi t and non profi t organisations, “Work-
ing together for the environment: a new perspective”. This compendium was presented by the
Global Compact Network Italy at the Annual Meeting of the European Local Networks on 26-
27 October 2011 and, in a broader capacity, will also be presented to the Corporate Sustain-
ability Forum in Rio de Janeiro.
•getting theGlobal CompactNetwork Italy involved in participating in the Suppliers’Day for
Sustainability organised by Snam in November 2011.
•dissemination of the Global Compact’s ten principles in the documentation for commercial
negotiations (contracts) with the hope that increasing numbers of supplier companies will join
this initiative.
Millenium Development goals
The Millennium Development Goals are
the eight United Nations objectives that
all 191 member states of the UN are com-
mitted to achieving by 2015:
1. Eradicate extreme poverty and hunger;
2. Achieve universal primary education;
3. Promote gender equality and women’s
independence;
4. Reduce infant mortality;
5. Improve mothers’ health;
6. Fight HIV/AIDS, malaria and other dis-
eases;
7. Guarantee environmental sustainability;
8. Develop a world development partner-
ship.
Snam, due to the nature of its business, is
particularly committed to the seventh goal,
guaranteeing environmental sustainability,
with a specifi c focus on safeguarding envi-
ronmental resources and biodiversity.
Snam Sustainability Report 2011 / Global Compact

8 Snam Bilancio di Sostenibilità 2011 8
Sustainability is an integral part of the business
model of Snam and is a guiding element
in making strategic and operational decisions
for the Company, and at the same time
it is instrumental in ensuring responsible growth
over the medium and long term.
SUSTAINABILITy INDICES

99
This has enabled Snam’s shares to be included, over the past few years, in the main interna-
tional stock exchange sustainability indices, consequently increasing the Company’s visibility
among socially responsible investors and with the entire financial market in general.
In 2011, Snam shares joined the Stoxx Global ESG Leaders indices, a new group of indices
based on a transparent performance selection process, in terms of sustainability, of 1,800 list-
ed companies worldwide. The indices are managed by STOxx, owner of some of the most
important international stock indices, such as the STOxx50. Snam’s shares have been included
not only in the global index, but also in two sub-indices on the environment and governance.
Overall, 14 Italian companies are included in the index.
For more information on the scores and ratings earned by Snam, go to http://www.snam.it/it/sostenibilita/area-economica/investimenti-socialmente-responsabili/index.html
Snam Sustainability Report 2011 / Sustainability indices
SuSTAInABILITy InDICES
70
60
80
90
100
110
120
jan-
11
mar
-11
apr-
11
may
-11
jun-
11
jul-1
1
aug-
11
sep-
11
oct-
11
nov-
11
dec-
11
feb-
11
Snam FTSEMIB DJ World
TREnD Of ThE SnAM STOCk AnD PRInCIPAL EThICAL InDICATORS
2002 2005 2009 2011

10 Snam Bilancio di Sostenibilità 2011 10
Through its activities, Snam provides an energy
source with a low environmental impact that
has always supported the country’s civil and
industrial development.
THE SNAM GROUP

11Snam Bilancio di Sostenibilità 2011
IDEnTITy
Snam is Europe’s top operator in integrated infrastructure management in the regulated gas
sector. It is present in natural gas transportation, regasification, storage and distribution, and
it boasts major gas infrastructure throughout almost all of Italy. Snam has the ability to ex-
ecute major local works, capable of ensuring that the country has secure gas supplies and
full-capacity storage facility operation thanks to its unique knowledge of managing an inte-
grated national gas system. The Company has been listed on the Milan Stock Exchange since
December 2001, and Snam shares are included both in the FTSE MIB Italian index and in the
European sector-based Stoxx 600 Utilities index.
As a result of the Legislative Decree through which our country, in choosing functional auton-
omy in the transportation segment, implemented the European Union’s Third Energy Package,
Snam has changed its corporate structure, at the same time strengthening its characteristics
of specialisation and independence, and continuing to preserve the efficiencies achieved fol-
lowing the Stogit and Italgas acquisitions, which took place in 2009. The new corporate struc-
ture, accompanied by a review of the group’s entire identity system, is the consequence of the
switch from three to four operating companies, one for each business activity, which are re-
sponsible for strategies and results, joined under a corporate in charge of exercising guidance,
coordination and control functions, and of providing service in observance of unbundling rules.
With the new structure, the internal organisation has also changed at the companies, which
are now all equipped with their own structures for interfacing with customers (sales) and sup-
pliers (procurement). The Independent Transmission Operator (ITO), Snam Rete Gas, has also
become autonomous in managing HR (Human Resources), ICT (Information and Communica-
tion Technology) and legal affairs.
12
The new brand
Among the specifi cs provided for by the
Legislative Decree implementing the Third
Energy Package is a provision for the Inde-
pendent Transportation Operator to adopt
autonomous communication and branding
policies.
This has given Snam the opportunity to re-
defi ne its entire identity system and create
a new brand. The graphic result is a rework-
ing of the group’s historic logo from the
1940s, which emphasises Snam’s strategic
role, retaining the distinctive features and
the value system of the original. The logo
refers to the network infrastructure, and its
linear elements restore a formal equilibrium
that is intended to convey the idea of the
stability of a player whose assets have had
signifi cant value for the country in terms of
security, reliability, and development. The
colours chosen are blue, traditionally used
to emphasise the natural essence of meth-
ane gas, and different shades of grey, to
show the physical element of infrastructure
and technology.
Ten years on the Stock Exchange
On 6 December 2001, Snam Rete Gas, now
Snam, celebrated its debut on the Milan
Stock Exchange. Throughout this period, the
Company has notched up a success story in
terms of both creating value for sharehold-
ers and developing the countrywide system.
In the decade from 2001-2011, the trans-
portation network went from 29,600 km to
almost 31,700 km, transportation capacity
increased by 50%, and the volume of gas
transported grew from about 70 billion cu-
bic metres in 2001 to over 83 billion cubic
metres in 2010.
Since listing on the Stock Exchange, Snam
Rete Gas has always closed its fi nancial year
with a profi t and distributed dividends. In
10 years as a listed company, it has distrib-
uted approximately 4.7 billion in dividends,
corresponding on average to about 73% of
net profi ts. Investors who subscribed for the
shares at the time of the initial offering have
earned a return of about 150%.
This massive effort has made it possible to
meet the country’s need to have a gas system
that is more secure and more fl exible in terms
of supply and to ensure attractive and sustain-
able returns for shareholders, while remaining
well rooted in the culture of sustainable devel-
opment, paying the utmost heed to security
and quality in the provision of services.
Snam Sustainability Report 2011 / The Snam group

13Snam Sustainability Report 2011 / The Snam group
PASSO GRIES
TARVISIO
GORIZIA
MAZARADEL VALLO
GELA
PANIGAGLIA
CAVARZERE (LNG regasification)
SNAM RETE GAS
GNL ITALIA
National Transportation Network
Compression station
Regasification terminal
Entry points
STOGITStorage fields
ITALGASMunicipalities under concession
SnAM gROuP AS AT 1 JAnuARy 2012
InfRASTRuCTuRE
Snam S.p.A.
Transportation 100% Regasification 100% Storage 100% Distribution 100%

14
ACTIvITIES AnD OPERATIng DATA
2011 2010 Change
Transportation
The transportation business takes delivery of gas at delivery points located in connection with natural gas importation lines from Russia, Northern Europe and North Africa, with regasification plants and with gas production and storage centres located in Italy. The gas is then transported to be delivered, based on customer instructions, at redelivery points connected to local distribution networks and to major industrial and thermoelectric users.
Snam Rete Gas manages the network of gas pipelines through 8 districts, 54 maintenance centres spread out throughout Italy, 11 gas compression stations and a dispatching centre.
Pipeline transportation network(km in operation)
32,010 31,680 1
Installed power in compression stations (MW)
884 861 2.7
gas injected into the network (billions of cubic metres)
78.30 83.31 -6
Regasification
Regasification is the last activity in the so-called liquefied natural gas (LNG) chain, and it consists of returning to its natural state the gas extracted from deposits and then liquefied at a temperature of -160° to allow it to be transported on specially built tankers. In the gas system, the liquefied natural gas chain thus allows supply sources to be diversified.
Snam manages the Panigaglia (La Spezia) regasification plant, the first plant of its kind in Italy, built in 1971.
number of methane tankers unloading
50 54 -7.4
Regasification of Lng(billions of cubic metres)
1.89 1.98 -4.5
Storage
Natural gas storage involves injecting gas into the porous rock of an exhausted deposit that previously contained it, bringing the deposit back, to a certain extent, to its original state. Once stored, the gas can be reintroduced into the transportation system and supplied according to market demand. In the gas system, storage makes it possible to offset the difference between gas supply and demand and therefore to ensure continued supply.
Stogit manages eight active storage fields on a concession basis in Italy – located in Lombardy, Emilia-Romagna and Abruzzo – consisting of deposits, wells, conduits, treatment plants, compression stations, and an operational dispatching system.
Storage capacity(billions of cubic metres)
10.0 9.2 8.7
natural gas moved through the storage system(billions of cubic metres)
15.31 15.59 -1.8
Distribution
The distribution service consists of carrying gas from transportation network connection points to points for redelivery to end customers. The service is performed on behalf of the sales companies authorised to sell gas.
Italgas manages an integrated infrastructure system primarily owned by it, comprising stations for withdrawing gas, local gas pipelines, pressure reduction stations and redelivery points where gas meters are installed, overseen 24 hours a day, 365 days a year, by the Integrated Supervision Centre.
Pipeline distribution network (km)
50,307 50,307 0.01
gas distribution concessions (number)
1,449 1,448 0.1
Active meters(millions)
5,897 5,848 0.8
gas distribution(billions of cubic metres)
7.45 7.95 -6.3
Snam Sustainability Report 2011 / The Snam group

15
EThICS AnD CORPORATE gOvERnAnCE
Snam’s corporate governance system is based on the principles contained in the Corporate
Governance Code for Listed Companies proposed by the Committee for the Corporate Govern-
ance of Listed Companies, with recommendations from the national financial regulator (Con-
sob) on this topic and, more generally, taking into account international best practices.
Snam’s choices in this regard are made with the awareness that the rules of operation of the
management and oversight bodies defined by the system must safeguard investors’ interests,
preserve the balance of power, avoiding the occurrence of conflicts of interest, and be capable
of having an effect on the expectations of the other stakeholders. For this purpose, the system
pays special heed to observance of unbundling regulations, considering the specifics of the ac-
tivities engaged in by Snam and its subsidiaries, which are subject to regulation by the Author-
ity for Electricity and Gas and in particular the rules on functional separation.
The validity of the corporate governance system with respect to all requirements is one of the
main evaluation criteria in the scores assigned by the different sustainability rating agencies.
Detailed information on Snam’s corporate governance system is included in the “Report on
corporate governance and the ownership structure”, which is available on the website (www.
snam.it).
Snam Sustainability Report 2011 / The Snam group

1616
Board of Directors and Committees
The Board of Directors of Snam is made up of 9 directors (3 appointed by minority shareholders),
of which 5 are independent and 8 non-executives. During 2011, it met 9 times.
The Board is vested with the broadest powers for ordinary and extraordinary administration of the
Company, including exclusive responsibility for defining the strategic guidelines and objectives and
the approval of the respective business and financial plans. The powers that are not reserved for
the Board of Directors or for the Chairman pursuant to law, the Articles of Association or a Board
resolution are delegated by it to the Chief Executive Officer of the Company.
In order to carry out its functions more effectively, the Snam Board of Directors has created four
committees within its ranks:
•InternalControlCommittee;
•CompensationCommittee;
•NominationsCommittee;
•TheCombinedIndependentCommittee.
The first three committees are provided for by the Code of Corporate Governance and operate in
accordance with its instructions.
The Combined Independent Committee is the collegiate body created for joint management of
regulated activities involving natural gas transportation, dispatching, distribution, storage and re-
gasification.
This body, made up of the chief executive officers of all the companies in the group, has received
all powers from the Board of Directors of the parent company for the execution of its duties and
works according to its own regulations.
The Board of Directors has reserved a central role for itself in defining sustainability policies and
in approving the Sustainability Report, which is also brought to the attention of the Shareholders’
Meeting.
Code of Ethics and Model 231
Snam and its subsidiaries have implemented the Company’s rules of corporate administrative re-
sponsibility by adopting their own organisation, management and oversight model in accordance
with Legislative Decree No. 231/2001, tailored to their own specifics. Each company has appoint-
ed its own Supervisory Body in charge of monitoring the model’s implementation and its actual
application.
The Code of Ethics adopts the most modern approach to corporate ethics and sustainability, which
is wholly consistent with the objective of implementing all of the values that the Company recog-
nises, accepts and shares, and the responsibility that it assumes both internally and externally.
Added to the Snam Code of Ethics is a specific Addendum, which takes into account the specifics
of the activities carried out by Snam and its subsidiaries, which are subject to regulation by the
Authority for Electricity and Gas. Particular importance is given to relations with the Authority for
Electricity and Gas and to the unbundling regulations.
Snam employees, regardless of position and without exception, are required to comply with and
ensure compliance with these standards.
In July 2011, the Code of Ethics and Model 231 were updated, for purposes of implementing the
legislative changes introduced on crimes of forging money, public credit cards and tax stamps or
distinctive signs, computer crime and unlawful data processing, organised crime offences, crimes
against industry and commerce, copyright crimes, and crimes against the administration of jus-
SO2
Snam Sustainability Report 2011 / The Snam group

1717
tice. In February 2012, as a result of the reorganisation of the Snam group following the imple-
mentation of the provisions of Legislative Decree No. 93/2011, as well as the introduction of
environmental crimes into the body of Legislative Decree No. 231/2011, a new draft of Model
231 was approved.
Internal control system
Responsibility for the internal control system lies with the Board of Directors, which, with
the assistance of the Internal Control Committee, sets its guidelines and periodically au-
dits its suitability and actual functioning in order to ensure that the main corporate risks are
identified and properly managed. The CEO is charged with implementing the guidelines formu-
lated by the Board of Directors by planning, managing and monitoring the internal control system.
Auditing the suitability of the system falls to Internal Audit, which carries out its duties maintain-
ing relations with the Internal Control Committee, the Supervisory Body, the Board of Statu-
tory Auditors and the company in charge of auditing the financial statements. Internal Au-
dit also sees to handling reports received for any reason from Snam and all of the subsidiaries.
ACTIvITIES CARRIED OuT By InTERnAL AuDIT 2010 2011
Total number of audits performed 51 48
Reports received 26 22
…those involving the Internal Control System 10 8
…those involving accounting, auditing, fraud, etc. 0 0
…those involving administrative responsibility pursuant to Legislative Decree No. 231/2001
0 0
…those involving violations of the anti-corruption law 1*
…those involving other subjects (Code of Ethics, mobbing, thefts, security, etc.) 16 13
Reports shelved due to lack of proof or because untrue (No.) 16 11
Reports ending with corporate disciplinary or managerial interventions and/or submitted to the judicial authorities
0 5
Reports in the process of examination (No.) 6 6
* The report concerns the activity of a subcontractor which, in view of the checks made, has been removed from the vendor list
Anti-corruption guidelines
Snam has given primary importance for a long time to the fight against corruption. The Snam
Board of Directors has adopted “Anti-Corruption Guidelines”. The purpose of the Guidelines is
to protect and promote Snam’s reputation by introducing a specific system of rules designed
to ensure that the Company complies with the best international standards in the fight against
corruption.
In this area, the Company has also changed its organisational structure with the establishment
of the Anti-Corruption Unit, within the Legal and Corporate Affairs and Compliance Department,
whose goal is to change existing procedures where necessary and promote both the adoption of
new regulations by subsidiaries and sensitising and training staff to be aware of and comply with
the Anti-Corruption Guidelines.
SO2
SO2
SO4-hR4
Snam Sustainability Report 2011 / The Snam group
Activities carried out by Internal Audit

18
STAkEhOLDERS
Building consensus and trust with all stakeholders is a key factor for Snam in developing its
role as a responsible company. Dialogue, debate and inclusion are the foundations on which it
seeks to build a relationship with stakeholders that is sustainable over the long term.
The Company maintains transparent and constant relations with investors, entities, institu-
tions and companies through a system of engagement articulated at every company level.
Snam Sustainability Report 2011 / The Snam group
2011 stakeholders’ identity card
PEOPLE
MAP Of STAkEhOLDERS
643 Women
5,469 Men
1,273 Centre
3,233 North
1,606 South and Sicily
643 Women
5,469 Men
1,273 Centre
3,233 North
1,606 South and Sicily
Snam
Suppliers Investors
Authoritiesand
InstitutionsPeople
Customers
Communityand territory
LA1-EC7 group staff: 6,112
Type of employees Distribution of employees by geographical area
1919Snam Sustainability Report 2011 / The Snam group
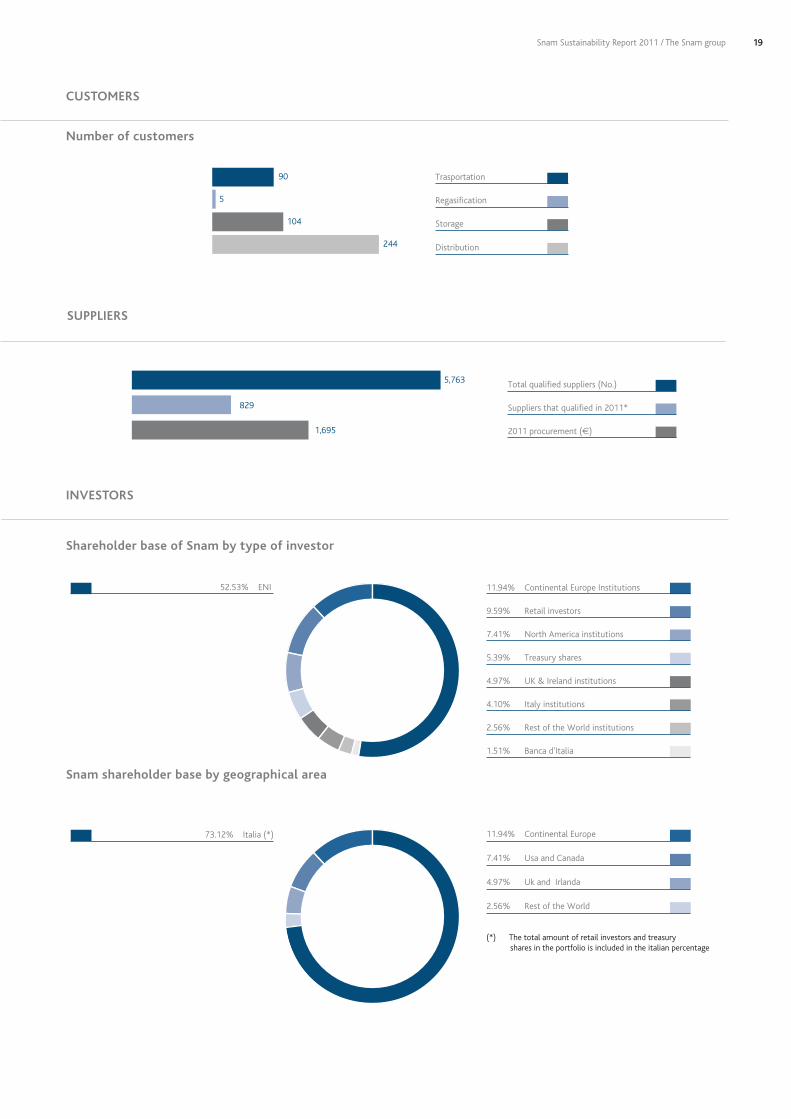
73.12% Italia (*)
52.53% ENI
1.51% Banca d'Italia
5.39% Treasury shares
11.94% Continental Europe Institutions
4.97% UK & Ireland institutions
4.10% Italy institutions
7.41% North America institutions
2.56% Rest of the World institutions
9.59% Retail investors
11.94% Continental Europe
4.97% Uk and Irlanda
7.41% Usa and Canada
2.56% Rest of the World
(*) The total amount of retail investors and treasury shares in the portfolio is included in the italian percentage
CuSTOMERS
number of customers
SuPPLIERS
InvESTORS
90
5
104
244
Storage
Regasification
Trasportation
Distribution
5,763
829
1,695 2011 procurement (€)
Suppliers that qualified in 2011*
Total qualified suppliers (No.)
Shareholder base of Snam by type of investor
Snam shareholder base by geographical area

20 Snam Sustainability Report 2011 / The Snam group
COMMunITIES AnD TERRITORy
AuThORITIES AnD InSTITuTIOnS
Snam group - local sites per region (no.)
Authorities and
institutions
Ministries
Public safety bodies
Provinces
PrefecturesResearch Centres and Committees
Judicial authorities
Regulatory Committees
Consob and Borsa Italiana
Authority for Electricity and gas
Competition Authority
Authority for Oversight of government
Contracts
Municipalities
Basin Authority Mountain Communities
Park EntitiesPort Authorities
Inspection and oversight entities
Regions
Schools and
universities
government and Parliament
Entsog, European Commission, ACER
Revenue Agency and Customs
Agency
Intervening or intervened entities
Abruzzo
Basilicata
Calabria
Campania
Emilia Romagna
Friuli Venezia Giulia
Lazio
Liguria
Lombardia
Marche
Molise
Piemonte
Puglia
Sicilia
Toscana
Veneto
Valle d’Aosta
Umbria
Trentino Alto Adige
0 25 50 75 100 125 150 175 200 225 250 300
53
31
234
132
19
74
179
62
104
51
21
268
40
102
10
2
31
36
77

21
Distribution of added value
In 2011, Snam distributed to its stakeholders an overall amount of €2,394 million (€2,250 mil-
lion in 2010), corresponding to the sum of the added value produced (€2,373 million), or 67%
of revenue, and the resources drawn by the company system (€21 million). Of this amount,
37.84% was distributed to the government (€906 million), 33.88% to shareholders (€811 mil-
lion), 17.34% to employees (€415 million) and 10.94% to lenders (€262 million).
The net overall added value was therefore distributed among different beneficiaries as follows: (i)
employees (direct compensation comprising salaries, wages and post-employment benefits, and
indirect compensation consisting of social security expenses, as well as costs for staff services
(meal services, travel expense reimbursement, etc.); (ii) government (income tax); (iii) lenders
(interest on loan capital disbursements); (iv) shareholders (dividends distributed).
gLOBAL ADDED vALuE (€ millions) 2010 2011
Core business revenues 3,475 3,539
Other revenues and income 33 66
Purchases, provision of services and other costs * 596 631
Net financial expenses 120 88
Net incomes on equity investments 47 51
Increases due to internal works – Cost of work and financial expenses 89 90
gROSS gLOBAL ADDED vALuE 2,928 3,027
for deduction
Amortisation and depreciations 678 654
nET gLOBAL ADDED vALuE 2,250 2,373
* Net of costs allocated to investment.
10.94 Lenders
37.84 Government
33.88 Shareholders
17.34 Employees
EC1
Snam Sustainability Report 2011 / The Snam group
BREAkDOWn Of ADDED vALuE (%)
22 Snam Bilancio di Sostenibilità 2011
Communications and media
Transparent and accurate communication is the foundation of dialogue with stakeholders
and bolsters the corporate citizenship of organisations that interact with local areas and
communities in their business.
For Snam, communication is not only a business support, but the best tool for increasing
the value of its sustainable approach across all its activities. Commitment to the needs of
different stakeholders, proactivity in offering success stories, and satisfying media requests
as soon as possible are the pillars supporting Snam’s communications, from a standpoint of
mutual gain for itself and for all its stakeholders.
The intrinsic value of corporate communications is thus developed and cultivated in every
individual action and through each individual communication medium, including new media,
out of the strong conviction that an activity based on dialogue and openness is not only an
opportunity for creating additional value, but an indispensable modus operandi for observ-
ing the principles of consistency, transparency and propriety that distinguish Snam’s daily
operations.

2323
Corporate identity
During 2011, Snam completed the impor-
tant activity of reviewing the group’s web
identity. Begun in 2010, the activity was
completed on 1 January 2012 when 9 com-
pletely revamped websites went online.
The entry of Stogit and Italgas into the
group, the implementation of the ITO (In-
dependent Transmission Operator) model,
which led to a broader corporate reorgani-
sation, and the introduction of the new
brand identity, together with willingness
to dialogue with stakeholders in a clear,
direct and transparent manner, were the
driving force for asserting a new corporate
web identity capable of representing the
scope of the change that has taken place.
After some new developments introduced
between April and July 2010, the key
points of Snam’s new web identity includ-
ed revising content, new landing pages, a
header representing Snam’s segment and
an interactive box common to all the sites.
These new elements are now common
to four sites (Snam Rete Gas, GNL Italia,
Stogit and Italgas) which were hetero-
geneous in terms of technology, content
and graphics. The new web identity, which
refl ects the Company’s organisational
change, was defi ned after initial in-depth
benchmarking with competitors/peers and
identifying cross-sector best practices. To
the four “operational” sites, correspond-
ing to Snam’s four businesses and broken
down primarily according to customer/
user needs, a fi fth “corporate” site was
therefore added (www.snam.it), which of-
fers institutional information and is geared
toward shareholders, analysts, media and
authorities.
Besides asserting the new corporate web
identity, the site review also targeted im-
proving access to content, offering new
services and identifying a single techno-
logical platform. The introduction of a
fl exible technological solution, such as the
common Content Management System
(CMS), capable of managing content publi-
cation methods in a more structured man-
ner, has also made it possible to speed up
publication times, providing a modular ap-
proach that is consistent across all the sites.
The success of Snam’s new web identity
approach is confi rmed by the results pub-
lished in the annual study, KWD Webrank-
ing (previously known as H&H Webrank-
ing), which this year published its tenth
edition, examining the corporate web
communications of the 101 largest Italian
companies by capitalisation. Snam held
seventh place for the fourth year running,
with a score of 76, while in the fi fteenth
edition of KWD Webranking Europe 500,
a European ranking that analyses the 500
largest companies by capitalisation taken
from the FT Europe 500 ranking, Snam
ranked eleventh, three places higher than
the previous year.
In Lundquist CSR Online Awards Italy
2011, a study which has analysed online
CSR communications in Italy for four years
now, Snam went from ninth to eighth, with
an increase of 7 points, confi rming the va-
lidity of the group’s web policy from the
standpoint of clear, transparent and direct
dialogue with all its stakeholders.
The Filibro 2012 calendar continued the
three-year project aimed at interpret-
ing the calendar concept in an innovative
manner: a sort of fusion of genres that
makes the work distinctive and capable
of describing the Snam of today and, in
particular, what it will become in the fu-
ture. The four installations corresponding
to the Filibro panels were the subject of
an exhibit held between December 2011
and January 2012 at the Leonardo da Vinci
National Museum of Science and Technol-
ogy in Milan.
Snam Sustainability Report 2011 / The Snam group

24 Snam Bilancio di Sostenibilità 2011
DEVELOPMENT AND
SUSTAINABILITy
Blending corporate ethics and sustainability
principles into strategic thinking, governance
systems and daily actions by continually seeking
new ways to create value is a key factor for Snam
to be recognised as a driver of sustainable
development
25Snam Bilancio di Sostenibilità 2011
SuSTAInABILITy In BuSInESS
Environmental sustainability and social responsibility are among the fundamental aspects of
the manner in which Snam creates value for itself and for its stakeholders, and they therefore
represent an integral part of defining strategic and operational corporate choices. Sustainabil-
ity helps to manage business risks, improve performance and enhance the Company's reputa-
tion and intangible assets.
Integrating sustainability and business takes place through planning and control procedures and
tools that feed into the cycle of continuous improvement. At the basis of this management sys-
tem, which has been extended to the entire corporation and is currently undergoing a consolida-
tion phase, there is the periodic updating of “Areas for Improvement of Sustainability”, approved
by corporate management in September 2011 and valid for the 2012-2015 period, with the sub-
sequent identification, by different corporate functions, of the initiatives and projects relative to
areas to be included in the Corporate Plan. Areas for improvement are grouped into four macro
areas: Governance, People, Stakeholder engagement and Environment.
The state of progress of the projects and the achievement of planned goals with their respec-
tive targets are monitored by the Snam sustainability function, which is also responsible for
preparing reports for stakeholders through the annual publication of the Report and the up-
dating of the content in the sustainability section on the website.

26
gOvERnAnCE Areas for improvement Actions (2010-2011 and in progress) kPIIn this Report
Sustainability model Ensuring adequate oversight of sustainability issues at all Snam companies, in line with Snam’s governance and guidelines
• “SustainabilityActivities”procedureissued•Operatinginstructionsforgatheringdataandforreporting
updated• Keysustainabilityindicators(KPIs)reviewed
24-31
Business ethics Updating the Code of Ethics and disseminating the principles set out in the Code (and in Model 231) within the group, developing training courses for staff
• Created“Team231”,whichwillhandletheupdating of the respective model
• “Anti-CorruptionGuidelines”adoptedbytheBoardofDirectors• CreatedAnti-CorruptionLegalSupportUnit• ActiveparticipationbySnamintheworkinggrouponhuman
rights sponsored by the Global Compact Network Italy
15-17
Risk & Crisis management
Implementing integrated group risk management, including ethical, social and environmental risks
• DevelopmentandimplementationofBusinessContinuityproject
36-37
PEOPLE Areas for improvement Actions (2010-2011 and in progress) kPIIn this Report
Training Increasing the wealth of abilities and skills and maintain a high degree of staff involvement
•Morethan187,100hoursoftrainingprovidedin2011tomorethan 16,400 participants
• Involved90%ofthecorporateworkforce
72-73
health and safety Reducing accident rates through an integrated programme and implementing H&S management systems
•Morethan30,000hoursofHSEtrainingprovidedin2011• Continuedtheactivitiesinthethree-year“ObjectiveSafety”
programme• ContinuedtheimplementationofH&Smanagementsystems
at Stogit and GNL Italia with the goal of certifying them in 2012
• Instituted“DistrictHSETeams”• Performed359HSEQauditsatoperatingunits• Activitiesareunderwaytomakeacomputerapplication
to support H&S processes
78-82
valuing people Implementing growth tracks and identify specific assessment methodologies based on role and seniority, also taking into account geographic mobility
• Aspecifictwo-yeartraineeprogrammewasbegun for university graduates just entering the workforce
• The“PeakPerformance”projectforoperationheadswasbegun• Preparedthe“360°Outlook”initiativeforthedevelopment
of managers under 40
72-77
Internal communications / Listening to people
Implementing communication and interaction tools and carrying out a group-wide climate survey
• Groupintranetplatformcreated• Continuedpublishingthe“Energia”newsletterdistributed
to all employees• Heldmeetingsplannedunderthe“Sapernedi+”initiative
to disclose values and strategies to the corporate workforce
82-83
Corporate welfare Studying and carrying out initiatives to benefit employees
• Increasedagreementsforemployeesindifferentsectors(entertainment, culture, sports, travel and hotel stay deals)
76-77
COMMITMEnTS AnD ACTIOnS
KPIs pre-established with quantitative target
Snam Sustainability Report 2011 / Development and sustainability

27
KPIs pre-established with quantitative target
STAkEhOLDER EngAgEMEnT
Areas for improvement Actions (2010-2011 and in progress) kPIIn this Report
Engagement model Actions for involvement by type of stakeholder and enhancing communication with the media
• Specificinitiativesforsuppliersandforcommunities and territory were implemented
• Completedtherestylingofthewebsites of all group companies
18-20,
26-28
Philanthropy Defining an overall strategy consistent with business activities and launching initiatives on the subject
• Developedastructuredinternalsharingprocessthatmadeit possible to carry out an engagement plan with non-profits (scouting, workshops and selection).
• Held“VolunteeringWeek”,whichinvolvedstaffatSanDonatoMilanese and Turin sites
• Thespecificprocedurefornon-profitinitiativesisintheprocessof being approved
49-50,
84-85
Communities and Territory
Implementing actions for dialogue and involvement
• Carriedoutapilotstudyforevaluatingthesocioeconomicimpact of works
• Carriedoutapilotsurveyonsatisfactionwithinfrastructureexecution
• InstitutedaninformationboothintheBordolanoTownHall for the new storage project
• Continuededucationalmeetingsatschools• Organisedopendaysatsomeplants
48-52
Institutions Defining guidelines on relations with the government
• Thespecificprocedureisintheprocessofbeingapproved
Shareholders Increasing information for institutional and retail investors
• Continuedactivityforcommunicatingwiththefinancialmarket (roadshows, sector conferences, group and one-to-one meetings)
43-44
Customers Implementing sales process quality, traceability and transparency
• ObtainedISO9001certificationforthetransportation capacity process
• Upgradedwebsitesformanagingtransportationcapacity and storage capacity
• Heldameetingwithrepresentativesoftransportationandstorage service users to share new operating developments introduced to the websites
• Conductedacustomersatisfactionsurveyforthestoragebusiness
41-43
Suppliers Extending sustainability best practices along the supply chain
• RequestedcertificationofHSEQsystemsfromnewstrategicsuppliers
• ProvidedforcertificationofHSEQsystemsby2012 for existing strategic suppliers
• OrganisedtheSuppliers’DayforSustainability, with the participation of about 75 companies
• DisseminationoftheprinciplesoftheGlobalCompactbyupdating contractual documentation for all group companies
45-47
Snam Sustainability Report 2011 / Development and sustainability
28
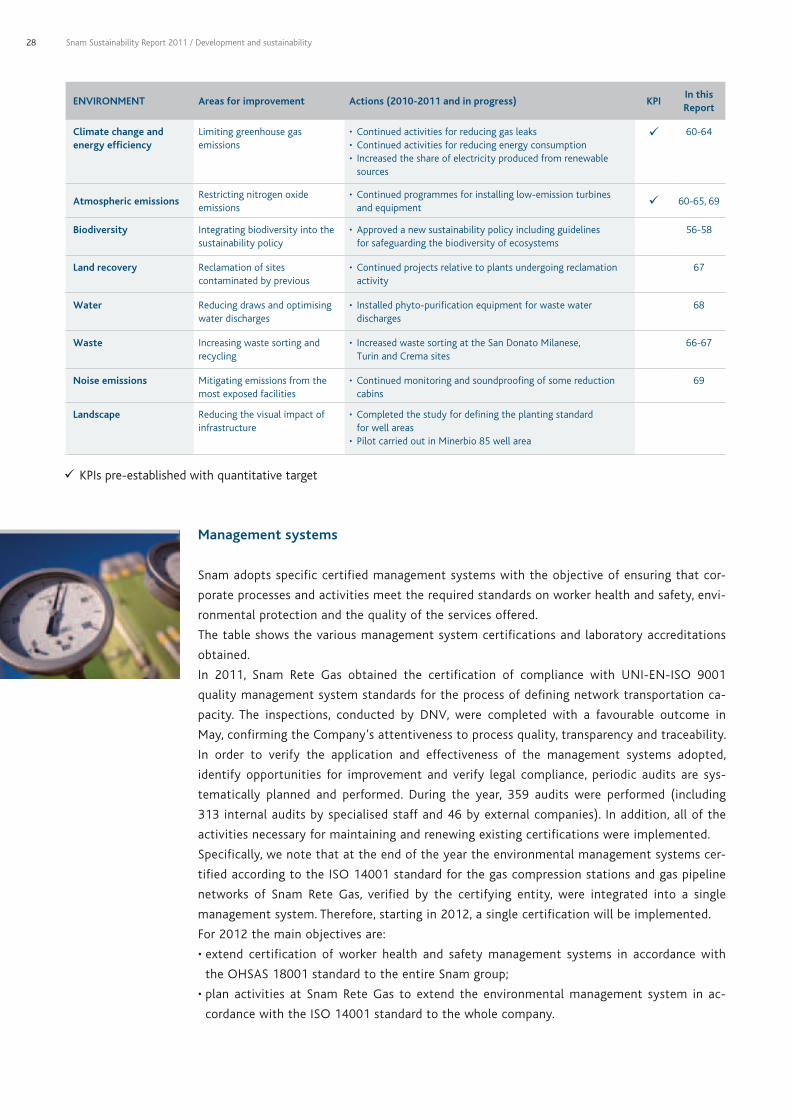
EnvIROnMEnT Areas for improvement Actions (2010-2011 and in progress) kPIIn this Report
Climate change and energy efficiency
Limiting greenhouse gas emissions
• Continuedactivitiesforreducinggasleaks• Continuedactivitiesforreducingenergyconsumption• Increasedtheshareofelectricityproducedfromrenewable
sources
60-64
Atmospheric emissionsRestricting nitrogen oxide emissions
• Continuedprogrammesforinstallinglow-emissionturbines and equipment 60-65, 69
Biodiversity Integrating biodiversity into the sustainability policy
• Approvedanewsustainabilitypolicyincludingguidelines for safeguarding the biodiversity of ecosystems
56-58
Land recovery Reclamation of sites contaminated by previous
• Continuedprojectsrelativetoplantsundergoingreclamationactivity
67
Water Reducing draws and optimising water discharges
• Installedphyto-purificationequipmentforwastewaterdischarges
68
Waste Increasing waste sorting and recycling
• IncreasedwastesortingattheSanDonatoMilanese, Turin and Crema sites
66-67
noise emissions Mitigating emissions from the most exposed facilities
• Continuedmonitoringandsoundproofingofsomereductioncabins
69
Landscape Reducing the visual impact of infrastructure
• Completedthestudyfordefiningtheplantingstandard for well areas
• PilotcarriedoutinMinerbio85wellarea
KPIs pre-established with quantitative target
Management systems
Snam adopts specific certified management systems with the objective of ensuring that cor-
porate processes and activities meet the required standards on worker health and safety, envi-
ronmental protection and the quality of the services offered.
The table shows the various management system certifications and laboratory accreditations
obtained.
In 2011, Snam Rete Gas obtained the certification of compliance with UNI-EN-ISO 9001
quality management system standards for the process of defining network transportation ca-
pacity. The inspections, conducted by DNV, were completed with a favourable outcome in
May, confirming the Company’s attentiveness to process quality, transparency and traceability.
In order to verify the application and effectiveness of the management systems adopted,
identify opportunities for improvement and verify legal compliance, periodic audits are sys-
tematically planned and performed. During the year, 359 audits were performed (including
313 internal audits by specialised staff and 46 by external companies). In addition, all of the
activities necessary for maintaining and renewing existing certifications were implemented.
Specifically, we note that at the end of the year the environmental management systems cer-
tified according to the ISO 14001 standard for the gas compression stations and gas pipeline
networks of Snam Rete Gas, verified by the certifying entity, were integrated into a single
management system. Therefore, starting in 2012, a single certification will be implemented.
For 2012 the main objectives are:
•extend certification of worker health and safetymanagement systems in accordance with
the OHSAS 18001 standard to the entire Snam group;
•plan activities at Snam ReteGas to extend the environmentalmanagement system in ac-
cordance with the ISO 14001 standard to the whole company.
Snam Sustainability Report 2011 / Development and sustainability

29
Company field of applicationType of certification
and accreditationyear of initial certification
Snam Rete gas Compression stations (11 facilities) ISO 14001 2001
Snam Rete gasGas pipeline network (8 districts, 54 maintenance centres, and 32,010 km of gas pipelines)
ISO 14001 2008
Snam Rete gas Dispatching of natural gas ISO 9001 2003
Snam Rete gasNatural gas metering service, transportation network, and management of the design and construction of metering apparatus
ISO 9001 2009
Snam Rete gas Company OHSAS 18001 2010
Snam Rete gas Defining network transportation capacity ISO 9001 2011
Snam Rete gas Calibration of natural gas mixtures ISO 17025 (ACCREDIA) 2002
Snam Rete gas Piped gas flow emissions analysis tests ISO 17025 (ACCREDIA) 2007
STOgIT Company ISO 14001 2002
STOgIT Natural gas metering and accounting service ISO 9001 2008
gnL Italia Regasification plant ISO 14001 2000
ITALgAS Company ISO 14001-ISO 9001-OHSAS 18001 2001
napoletana gas Company ISO 14001-ISO 9001-OHSAS 18001 2003
TOWARD ThE CREATIOn Of ShARED vALuE
The previous edition of the Sustainability Report included some points for reflection in connec-
tion with dialoguing with stakeholders on evaluating the shared value that the Company already
produces through its practices and know-how, and how it may be articulated. This means starting
an approach within a process of continual improvement to combine interpreting sustainability
from a “value protection” standpoint, i.e. mitigating operational and reputational risks, with an
approach geared more toward “value creation,” as a driver of innovation, with express reference
to the concept of “shared value creation” theorised by Michael Porter and Mark Kramer.
With this reflection as a starting point, a project was begun in late 2011 aimed at a more in-depth
methodological understanding of the concept of shared value and at evaluating its applicability at
Snam. In the early months of 2012, specific internal meetings were organised to share the project,
which led to identifying different possible current projects and potential new initiatives.
This project is on a path of natural continuity with the sustainability initiatives implemented in
the last two-year period, starting with the mapping of stakeholders and the engagement projects
deriving from it, including the Social Impact Assessment, the Supplier's Day Sustainability, the
same engagement strategy with non-profit organisations and still others that are described in
this Report.
The shared value project and its main conclusions are stated in the document “Toward shared
value” that accompanies the 2011 Sustainability Report.
Snam Sustainability Report 2011 / Development and sustainability

30
“Creating Shared value”, by Michael E. Porter and Mark R. kramer
The shared value approach, conceived by
Michael Porter, a professor at Harvard Busi-
ness School where he heads up the Institute
for Strategy and Competitiveness, in collab-
oration with Mark Kramer, senior fellow of
the CSR Initiative at Harvard’s John F. Ken-
nedy School of Government in Cambridge,
Massachusetts, explores the link between
the economic system and society. The con-
cept, published for the fi rst time by the
Harvard Business Review in January 2011,
is based on the assumption that, in light of
the recent fi nancial and economic crises,
capitalism is under attack and therefore it is
necessary to identify a new model capable
of reinventing it.
The starting point is that no company is an
isolated entity. The success of all companies
is infl uenced by the support services and in-
frastructure surrounding them; productivity
and innovation are strongly infl uenced by
the logistical infrastructure of a given local
area. Players operating in a local area can
create conditions for a context favourable
to business development. On the other
hand, a healthy social and local context de-
pends on the presence of companies that
are capable of providing jobs, offering ad-
equate salaries and wages, acquiring quality
goods and services, paying taxes, protect-
ing the environment, using resources effi -
ciently, etc.
Companies, says Porter, must act to recon-
cile business and society, and the path to go
down is that of “creating shared value”, i.e.
creating economic value in such a manner
as to generate value at the same time not
only for the Company, but also for society,
simultaneously meeting the Company’s
needs and needs of a social nature. It is a
new point of view that involves making the
most of company know-how and reconfi g-
uring relations throughout the value chain.
The concept of shared value in a certain
sense includes the idea of social respon-
sibility applied until now: it serves as an
innovative approach to sustainability that
sees social growth as a central and not
an ancillary objective, write the authors.
“CSR programmes focus mainly on repu-
tation and have only a limited connection
to business, which makes them diffi cult to
justify and maintain over the long term.
On the other hand, the Creation of Shared
Value (CSV) is functional to profi tability
and to a company’s competitive position.
It makes use of a company’s specifi c re-
sources and specifi c expertise to create
economic value through the creation of
social value”.
Snam Sustainability Report 2011 / Development and sustainability

31Snam Sustainability Report 2011 / Development and sustainability
The subject of shared value
is not intended to replace the sustainability
measures in existence at the Company,
but to support and enhance that aspect,
from a standpoint of continuity and
consistency with what is already in place.
In an attempt to follow this approach in its
operations, Snam has made a summary
interpretative model,
which has allowed the group
to review its core and support processes
from the standpoint of shared value.
CORPORATE
COMPETITIVENESS
ShARED
vALuE
DEVELOPMENT
OF TERRITORy
PROTECTION OF REPUTATIONAL
CAPITAL
OPERATING RISK
MITIGATION
BUSINESS
ETHICS
REDUCTION IN NEGATIVE EXTERNAL EFFECTS INCREASE IN POSITIVE EXTERNAL EFFECTS
SuSTAInABILITy 2.0

32 Snam Bilancio di Sostenibilità 2011
A NETWORK SERVING ITALy WITH EyES ON
EUROPE
Snam intends to contribute actively to the creation
of a gas hub system in Southern Europe, turning
Italy into not just a gas consumer, but also a gas
transit country

33Snam Bilancio di Sostenibilità 2011
During the last 40 years, European consumption of natural gas has increased 19-fold and now
accounts for about one third of the primary consumption of fossil energy in OECD Europe (un-
derstood as the original 15 countries, plus the Czech Republic, Hungary, Iceland, Norway, Poland,
Slovakia, Switzerland and Turkey).
Historically, satisfying this demand has been possible due to rapid growth in gas production in
areas neighbouring Europe – the North Sea, Russia and North Africa – connected to consumer
markets mainly through a tight network of high-pressure gas pipelines that have now attained
overall development of approximately 190,000 kilometres, of which more than 100,000 are con-
centrated between France, Germany and Italy. Italy is also a gas producer, having produced 8.03
billion cubic metres in 2011. The fact that domestic demand totalled 77.84 billion cubic metres
last year means that Italy, like all the other OECD Europe states, except Norway and the Nether-
lands, is dependent on gas imports.
Between 2001 and 2008, various geopolitical and economic factors, including competition for
energy resources due to the growth of emerging countries, resulted in a need for Western coun-
tries, and in particular European countries, to stabilise the supply scenario on world markets,
which, just a few years previously, had seen them in a privileged position in terms of the pos-
sibility of purchasing and stockpiling their own supplies. The main driver for pursuing this objec-
tive was identified by the European Union as the development of a more flexible and competi-
tive European market, in which transportation and distribution infrastructure networks can be
developed independently of the contractual sales dynamics of the major integrated operators.
The Third Energy Package was issued in 2009 in response to this.

34
An agreement for the European maxi-network
In January 2012 Snam S.p.A. and Fluxys G
S.A. signed an agreement for the evalua-
tion of future joint strategies aimed at
seizing potential opportunities for devel-
opment in the European gas sector. The
agreement involves natural gas transpor-
tation, storage and regasifi cation activities,
through projects designed to strengthen
supply fl exibility and security in relation to
current European infrastructure. The initia-
tives also involve two-way transport fl ows,
in line with the recommendations and
provisions of the European Third Directive
adopted by the EU Council and Parliament
for an integrated gas market in order to
promote cross-border fl ows and connect
the major gas exchange infrastructure in
North-Western and Southern Europe.
Fluxys G is the top Belgian operator and
the gas hub for Northern Europe. Through
its subsidiary, Fluxys S.A., it builds and
manages natural gas transportation and
storage infrastructure and liquefi ed natu-
ral gas terminals in Belgium.
For detailed information on the content of
the agreement, please see the 2011 fi nan-
cial report.
InvESTMEnTS AnD nETWORk DEvELOPMEnT
For Snam, opportunities for pursuing strategic goals are strongly tied to the possibility of in-
vesting economic resources in network expansion and improvement projects. Snam’s invest-
ments are focused on the procurement of goods, services and technologies and are currently
spread evenly throughout almost all the different Italian regions, resulting in important eco-
nomic growth factors.
The Snam plan for the 2012-2015 four-year period provides for investments in all sectors in
the amount of €6.7 billion at consolidated level:
•the investment in the transportation sector is intended to increase transportation capacity
both by extending the network and by increasing installed capacity at the gas compression
stations;
•theinvestmentinstorageisgearedprimarilytowardincreasingcapacitybyexpandingexist-
ing fields and creating new storage fields;
•the investment in distribution is aimed partly at network maintenance and development,
increasing kilometres of new piping and replacing iron networks, and partly at the develop-
ment of new distributed gas metering systems.
During 2011, almost €1.6 billion in investments were made, of which approximately 73%
were with incentive-based remuneration consistent with ARG/gas Resolution 119/10 issued by
the Authority for Electricity and Gas.
Thanks to its geographical location and due to the development of transportation infrastruc-
ture and reverse flow technology, Italy can seize this opportunity, undergoing a transformation
from consumer country to transit country, thus creating the conditions for playing a strategic
role as Mediterranean Europe’s gas hub.
Snam Sustainability Report 2011 / A network serving Italy with eyes on Europe

35
nORTh
• StrengtheningtransportationinfrastructureinthePadanaValley:- continuation of the construction work on the Poggio Renatico-Cremona methane pipeline in Emilia-Romagna
and Lombardy;- continuation of the construction work on the Cremona-Sergnano methane pipeline in Lombardy;- delivery of materials and continuation of the acquisition of licences for the Zimella-Cervignano methane pipeline
in Veneto and Lombardy.• DevelopmentofthestoragefieldinBordolano(CR)primarilybytheinjectionofcushiongas(minimumindispensable
quantity of gas present or inserted in deposits in the storage phase, which has the function of making it possible to provide the remaining gas volumes without harming the mineral characteristics of the said deposits over time) and projects to increase pressure in the Minerbio, Sabbioncello (FE) and Settala storage fields.
CEnTRE • ConnectionoftheOffshoreLNGToscana(OLT)regasificationterminalinLivorno.• DevelopmentoftheFiumeTreste(CH)storagefield,primarilybytheinjectionofcushiongas.
SOuTh AnD ISLAnDS
• NewtransportationinfrastructureontheAdriaticaxis-continuationoftheconstructionworkforthemainline of the Massafra-Biccari methane pipeline in Puglia and Basilicata.
• StrengtheningtheimportinfrastructureinSicilyandCalabria:- revamping the Enna plant in Sicily;- strengthening of the Montesano plant in Campania;- construction of the Montalbano-Messina methane pipeline in Sicily.
•MethanisationoftheCalabriaRegion–constructionworkformethanepipelinesandrelatedconnections.
MAIn DEvELOPMEnT PROJECTS In PROgRESS
Snam Sustainability Report 2011 / A network serving Italy with eyes on Europe

36
SERvICE SECuRITy AnD COnTInuITy
Natural gas is the energy source used most in Italy, partly due to the environmental benefits
that it is capable of producing if used efficiently in the various sectors. However, gas is also a
product that, due to its chemical and physical characteristics, must be managed and used re-
sponsibly, in order not to create hazardous situations for people and the environment.
Snam adopts and implements principles and international best practices to ensure service
continuity, and promotes the acquisition of certifications of compliance with benchmark in-
ternational standards.
Snam is committed to supplying the gas that companies and communities need on a daily
basis, and to managing all activities in the system safely.
Management of emergencies
If a supply source is interrupted or even in periods of very high consumption, as in the early
days of February 2012, Dispatching intervenes immediately by increasing the use of gas from
storage fields. If, on the other hand, localised or short-term outages or irregularities occur
in the transportation network, part of the gas contained in the network, known as the “line
pack”, is used, thus preventing effects on regular supply to end users.
Lastly, if significant supply shortfalls should become manifest or be expected, Dispatching
starts an internal process at Snam, which provides for immediate communication with the
Ministry of Economic Development. The Ministry in turn calls a meeting of the gas system
Technical Monitoring Committee, which evaluates the situation and proposes pertinent inter-
ventions on both the demand and the supply sides.
Interventions aimed at containing gas demand call for reducing supply to industrial customers
that have signed up for voluntary incentive programmes and for action with electricity pro-
ducers to maximise the use of alternative fuels to gas – generally fuel oil – in compliance with
regulatory restrictions on emissions. On the supply side, actions target the network’s custom-
ers, the shippers, in order for them to increase imports to deal with the potential shortfall.
In terms of Crisis Management activities, besides the operating measures described above, a
project is under way to adjust the Business Continuity management system to the new organ-
isational structure. The system aims to guarantee the ability to maintain the business when
faced with the occurrence of events serious enough to compromise normal operations.
PR1
Snam Sustainability Report 2011 / A network serving Italy with eyes on Europe

37
network controls and inspections 2009 2010 2011
km of network inspected with pigs 1,568 1,214 1,145
km of network inspected with helicopter fl yovers 13,700 >14,100 >14,100
PR3 Information campaign for the safe use of gas equipment
Last year, in cooperation with the Mu-
nicipality of Rome and the Rome Provincial
Fire Service Command, Snam promoted an
awareness and information campaign on
safety in the use of natural gas.
The campaign’s objective was to make citi-
zens aware of a subject as important as the
safety of gas equipment for civilian use,
thanks to exhaustive and wide-ranging infor-
mation on the proper use of gas equipment
intended to prevent household fi res.
The campaign was devoted to proper use
of gas equipment and devices, showing
how religiously performing periodic main-
tenance can allow people to enjoy the
many benefi ts that gas has always been
able to offer in terms of comfort and safety.
The numbers stated in the visuals for the
communications campaign – the result of
a hypothetical calculation of consumption
for two couples – emphasise precisely the
exceptional proportional difference be-
tween the time commitment required for
proper use of equipment and the innumer-
able benefi ts deriving from it.
The campaign was disseminated from 14
November to 4 December in the daily news-
papers and the main radio stations in Rome,
as well as on the main stations in the greater
metropolitan area and on the Roma Capitale
communications channels, RadioRomaCo-
mune and the websites www.comune.roma.
it and www.italgas.it. At the same time, it
was disseminated in offi ces devoted to deal-
ing with the public in the municipalities of
Rome and in municipal libraries.
network oversight and maintenance
During the year, plants and pipes periodically undergo inspections and maintenance opera-
tions. Special attention is devoted to the course of the pipelines, which is inspected regu-
larly on foot, by vehicles and by helicopter flyovers to detect potentially dangerous situa-
tions caused, for example, by third-party work near the pipelines. Snam signage used to give
warning of pipeline presence was showed in a corporate planner disseminated among the
affected local stakeholders.
Similarly, any landslides at specific points in the course are kept under control. The integ-
rity of the pipes is also monitored, threading intelligent devices, or pigs, inside them, which
make it possible to detect the presence of any defects
Snam Sustainability Report 2011 / A network serving Italy with eyes on Europe

38 Snam Bilancio di Sostenibilità 2011
RESPONSIBILITy AND
TRANSPARENCy IN THE MARKETS
Snam is recognised as a player that is aware
of both the role that it plays in the gas sector
and the importance of the interests that
depend on its operating decisions throughout
the markets in question.

39Snam Bilancio di Sostenibilità 2011
RELATIOnS WITh ThE AuThORITy fOR ELECTRICITy AnD gAS
Regulating Snam’s activity
Nationally, the determination of fees, access rules and service quality standards in the gas
transportation, distribution, storage and regasification sectors is established by the Authority
for Electricity and Gas (AEEG), operational since 1997. As part of the sector’s liberalisation,
the regulation of infrastructure activities is the right tool for allowing access to services by all
players present in free-market activity under non-discriminatory conditions.
In this context, the relations that Snam maintains with the AEEG play a fundamental role. The
clarity, stability and transparency of the regulatory framework for determining revenue and
tariffs are in fact a key factor for the economic sustainability of the Company, and are also
relevant for network users, affected by costs associated with infrastructure use, and for finan-
cial investors, in relation to the foreseeability of returns on their investments.
Over the years, Snam has established constructive dialogue and proactive cooperation with
the Authority by continually maintaining an advisory role and providing the necessary support
to changes in the regulatory framework for the natural gas sector. Since 2009, this relation-
ship has become even more constructive thanks to the acquisition of Italgas and Stogit, which
has enabled Snam to become a partner capable of providing complete and effective answers
regarding energy market trends and integration.

40
Effective as of 1 December 2011, the Authority has entrusted Snam Rete Gas, as a major
transportation company, with the important role of Balancing Manager in regulating trans-
portation, dispatching and storage services. This role calls for Snam Rete Gas to acquire the
necessary storage resources, based on criteria of economic worthiness, to guarantee safe and
efficient gas movement from input points to withdrawal points, ensuring continual network
equilibrium.
Relations with the Authority for Electricity and gas
Relations with the AEEG are expressed through different commitments and activities. These ac-
tivities are assigned to the competent functions and positions defi ned by specifi c corporate pro-
cedures.
The group companies – either directly or through trade associations – respond to the public
consultations that the Authority holds on different activities in the sector, which are preliminary
to defi ning new regulations or revising current regulations. The companies also participate in
gathering data and in surveys conducted during the year for purposes of evaluating the status of
the sector or of the individual services, and they periodically send the data requested in compli-
ance with reporting obligations.
Lastly, the collaboration of group companies with the Authority also includes participating in
technical round tables instituted by the regulator, where they have an opportunity to express
their own contribution toward changes in the regulatory framework.
Determining revenue and tariffs
Among regulated activities, the process of
defi ning tariff criteria, which is generally
carried out every four years, is particularly
relevant.
The revenue from all activities is deter-
mined so as to ensure coverage of operat-
ing costs, depreciation and amortisation,
and a fair return on net invested capital,
which ranges in general from 6 to 8 per
cent. Incentives are also provided, differ-
entiated according to the type of invest-
ments made during the course of each
regulatory period. Every year, based on its
own revenue recorded, each Snam com-
pany formulates a tariff proposal, which
is submitted to the Authority for approval.
Snam Sustainability Report 2011 / Responsibility and transparency in the markets
Regulatory periods in force
January 2010 - December 2013
October 2008 - September 2012
January 2009 - December 2012
January 2011 - December 2014
SNAM RETE GAS
GNL ITALIA
ITALGAS
STOGIT
41
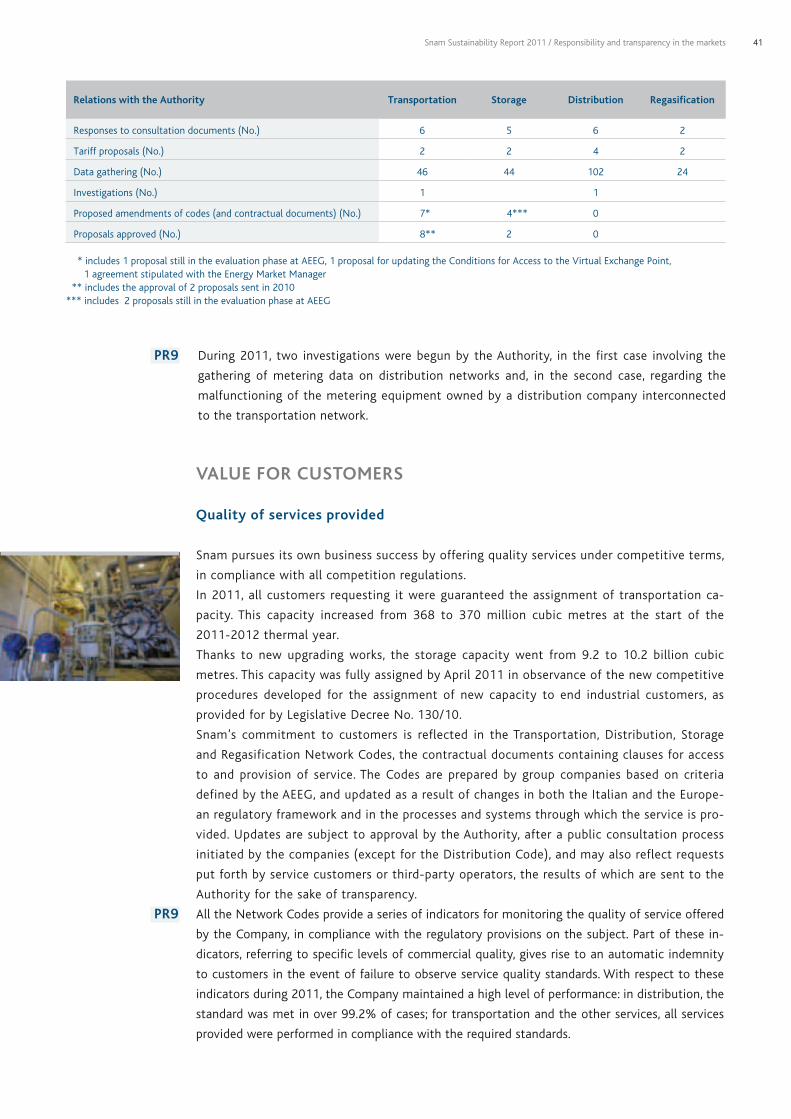
Relations with the Authority Transportation Storage Distribution Regasification
Responses to consultation documents (No.) 6 5 6 2
Tariff proposals (No.) 2 2 4 2
Data gathering (No.) 46 44 102 24
Investigations (No.) 1 1
Proposed amendments of codes (and contractual documents) (No.) 7* 4*** 0
Proposals approved (No.) 8** 2 0
* includes 1 proposal still in the evaluation phase at AEEG, 1 proposal for updating the Conditions for Access to the Virtual Exchange Point, 1 agreement stipulated with the Energy Market Manager
** includes the approval of 2 proposals sent in 2010*** includes 2 proposals still in the evaluation phase at AEEG
During 2011, two investigations were begun by the Authority, in the first case involving the
gathering of metering data on distribution networks and, in the second case, regarding the
malfunctioning of the metering equipment owned by a distribution company interconnected
to the transportation network.
vALuE fOR CuSTOMERS Quality of services provided
Snam pursues its own business success by offering quality services under competitive terms,
in compliance with all competition regulations.
In 2011, all customers requesting it were guaranteed the assignment of transportation ca-
pacity. This capacity increased from 368 to 370 million cubic metres at the start of the
2011-2012 thermal year.
Thanks to new upgrading works, the storage capacity went from 9.2 to 10.2 billion cubic
metres. This capacity was fully assigned by April 2011 in observance of the new competitive
procedures developed for the assignment of new capacity to end industrial customers, as
provided for by Legislative Decree No. 130/10.
Snam’s commitment to customers is reflected in the Transportation, Distribution, Storage
and Regasification Network Codes, the contractual documents containing clauses for access
to and provision of service. The Codes are prepared by group companies based on criteria
defined by the AEEG, and updated as a result of changes in both the Italian and the Europe-
an regulatory framework and in the processes and systems through which the service is pro-
vided. Updates are subject to approval by the Authority, after a public consultation process
initiated by the companies (except for the Distribution Code), and may also reflect requests
put forth by service customers or third-party operators, the results of which are sent to the
Authority for the sake of transparency.
All the Network Codes provide a series of indicators for monitoring the quality of service offered
by the Company, in compliance with the regulatory provisions on the subject. Part of these in-
dicators, referring to specific levels of commercial quality, gives rise to an automatic indemnity
to customers in the event of failure to observe service quality standards. With respect to these
indicators during 2011, the Company maintained a high level of performance: in distribution, the
standard was met in over 99.2% of cases; for transportation and the other services, all services
provided were performed in compliance with the required standards.
PR9
PR9
Snam Sustainability Report 2011 / Responsibility and transparency in the markets

42
In the storage business, quality is monitored with a customer satisfaction survey conducted each
year by sending a questionnaire to detect the degree of user satisfaction in terms of the clarity
of the storage code, sales management, and the availability and efficiency of IT services. With
such surveys, suggestions are also gathered from users aimed at improving the areas mapped in
the questionnaire.
The 2011 survey had a 50% participation rate (33 responses out of 66 questionnaires sent),
up from the previous year (approx. 39%). The ratings, expressed on a scale from a minimum
of 0 to a maximum of 10, broken down by the respective macro areas of reference, showed
substantial confirmation of the perception of the service offered.
Starting in 2012, Snam plans to implement a similar system of measuring customer sat-
isfaction for the transportation and distribution businesses, so as to be able to guide con-
tinual improvement programmes more effectively.
PR5
Simplifying processes
In a regulated market, not only is it important to apply the principles of transparency, impar-
tiality, fairness and safeguarding free competition in the liberalised activities in the sector, but
it is possible and advisable to improve service efficiency and simplify management of the ac-
tivities, always in observance of the regulatory framework, thus generating value for custom-
ers and users.
During 2011, the actions directed toward these goals referred especially to the following areas
of intervention:
•continuingactivitiesfortheimplementationofwebsitesformanagingcustomerrelations;
•furtherdevelopingtheTransportationCapacitywebsitecreatedtomanageallallocationpro-
cesses and capacity transactions between the Company and customers by exchanging com-
munications with full legal and contractual validity.
Snam Sustainability Report 2011 / Responsibility and transparency in the markets
CuSTOMER SATISfACTIOn
TY 06/07 TY 07/08 TY 08/09 TY 09/10 TY 10/110
1
2
3
4
5
6
7
8
IT Services
Commercial Management
Storage Code
Stogit and the customer
Ty: Thermal year

43
fInAnCIAL PERfORMAnCE
Since its listing on the Stock Exchange in 2001, Snam has always sought to maintain trans-
parent relations with the financial community by expressly communicating its objectives
and the results it has achieved.
To keep the quality of these consolidated reports high, each year all the benchmark best
practices are adopted to allow shareholders and the financial market to fully evaluate the
drivers for the creation of value at the Company. Among these, it is worth mentioning:
•roadshows (20 in 2011) aimed atmeeting shareholders and institutional investors in the
largest European and North American financial markets;
•one-to-onemeetings betweenmanagement and investors (140 in 2011, including about
15 at the San Donato Milanese site), in addition to which there are group meetings and
sector conferences;
•conferencecallsat the timeofdisclosureof thecorporate results (preliminaryannual re-
sults, half-yearly and quarterly results), including analysts who publish research on the
share.
Both Snam Rete Gas and Stogit have therefore adjusted their computer applications and their
respective web interfaces with users to manage the specifics provided for by the new Balanc-
ing Regime. In carrying out these projects, still in progress, Snam Rete Gas adopted an approach
geared toward engagement and debate with customers and toward analysing their requests.
The interventions of Snam Rete Gas have included the introduction of:
•newfunctionswithintheTransportationCapacitywebsitethatallowcustomerstomonitor
important operational and economic parameters associated with their own balancing posi-
tion on a daily basis;
•functions implemented in the Billingwebsite that allow for coordinatedmanagement of
the billing process of Snam Rete Gas and of Balancing Users.
In May 2011, ISO 9001 certification was also obtained for the process of defining the net-
work’s transportation capacity, which will be valid starting from the definition of the capacity
published for the 2011-2012 thermal year.
Stogit’s interventions have involved developing the “Stogit Capacity” website for managing auc-
tion-based allocation processes for the User Balancing Service and Capacity Transfer processes.
During 2012, this website will be further developed in order to fully cover information exchanges
between Stogit and its customers, as provided for in the Storage Code with regard to allocation
processes and storage capacity transactions.
kPI description kPI date Pre-set target Target achieved
in 2011Sector
Activity Status
number of meetings with socially responsible investors out of total meetings (%)
2010 Achieve 33% in 2011 40 Snam group
Increase the number of meetings with institutional investors (no.)
2010 Hold 176 in 2011 190 Snam group
hold Investor Day events 2010 Hold 1 1 Snam group
Snam Sustainability Report 2011 / Responsibility and transparency in the markets

44
Performance of Snam shares
Snam’s stock, which is included in the FTSE MIB Italian index, and also in leading international
indices (Stoxx Europe, S&P Europe and MSCI Europe), ended 2011 at an official price of €3.39,
down 9.1% compared to the price of €3.73 recorded at the end of the previous year. The
stock’s annual performance was affected not only by the abovementioned negative trend in
Italian and European financial markets, but also, in particular, by the extension in the second
half of the year of the “Robin Hood tax” to regulated companies in the Italian energy sector,
which meant increased tax rates.
During the year, the stock nevertheless outperformed the trend in the European utilities sector
(Stoxx Europe 600 Utilities: -16.6%), buoyed by interest, even in contexts of growing country
risk and high volatility, in shares of companies with sound business fundamentals and long-
term earnings and cash flow visibility.
In 2011, on the Borsa Italiana electronic stock exchange, around 2.4 billion Snam shares were
traded, with average daily trading volumes of approximately 9.3 million shares, down from
11.5 million in 2010.
During 2011, management also took part in round-table meetings, seminars and conven-
tions on subjects relating to the utilities industry, stock markets and corporate governance
with specific presentations on these topics. These and all other information of interest to
shareholders and investors, including the relaunch documentation and quarterly/half-yearly
reports, both in Italian and in English, are available in the Investor Relations section on the
corporate website, www.snam.it.
Snam Sustainability Report 2011 / Responsibility and transparency in the markets
SnAM - COMPARISOn Of PRICES Of SnAM, fTSE MIB AnD EuRO STOXX 600 uTILITIES
0
10
20
30
40
50
60
70
80
0
20
40
60
80
100
120
140
Jan-
11
Jan-
11
Jan-
11
Feb-
11
Feb-
11
Mar
-11
Mar
-11
Mar
-11
Apr-
11
Apr-
11
May
-11
May
-11
Jun-
11
Jun-
11
Jun-
11
Jul-1
1
Jul-1
1
Aug-
11
Aug-
11
Aug-
11
Sep-
11
Sep-
11
Oct
-11
Oct
-11
Nov
-11
Nov
-11
Nov
-11
Dec
-11
Dec
-11
Volume Snam FTSEMIB Eurostoxx Utilities Mln

45
EThICS AnD RESPOnSIBILITy In PROCuREMEnT
Snam issued more than 3,500 contracts in 2001, with approximately 2,000 awardee suppliers and
total orders of approximately €1,695 million. Of the orders, 95% were concentrated in Italy, where
they were distributed throughout all of the Italian regions, except for Sardinia, and the remainder
in Europe (4.9%) and outside of Europe (0.02%). The most signifi cant merchandise categories were
steel tubing and fi ttings, of which approximately 45,000 tonnes were purchased in 2011.
As a result of the Legislative Decree implementing the Third Energy Package, Snam has ad-
justed its organisational structure and begun updating the procedural systems for the procure-
ment of goods and services.
The new organisation provides for a Supply Chain function at Snam Rete Gas, which carries out
centralised procurement planning and control activities, supplier qualifi cation, services for Pro-
curement, and cross-group merchandise procurement services.
The individual operating companies may source their supplies independently for goods and ser-
vices specifi c to their activities, provided that they observe the guidelines identifi ed by the cen-
tralised function.
En1
Snam Sustainability Report 2011 / Responsibility and transparency in the markets
EC6 gEOgRAPhICAL BREAkDOWn Of PROCuREMEnT (%)
5 Campania
6 Lombardia
5 Basilicata
2 Abruzzo
3 Emilia Romagna
43 Other regions
2 Lazio
9 Toscana
4 Marche
13 Veneto
4 Sicilia
4 Piemonte

46
Other parts of the procurement process governed by specific procedures are the awarding
of contracts and the management of “open” contracts. Finally, the services of the suppliers
used are monitored with “Vendor rating” procedures that assign a score based on gathering
and organising feedback prepared by the technical units. During the year, 114 suppliers were
monitored.
Extending sustainability principles to the supply chain
Our activities have always emphasised respect for and protection of human and labour
rights, environmental protection and the search for a sustainable development model.
It is our wish to share these values with all our counterparties. In this context, we ask sup-
pliers to comply with Model 231 and with the principles of the Code of Ethics, to adhere to
work safety, health and environmental protection regulations and to comply with interna-
tional standards on labour rights.
In 2011, Snam organised the “Suppliers’ Day for Sustainability”, a workshop on two dif-
ferent days involving speakers from corporate management and a significant sample of
suppliers grouped into two types of supply of goods, works and services (75 participating
companies: 35 for goods and 40 for works and services). With this initiative, Snam wished
to disseminate and discuss the concepts of safety, transparency, attention to the commu-
nity, respect for local areas and enhancement of the licence to operate, indispensable values
Transparency in managing suppliers and purchasing processes
Snam adopts a procurement policy that promotes transparency, impartiality and responsibil-
ity while observing free competition and paying special attention to local needs, as befits a
company that has a nationwide presence and strong links to the various local areas in which
it operates.
These principles translate into a management model which, at the strategic level, provides for
the production and updating of a multi-year plan for procurement activities which identifies
long-term economic and financial performance, operational efficiency and service level goals.
From a more operational standpoint, the model translates into procedures aimed specifi-
cally at improving the process of scouting out new suppliers and guaranteeing them that
the selection process, both in the qualification and in the contract award process, ensures
equal opportunities for all once the required qualitative standards are met. The inclusion
of a new entity in the list of suppliers is subject to passing the different preliminary docu-
mentary and technical evaluation phases, in keeping with merchandise criticality levels. The
evaluation is performed with the systematic support of advanced computer tools in order to
ensure that the information gathered is traceable and comparable.
kPI description kPI date Pre-set target Target achieved
in 2011Activity sector
Activity Status
Works suppliers (criticality A and B) ISO 9001 and ISO 14001 certified (%)
2010 Achieve 100% in 2013 97.8 Snam group
Snam Sustainability Report 2011 / Responsibility and transparency in the markets

47
The “Suppliers’ Day for Sustainability”: questionnaire and feedback
During the workshops, with the objec-
tive of identifying the level of awareness
of social responsibility and sustainable
development issues and bringing to light
any trends or instances among companies
in the supply chain, a questionnaire was
distributed to all those present. The ques-
tionnaire aimed to investigate suppliers’
familiarity with sustainability issues and
their perception of Snam’s commitment
to sustainability, and to evaluate the areas
of greatest interest for future initiatives.
Feedback gathered
In terms of macro sustainability issues
(Environment, Society and Economy), de-
spite good awareness of environmental
issues, 93% of the interviewees would
like to see greater investments in train-
ing, seeking to integrate the three macro
areas into a more complete vision of sus-
tainability. Of the interviewees, 34% seek
integrated training on sustainability, while
22% consider investments to be necessary
in social and economic areas and 17% in
environmental and social areas.
Nearly all of the interviewees said they
were in favour of the possibility of carry-
ing out support activities, suggesting six
different initiatives to develop:
• periodic audits and controls evaluating
companies’ real and actual sustainability;
•trainingcoursesandseminars(onlineor
at the individual companies) that help
people to keep abreast of sustainability
issues and tools;
• procedures, directives, and guidelines
that can support supplier companies on
a track toward growth and compliance
with the issues in question;
•periodicmeetingsbetweencompaniesto
share experiences;
•improvedcommunicationsinitiativesand
greater supplier involvement by Snam;
• introduction of rewards and incentives
for companies that behave sustainably.
around which to cement a responsible and fair relationship with suppliers. The “Suppliers’
Day for Sustainability”, attended also as speaker by a representative of the Global Compact
Network Italy, was just an initial meeting to consolidate increasingly aware cooperation be-
tween the Company and its suppliers. The workshops also offered an opportunity to gather
structured feedback on needs and wants, and at the same time to reflect on suitable initia-
tives from the standpoint of continual improvement.
Since early 2012, all companies in the Snam group have disclosed the ten principles stated by
the Global Compact to all suppliers with the intention of disseminating the values contained
in them.
Snam Sustainability Report 2011 / Responsibility and transparency in the markets

48 Snam Bilancio di Sostenibilità 2011
OPERATING WITH
COMMUNITIES IN TERRITORIES
Sustainably developing and managing
a network present in most of Italy must
include the capacity to preserve environmental
equilibriums and respect the sensibilities
of local communities.

49Snam Bilancio di Sostenibilità 2011
Snam is present in almost all regions of Italy and with its infrastructure network it traverses
many local areas and communities that are diverse in terms of values, traditions, and economic,
social and environmental conditions.
In this context, Snam’s policy is always to support the development of new projects, adopting
a rigorous, transparent and cooperative approach to ensure that establishments are environ-
mentally compatible and to encourage their acceptance by stakeholders.
In relations with local communities, the cultural and educational aspect is considered central.
Snam thus pays great attention above all to relations with local institutions, the world of
associations and, through school involvement, young people, who represent the population
group most involved in the concept of sustainability. During 2011, the programme of events
already begun the previous year, which saw elementary and secondary school students among
the main participants in different local areas, was continued.
In 2011, more than €700,000 was spent on donations, sponsorships, and local initiatives, ex-
cluding environmental compensation.
EC8

50
Engagement with the non-profi t world
In 2011, besides the usual longstanding philanthropy activities, Snam began a process of
more strategic engagement with the non-profit world, continuing on the path already begun
in identifying and mapping them.
The objective was to identify the basic elements for building a plan for engagement with
non-profit organisations that could share values and help to simplify the dynamics and the
issues dealt with daily in the local areas where the Company operates.
As a first step, Snam has identified some simple general principles, guidelines both for the
Company and for non-profit organisations, deemed necessary to ensure the representation
of general interests:
•Ensurethepluralityofopinionsandpoliticalandculturalorientations
•Guaranteetheclarityofattemptsandaccordinglytransparencyinmanagingprojects
•Recognisesocial,culturalandenvironmentalauthoritiesrepresentativeoflocalareas
•Ensureaproject’ssustainabilityovertime
•Ensuredesigncapacityandflexibilityinarticulatingprocesses
The second step, after having scouted out the most reputable non-profits in environmen-
tal and social areas, was that of holding an internal combined multifunctional workshop to
share objectives and principles.
During two workshop meetings, the relevant topics and the stakeholders affected were iden-
tified, leading to the construction of the materiality matrix considering, on a cross-refer-
enced basis, relevance for stakeholders (with particular reference to those reported as hav-
ing critical issues) and relevance for Snam.
At this point, based on evaluation forms and indicators for the non-profits identified in the
scouting process, the most appropriate organisations have been identified in terms of the
materiality index.
This process has led to greater awareness of the topic internally, to instituting a series of
shared relationships with a good number of non-profits and to the signing of a memoran-
dum of understanding with FEDERPARCHI, an association that joins and represents Bodies
managing Italian natural protected areas and operates in the environmental, biodiversity
and sustainability fields.
Snam and the Sodalitas foundation
Snam participated in 2011 in the fi rst edi-
tion of Sodalitas Social Innovation, the com-
petition for non-profi t entities instituted by
the Sodalitas Foundation, the association
that builds a bridge between the corporate
and non-profi t worlds founded by Assolom-
barda in 1995.
Sodalitas Social Innovation is an initiative
that aids the widespread growth of the de-
sign capacity of the Third Sector and that in
the fi rst edition saw the participation of 202
non-profi t organisations, which submitted
231 social solidarity projects.
Snam formed part of the group of 23 com-
panies joining the Sodalitas Foundation,
which chose the 13 proposals deemed most
effective. It will also participate in in-depth
partnership workshops (which is held in
March 2012) to allow non-profi ts to make a
more effective presentation of their projects.
Snam Sustainability Report 2011 / Operating with communities in territories

51
Programme / Initiative
Objective and content Participants and facilities involved
Energy Seen up Close
The initiative consists of an information booth prepared by Snam and Stogit in a room at the Bordolano (CR) Town Hall in cooperation with the Municipal Administration.It is an exhibit open to citizens with the objective of disseminating knowledge of the Bordolano Storage Project, begun in 2006, which involves turning a now exhausted deposit into a storage site for methane gas. Informative panels and videos describe to the public gas storage activities and their purpose, the activities involved in executing the new plant complex, its technical characteristics and the local environmental impact. A special in-depth section is devoted to environmental mitigation works that will allow the new plant complex to be integrated into the existing landscape, minimising its local impact.
Local community affected by the new Bordolano (CR) Storage Project
A visit to the Station
The initiative throws open the doors of Snam sites for guided facilities tours.After an initial presentation focusing on gas as an energy source and on its journey to end uses, young people have been able to get to know these important facilities up close and from the words of technicians and to understand the functioning of plants and equipment, turbines and compressors, the technology used and the Company’s commitment to safety and protecting the environment. At the end of the event, the young guests take home cute gadgets and, above all, an idea of what a gas storage site and a compression station are and how they work.
Stogit plants in Sergnano (CR) and Minerbio (BO) and Snam Rete Gas compression station in Poggio Renatico (FE)
All down underground
The initiative, implemented in cooperation with Legambiente, aims to make the group’s sustainability actions and commitment known with dedicated events touching on such topics as energy and different energy resources, natural gas and its use in relation to the environment, and the good environmental restoration practices carried out by the Company.
Students are encouraged in particular to save energy by emphasising the importance of contributions by all, even the youngest, to safeguarding the planet, and asking them to put into practice every day easy energy saving measures. At the end of the gathering, students and teachers received small cans with plant seeds to care for and grow following the example of Snam.
Students of some elementary and secondary schools in Verolavecchia (BS) and Minerbio (BO)
visit to regasification plan in Panigaglia
The initiative has allowed students, guided through the different areas of the site, to discover and get to know the world of LNG and regasification, as well as the measures adopted by the Company to ensure service under the safest and most reliable conditions, with special attention to protecting the environment.
Secondary schools in Le Grazie (Portovenere - SP) and Riomaggiore (SP)
A shopping bag for life
Snam has sponsored the initiative of the Municipality of Poggio Renatico in connection with its programme to build awareness of sorted waste through a drawing competition geared toward students. The winning drawing was reproduced on cotton bags to be used for shopping, delivered to all families in Poggio, while the winning student was rewarded with an art kit.At the award ceremony, Snam illustrated its good practices and certain concepts relating to gas and energy for all participating groups.
Students from the elementary school in Poggio Renatico and citizens
kPI description kPI date Pre-set target Target achieved
in 2011Activity sector
Status
hold educational events for schools and citizens
2010 Hold 7 events in 2011 9 Snam group
Snam Sustainability Report 2011 / Operating with communities in territories
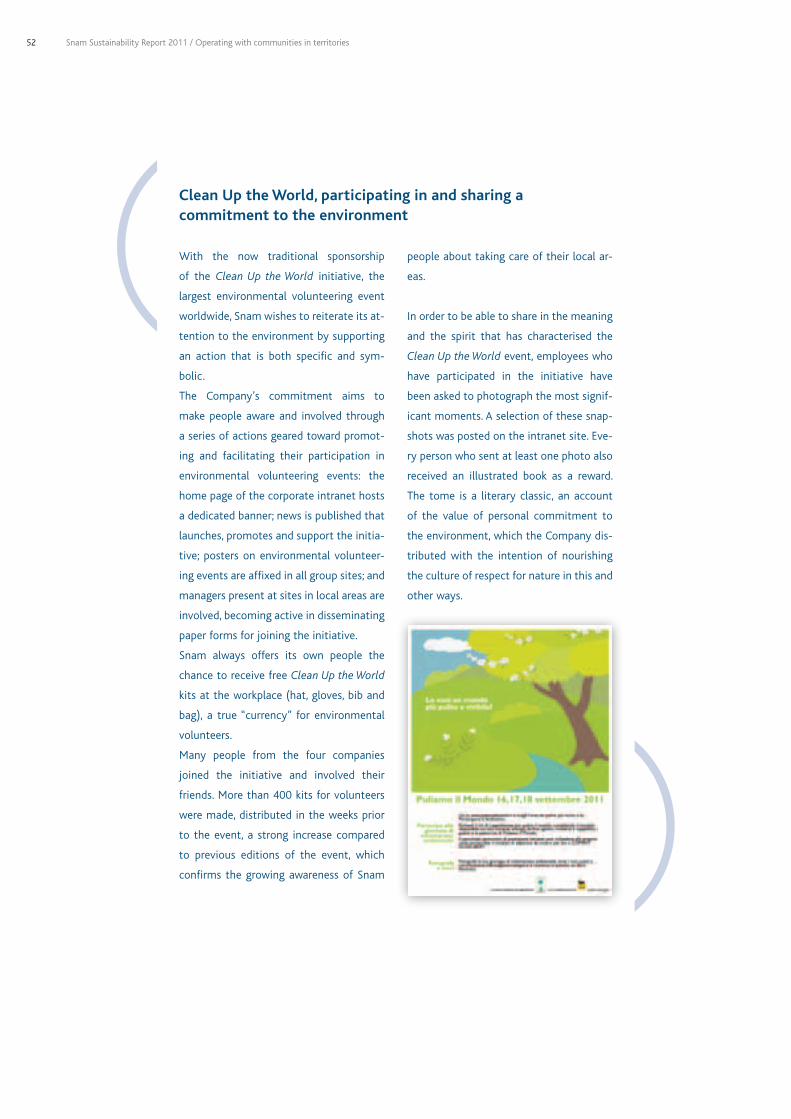
52
Clean up the World, participating in and sharing a commitment to the environment
With the now traditional sponsorship
of the Clean Up the World initiative, the
largest environmental volunteering event
worldwide, Snam wishes to reiterate its at-
tention to the environment by supporting
an action that is both specifi c and sym-
bolic.
The Company’s commitment aims to
make people aware and involved through
a series of actions geared toward promot-
ing and facilitating their participation in
environmental volunteering events: the
home page of the corporate intranet hosts
a dedicated banner; news is published that
launches, promotes and support the initia-
tive; posters on environmental volunteer-
ing events are affi xed in all group sites; and
managers present at sites in local areas are
involved, becoming active in disseminating
paper forms for joining the initiative.
Snam always offers its own people the
chance to receive free Clean Up the World
kits at the workplace (hat, gloves, bib and
bag), a true “currency” for environmental
volunteers.
Many people from the four companies
joined the initiative and involved their
friends. More than 400 kits for volunteers
were made, distributed in the weeks prior
to the event, a strong increase compared
to previous editions of the event, which
confi rms the growing awareness of Snam
people about taking care of their local ar-
eas.
In order to be able to share in the meaning
and the spirit that has characterised the
Clean Up the World event, employees who
have participated in the initiative have
been asked to photograph the most signif-
icant moments. A selection of these snap-
shots was posted on the intranet site. Eve-
ry person who sent at least one photo also
received an illustrated book as a reward.
The tome is a literary classic, an account
of the value of personal commitment to
the environment, which the Company dis-
tributed with the intention of nourishing
the culture of respect for nature in this and
other ways.
Snam Sustainability Report 2011 / Operating with communities in territories

53
With institutional stakeholders, on the other hand, Snam promotes periodic meetings to il-
lustrate the Company’s activities and operational programmes.
In 2011, it continued strengthening dialogue with different institutional levels, both local
and central, through a broad-based activity of presenting corporate initiatives intended to
explain new development projects. In addition, by participating in formal hearings before
Parliament and at regional and municipal councils, we responded to the need stated by
citizens and administrations for more widespread and transparent communication on the
Company’s activities, objectives and operations.
Still from the same standpoint of cooperating with local authorities, data were provided
regarding gas consumption at the local level, aimed at contributing to the drafting of an ac-
tion plan for sustainable energy (PAES).
The Company’s presence within trade associations was bolstered with the entry of Snam
and the subsidiaries into Anigas, the main gas sector association belonging to Confindustria.
SO5
Snam Sustainability Report 2011 / Operating with communities in territories

54
namePower (MW)/ Length (km)
Regions affected Jurisdiction Date of decree
Project pilot injection CO2 in the storage deposit
in CortemaggioreEmilia Romagna State 15-04-2011
Sulmona-foligno pipeline and Sulmona compressor station
3x11 - 170 Abruzzo, Lazio, Marche, Umbria State 07-03-2011
Melilli - Bronte pipeline 106 Sicilia State 29-03-2011
Zimella - Cervignano pipeline 170 Veneto, Lombardia State 29-03-2011
foligno - Sestino pipeline 114 Umbria, Marche, Toscana State 16-05-2011
flaibano - Istrana pipeline 87 Friuli Venezia Giulia, Veneto State 11-11-2011
Sapri pipeline 12 Basilicata Regional 16-03-2011
viggiano - Moliterno pipeline 5 Basilicata Regional 08-11-2011
name Regions affected Date of submission
Project for increasing maximum operating pressure of gas storage deposit in Sergnano Lombardia 04-05-2011
InfRASTRuCTuRE SuSTAInABILITy
In order to develop new establishments, besides technical and economic feasibility criteria,
Snam adopts procedures that meet stringent environmental compatibility and safety assess-
ments.
Assessments of the effects on the surrounding environment concern all phases of a project’s
life cycle: location, design, execution, operation and decommissioning. These assessments are
made as part of the Environmental Impact Assessment (EIA), after which the administrations
in charge, both centrally and locally, issue the authorisations provided for by current regula-
tions.
With regard to developing the network of gas pipelines, which represents the most recurring
and significant event, in the design phase, the path is chosen from among different alterna-
tives, seeking to avoid or reduce to the minimum necessary the network’s passing through ar-
eas of significant natural or cultural interest, archaeological areas, geologically unstable areas
and anthropised areas or those in which new residential settlements are expected.
In the construction phase, in special cases, procedures and technologies are used, consistent
with technical feasibility, which reduce interference with the surrounding environment, such
as reducing the breadth of the work area, minimising provisional worksite infrastructure and
trenchless execution techniques (tunnels and micro tunnels), as alternatives to traditional ex-
cavation. Once placement is done, accurate environmental restoration activity is carried out
so as to return the land to its original conditions.
In the decommissioning phase, infrastructure is removed by agreement with the relevant au-
thorities. In some cases, in order to safeguard the biodiversity reconstituted thanks to resto-
ration interventions, the possibility of keeping piping underground after it has ceased to be
active, thus avoiding additional worksite activities, is evaluated.
SO9-SO10
Snam Sustainability Report 2011 / Operating with communities in territories
EnvIROnMEnTAL IMPACT ASSESSMEnT DECREES OBTAInED DuRIng ThE yEAR
EIA APPLICATIOnS PRESEnTED In 2011 TO ThE MInISTER Of ThE EnvIROnMEnT AnD CuLTuRAL hERITAgE

55
The infrastructure sustainability concept that Snam promotes at all levels also includes socio-
economic evaluations associated with the execution of new works. In 2011, on an experimen-
tal basis, Snam launched the application of “Social Impact Assessment” tools and methods,
which are widely used in other contexts and countries and which make it possible to deal with
these issues systematically by specifically evaluating quantitative and “measurable” impacts
of an economic, demographic and labour nature.
The application of Social Impact Assessment methods
At the “Malborghetto-Bordano” meth-
ane pipeline, the stakeholder satisfaction
detection method was applied, which is
provided for in the Snam Social Impact As-
sessment model. The stakeholders affected
underwent a survey on 4 subject areas,
evaluating the construction and operation
phases separately: environment and land-
scape, relations with Snam, effects on the
local economy and impact on daily life.
The questionnaire was administered in
different ways: performing the interview
in person or by phone, and sending it
by regular mail, with a response rate of
59.6% in the former case and 21% in the
latter. Questionnaire responses provided
precious information for evaluating how
Snam operates in local areas and for iden-
tifying areas for improvement on which
to intervene. By using the NPS (Net Pro-
moter Score) methodology, supported by
a section with questions for more specifi c
in-depth technical information, it was also
possible to perform international bench-
marking in the sectors in which Snam ap-
peared as “best in class” according to dif-
ferent measurements.
Snam Sustainability Report 2011 / Operating with communities in territories
Worst in class Best in Class
Overall satisfaction
Performance compared to sector
Corporaterelations
Economy
Daily life
Environment

56
BIODIvERSITy
In terms of environmental sustainability, Snam considers it particularly important to safeguard
the natural value of local areas affected by new works, beginning with specialised field inves-
tigations to acquire knowledge that is as complete as possible of the local area traversed. The
results of these investigations help define and implement the most appropriate design choices
for reducing to a minimum the biodiversity impacts generated particularly in the execution
phases, which are followed by environmental restoration and monitoring thereof, carried out
in agreement and in cooperation with the entities in charge.
The objective of vegetation restoration, in particular reforestation, is not merely to recon-
stitute forest areas, but to reconstitute the landscape in general and to revive the biological
functionality of vegetated areas, understood especially in their role as habitats for fauna with
specific biodiversity characteristics. Restoration and reforestation are followed by the execu-
tion of “plant care”, i.e. care and maintenance, for a period of at least five years, of the plants
planted.
Monitoring projects concern the courses of some methane pipelines that interfere, albeit mar-
ginally, with natural local areas high in fauna and ecological value, and they are geared toward
verification of the process of renaturalising areas affected by works, based on a comparison
of conditions after restoration (“post-completion”) and the original condition (“pre-comple-
tion”). Monitoring is normally performed for the most significant habitats identified in the
design phase.
Distance covered by methane pipelines in natura 2000 networking sites
2009 2010 2011
km of network 0 30.9 15.5
Environmental monitoring and restoration 2009 2010 2011
Restoration (network km) 270 173 235
new reforestation (network km) 27 25 43
Plant care (network km) 191 151 151
Environmental monitoring (network km) 550 883 1,065
Snam at the “from Saying to Doing” Social Responsibility fair
Snam participated in Milan at the 2011
edition of “From Saying to Doing”, the
only fair dedicated to Corporate Social Re-
sponsibility in Italy. Here it presented envi-
ronmental restoration and fauna monitor-
ing results in connection with the upgrade
of the Abbadia Lariana gas pipeline, carried
out in 2009, testimony to excellence in
best practices in biodiversity.
SO1
En13
En14
En11
Snam Sustainability Report 2011 / Operating with communities in territories

57
Entity 2011 restoration and environmental monitoring activities
friuli-venezia giulia Region
“Malborghetto – Bordano” methane pipeline
Cooperation continued with the Region’s Parks Office on monitoring vegetation restoration along the course of the methane pipeline. In particular, in one section of the pipeline, in the Val Alba regional nature reserve, the 10-year fauna research and monitoring activities continued with the help of international experts. In 2011, the 7th year of monitoring was conducted, the first in a second 15-year monitoring phase that will end in 2013.
“Flaibano – Gonars” methane pipeline
In relation to the “Paludi di Gonàrs” Site of Community Interest, the environmental recovery works continued, in cooperation with local authorities, within the site of some publicly-owned land. A project for monitoring the spontaneous renaturalisation of these areas was also launched and phytosociological studies carried out. In 2011, the third and last annual “post- completion” monitoring was conducted, which confirmed the effectiveness of the environmental recovery interventions carried out, with cutting to contain the growth of shrub species in the grassy areas of the “valley bogs” within the Site of Community Interest, thus preserving the level of biological diversity.
Sicily Region “Flaibano – Gonars” methane pipeline
Collaboration with the Sicily state forests agency continued, with the growing of native forest plants destined for reforestation projects along the course of the pipelines laid in the Nebrodi regional park. In 2011 the reforestation projects along the course of the pipeline were completed, with the planting of approximately 19,000 forest plants. Starting in 2012, periodic plant care will be performed, along with the replacement of plants that have not taken root. The replacement plants will also be supplied by the Sicily state forests agency nurseries.
En12
Safeguarding biodiversity
In autumn 2011, work commenced on the construction of the Somma Lombardo - Besnate DN
300 (12”) - 24 bar methane pipeline, a course 5.8 km long traversing areas of the municipalities
of Somma Lombardo, Arsago Seprio and Besnate in the province of Varese. The pipeline’s path is
placed within the Lombardo Park in the Ticino Valley and will run for about 1.5 km along the pe-
ripheral portions of the “Paludi di Arsago” Site of Community Importance (IT2010011), managed
by the Park itself. The area traversed is characterised mainly by forests of broad-leaved trees for
a total of 4.9 km (including chestnut, oak and oak-hornbeam trees) but with a sizeable presence
of non-native tree species, such as the black locust (Robinia pseudoacacia) and the red oak
(Quercus rubra), both of Central and North American origin. The remaining portion of the path,
on the other hand, involves agricultural areas.
In order to obtain environmental licences, especially from the Lombardo Park in the Ticino Val-
ley, a vegetation restoration project to recreate the tree and shrub cover along the pipeline’s
path was prepared and submitted to the said agency for approval. The specific purpose of this
project is to requalify the area, increasing its biodiversity by planting native tree and shrub spe-
cies, appropriate to the biogeograhical context. Reforestation is planned, with widespread plant-
ing, in agreement with the Park, for the dual purpose of recovering work areas in a homogene-
ous manner and performing targeted cutting during the plant care period to prevent regrowth
by spontaneous dissemination of the black locusts and red oaks present along the sides of the
pipeline’s path. The following tree species will be planted: pedunculate oak (Quercus robur), Eu-
ropean chestnut (Castanea sativa), European ash (Fraxinus excelsior), field maple (Acer camp-
estre), and wild cherry (Prunus avium), totalling approximately 12,500 plants. The shrub species
planned are: common hazel (Corylus avellana), common hawthorn (Crataegus monogyna) and
European cranberrybush (Viburnum opulus), totalling approximately 10,500 plants. The vegeta-
tion restoration will be carried out when the pipeline construction work ends, most likely be-
tween autumn 2012 and spring 2013.
Snam Sustainability Report 2011 / Operating with communities in territories

58
Prior to the commencement of the work, in summer 2011, a fauna survey (pre-completion mon-
itoring) was conducted, aimed at taking a census of protected amphibious species within the
“Paludi di Arsago” SCI. In particular, attention focused on the community of common spadefoot
toads (Pelobates fuscus), a species of anuran amphibian (toad) present in Italy in the “insubri-
cus” subspecies (Pelobates fuscus insubricus), endemic to the Padana Plain. It is a species linked
to land of morainic or alluvial origin (river flood plains, moorlands, stable uncultivated parts)
and due to its state of conservation is entered on the Priority Species list provided by “Habitat”
Directive 92/43/EEC.
In summary, the pre-completion monitoring made it possible to delve further into the following
main aspects:
- the potential suitability of reproduction sites near the course of the planned pipeline;
- the presence of wet areas behind the path, in particular north of the inhabited areas of Som-
ma Lombardo;
- the analysis of water samples, in search of possible larvae that could confirm the presence of
the amphibious species of interest;
- the lack of spadefoot toad larvae and the finding only of larvae belonging to the green frog
complex (Rana esculenta).
The inquiries made appropriately guided the choice of the pipeline’s path, avoiding interfering
with certain sensitive areas of the “Paludi di Arsago” SCI (wetlands). The areas traversed by the
pipeline in fact lie on only limited and circumscribed areas within the SCI and, except for indi-
vidual exceptions, such areas are placed at a reasonable buffer distance away from the amphib-
ians’ main reproduction sites.
To rule out or reduce to a minimum any interference, the works inside the site area will be car-
ried out outside the spadefoot toad’s breeding season (spring).
In the portions of the path closest to potential reproduction sites, where the likelihood of the
presence of individuals in hibernation is consequently greater, Snam Rete Gas will provide for
an expert herpetologist to be present during the works, in order to identify any individual fauna
present, arrange for them to be transferred outside the excavation area and record any useful
data obtained from the findings.
Completion of the work is scheduled by 28 February 2012, as indicated in the authorisations
phase by Consorzio Parco Lombardo Valle del Ticino.
Lastly, post-completion monitoring is planned, with particular reference to the population of
Pelobates fuscus insubricus.
Pelobate foscus insubricus.
Snam Sustainability Report 2011 / Operating with communities in territories

59
EnvIROnMEnTAL MAnAgEMEnT
Snam’s policy is to reduce the environmental impacts generated by its activities to a mini-
mum, applying, where technologically and economically feasible, the best technologies avail-
able and adopting specific management systems and internal procedures.
En30 In 2011, environmental expenses stood at approximately €113.2 million (over €93 million for
investments and around €20 million for management costs).
Snam Sustainability Report 2011 / Operating with communities in territories
EnvIROnMEnTAL fOOTPRInT By BuSInESS SEgMEnT (%)
0 20 40 60
51 2 3611
55 4 338
56 7 433
56 7 433
46 3 3219
46 42 12
80 100
Fresh water procurement
Waste from production activities
NOx Emissions
CO2 Emissions
GHG Emissions
Energy consumption
Trasportation
LEGEND
Regasification
Storage
Distribution
EnvIROnMEnTAL EXPEnSES (%)
49 Landscape/nature and biodiversity protection
11 Soil and subsoil protection
26 Climate and air protection
14 Other environmental protection activities

60
En16 In 2011, total GHG emissions (direct and indirect) were approximately 2.26 million tonnes
(-16% compared to 2010). This reduction is attributable to both a decrease in energy con-
sumption and the initiatives undertaken to reduce natural gas emissions. The trend of CO2
emissions from combustion depends greatly on the plans and requests of the customers to
which Snam provides transportation, storage, regasification and distribution services.
In order to contain natural gas emissions from the transportation network, activities were
continued which involve gas recovery through online gas recompression interventions in the
network upgrading phase (11 interventions were carried out, recovering 4.4 million cubic me-
tres of natural gas), as well as the replacement of pneumatic equipment at some plants.
En18
CARBOn fOOTPRInT AnD EnERgy EffICIEnCy
greenhouse gases
The greenhouse gases (GHG) emitted into the atmosphere by the activities of Snam are car-
bon dioxide (CO2) and methane (CH
4), the main component of natural gas. CO
2 is produced
in combustion processes and is directly correlated with fuel consumption, while emissions of
natural gas, and thus CH4, derive partly from normal plant operation and partly from discharg-
es into the atmosphere caused by new pipeline connection works or maintenance works, or by
accidents on the transportation and distribution networks.
In addition to using natural gas as its main fuel, Snam attempts to minimise emissions of
GHG in its operating activities by employing specific containment programmes, such as:
•thereductionofnaturalgasemissions(throughtherecompressionofgas inpipelines,the
replacement of pneumatic equipment and the replacement of cast-iron pipes in distribu-
tion networks);
•thereductionofpowerconsumption(usingspecificenergymanagementmeasures);
•theuseofelectricityproduced fromrenewableenergysources (throughspecificpurchase
contracts and the installation of photovoltaic panels)
En26
Snam Sustainability Report 2011 / Operating with communities in territories
Total GHG emissions
2,265 103 t CO2eq
98.4% direct
emissions
67.7% CH4
emissions
30.7% CO2
emissions
29.9% CO2
Industrial emissions
0,5% CO2
Vehicle emissions
0.3%% CO2
Domestic emissions
1.6% indirectemissions
(electricity)
2011 ghg EMISSIOnS

61
kPI description kPI date Pre-set targetTarget achieved
in 2011Sector
Activity Status
Natural gas recovered out of total potential emissions from maintenance activities
2010 Recover 30% in 2011 42.7% Trasporto
Replacement of iron networks 2010 Replace 400 km by 2014 136 Distribuzione
Natural gas emissions as a proportion of gas injected into the network
2008Reach a percentage of 0.048%
in 20120.051% Trasporto
The advantages of natural gas
At equal energy usage, the carbon dioxide
produced by the combustion of natural gas
is 25-30% less than petroleum products
and 40-50% less than coal. The decrease
in emissions per unit of energy produced
is further accentuated by the possibility of
using natural gas in high-performance ap-
plications and technologies, such as con-
densation boilers, co-generation plants and
combined cycles for producing electricity.
A gas-powered combined cycle with output
of 56-58%, compared to output of about
40% from traditional steam-powered cy-
cles, makes it possible to reduce CO2 emis-
sions by 52% compared to a traditional oil-
powered plant and by 62% compared to a
coal-powered plant.
Direct emissions
Direct CO2 emissions from combustion stood at approximately 694,530 tonnes (-34% com-
pared to 2010), while CO2eq
emissions deriving from methane emissions were approximately
1.5 million tonnes (-2.8% compared to 2010). The CO2eq
emissions were calculated based on a
global warming potential (GWP) of 25 for methane, as indicated in the scientific study of the
Intergovernmental Panel on Climate Change (IPCC), “IPCC Fourth Assessment Report of 2007”.
En16
Snam Sustainability Report 2011 / Operating with communities in territories
As regards containing natural gas emissions in civic distribution networks, activities were
continued involving replacing iron piping with more high-performance piping (replacing
about 136 km of networks). In 2011, natural gas emissions were reduced by about 4 mil-
lion cubic metres compared to 2010, going from 100.8 million cubic metres to 96.9 million
cubic metres (-3.9%).
TOTAL ghg EMISSIOnS (103t)
2009 2010 20110
500
1.000
1.500
2.000
2.500

62
Indirect emissions
Indirect CO2eq
emissions derive from the use of electricity. In 2011, they stood at approxi-
mately 36,040 tonnes (-35% compared to 2010). The reduction in emissions is the result of
a series of initiatives, started in 2010, aimed at increasing the use of electricity produced
exclusively from renewable sources. These initiatives primarily concerned two plants high
in electricity consumption (the LNG regasification plant and the Brugherio storage station,
which is equipped with electric motors). The indirect CO2eq
emissions were calculated based
on a national average factor of 0.483 kgCO2/KWh.
Emission Trading
The Snam plants falling under the scope of application of the Emissions Trading Directive as at
31 December 2011 are shown in the table:
Company E.T. plants (no.) name
Snam Rete gas 12Gas compression stations in Enna, Gallese, Istrana, Malborghetto, Masera, Melizzano, Messina, Montesano, Poggio Renatico, Tarsia, Terranuova Bracciolini and the Mazara del Vallo entry point terminal
Stogit 7 Gas compression storage stations in Cortemaggiore, Fiume Treste, Minerbio, Ripalta, Sabbioncello, Sergnano and Settala.
gnL Italia 1 Liquefi ed natural gas regasifi cation plant in Panigaglia
En16-En17
EC2-En16
Snam Sustainability Report 2011 / Operating with communities in territories
DIRECT CO2 EMISSIOnS fROM
COMBuSTIOn (103t) TOTAL DIRECT CO2eq
EMISSIOnS (103t)
2009 2010 20110
300
600
900
1.200
2009 2010 20110
700
1.400
2.100
2.800
2009 2010 20110
300
600
900
1.200
2009 2010 20110
700
1.400
2.100
2.800
InDIRECT CO2eq
EMISSIOnS (103t)
2009 2010 20110
20
40
60

63
In 2011, the CO2 emissions verified and certified by an accredited entity, in accordance with
the provisions issued by the relevant national authority, stood at 611,367 tonnes, out of a
total of 1,001,577 annual quotas allocated by the Ministry of Environment and Protection
of Land and Sea (a positive balance of 390,210 quotas).
Before the emissions trading regulations on climate change came into force, Snam had al-
ready undertaken initiatives to contain emissions using high-yield technologies and natural
gas as the main fossil fuel in its plants. Natural gas is used almost exclusively as fuel in the
emissions trading plants.
Energy consumption
The Company’s main energy consumption is due to gas turbines – used in compression sta-
tions to provide gas with the pressure necessary for transportation (compression gas) or stor-
age (storage consumption) – and due to the vaporisers used at the Panigaglia plant to regasify
liquefied natural gas (LNG).
To limit energy consumption, the best available technologies are used and high-performance
turbines have been installed. In particular, the fuel consumption of the compression stations
is controlled by the Dispatching department through the use of software systems which make
it possible to manage the transportation network as efficiently as possible, in keeping with
transportation and storage needs, with an optimal configuration of the individual compression
stations.
En4
En7
In 2011, total energy consumption was around 12,830 TJ. The energy source most used was
natural gas, which covered around 95% of total energy needs. The other sources used were
electricity (3.2%) and other fossil fuels (diesel oil, petrol, LPG) and heat (1.3%).
Snam Sustainability Report 2011 / Operating with communities in territories
2009 2010 20110
4.000
8.000
16.000
12.000
20.000
EnERgy COnSuMPTIOn (TJ)
3.2 Electricity
95.5 Natural gas
1.3 Other
EnERgy COnSuMPTIOn (%)
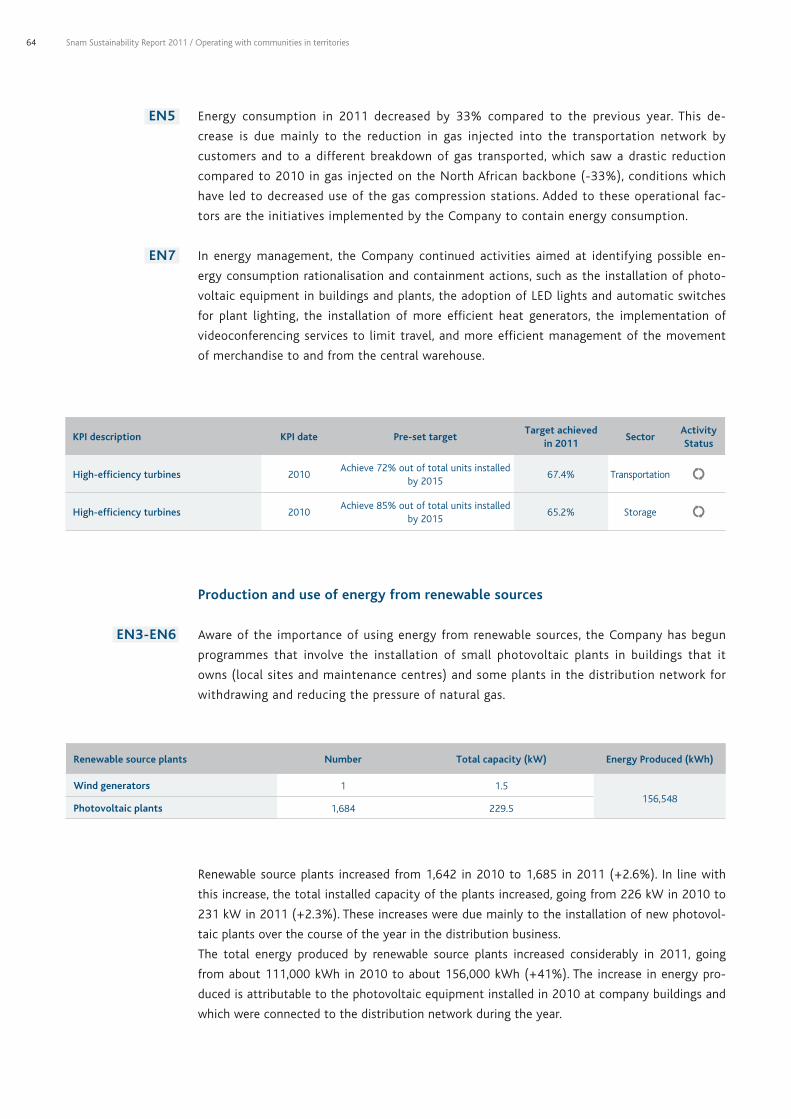
64
Energy consumption in 2011 decreased by 33% compared to the previous year. This de-
crease is due mainly to the reduction in gas injected into the transportation network by
customers and to a different breakdown of gas transported, which saw a drastic reduction
compared to 2010 in gas injected on the North African backbone (-33%), conditions which
have led to decreased use of the gas compression stations. Added to these operational fac-
tors are the initiatives implemented by the Company to contain energy consumption.
In energy management, the Company continued activities aimed at identifying possible en-
ergy consumption rationalisation and containment actions, such as the installation of photo-
voltaic equipment in buildings and plants, the adoption of LED lights and automatic switches
for plant lighting, the installation of more efficient heat generators, the implementation of
videoconferencing services to limit travel, and more efficient management of the movement
of merchandise to and from the central warehouse.
En5
En7
kPI description kPI date Pre-set targetTarget achieved
in 2011Sector
Activity Status
High-efficiency turbines 2010Achieve 72% out of total units installed
by 201567.4% Transportation
High-efficiency turbines 2010 Achieve 85% out of total units installed
by 201565.2% Storage
Production and use of energy from renewable sources
Aware of the importance of using energy from renewable sources, the Company has begun
programmes that involve the installation of small photovoltaic plants in buildings that it
owns (local sites and maintenance centres) and some plants in the distribution network for
withdrawing and reducing the pressure of natural gas.
En3-En6
Renewable source plants number Total capacity (kW) Energy Produced (kWh)
Wind generators 1 1.5156,548
Photovoltaic plants 1,684 229.5
Renewable source plants increased from 1,642 in 2010 to 1,685 in 2011 (+2.6%). In line with
this increase, the total installed capacity of the plants increased, going from 226 kW in 2010 to
231 kW in 2011 (+2.3%). These increases were due mainly to the installation of new photovol-
taic plants over the course of the year in the distribution business.
The total energy produced by renewable source plants increased considerably in 2011, going
from about 111,000 kWh in 2010 to about 156,000 kWh (+41%). The increase in energy pro-
duced is attributable to the photovoltaic equipment installed in 2010 at company buildings and
which were connected to the distribution network during the year.
Snam Sustainability Report 2011 / Operating with communities in territories

65
OThER EnvIROnMEnTAL PERfORMAnCE
Air protection
The use of natural gas as its principal energy source enables the Company to minimise emissions
of sulphur oxides and particulate matter.
Nitrogen oxide (NOx) emissions, the only signifi cant polluting emissions, derive from the use of
the gas turbines installed in compression stations (compression and storage) and of the vaporis-
ers at the liquefi ed natural gas regasifi cation plant.
In order to reduce nitrogen oxide emissions deriving from the combustion of natural gas in the
gas turbines used in compression stations, in recent years some existing turbines were modifi ed
and new units installed with dry low emission (DLE) combustion systems, while at the regasifi -
cation plant, submerged fl ame vaporisers are used.
In 2011, programmes for upgrading station turbines were continued. In particular, a new turbine
(TC4) went on line at the Montesano (SA) compression station, and the conversion of the tur-
bine (TC3) at the Fiume Treste (CH) to DLE was completed. The conversion of the turbines at
Messina (TC1), Settala (TC1) and Sabbioncello (TC1) to low emissions was begun. In the coming
years, these programmes will be implemented predominantly in the storage business.
En20
2009 2010 20110
300
600
900
1,200
1,500
1,800
TOTAL nOX EMISSIOnS (t)
In 2011, total emissions of nitrogen oxides were around 920 tonnes (-45% compared to
2010). Such a significant reduction in emissions is attributable to lower energy consumption
during the year and to the greater number of hours of operation of the DLE turbines com-
pared to the previous year.
NOx emissions into the atmosphere are determined based on direct measurements or, if not
available, by emission factors present in the literature (United States Environmental Protec-
tion Agency and CORINAIR - COordination INformation AIR project).
Snam Sustainability Report 2011 / Operating with communities in territories

66
kPI description kPI date Pre-set targetTarget achieved
in 2011Sector
Activity Status
no. of DLE turbines out of total no. of turbines
2010 Achieve 75% by 2015 67.4 Transportation
no. of DLE turbines out of total no. of turbines
2010 Achieve 85% by 2015 65.2 Storage
Rated nOx emissions on turbine installed capacity
2010 Achieve 6 mg/(Nm3*MW) by 2015. 6.6 Transportation
Rated nOx emissions on turbine installed capacity
2010 Achieve 6 mg/(Nm3*MW) by 2015. 15.6 Storage
no. of hours of operation of DLE turbines out of total hours of operation of turbines
2010 Achieve 85% by 2015. 80 Transportation
Waste management
The waste produced by Snam is attributable mainly to three macro activities: production
activities, site reclamation and well drilling.
Waste from production activities has always been a relatively insignificant environmental
factor in terms of both the quantity and the type of waste. The waste generated derives
mainly from the maintenance and management of the plants, and the majority of it consists
of ferrous materials which are recovered in full.
Waste from reclamation activities derives from the environmental requalification of some
areas contaminated by previous industrial activity. Reclamation waste can also be produced
during the laying of pipelines through contaminated sites not owned by Snam in which it
must operate.
Waste deriving from well drilling consists mainly of slurries typically produced in some
phases of the storage activity.
Snam Sustainability Report 2011 / Operating with communities in territories
2009 2010 20110
30.000
60.000
90.000
120.000
150.000
Non-hazardous waste
Hazardous waste
WASTE PRODuCTIOn (t)WASTE PRODuCTIOn BROkEn DOWn By ACTIvITy %
32 Production activities
67 Restoration of own sites
1 Well drilling

67
In 2011, total waste production stood at approximately 66,070 tonnes, down 45% from 2010.
The decrease in waste produced is attributable mainly to extraordinary activity carried out in
2010, which saw the laying of a pipeline in a national polluted site (SIN) for the connection of a
third-party plant, which entailed reclamation and disposal of polluted soil.
Out of total waste produced, 40,467 tonnes belong to the non-hazardous waste category (61%
of the total) and 59% of disposed waste from production activities was sent for recovery.
During the course of the year, reclamation activities were continued for the recovery and en-
vironmental requalifi cation of 29 areas, with a total buildable area of around 134 hectares,
contaminated as a result of earlier industrial activities, mainly due to the production of manu-
factured gas. The areas include sites for which contamination complaints have been submitted
to the authorities in accordance with current legislation and sites where only decommissioned
plant structures are present.
With these activities, Snam confi rms its commitment to the recovery of abandoned industrial
sites, with the objective of returning substantial areas to the local community for new develop-
ment initiatives, while simultaneously aiming to make the best possible use of them.
En22
En2 Ecologically
The project “Ecologically” continued suc-
cessfully. Started in 2010, it includes ini-
tiatives aimed at promoting good eco-sus-
tainable practices even in the offi ce, with
small daily gestures that help to improve
the quality of the surrounding environ-
ment.
“Some habits make a difference”, the
waste sorting initiative at the San Donato
Milanese refreshment stands launched in
February 2010, was applied to the Turin
site for Italgas, the Crema site for Stogit
and the Panigaglia site for GNL Italia dur-
ing 2011. In 2012, we will seek to extend it
to certain operating sites.
“All paper recycled” means making all per-
sonnel at all group sites aware of the ad-
vantages of using recycled paper and at the
same time raising awareness of environ-
mental protection issues.
Use of recycled paper increased from 2010,
going from 38% to 54%, allowing the group
to save natural resources and contain car-
bon dioxide emissions.
Trees (no.) Water (litres) Electricity (kWh) CO2eq
.(t)
- 1,126 - 32,900,056 - 367,892 - 178
Snam Sustainability Report 2011 / Operating with communities in territories

68
Water
Water procurement and discharge in the activities of Snam represents a relatively insignificant
environmental factor, in terms of both the quantities used and the type of discharges.
In 2011 approximately 4.35 million cubic metres of water were procured (4 million of sea
water and 0.35 million of fresh water). The procurement of sea water remained practically un-
changed compared to 2010, while that of fresh water decreased 48% compared to 2010.
Sea water is used for cooling auxiliary equipment in the LNG regasification plant, and fresh
water is used primarily for office activities, firefighting apparatus and the irrigation of green
spaces.
With regard to water discharges, the sea water consumed for cooling is released into the sea
as is, without any treatment, while the waste water is channelled into the sewage networks
(89% of the total) or discharged, after treatment, into the soil and into surface water bodies
(11% of the total).
To control the discharge of domestic waste water, activities continued for the construction
of closed-cycle phytopurification plants that make it possible to eliminate this type of dis-
charge: the waste water is treated and completely absorbed by the planted vegetation, after
separation of the sedimentable solid material. We are evaluating the possibility of extending
this technology, used until now primarily at gas compression stations for transportation, to
buildings we own (maintenance centres) where no sewage networks are present. In particu-
lar, in 2011, a new plant was installed at the Terracina maintenance centre, and a technical
audit of the suitability of another 10 sites is under way.
In the storage business, in the upstream phase, approximately 2,018 cubic metres of process wa-
ter were produced. Of this water, about 1,630 cubic metres were reinjected as is, while the rest
(about 388 cubic metres) was sent to a purifi cation plant for treatment.
En8
En9
En10
En21
Snam Sustainability Report 2011 / Operating with communities in territories
fRESh WATER PROCuREMEnT (103m3) fRESh WATER DISChARgE (103m3)
2009 2010 20110
200
400
600
800
2009 2010 20110
100
200
300
400
500
2009 2010 20110
200
400
600
800
2009 2010 20110
100
200
300
400
500

69
Management of substances harmful to the ozone layer
The initiatives in progress concern the monitoring and control of all conditioning plants contain-
ing substances harmful to the ozone layer in order to check for any gas leaks into the atmos-
phere. These substances can be found, in modest quantities, in a limited number of plants, and
a programme is under way to replace them with ecological fluids. In 2011, at all Snam plants, a
small quantity still remains to be disposed of, amounting to approximately 1,480 kg (-31% com-
pared to 2010).
En19
Restricting noise emissions
For the restriction of noise emissions, Snam implements a prevention policy which consists
of correct plant sizing in the design phase, accompanied by the conducting of a noise im-
pact forecast.
The main sources of noise are the gas compression stations (transportation and storage),
generally located in rural areas, the pressure reduction and regulation plants that link pipe-
lines with different operating pressures, and the LNG regasification plant.
The principal control measures adopted include the installation of soundproofed cabins,
noise-reducing hoods, low-noise valves, silencers on operating vents, and the burial of pipes.
In 2011, for purposes of mitigating noise emissions from facilities via technological adap-
tations, actions continued for improving the acoustic soundproofing of plants in the gas
transportation and distribution network. In particular, in the transportation network, 45 in-
terventions were carried out on gas pressure reduction and regulation cabins (9 in 2010), in
accordance with plans calling for interventions at a total of 120 plants by 2013, while in the
distribution network, the monitoring of noise emissions, with consequent managerial and/or
plant-related interventions, involved 345 plants.
SO1
Snam Sustainability Report 2011 / Operating with communities in territories

70 Snam Bilancio di Sostenibilità 2011
PEOPLE AND WORK AS
DRIVERS OF DEVELOPMENT
Maximising the potential of our people
and monitoring and developing the skills
necessary for maintaining the company’s
competitive position are strategic factors
for achieving our objectives.

71Snam Bilancio di Sostenibilità 2011
The year 2011 saw various changes to the group’s organisational system and scope.
After the issuance of the “Our people” policy, approved by the Board of Directors in 2010,
which represented a significant step in expressing the principles of management and develop-
ment of the people who operate in the group, during the year, through the corporate regula-
tory system and in particular the Management System Guidelines, these principles were made
operational, redefining management rules, roles and responsibilities.
Then, at year-end, the need arose to comply with the obligations provided for by the imple-
mentation of the Third European Directive. In addition to creating an independent transporta-
tion company and repositioning some activities (sales and procurement) within the operating
companies, Snam expanded and insourced a series of services previously carried out by the in-
tegrated operator, Eni, for which another 120 people were absorbed into the group in addition
to hires from the market. These interventions will guide Snam’s organisational system toward
greater specialisation and decision-making autonomy so as to be able to focus more attention
on managing and developing the different businesses. The new hires, together with planned
departures, have left staff size substantially unchanged, since the enlarged scope of activities
overseen was offset by the effects of policies for increasing efficiency.

72
new hires 2009 2010 2011
Hired from the market (No.) 40 55 140
…of which university graduates (No.) 30* 39* 51
…of which high school graduates (No.) 92* 61* 85
…of which holding other qualifications (No.) 46* 37* 4
* These data also include hires from eni group which amounted to 128 in 2009 and 82 in 2010.
Hours worked in 2011 totalled more than 9.9 million, with an absenteeism rate of approximately
665,260 hours (of which 55.9% hours due to sickness, 1.9% hours due to accidents, and 42.2%
hours due to other reasons).
Personnel (by type of contract) 2009 2010 2011
permanent contract (not including part-time) (No.) 5,957 5,844 5,797
apprenticeship or trainee programme (No.) 145 158 211
fixed-term contract (No.) 5 3 1
part-time contract (No.) 103 99 103
employees with part-time contracts (No.) 99 94 95
DEvELOPIng AnD MAkIng ThE MOST Of huMAn CAPITAL
Developing skills and abilities
Training and consolidating professional and managerial skill sets, in a changing scenario, are an
integral part of maximising people’s potential.
Along with enhancing people’s job opportunities, training serves as a support to organisational
integration and change management. These activities are based on an ongoing partnership
with the various internal units in order to encourage the design and continual improvement of
training courses, making them more efficient and consistent with the requirements of people,
professional families and corporate objectives.
Training data 2009 2010 2011
Hours of training provided 154,010 148,824 187,134
…of which executives 3,143 3,734 2,369
…of which managers 15,072 13,358 13,840
…of which office workers 84,967 79,526 102,103
- of which manual workers 50,828 52,206 68,822
Number of participants 15,484 13,750 16,437
LA7
LA1
LA10
LA2
Snam Sustainability Report 2011 / People and work as drivers of development

73
LA10
kPI description kPI date Pre-set targetTarget achieved
in 2011Sector
Activity Status
Average hours per employee (no.) 2010 Achieve 24 in 2011 30 Snam group
Involvement of corporate population (%) 2010 Achieve 80% in 2011 90 Snam group
Managerial development activities continued in 2011, basically in continuity with the previous
year but with differentiated interventions aimed at specific needs, identified due to segment-
ing the corporate workforce both horizontally by role and professional family, as well as verti-
cally, i.e. by level of responsibility.
These activities have also been integrated into the performance evaluation system and into
the individual potential and ability evaluation.
Other initiatives have concerned specific corporate population groups. University graduates
just entering the workforce have been involved in a trainee plan, which will be carried out
over a two-year time period, aimed at encouraging knowledge of the business and at facili-
tating their integration into the corporate fabric. For managers under 40, an initiative known
as “360° Outlook” has been prepared, with the objective of increasing their managerial skills
from the standpoint of self-development.
2011 training initiatives Recipients
Training courses were carried out on “The economic and managerial rationales of regulated markets”, in cooperation with the Politecnico di Milano
Managers and recently hired university graduates
Continued commitment to professional training for developing and consolidating specialised technical know-how and training in support of local reorganisation for manual workers
Manual workers
More than 30,000 hours of HSE training were provided. The topics dealt with in specific training courses, designed and implemented internally, included: “Safe Driving”, “The Role of the Safety Officer” (Legislative Decree No. 81/08) and Implementing Management Systems In terms of the environment, a new high-impact development has been the introduction of the new waste traceability system (SISTRI), which has required a significant widespread training initiative throughout the country
Managers, office workers, technical personnel and
manual workers (4,913 participants)
SO3-hR3 Continued training activity on the requirements of the Organisation, Management and Oversight Model pursuant to Legislative Decree No. 231/2001, in a targeted anti-corruption course aimed at disseminating the guidelines adopted by the Company (more than 12,900 hours)
Managers and office workers (3,231
participants)
Continued training in support of the “Project for insourcing maintenance activities and implementing the new SAP system”
Stogit personnel (more than 50,000 hours of training)
Explained the procedure approved by the Board of Directors of Snam Rete Gas and implemented by the subsidiaries on provisions regarding related-party transactions, governed by Consob Regulations
Involved 200 people affected by the rules
Specific training initiatives were implemented to develop managerial skills (see below) Executives and managers
Offered training in support of the introduction of Work Force Management. Courses were also held on the New Mapping Update, and courses were designed on the New Organisational Model for operational activities
Mainly technical personnel in distribution
Implemented a training course project on middle manager skills, the Peak Performer Model (see box below), aimed at maximising and disseminating existing best practices in the group’s different business areas
Technical operations managers
(more than 130 people) working nationwide
Held events for providing information on and sharing corporate strategies. In particular, a workshop was organised to ensure awareness of the business context in expectation of the implementation of the Third European Directive and illustrate the core points of the strategic plan
Executives
LA11
Snam Sustainability Report 2011 / People and work as drivers of development

74
Launched in early 2011, the “Peak Performer Model” is a project carried out in cooperation with Towers Watson.
Peak Performer Project This is a project designed to allow for active participation both by managers, whose responsibility for employee development is key, and by employees themselves to clarify their role in the development process and target certain behaviour that has emerged as critical, all by interacting and working as a group.It is a methodology with the objective of maximising and disseminating existing best practices, identifying a set of distinctive behaviours, common across the transportation, distribution and storage businesses; the commitment to disseminating and inculcating these behaviours in the organisation, and sharing a platform of operating methods and values, is synonymous with building a “culture of development”, a group culture to be extended to the entire corporate workforce, especially to new employees who will be the company of the future.
Project goals • improvingperformance;• encouragingcorporateintegration(throughpersonalacquaintance,teamwork,meetingsanddiscussionsamong
different professionals).
People involved Some 150 people are involved, including executives (district heads) and operations managers (centre/plant heads) from Stogit, Italgas and Snam Rete Gas operations management.
Project phases The project, broken down into different phases, is currently under way and will continue for a good part of 2012
• directivesandguidelinesdefinedandagreeduponbyaworkinggroupincludingexecutives,HRmanagersandconsultants;
• completedtheinitialphaseoftheprojectwithindividualinterviewsandfocusgroupsinvolvingallinterestedpartiesin order to identify a list of behaviours implemented in the main phases of the business process;
• heldgrouptrainingandindividualcoachingevents,whichmadeitpossibletoobtainkeymethodologicalmodelsandto support executives in becoming for all practical purposes coaches for their own employees thanks to development plans prepared and shared with operations managers, as the basis for defining and implementing specific actions in the near future.
Results (as at 2011)
The Peak Performer model was applied to information of a qualitative nature, cross-referenced against more strictly quantitative data deriving from operating results, giving rise to the identification of a limited number of “win-win behaviours”.
Incentive and remuneration systems
Performance appraisals assess the contribution made and the results achieved by individual staff
members over the course of the year and are a way of communicating and involving them in
meeting targets.
For managers, a management review is carried out each year, which enables accurate monitoring
of their performance using consolidated and common criteria.
In 2011, the competitiveness and fairness of compensation practices for managerial and pro-
fessional personnel were audited and optimised following the update of the job evaluation
begun in 2010.
The compensation system is adjusted periodically using criteria based on meritocracy and internal
fairness. It is particularly aimed at ensuring recognition of the results achieved by an employee, the
quality of professional support provided and the employee’s potential for development.
Alongside the policy of meritocracy, related to roles and responsibilities, a variable incentive sys-
tem for managers and executives has been built up over the last few years in connection with per-
formance appraisal through the allocation of specific individual charts derived from the corporate
ones. In 2011, this appraisal involved all executives and their commitment to developing business
activities, with a particular focus on sustainability.
This is demonstrated by the allocation of individual sustainability targets to nearly 100% of
the executives. Meanwhile, as far as managers are concerned, 38% were assigned an indi-
vidual target associated with sustainability issues.
LA12
ThE PEAk PERfORMER MODEL fOR OPERATIOnS MAnAgERS
Snam Sustainability Report 2011 / People and work as drivers of development

75
For young graduates, we began studies aimed at defining differentiated compensation poli-
cies on the basis of performance and professional and managerial ability in order to support
the motivation and retention of our most talented youngsters.
We also continued our commitment to improve the system of benefits.
As in previous years, as part of our internal communication initiatives, we extended our
Total Reward Statement (an itemised breakdown of an individual's overall pay packet) to all
managers.
All jobs at Snam Rete Gas S.p.A., GNL Italia and Stogit are subject to analytical and overall
evaluation of complexity, responsibility, experience and autonomy (CREA) factors, as speci-
fied by the national collective labour agreement for the energy and petroleum industry. 395
evaluations were carried out in 2011. All evaluation processes are formalised and involve
feedback sessions that are an important opportunity for discussion and communication be-
tween manager and employee with a view to gathering information that can be used to
draw up new actions for developing and maximising the potential of our people.
A collective incentive programme is used for all group companies: the “Profit-sharing scheme”
introduced pursuant to the respective national collective labour agreements. This scheme is
based on company profitability (return on average capital employed, or ROACE) and produc-
tivity, as measured in relation to annual targets agreed between the Company and union rep-
resentatives.
Diversity and equal opportunities
In line with the Code of Ethics and the “Our people” policy, Snam respects each person and
offers equal opportunities in all aspects of employment, including recruitment, training, pay,
promotion, transfers and termination, avoiding any form of discrimination which may arise
from differences in gender, age, health, nationality and political or religious beliefs.
LA13
2009 2010 2011
Women in the workforce (%) 9.7 9.6 10.5
Women hired * (%) 23 12 24
These fi gures refl ect the characteristics of our business, which demands particular availability for shift work and continual travel and is therefore not suitable for some candidates. “Manual workers” include men only.
Snam Sustainability Report 2011 / People and work as drivers of development
PERCEnTAgE Of WOMEn PRESEnT PER RAnk (%)
2009
Managers
Executives
Office workers
2010 20110
4
8
12
16
20

76
We offer more favourable maternity provisions than those required by law, maintaining the
company benefits provided for all staff. Maternity pay during the mandatory leave period
is 100% of the salary for the month prior to commencement of leave (compared with 80%
required by law).
In 2011, all personnel taking parental leave returned to work.
A guide has been published on the intranet for both biological and adoptive parents with a
view to raising awareness about their rights and highlighting the Company's dedication to
parents.
Thirty-two workers (male and female) took parental leave in 2011.
Snam promotes generational turnover by training new employees to support the technologi-
cal changes that will be necessary to deal with the introduction and development of new IT
systems.
The group employs 319 disabled people, whose development programmes focus on training
and integration into corporate processes.
There is not a significant presence of ethnic and linguistic minorities in our workforce, partly
due to the fact that Snam operates only in Italy.
LA15
LA13
LA1
LA13
Wellbeing among personnel
Snam offers employees and their family members a varied system of initiatives intended to
enhance their wellbeing, improve their work/life balance and improve the quality of the work
environment.
Over the years, a system of opportunities has been developed which includes:
•insurancecoverforworkandnon-workaccidents,offeringmorethanthestatutorybenefits;
•supplementalhealthcare:providesreimbursementforexpensesincurredforhealthandhos-
pital services at public and private facilities;
Snam Sustainability Report 2011 / People and work as drivers of development
DEMOgRAPhIC DIvERSITy: EMPLOyEES PER AgE BRACkET
<25
25
- 29
35
- 39
30 -
34
40 -
44
45 -
49
50 -
54
55 -
59
>60
0
300
600
900
1200
1500
1800

77
Intervention area Interventions
family • Summercampsinthecityforchildrenandadolescents,createdtoassistfamiliesduringschoolholidays• Summerbeachandmountainoutings• ThemedoutingsforadolescentsfocusingonEnglishlanguagestudies,sportsandrespectfornature• Eni0-6,acentreofexcellenceintermsofbothitsteachinganditsarchitecture,comprisesacrècheandanurseryschoolthat
cater for employees’ children aged zero to six years, allowing parents to have a better work/life balance (operational at San Donato Milanese since September 2010)
• SnowTrophy:thewintersportingeventthatinvolvesEniemployeesandtheirfamiliesinaweeklongprogrammeofskicompetitions. 126 people from Snam participated in the 2011 edition
health Promoting health: • earlycancerdetectionprogrammeincooperationwiththeItalianLeagueagainstCancerandwithparticipatinghealth
facilities, and agreements with some health centres on hospital and outpatient services and the flu vaccination campaign;• wellbeingProgramme:thisofferstheopportunitytoengageinphysicalactivitiesatselectedandapprovedsportscentresin
the vicinity of the office buildings, at preferential membership rates.
Meals• Snamiscommittedtoprovidinghighqualityincorporatecatering,usingfirst-raterawmaterialsandtakingcareinthe
preparation process to keep nutritional value intact. The commitment to guarantee people continually evolving service increasingly focused on wellbeing has also led to the restructuring of some corporate eateries, such as those in Turin (Italgas), Crema (Stogit) and San Donato Milanese (Snam). Take Away is another attractive option, combining wellbeing with the chance to save time by allowing employees to reserve and pick up dishes to eat at home.
Other agreements • Snampersonnelareofferedpreferentialtermsforobtainingpersonalloansandcreditcards,buyingusedcars,hiringcars,buying name-brand products or booking a holiday. Some agreements also offer a chance to take out insurance
• Intermsofculture,employeeshavetheopportunitytoenjoyfreeorreduced-costticketstovisitmuseumsandexhibits,attend concerts and operas, and attend international festivals, such as MITO Settembre Musica, held in Turin and Milan in autumn 2011.
LA3
•employeeaccesstosupplementalpensionfunds,whicharefundedtoagreatextentbycom-
pany contributions
Snam has adopted a welfare system using a multi-year plan involving the activation of strands
of services in the areas of “family”, “health” and “other agreements”.
As part of its respect for the environment and limiting CO2 emissions produced by personal
travel and in order to identify the most suitable solutions for effectively meeting its employ-
ees’ mobility needs, the Company offers the Mobility Management area. It was created to
encourage employees to regularly use sustainable means or methods to travel between home
and work, and offers a chance to become informed about and acquire passes for public trans-
portation and bike sharing and car sharing schemes. At San Donato Milanese, the Company
also makes available a shuttle service from the metropolitan train station to the worksite.
In 2011, as every year, employees who have provided 25 years of service to the Company
were awarded a prize and a gold medal, attesting to their individual contribution to the Com-
pany’s growth. In 2011, 452 Snam people received awards.
Snam Sustainability Report 2011 / People and work as drivers of development
WELfARE PROJECT

78
Industrial relations
Snam guarantees all workers the right to freely express their thoughts, join associations and
engage in union activities. National collective labour agreements apply to all Snam workers
(for the transportation, storage and regasification sectors, the energy and petroleum industry
agreement applies, and for distribution, the gas and water agreement applies).
In 2011, 53% of employees were members of a trade union. Special meeting spaces are pro-
vided for union activities to be engaged in, and workers enjoy dedicated leave, as provided for
by current regulations and the applicable industry agreement. All workers can submit topics
of interest to them to the unitary union representative bodies (RSU), which are periodically
replaced through elections.
In 2011, dealings between Snam and the trade unions focused, on the one hand, on devel-
oping group integration processes, dictated in particular by the implementation of the Third
European Directive and, on the other hand, on the entry into force of the more recent regula-
tions on distribution, which by introducing new rationales for assigning concessions and spe-
cific occupational requirements (the “solidarity clause”) will govern the subject in a highly
innovative manner.
From that standpoint, in a dialectical climate of intense debate, the following, among others,
have been discussed both nationally and locally and have been the subject of an agreement:
- the acquisition of the ICT and Administrative Services business units of Eni S.p.A. and Eni Ad-
fin S.p.A., respectively;
- the group’s reorganisation, which saw the transfer of transportation activities to newly
formed company Snam Trasporto, the reallocation of some activities to Stogit, again by busi-
ness unit transfer, and the creation of Snam S.p.A., with corporate functions.
At Italgas, an agreement was reached on the new operating organisation, aimed at better over-
seeing the territory in keeping with the entry into force of the abovementioned regulations..
LA4
hEALTh AnD SAfETy
Preventing accidents and working in a safe environment are primary objectives for Snam. Proof
of this can be seen in the setting up, within the companies, of appropriate organisational struc-
tures responsible for defining, scheduling and controlling plans for improving workplace health
and safety.
Within the group, a distinction is made between the duties of general management, which are
centralised within Snam, and the duties of special management, coordination and support for
operating units, which are assigned to the individual companies. Specifically, the centralised or-
ganisational structures:
•ensurethesafeguardingofknow-how;
•assistcorporateunitsinidentifyingthemosteffectivetechnicalandorganisationalsolutions;
•defineguidelines,methodologies,standardsandoperatingmethodstobeimplementedforall
of the companies;
•define,implementandmaintainmanagementsystems,includingbymeansoftechnicalaudits.
The operating companies maintain an internal organisational structure which allows them to
operate with an adequate level of decision-making autonomy.
Snam Sustainability Report 2011 / People and work as drivers of development

79
health and safety indicators 2009 2010 2011
Total employee accidents 46 37 22
LA7
In 2011, Snam continued implementing planned actions aimed at reducing workplace risk fac-
tors, grouped together within the “Objective Safety” project (see box below).
Commitment and ongoing action in recent years have enabled a signifi cant reduction in employee
accident indicator values. Over the year there were 22 accidents (-40% compared to 2010), none
of which was fatal. The frequency index was 2.22 (-37.5% compared to 2010) and the severity in-
dex was 0.06 (-40% compared to 2010).
Snam places great emphasis on health and safety issues with its suppliers and contractors, for
which it requires observance of quality standards comparable to those it puts into effect.
While contract work is being carried out, it ensures that activities are monitored periodically
by the “Contract Manager” to verify observance of contractual obligations and agreements
made during the work, and also promotes the improvement and prevention actions deemed
most appropriate.
Contractor safety was also the subject of a dedicated session within the “Suppliers’ Day for
Sustainability” workshop, during which Snam reiterated the importance of adopting behaviour
in line with prevention principles and stated that safety indices will have an increasingly sig-
nificant weight among supplier qualification and evaluation criteria. For 2012 specific projects
are being studied for sharing with suppliers the best practices on the subject adopted in op-
erations managed directly by Snam.
Snam Sustainability Report 2011 / People and work as drivers of development
EMPLOyEE ACCIDEnTS AT WORk
fREQuEnCy InDEX*
EMPLOyEE ACCIDEnTS AT WORk
SEvERITy InDEX**
2009 2010 20110
1
2
3
4
2009 2010 20110
0,05
0,1
0,15
0,25
2009 2010 20110
1
2
3
4
2009 2010 20110
0,05
0,1
0,15
0,25
* number of non-commuting accidents with incapacity of at le-ast one day, per million hours worked
** number of working days lost in relation to non-commuting accidents with incapacity of at least one day, per thousand hours worked

80
Following the rupture of the S. Stefano di Magra-Cortemaggiore methane pipeline, which oc-
curred on 18 January 2012 in the Municipality of Tresana (MS), causing a gas leakage and fi re,
a fatal accident occurred involving a worker of the company contracted for the work. Inves-
tigations are under way by the Massa Public Prosecutor’s Offi ce, which has already named a
court-appointed expert witness, who has been assigned the task of ascertaining the causes –
and effects – of the rupture, as well as any other circumstances useful for purposes of these
investigations.
Objective Safety, a project for translating values into behaviour
Launched in late 2010, the three-year Objective Safety project carried out initiatives and
actions in 2011 aimed at influencing the culture of Snam personnel to improve attitudes,
behaviour and personal responsibility with respect to workplace safety. The actions go hand
in hand with those of the Company, creating synergies and even more effective results. The
project’s goal is to reduce group accidents by involving people, so that paying heed to safe-
ty becomes a distinctive element of the corporate culture.
Objective Safety thus develops new initiatives, at the same time leveraging the best prac-
tices present in some corporate areas with the intention of making them common practice
throughout the entire group.
By putting prizes up for grabs, the Safety Trophy and the Zero Accidents Prize encourage all
company units to team up to reduce accidents in terms of both frequency and severity,
aiming to bring them down to zero. The Safety Trophy is competed for within each individual
company by workers in operating areas subdivided into “homogeneous” groups by local area,
which vie to achieve the best results in terms of workplace safety (number of accidents, se-
verity, proposals for improvement, reporting of near misses, etc.).
LA8
Snam Sustainability Report 2011 / People and work as drivers of development
COnTRACTOR ACCIDEnTS AT WORk
fREQuEnCy InDEX*
COnTRACTOR ACCIDEnTS AT WORk
SEvERITy InDEX***
* number of non-commuting accidents with incapacity of at le-ast one day, per million hours worked
** number of working days lost in relation to non-commuting accidents with incapacity of at least one day, per thousand hours worked
2009 2010 20110
2
4
6
8
10
12
14
2009 2010 20110
0,1
0,2
0,3
0,4
0,5

81
The Zero Accidents Prize, on the other hand, is extended to all corporate organisational units
and puts prizes up for grabs for all “homogeneous groups” who meet the goal of completing
365 consecutive days without an accident.
Accurate monitoring of scores, provisional quarterly rankings and “tallies” affixed in the in-
dividual units showing the number of consecutive days without an accident help to keep
people focused on the goal and increase personal involvement in the performance of an
employee’s “team”.
Among the new initiatives introduced, Safety Walks reinvigorate the way safety is handled,
creating occasions in which top management, as active project sponsors, meet up with
Snam personnel to shadow their operational activities on site, reiterating with their pres-
ence the importance of participatory involvement by all company staff to achieve effec-
tive workplace safety. Safety Walks are held at all group companies from May to October at
various sites spread throughout Italy: in 2011 the Verona and Venice operating centres, the
Sergnano station and the Panigaglia plant were involved.
The group’s intranet site with articles supporting project initiatives and results, the state-
ments affixed at the headquarters of the four companies for purposes of reiterating the
goals sought by the project, the videos designed to summarise the meaning of the initia-
tives carried out in images, and a dedicated newsletter are all communication and training
tools that help consolidate knowledge and revive attention on the subject. In fact, in June
2011, the newsletter Objective Safety News was started, dealing specifically and in-depth
with workplace health and safety issues, risks and tools. The newsletter, produced in paper
Snam Sustainability Report 2011 / People and work as drivers of development

82
format and distributed to all Snam group personnel, contains in each issue not only in-
depth information on specific safety topics and explanations on the proper use of personal
protective equipment (PPE), but also a comic strip in which the project mascot, Gaspare, a
keen but slightly distracted manual worker, learns, partly through mistakes, the importance
of unflagging attention to observing safety rules.
In November 2011, the project celebrated its first birthday and the significant results
achieved by group companies in terms of reducing the number of accidents. On this occa-
sion, top management renewed its decided commitment, confirmed as one of the drivers
characterising the project, through a video by Snam’s CEO geared toward employees and
disseminated throughout the group companies.
The year 2012 will be a year of renewed commitment to the Objective Safety Project, which
will shore up the initiatives already started and introduce additional actions aimed at im-
proving results continually.
Involvement and internal communication
Snam considers communication to be a fundamental driver for promoting personal partici-
pation, going beyond information to create awareness, sharing and debate.
Through an integrated approach to group-wide internal communications, while still respect-
ing the different company needs, Snam shares values, challenges and goals, increasing the
degree of employees’ satisfaction in performing their activities.
Sharing values and principles, as well as projects and initiatives, takes place through numer-
ous channels and tools.
The group’s intranet site is structured not only as an information tool, but also as a place
for sharing and developing knowledge. Boxes are used to delve into current issues in depth,
support initiatives and launch projects. In 2011, videos were mainly used as tools for im-
mediately disseminating crucial issues and reporting significant events; there are films, for
example, in which top management communicates objectives, values and results (such as
the video series “Looking at 2011”, published in early 2011 and focused on near-term strat-
egies and objectives) or comments on Company milestones (such as the report for the first
year of the Objective Safety Project). Other videos, on the other hand, involve people and
turn highlights in corporate life or significant events into common heritage; this is the case,
for example, with the Objective Safety Project’s Safety Walks, the 10th anniversary of Stogit
and the launch of the new Snam brand.
The 62 news items posted online in 2011 give preference to topics associated with results
and corporate life, sustainability and workplace safety.
The distinctive factor characterising the group intranet site is shared content management.
The energy corporate network calls, in fact, for widespread writing at the level of the organi-
sational units, which, with a network of more than 120 correspondents, feed and update the
section on the site under their responsibility with content and documentation, so that the
website is the result of contributions from the different organisational areas of each com-
pany and makes specific knowledge and skills available to all.
In order to involve all group personnel, including those difficult to reach with the computer
network, Snam makes and uses many paper tools: posters, flyers, brochures and newsletters
Snam Sustainability Report 2011 / People and work as drivers of development

83
(Objective Safety News, Work Force Management News, and the “energie” newsletter). In
particular, the “energie” newsletter, distributed to everyone at the four companies, followed
corporate and market developments in 2011, commenting on regulatory changes that open
up new business and organisational scenarios, so that everyone at Snam has a wealth of
information to feel part of a group that pursues ambitious goals and is going through im-
portant changes.
Reaching everyone in a timely manner is a signal that values both the person, involving
families too, and the message: for this reason, the “energie” newsletter is sent to each group
employee’s home.
In 2011, the Sustainability Report was also sent to group people in order to share the stages
of the sustainable development process, demonstrating the great commitment and initia-
tives undertaken with people, the environment and the local areas in which Snam operates.
Another important area in which time and resources are invested is meetings between peo-
ple, a significant vehicle for knowledge and sharing. In 2011 this area was broken down into
a series of events and initiatives in which top management communicated results, goals,
scenarios and values to people.
Sapernedi+ is an initiative that organises group-wide opportunities for meetings, the dis-
semination of corporate values and strategies and the sharing of issues, problems and so-
lutions identified by the individual organisational units. It is also an opportunity for in-
creasing managers’ managerial skills and consolidating their role as bosses through a time
for involvement and communication with their employees. Sapernedi+ was carried out in
autumn 2011 at all organisational units, with a “cascade” process that enabled it to reach
everyone at Snam, becoming a significant opportunity for involvement on new scenarios
and the coming group reorganisation, as well as for debate on activities and projects of the
organisational unit itself.
Snam Sustainability Report 2011 / People and work as drivers of development

84
help from the network, corporate volunteering that comes from being involved
In 2011 Snam developed a project that
identifi es and implements corporate vol-
unteering actions. Involvement by Snam
people in every project phase and the in-
tent to build a dialogue between company
areas and the volunteer world are the basis
of the project.
The three cornerstones of the project (as
shown in the chart) are: integrated sustain-
ability, involvement and participation, and
meeting points.
In its launch year, the project was focused
on the group’s two main management sites:
San Donato Milanese and Turin, which have a
target population of more than 1,100 people.
In May 2011, an internal survey was con-
ducted, the results of which, used to guide the
next phases of the project, attest to strong in-
terest in the world of volunteering. Employees
were also involved in choosing the name to
be given to the corporate volunteering pro-
ject: thus “Help from the network” was born.
In 2011, the project’s fi rst important initia-
tive was held: the Snam “Volunteering Week”,
which saw a meeting between Snam people
and the non-profi t sector and led to a week
of events at corporate sites, during working
hours, in which volunteer associations, foun-
dations and non-profi ts introduced them-
selves independently to employees interested
in the initiative, out of the conviction that,
through knowledge, the right conditions can
be created for increasing interest in the world
of volunteering and implementing occasions
for meetings and cooperation.
Snam Sustainability Report 2011 / People and work as drivers of development

85Snam Sustainability Report 2011 / People and work as drivers of development
Even in the phase of identifying the asso-
ciations to be invited to the initiative, the
Company chose its people’s involvement as
a distinctive factor of the project. Employees
were thus prompted to point out non-profi t
organisations of interest to them, because
often they are active there as volunteers, and
83% of the associations invited came from
this channel.
The gatherings, open to all employees at the
two sites involved, were held from 21 to 25
November 2011, with 340 participants.
The 34 associations joining the initiative
presented their activities and their areas
of intervention, focusing on the volunteer-
ing opportunities offered in their sectors,
ranging from the environment to social as-
sistance, from international cooperation to
socio-educational issues, and from health
to protecting rights. Among the participat-
ing organisations, large and extremely well-
known non-profi t organisations were side
by side with small associations established
in local areas and operating in specifi c fi elds.
During the gatherings, participants showed
great interest and asked a number of ques-
tions, meaning the presentations turned into
dialogues.
Following the week of gatherings, the group
created Volunteering Round Tables, ad hoc
spaces set up to renew contact and become
better acquainted with the associations in-
volved, where informational and educational
materials brought by the associations (bro-
chures, magazines, leafl ets and fl yers) were
made available to Snam people.
A detailed communications plan supported
the project during 2011, identifying tools,
channels and timings: the project logo, post-
ers, emails, detailed programmes and news
were used to launch the project, raise aware-
ness in advance of the initiative and get peo-
ple involved in corporate volunteering.
For 2012, additional initiatives are being
studied, so that the meeting point between
Snam people and the world of volunteering
will develop and grow.
Meeting up• The project takes its shape from the meeting point
between the company’s intentions and people’s
interests
• The initiatives are focused on meetings between
the corporate world and the volunteer world
• Meetings are the starting point for future actions
(collaborations, volunteering, support).
Integrated sustainabilityThe company aims to achieve a sustainability
profile that creates synergies, involving the
outside world (with special attention to local
social specifics) with the internal culture
(increasing personal awareness, sustainable
actions through Snam people).
Involvement and participationPersonal involvement is at the heart of the project:
• Employees are surveyed to assess their interest in the subject
and to guide the project’s activities;
• The choice of the name to be given to the project was left up
to employees;
• The volunteer associations involved in the initiatives are
largely ones pinpointed by Snam people.

86 Snam Bilancio di Sostenibilità 2011
APPENDIx
nOTE On METhODOLOgy
The Snam Sustainability Report refers to the year ending on 31 December 2011 and maintains
the same reporting scope as the previous year, except for the information on corporate gov-
ernance, which refers instead to the new corporate structure on the date of publication of the
Report.
The document includes the information for stakeholders provided in the Consolidated Annual
Report, showing physical and monetary data and performance indicators indicative of the entire
range of significant social, environmental and economic impacts of Snam’s different activities:
•transportation(SnamReteGasS.p.A.);
•liquefiednaturalgasregasification(GNLItaliaS.p.A);
•storage(StogitS.p.A.);
•distribution(ItalgasS.p.A.,withsubsidiaryNapoletanagas).
Economical information presented in this report are drawn from Snam's Consolidated Annual
Report, while the methods of calculation used to determine the different indicators are de-
scribed in the specific sections.
In addition, information is provided in the appropriate form on significant events occurring
after the end of the year.

87
To ensure the comparability over time of the indicators deemed most significant and to give
the reader the chance to compare the performance obtained, current values have been placed
alongside those for the previous two years, using graphs and tables.
The Report is prepared in accordance with the Reporting Guidelines in their most up-to-date
G3.1 version, issued by the Global Reporting Initiative in May 2011. The Report’s level of com-
pliance with the standards has been enhanced through more specific coverage of all the “core”
indicators. In fact, the group’s self-declared level of compliance, as certified by GRI itself, in-
creased from B+ to A+, the highest grade possible.
Verification of the Report’s reconciliation with GRI protocols is facilitated by the specific table
appended to the Report
The process of gathering data and information and preparing the Report was coordinated and
managed by the Sustainability unit of the parent company, Snam, in cooperation with the dif-
ferent corporate functions and the operating companies. The publication of the document, si-
multaneous with that of the Consolidated Annual Report, is subject to approval by the Board of
Directors of Snam on 12 March 2012.
This Report has been reviewed by the external auditor engaged to perform the audit of Snam's
annual report (Ernst & young) based on the principles and guidelines of the International Stand-
ard on Assurance Engagements (ISAE 3000) issued by the International Auditing and Assurance
Standards Board (IAASB). The results of the audits performed are included in the compliance
certification appended to this report.
Lastly, this year, as is customary, the contents of the Report and further information are post-
ed on the sustainability section of the website, www.snam.it.
Period of reference 2011
Report coverage Annual
Previous report 2010 Sustainability Report
Contact person Domenico Negrini - Bruno Andreetto
Snam Spa - Piazza Santa Barbara, 7 - San Donato Milanese (MI)
Accessibility www.snam.it
email [email protected] - [email protected]
Legend:
Following the new organisational structure, Snam has redefined the key performance indicators (KPIs).KPIs make it possible to monitor specific sustainability targets, from the standpoint of continual improvement.The pre-set targets and the results obtained during the year are reported in the relevant chapters.
KPI symbols – Activity status Target achieved Annual target achieved (KPI with multi-year targets)
Activity in progress
The document contains the codes corresponding to the GRI guidelines, for ease of reference and interpretation.
GRI Indicator Symbols EC1 (e.g.) Content corresponding to a GRI indicator
Snam Sustainability Report 2011 / Appendix

88
PERfORMAnCE InDICATORS
Snam group – main operating data* 2009 2010 2011
natural gas transportation
Gas injected into the network (109 m3) 76.9 83.32 78.3
Gas pipeline network (km) 31,531 31,680 32,010
Average distance covered by gas in the Italy transportation network (km) 639 634 506
Gas compression stations for transportation (No.) 11 11 11
Installed capacity at gas compression stations (MW) 830 861 884
Liquefied natural gas regasification
Liquefied natural gas injected into the network (109 m3) 1.32 1.98 1.89
Number of methane tankers unloaded 38 54 50
natural gas storage
Gas injected into storage sites (109 m3) 7.81 8 7.78
Gas provided from storage sites (109 m3) 8.71 7.59 7.53
Operating concessions (No.) 8 8 8
natural gas distribution
Distribution network (km) 49,973 50,307 50,301
Gas carried in the distribution network (109 m3) 7.537 7.953 7.450
Concessions (No.) 1,441 1,448 1,449
Snam group – main economic data* 2009 2010 2011
Core business revenue (b) (€ million) 2,438 3,475 3,539
Operating expenses (€ million) 581 968 993
Operating profit (€million) 1,274 1,862 1,958
Net profit (€ million) 732 1,106 790
Technical investments (€ million) 1,254 1,540 1,585
Net invested capital at 31 December (€ million) 15,652 16,257 16,989
Shareholders' equity including minority interests (€ million) 5,703 5,916 5,792
Shareholders’ equity, Group share, at 31 December (€ million) 5,702 5,915 5,791
Net financial debt at 31 December (€ million) 9,949 10,341 11,197
Free Cash Flow (€ million) -4,489 382 -52
Number of shares of share capital (million) 3,570.80 3,570.80 3,571.20
Number of shares outstanding on 31 December (million) 3,375.90 3,376.60 3,378.60
Average number of shares outstanding during the year (c) (million) 2,579.30 3,376.20 3,378.00
Period end official share price (€) 3.46 3.73 3.39
Average official share price during the period (€) 3.22 3.59 3.75
Market capitalisation (€ million) 11,681 12,595 11,454
Dividends for the period ( € million) 675 777 811
Dividends paid during the period (€ million) 450 776 811
Environmental expenses (€ million) 93.6 94.5 113.2
Health and safety expenses (€ million) 31. 29.7 31.4
*For comments on the economic and financial results, please refer to the 2011 annual financial report
Snam Sustainability Report 2011 / Appendix

89
Snam group – main social indicators 2009 2010 2011
Employees (No.) 6,187 6,104 6,112
Executives (No.) 121 116 118
Managers (No.) 493 508 544
Office workers (No.) 3,320 3,243 3,277
Manual workers (No.) 2,253 2,237 2,173
Men (No.) 5,589 5,521 5,469
Women (No.) 598 583 643
Men/women compensation differential (executive category) - 1.03 0.973
Men/women compensation differential (manager category) - 0.97 0.94
Men/women compensation differential (office worker category) - 0.94 0.91
Employee average age (years) 47 48 48
Seniority (years) 22 23 23
Recruitment during the year from the market (No.) 40 55 140
Other incoming employees (from Eni, non-consolidated companies, etc.) (No.) 128 82 228
Percentage of university graduates hired (%) 18 28.5 36.4
Departures during the year (No.) 295 220 360
Employee accident frequency index 4.54 3.55 2.22
Employee accident severity index 0.18 0.1 0.06
Contractor accident frequency index 12.74 8.87 8.97
Contractor accident severity index 0.43 0.3 0.35
Hours of training/No. of employees 25 24 30
Hours of training on health matters 7,405
Hours of training on safety matters 21,158
Hours of training on environmental matters 2,093
TotalHSEQauditsperformed(No.) 239 347 359
Environmental investigations (No.) 771 357 401
Medical examinations (No.) 2,634 3,180 2,533
Diagnostic exams (No.) 4,288 3,934 2,027
Snam group – main environmental indicators 2009 2010 2011
Natural gas emissions (106 m3) 99.9 100.8 96.9
Total GHG emissions (103 t CO2eq
) 2,451 2,691 2,265
CO2 emissions (103 t) 799.4 1,057.5 694.5
Indirect CO2 emissions (103 t) 50.5 54.9 36.0
NOx emissions (t) 1,353 1,683 919
CO emissions (t) 926 618 383
Total waste production (t) 96,618 120,519 66,072
Non-hazardous waste production (t) 68,886 103,185 40,467
Hazardous waste production (t) 27,732 17,334 25,605
Waste recovered from production activities (%) - 59 59
Water procurement (103 m3) 4,787 4,687 4,354
Water discharges (103 m3) 4,479 4,449 4,168
Snam Sustainability Report 2011 / Appendix
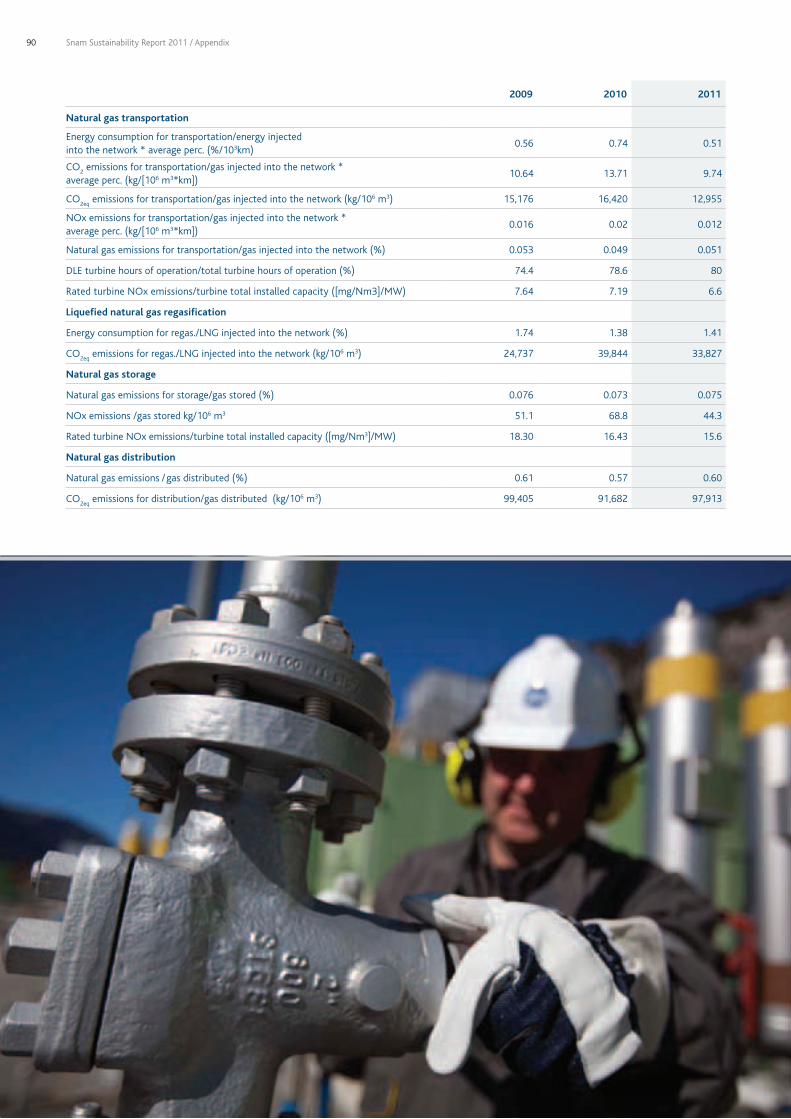
90
2009 2010 2011
natural gas transportation
Energy consumption for transportation/energy injected into the network * average perc. (%/103km)
0.56 0.74 0.51
CO2 emissions for transportation/gas injected into the network *
average perc. (kg/[106 m3*km]) 10.64 13.71 9.74
CO2eq
emissions for transportation/gas injected into the network (kg/106 m3) 15,176 16,420 12,955
NOx emissions for transportation/gas injected into the network * average perc. (kg/[106 m3*km])
0.016 0.02 0.012
Natural gas emissions for transportation/gas injected into the network (%) 0.053 0.049 0.051
DLE turbine hours of operation/total turbine hours of operation (%) 74.4 78.6 80
Rated turbine NOx emissions/turbine total installed capacity ([mg/Nm3]/MW) 7.64 7.19 6.6
Liquefied natural gas regasification
Energy consumption for regas./LNG injected into the network (%) 1.74 1.38 1.41
CO2eq
emissions for regas./LNG injected into the network (kg/106 m3) 24,737 39,844 33,827
natural gas storage
Natural gas emissions for storage/gas stored (%) 0.076 0.073 0.075
NOx emissions /gas stored kg/106 m3 51.1 68.8 44.3
Rated turbine NOx emissions/turbine total installed capacity ([mg/Nm3]/MW) 18.30 16.43 15.6
natural gas distribution
Natural gas emissions /gas distributed (%) 0.61 0.57 0.60
CO2eq
emissions for distribution/gas distributed (kg/106 m3) 99,405 91,682 97,913
Snam Sustainability Report 2011 / Appendix

91Snam Bilancio di Sostenibilità 2011 / Appendice
GRI TABLE
Legend:
•ThePresence column indicates the level of compliance with the standards (disclosure) ac-
cording to the legend specified below:
Fully reported
(the data/information meet the requirements of the standards completely)
Partially reported
(the data/information meet the requirements of the standards only in part)
- Not reported
(the data/information have not been gathered or are not sufficiently representative)
n.a. Not applicable
(the data/information called for by the standards are not significant or are not relevant)
•TheReferences column indicates the report pages where the contents referring to the re-
quirements of the standards are shown (pages in italics refer to full sector details)
•Thenotes / Comments column includes information additional to the Sustainability Report
or that provides further clarification on the statements made in the Report.
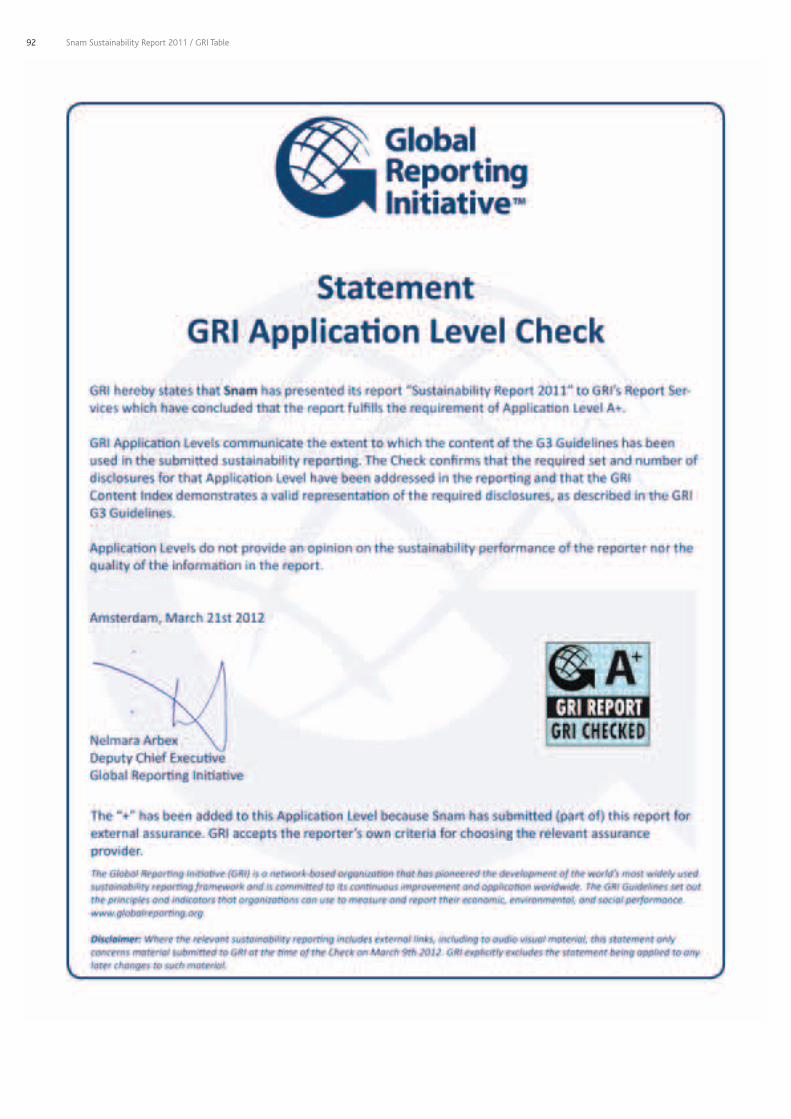
92 Snam Sustainability Report 2011 / GRI Table

93
Presence References notes / Comments
1.1 Message from top manager – Message from CEO 4-5
1.2 Description of principal impacts, risks and opportunities (in terms of sustainability) 24-31
Presence References notes / Comments
2.1 Name of the organisation Cover-87
2.2 Main activity 10-14
2.3 Organisational structure 15-17
2.4 Location of general headquarters Third of cover-87
2.5 Local market presence 13-14, 20
2.6 Ownership structure 19
2.7 Markets served 10-14
2.8-2.9 Size of the organisation and significant changes in size, structure and ownership structure
10-14
2.10 Awards and prizes received during the period 9
STRATEgy AnD AnALySIS
PROfILE
Presence References notes / Comments
3.1-3.3Period of reference of the document, last report published and frequency of reporting
86-87
3.4 Contact persons and addresses 87
3.5-3.7 Reporting process, scope and limitations 86-87
3.8 Information on joint ventures, subsidiaries, leased plants, outsourcing activity and other
86
3.9 Data measurement techniques and basis for calculation 86-87
The calculation methods used to determine the various figures are indicated in the relevant related sections.
3.10 Explanation of effects of any change to information included in previous reports and reasons
86-87
3.11 Significant changes in objective, scope or measurement methods used 86-87
3.12 Table of G3.1 content 93-97
3.13 Policies and practices on independent auditing 99-100
PARAMETERS Of ThE REPORT
Snam Sustainability Report 2011 / GRI Table

94
ECOnOMIC InDICATORS (EC) Presence References notes / Comments
Information on operating method (EC) 11-17,
21, 33-36, 43-47
EC1 core Economic value generated and distributed directly 21, 88
EC2 core Economic and financial implications associated with climate change 62
EC3 coreCoverage of obligations assumed at the time of defining the pension plan (benefit plan obligations)
Snam offers its employees pension coverage that is supplemental to the public system, on a voluntary acceptance basis. At the time of termination of employment, all employees receive post-employment benefits. (Please refer to the Consolidated Annual Report and to the website, www.fondenergia.it)
EC4 core Significant government economic assistance There is none
EC5 addRatio of wages of new hires to local minimum wage in the most significant operating sites
-
EC6 core Policies, practices, and percentage of expenses concentrated on local suppliers 45
EC7 coreProcedures for hiring people residing where the activity is primarily carried out and percentage of senior managers hired in local communities
18
EC8 coreimpacts of investments in infrastructure for the benefit of local communities, through commercial commitments, donations of products/services or other pro-bono activities
49
EC9 addAnalysis and description of main indirect economic impacts considering the external effects generated
-
PERfORMAnCE InDICATORS
Presence References notes / Comments
4.1 Governance structure 15
4.2 Executive status of Chairman The chairman of the Board of Directors is a non-executive
4.3 Independence of governance bodies 15-16
4.4 Mechanisms available to shareholders and employees to provide recommendations or directives to the highest governance body
Investors are asked to exercise their role at shareholders’ meetings. For information on how shareholders’ meetings work, see the governance report. To encourage dialogue with shareholders, SNAM has an Investor Relations function
4.5 Link between compensation and performance of the organisation See the Corporate Governance Report
4.6 Activities to ensure that conflicts of interest do not occur 15-16
4.7 Processes for determining the qualifications of the highest governance body to guide the organisation’s strategy
See the website, www.snam.it
4.8 Mission, values and Code of Conduct See the website, www.snam.it
4.9 Procedures and committees for managing sustainability-related performance 25
4.10 Performance evaluation of the members of the highest governance body See the Corporate Governance Report
4.11 Explanation of any method of application of the prudence principle or approach 24-31
4.12 Signing and adoption of codes of conduct, principles and charters developed by external organisations
16
4.13 Participation in trade associations 53 See the website, www.snam.it
4.14 List of stakeholders with which the Company interacts 18-20
4.15 Principles for identifying stakeholders 18-20
4.16 Approach adopted for the activity of involving stakeholders 18
4.17 Results of involvement 38-53, 69-85
gOvERnAnCE, COMMITMEnTS AnD EngAgEMEnT
Snam Sustainability Report 2011 / GRI Table

95
EnvIROnMEnTAL InDICATORS (En) Presence References notes / Comments
Information on operating method (En) 45-47,54-69
EN1 core Raw materials used by weight and volume 45-47
EN2 core Percentage of material used deriving from recycled material 67
EN3 core Direct energy consumption broken down by primary energy source 63-64, 89-90
EN4 core Indirect energy consumption broken down by primary energy source 63, 89-90
EN5 add Energy savings due to conservation and improvements in terms of efficiency 64-65,89-90
EN6 addInitiatives to provide services that are energy efficient or based on renewable energy and consequent reduction in energy needs as a result of these initiatives
64
EN7 addInitiatives geared toward reducing indirect energy consumption and reductions obtained
63-64
EN8 core Total water procurement broken down by source 68, 89
EN9 add Water sources significantly affected by water consumption 68
EN10 add Percentage and total volume of water recycled or reused 68, 89
EN11coreLocation and size of land owned, leased or managed in protected areas (or adjacent to protected areas) or in areas with high biodiversity outside of protected areas.
56We will assess whether to expand upon this information in the next report
EN12 coreDescription of the major impacts of activities, products and services on the biodiversity of protected areas or of areas with high biodiversity outside
56-58
EN13 add Protected or restored habitats 56-58
EN14 addStrategies, actions implemented, future plans for managing impacts on biodiversity
56-58
EN15 addNumber of protected species that have their habitat in the organisation’s areas of operation, broken down by level of risk of extinction
-
EN16 core Total direct and indirect greenhouse gas emissions by weight 60-63
EN17 core Other indirect greenhouse gas emissions by weight 60, 62
EN18 add Initiatives to reduce greenhouse gas emissions and results achieved 60
EN19 core Emissions of substances harmful to the ozone layer by weight. 69
EN20 coreNOx, SOx and other significant emissions into the air broken down by type and weight
65-66
EN21 core Total water discharged by quality and destination 68, 89
EN22 core Total weight of waste by type and by disposal method 66-67, 89
EN23 core Total number and volume of significant spills No significant spills occurred during the period
EN24 addWeight of waste classified as hazardous that is transported, imported, exported, or treated and the percentage transported abroad.
-
EN25 addIdentity, size, protection status and value of the biodiversity of aquatic fauna and flora and the respective habitats significantly affected by water discharges
-
EN26 coreInitiatives to mitigate the environmental impact of products and services and degree of mitigation of the impact
60-69
EN27 corePercentage of products sold and respective packaging material recycled or reused by category
n.a.
Not relevant, since Snam’s core business is the provision of services that do not involve the use of packaging
EN28 coreMonetary value of significant fines and number of non-monetary penalties due to failure to comply with environmental laws and regulations
In 2011, there was one administrative fine of about €500 due to a delayed notification
EN 29 addSignificant environmental impacts from the transportation of goods/materials used for the organisation’s activity and for personnel travel
-
EN 30 add Expenses and investments in environmental protection, broken down by type 59
Snam Sustainability Report 2011 / GRI Table

96
LABOuR InDICATORS (LA) Presence References notes / Comments
Information on operating method (LA) 71-82
LA1 coreTotal number of employees, broken down by type, type of contract and geographic distribution.
18, 72, 76, 89
LA2 coreTotal number of personnel and turnover rate, broken down by age, sex and geographic area
70, 89
LA3 add Benefits provided for full-time workers 71, 76-77
LA4 core Percentage of employees covered by collective labour agreements 78
LA5 coreMinimum period of notice for operational modifications (organisational changes), specifying whether or not such conditions are included in the collective labour agreement
The provisions of the national collective labour agreements are applied (see LA 4)
LA6 add Percentage of workers represented on the health and safety committee
Worker representation is ensured through ref. T.U. Legislative Decree No. 81/2008 and the national agreements
LA7 coreRate of workplace accidents, sickness, lost work days, absenteeism and total number of deaths, broken down by geographic area
72, 78
LA8 coreEducational, training, consulting, and risk prevention and control programmes implemented in support of workers, their families or the community, relative to disturbances or serious diseases
79
LA9 add Union agreements on health and safety
Worker representation is ensured through ref. T.U. Legislative Decree No. 81/2008 and the national agreements
LA10 coreAverage annual hours of training per employee, broken down by worker classification
72
LA11 addProgrammes for managing skills and for promoting training/continuing education in support of the continuing employment of employees and for managing the final phase of their careers
72-73
LA12 addPercentage of employees who regularly receive performance and career development evaluations
74-75
LA13 coreComposition of the Company’s governance boards and breakdown of employees by classification based on gender, age, belonging to protected categories and other diversity indicators
75-76See Consolidated Annual Report for the composition of the governance bodies
LA14 core Ratio of men’s base wages to women’s base wages for the same classification 89
LA15 core Rate of return to work after parental leave 76
huMAn RIghTS InDICATORS (hR) Presence References notes / Comments
Information on operating method (hR) 16-17,45-47
HR1 coreNumber and percentage of investments that include clauses on respecting human rights
The investments are made in Italy.
HR2 corePercentage of suppliers and contractors that are subjected to audits on human rights and respective actions taken
45-47 99.9% of suppliers are located in European countries, where respect for human rights is
HR3 addTotal hours of employee training on policies and procedures concerning human rights and percentage of workers trained
73
HR4 core Total number of episodes of discriminatory practices and actions taken 17
HR5 coreIdentification of activities in which the freedom of association and collective bargaining could be exposed to significant risks and actions taken in defence of such rights
SNAM operates in Italy and applies the current regulations on the subject
HR6 coreIdentification of operations at high risk for recourse to child labour and the measures adopted to aid its elimination
SNAM operates in Italy and applies the current regulations
HR7 coreActivities at high risk for recourse to forced or compulsory labour and measures taken to aid their elimination
SNAM operates in Italy and applies the current regulations
HR8 addPercentage of safety personnel that have received training on human rights procedures and policies
In the area of site safety, Snam predominantly employs specialised external companies that train staff directly
HR9 add Number of violations of rights of local communities and actions taken 17
HR10 core Operations analysed for purposes of the human rights impact n.a. Not relevant, since SNAM is a regulated company
HR11 core Composition of disputes on human rights n.a. Not relevant, since SNAM is a regulated company
Snam Sustainability Report 2011 / GRI Table

97
SOCIETy InDICATORS (SO) Presence References notes / Comments
Information on operating method (SO)6-7, 39-40,
45-54, 84-85
SO1 coreNature, objective and effectiveness of programmes and/or practices for evaluating and managing impact on a given community, including activity commencement, operation and decommissioning phases
54-58, 69
SO2 core Percentage of business units analysed for corruption risk 16-17
SO3 core Percentage of employees with anti-corruption training 73
SO4 core Actions taken in response to incidents of corruption 17
SO5 corePositions on public policy, participation in the development of public policies and pressures exercised
53
For a list of associations in which Snam participates, see http://www.snam.it/it/sostenibilita/area-economica/tecnologia-innovazione/enti_istituz_snam.html
SO6 addTotal financial contributions and benefits provided to parties, politicians and institutions by country
SNAM does not make direct or indirect contributions in any form to political and union parties, movements, committees or organisations, their representatives or their candidates, except those provided for by specific regulations
SO7 addTotal legal actions regarding unfair competition, anti-trust and monopolistic practices and respective judgments
-
SO8 coreMonetary value of significant fines and total number of non-monetary penalties due to non-compliance with laws or regulations
See Consolidated Annual Report
SO 9 core Operations with potential negative impact on local communities 54-57
SO10 corePrevention measures adopted to mitigate the negative impact of operations on local communities
54-57
PRODuCT RESPOnSIBILITy InDICATORS (PR) Presence References notes / Comments
Information on operating method (PR) 36-43
PR1 core Impact of product on health and safety 36-37 See PR3
PR2 add Total cases of non-compliance with regulations and voluntary codes -
PR3 core Consumer and labelling information 36-37
PR4 addTotal cases of non-compliance with regulations or voluntary codes on information on and labelling of products/services
n.a.
PR5 add Customer satisfaction practices 42
PR6 core Compliance with laws, standards and voluntary codes on marketing activities n.a.Not relevant, since SNAM is a regulated company
PR7 addTotal cases of non-compliance with regulations or voluntary codes on marketing activities
n.a.Not relevant, since SNAM is a regulated company
PR8 add Number of complaints for violation of privacy and loss of consumer information -
PR9 coreAmount of penalties for violation of regulations on the supply and use of products and services
41
Snam Sustainability Report 2011 / GRI Table

98
gLOBAL COMPACT RECOnCILIATIOn TABLE
global Compact – the ten principles 2011 Sustainability Report gRI Indicators
human rights
Principle 1, 2 – Companies are asked to promote and respect universally recognised human rights in their respective spheres of influence and to make sure they are not complicit, even indirectly, in human rights violations.
•RespectforhumanrightsisexpresslymentionedintheSnamCodeofEthicsand in contractual relations with suppliers. Since early 2012, all companies in the Snam group disclose to all employees and partners, through contractual documentation, the ten principles stated by the Global Compact with the intention of disseminating the values contained in them. Pages. 7, 15-17, 45-47
•Snamiscommitted,asstatedintheCodeofEthics,tofightinganyformofdiscrimination and respecting any type of diversity. pages 7, 16
•SnamoperatesinfullcompliancewithItalianlaw,withthesettingoflegalagebeing an indispensable requirement for hiring at the Company, pages 15-17
•AllsuppliersareaskedtoacceptandrespecttheCodeofEthicsandthedeclarationnotto employ personnel younger than the minimum age stipulated by law, pages 45-47
•AninitiativehasbeenimplementedtodisseminatetheGlobalCompactprinciplesamong company suppliers, with the adoption of explanatory cover pages on contracts, pages 45-47
•Auditsareperformedatsuppliers,pages45-47
HR1, HR2, HR3, HR4, HR8, LA4, LA7, LA8, LA13
Labour
Principle 1, 2 - Companies are asked to promote and respect universally recognised human rights in their respective spheres of influence and to make sure they are not complicit, even indirectly, in human rights violations
•TheEnergyandPetroleumandGas-Waternationalcollectivelabouragreementsapply. All workers are guaranteed the right to express their own thoughts, join associations and engage in union activity, page 78
•AllcompaniesintheSnamgrouparecompletingtheprocedureformanagingtheworker health and safety management system according to the OHSAS 18001 standards, pages 28-29
•Snamhasalsoheldaworkshopwithfulldetailsonworkplacehealthandsafety,page 47
•InitiativeshavebeendevelopedassociatedwiththeObjectiveSafetyProject,which involves all Snam companies. The project also includes the “Safety Trophy” and “Zero Accidents Prize”, pages 80-81
•Morethan30,000hoursoftrainingonhealth,safetyandenvironmentaltopicshave been provided, page 73
•Snamadoptsacollectiveincentiveprogrammeandusestoolstoevaluatetheperformance of all employees, pages 74-75
•Initiativesarepromotedtoencourageagoodwork/lifebalance,pages76-77•Thegroupintranetplatformwasmadetoencourageintegrationbetweenthe
different companies, pages 82-83
HR1, HR2, LA2, LA3, LA4, LA7, LA8,
LA12, LA13
Environment
Principle 7, 8, 9 – Companies are asked to maintain a preventive approach to environmental challenges; to undertake initiatives that promote greater environmental responsibility; and to encourage the development and dissemination of technologies that respect the environment
•ThecompaniesarecertifiedaccordingtotheISO14001standard,andapreventive environmental approach aimed at continual improvement is adopted, pages 28-29
•Thebesttechnologiesavailablehavebeenadoptedtominimiseenvironmentalimpacts, and plants have been started up for the production of energy from renewable sources, pages 60-66
•Eco-responsiblebehaviourhasbeenencouragedatoffices,suchassortingwasteat canteens and the use of recycled paper, page 67
•Snamhasjoinedtheinternationalinitiative“CleanUptheWorld”,promotedbyLegambiente, involving the active participation of employees and some school students, page 52
•Snamparticularlypaysattentiontobiodiversityissuesinrelationtoitsrelationship with stakeholders and to its operating activities, taking as reference the Millennium Development Goal concerning environmental and biodiversity protection, pages 7, 56-58
EN3, EN4, EN6, EN7, EN8, EN9,
EN12, EN13, EN14, EN16, EN18, EN20, EN21, EN22; EN24,
EN26, EN30
fight against corruption
Principle 10 – Companies commit to fighting corruption in any form, including extortion and bribery
•TheAnti-CorruptionGuidelineshavebeenadoptedandtheorganisationalstructure has been made compliant with the creation of the Anti-Corruption Legal Support Unit, page 17
•TrainingactivitiesonModel231andonthetopicoffightingcorruptionhavebeen provided, page 73
SO2, SO3, SO4
Snam Sustainability Report 2011 / GRI Table

99
LETTER Of ASSuRAnCE

100

Format control
Snam - Sostenibilità
graphics
Inarea e Opera
Pre-printing
Opera
Printing
The Good Company
Printed on ecological paper:
Fedrigoni Symbol Freelife
For informations:
Snam S.p.A - Sostenibilità
Piazza Santa Barbara, 7
20097 San Donato Milanese (MI)
E-mail: [email protected]
Website: www.snam.it
Piazza Santa Barbara, 7
20097 San Donato Milanese - Milano
Tel +39.0237031
April 2012

www.snam.it


