Embed Size (px)
Citation preview
SUMMARY : This research was aimed at assessing the effectiveness of marketing services. The studywas conducted in Faridabad from Haryana, Hapur from Uttar Pradesh and North-West Delhi from Delhiselected purposively to explore the marketing extension system as they adequately represent the peri-urban agriculture. 90 farmers, 30 rice, wheat and tomato grower farmers from each district were selectedto constitute the total sample size. Interview schedule were used in eliciting information from thefarmers. Effectiveness were analysed using indicators specifically marketable surplus, producer sharein consumer prices, middlemen share in consumer prices, marketing cost, marketing margin, pricespread and marketing efficiency using Shepherd’s equation. The study found that marketing cost ishigh when more intermediaries are involved in marketing of produce. Producer’s share in consumer’sprice is high when produce is directly sold to consumer by producer. Marketing efficiency of cereals ishigh than vegetable crop because of heavy transport and post harvest losses occur in vegetables.
How to cite this article : Kumar, Sushil, Singh, Rashmi and Yogi, Vikram (2016). An analysis of the marketingeffectiveness of the farmers. Agric. Update, 11(4): 351-358; DOI : 10.15740/HAS/AU/11.4/351-358.
BACKGROUND AND OBJECTIVES
Agriculture in peri-urban areas mayinclude a wide range of activities such asfisheries, poultry and goat rearing, horticulture,floriculture, dairy farming, cattle farming andarable farming. The pervading characteristicof peri-urban areas is the concentration of poorpeople, consisting of inner-city as well as ruralmigrants and/or marginal local farmers. Fringeareas in Asia are characterized by denselypopulated intensive smallholder agriculture(McGee, 1991 and Druijven and Singh, 1994).The road and railway networks are reasonablywell developed, facilitating access to nearbyurban markets. The additional availability of
An analysis of the marketing effectiveness of thefarmers
SUSHIL KUMAR, RASHMI SINGH AND VIKRAM YOGI
HIND AGRICULTURAL RESEARCH AND TRAINING INSTITUTE
ARTICLE CHRONICLE :Received :27.07.2016;Revised :16.09.2016;Accepted :02.10.2016
RESEARCH ARTICLE :
KEY WORDS :Marketingeffectiveness,Price spread,Marketing margin
Author for correspondence :
SUSHIL KUMARDivision of AgriculturalExtension, IndianAgricultural ResearchInstitute, NEW DELHI,INDIAEmail: [email protected]
See end of the article forauthors’ affiliations
Agriculture UpdateVolume 11 | Issue 4 | November, 2016 | 351-358
e ISSN-0976-6847
Visit us : www.researchjournal.co.inDOI: 10.15740/HAS/AU/11.4/351-358AU
cheap migrant labour forces as well as highlyqualified urban professionals makes peri-urbanareas valuable locations for national andinternational industries. Natural resources areunder increased pressure in the peri-urbanareas because of the use of land for, inter alia,clay pits, quarries, sewage disposal tanks andgarbage dumps, and as a result of air andwater pollution from local industrial and urbansources (Druijven and Singh, 1994). Thelivelihoods of the poorest inhabitants of therural-urban fringes of many cities indeveloping countries are adversely affectedby problems of land and water degradation(Hardoy et al., 1992 and Druijven and Singh,

352Hind Agricultural Research and Training Institute
Agric. Update, 11(4) Nov., 2016 :
1994) and natural resource degradation in general,including air pollution stresses. Urbanization andindustrialization affect agriculture in the peri-urban areas,as population pressure from the city results in changesin land use - from agricultural to urban land use, be it forhousing, commercial, industrial or other purposes, wherethe land use remains agricultural, cultivation practiceschange. Access to urban ready markets for agriculturalproduce and for seasonal labour open up the possibilityof cultivating on a commercial basis high-value, highlyperishable crops such as leafy vegetables, replacingstorable crops such as cereals and pulses. Industries andtheir derivative trade and commerce offer new labouropportunities for cultivators and agricultural labourers,resulting in changing occupational structures. Marketingplays an important role in determining the levels of incometo the producer for his produce. Marketing is the finalstage where the farmer converts all his efforts andinvestment into cash. In modern times farmers havebecome highly cost conscious and their financial positionwill depend not only on returns they receive from aparticular enterprise but, also the place where they areselling their produce for getting a remunerative price.Hence, it is important to analyse the marketing practicesthat are being followed and to identify the marketintermediaries and channels of marketing. Though themarketing system is more concerned with the surpluswhich enters the market, the quantum of total productionis essential for this surplus because larger the production,larger will be the surplus. Marketing of the surplus iscrucial from the farmer’s point of view. The net returnto the farmers from the sale of its product throughdifferent marketing channels will determine the efficiencyof the marketing system in the market. Unless marketingefficiency improves, cultivators will not be attracted toincrease production. Higher share in consumer’s rupeeand attractive terms of trade will motivate the farmersfor commercial production. This study aimed at assessingmarketing effectiveness of rice, wheat and tomato growerfarmer in the peri-urban agriculture of NCR region ofIndia.
RESOURCES AND METHODS
The study was undertaken in Faridabad fromHaryana, Hapur from Uttar Pradesh and North-westDelhi from Delhi selected purposively to explore themarketing effectiveness of the peri-urban farmers. A peri-
urban area is not only a zone of direct impactexperiencing the immediate impacts of land demandsfrom urban growth and pollution, but is also a widermarket-related zone of influence that is recognizable interms of the handling of agricultural and natural resourceproducts (Simon et al., 2004). 90 farmers, 30 rice, wheatand tomato grower farmers from each district wereselected to constitute the total sample size. Interviewschedule were used in eliciting information from thefarmers. Effectiveness were analysed using indicatorsspecifically marketable surplus, producer share inconsumer prices, middlemen share in consumer prices,marketing cost, marketing margin, price spread andmarketing efficiency using Shepherd’s equation. Theselected respondents were interviewed personally withthe help of a well structured interview schedule. Thedata thus, collected were tabulated and statisticallyanalysed to interpret the results. Descriptive statisticswere used to characterize marketing effectiveness ofdifferent marketing channels of different crops.
OBSERVATIONS AND ANALYSIS
The results obtained from the present study as wellas discussions have been summarized under followingheads and Tables 1 to 10.
Production, farm retention and marketed surplus :Marketed surplus may be more, less or equal to
marketable surplus because of cash requirement,hoarding or perishable nature. The overall production oftomato was 108.13 quintals of which marketable surpluswas 107.17 quintals (99.11%) after retaining 0.97 quintal(0.9%) for family consumption, religious payment andgift to friends and relatives. Marketed surplus was 88.14quintal (81.51 %) and losses due to mishandling, breakageand spoilage accounted 17.60 per cent of total quantity.Of the total farm level retention, home consumption hasthe greater share (0.54%) followed religious paymentand gift (0.34%).
The average per farmer production of rice was 27.72quintals of which marketable surplus was 25.22 quintals(90.98%) after retaining 0.94 quintal (3.39%) for familyconsumption, 0.37 quintals (1.33%) religious payment andgift to friends and relatives and 1.19 quintals (4.29%)kept for seed purpose. Marketed surplus was 25.01quintals (90.22 %) and losses due to mishandling,breakage and spoilage accounted 0.76 per cent of total
SUSHIL KUMAR, RASHMI SINGH AND VIKRAM YOGI
351-358

353Hind Agricultural Research and Training InstituteAgric. Update, 11(4) Nov., 2016 :
quantity. Of the total farm level retention, kept for seedpurpose has the greater share (4.29%) followed by homeconsumption (3.39%) and gifts and kinds (1.33%).
The production of wheat was 28.03 quintals (Table1) of which marketable surplus was 19.90 quintals(71.00%) after retaining 8.13 quintal (21.48%) for familyconsumption, 0.42 quintals (1.50) religious payment andgift to friends and relatives and 1.69 quintals (6.03%)kept for seed purpose. Marketed surplus was 19.56quintal (69.78 %) and losses due to mishandling, breakageand spoilage accounted 1.21 per cent of total quantity.Of the total farm level retention, home consumption hasthe greater share (21.48%) followed by kept for seedpurpose (6.03%) and gift (1.50%).
Marketing channels :Marketing channels indicate how market
intermediaries are set to accomplish the movement of aproduct from producer to the final consumer. Threemarketing channels were identified in the study area formarketing of rice, wheat and tomato.
Channel I: Producer- wholesaler- Retailer-consumerChannel II: Producer- retailer- consumerProducer- Processor/miller- retailer- consumer (For
rice only)Channel III: Producer- consumer.
The channel I was the important channel in sale ofrice, wheat and tomato for the farmers in the study areabecause major portion of the produce was marketedthrough this channel.
Marketing cost incurred by different marketfunctionaries :
The cost incurred by different marketingintermediaries and incurred by farmer is given in Table 3
Table 1 : Marketable surplus (n=90)
Sr.No.
Totalproduction(qtl/annum)
Homeconsumption(qtl/annum)
Kept for seedpurpose
(qtl/annum)
Gift andkinds
(q/annum)
Marketablesurplus
(qtl/annum)
Wastages(qtl/annum)
Marketedsurplus
(qtl/annum)
Avg.price
(Rs./qtl)
Totalvalue sold(Rs./qtl)
1. Rice
Production 27.72 0.94 1.19 0.37 25.22 0.21 25.01 2110.65 52787.36
Share (%) 3.39 4.29 1.33 90.98 0.76 90.22 3.39
2. Wheat
Production 28.03 6.02 1.69 0.42 19.90 0.34 19.56 1445.35 28271.05
Share (%) 21.48 6.03 1.50 71.00 1.21 69.78 21.48
3. Tomato
Production 108.13 0.58 0.00 0.39 107.17 19.03 88.14 1160.90 102321.7
Share (%) 0.54 0.00 0.36 99.11 17.60 81.51 0.54
Cost incurred by farmer includes assembling charges,grading, storage, processing, loading and unloading,weighing and market fee. From the Table 3, per quintalmarketing cost of tomato incurred by the producer washighest in channel III (Rs.190.4 /quintal) followed bychannel II and I. In channel III, producers incurred allthe expenses went through streets as vendors and soldthe fresh tomato directly to the consumers. In rice, thecost incurred by farmer is highest in channel III due toprocessing charges, because in this channel farmer sellprocessed rice directly to consumer. In channel I and II,cost incurred by farmer varies slightly.
The cost incurred by wholesaler in tomato marketingis Rs. 263.5/qtl. The highest share in cost incurred bywholesaler of packaging (19.67%) followed bycommission (18.98%). The cost incurred by wholesalerin rice marketing is more in channel I than channel II.Cost incurred by wholesaler in wheat marketing isRs.169.8/qtl, which includes the highest share ofcommission followed by losses in transit.
The cost incurred by retailer in tomato marketing ismore in channel II than channel I. In tomato marketingcost, the highest share is of losses of transit and storagefollowed by transportation charges. The cost incurredby retailer is high in losses in transit and storage due toperishable nature of produce. In rice marketing, cost inchannel II (Rs.105.5/qtl) is more than channel I (Rs.102.2/qtl). In wheat marketing, highest share is of transportationcharges (36.44%) followed by losses in transit and storage(22.66%).
Price spread and marketing margin :In rice crop, price spread in channel I is Rs. 683.61
and in channel II is Rs. 671.00. It is high in comparisonto wheat because of processing charges. In wheat, price
AN ANALYSIS OF THE MARKETING EFFECTIVENESS OF THE FARMERS
351-358

354Hind Agricultural Research and Training Institute
Agric. Update, 11(4) Nov., 2016 :
SUSHIL KUMAR, RASHMI SINGH AND VIKRAM YOGI
351-358

355Hind Agricultural Research and Training InstituteAgric. Update, 11(4) Nov., 2016 :
spread in channel II is (Rs. 510.5/qtl.) very larger thanchannel II (Rs. 129.65/qtl.), because in channel IIproducer sell their produce to retailer, so, cost ofwholesaler is eliminated. In channel III, the price spreadis zero, because farmer directly sells their produce toconsumer. In tomao mareting, similarly, price spread ishigh in channel I (Rs. 1080.33/qtl.) than channel II (Rs.770.30/qtl.).
In rice crop, marketing margin of wholesaler is Rs.120.8/qtl. And marketing margin of processor isRs.151.15/qtl. Marketing margin of retailer in ricemarketing is more in channel II (Rs.171.15 /qtl.) thanchannel I (Rs. 159.8/qtl.). In the crop of wheat, themarketing margin of wholesaler in channel I is Rs.126.7/qtl. Marketing margin of retailer in wheat crop in channelII (Rs. 145.2/qtl.)is more than channel I (Rs. 122.5/qtl.).
In tomato marketing, marketing margin of retailer ismore in channel II (Rs. 679.30/qtl.) than channel I (Rs.445.2/qtl.).
Share of producer, wholesaler and retailer inconsumer’s price :
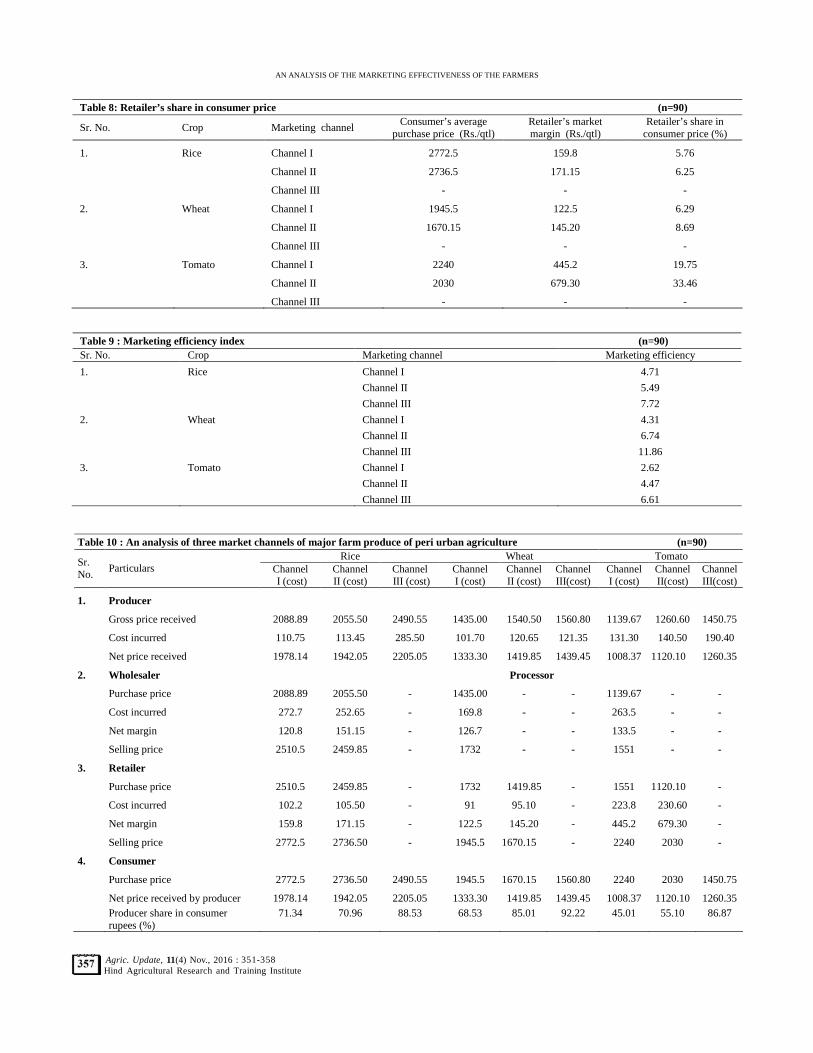
In rice crop, producer’s share in consumer’ price ishighest in channel III (88.53%) followed by channel I(71.34%) and channel II (70.96%). Wholesaler’s sharein consumer’s price is 4.35 per cent and processor’sshare in consumer’s price is 7.35 per cent. Retailer’sshare in consumer’s price is larger in channel II (6.25%)than channel I (5.76%). In wheat crop marketing,producer’s consumer’s price is highest in channel III(92.22%) followed by channel II (85.01%) and channelI (68.53%). Wholesaler’s share in consumer’s price is6.51 per cent and retailer’s share in consumer’s price islarger in channel II (8.69%) than channel I (6.29%). Intomato marketing, producer’s consumer’s price is highestin channel III (86.87%) followed by channel II (55.10%)and channel I (45.01%).Wholesaler’s share in consumer’sprice is 5.95 per cent and retailer’s share in consumer’sprice is larger in channel II (33.46%) than channel I(19.75%).
Marketing efficiency index :Marketing efficiency index was found to be highest
in marketing channel III in the marketing of all threecrops. This high ratio indicates the absence of marketmiddlemen accept the labour cost of the producers. Inrice marketing, applying shepherd’s formula, marketing
AN ANALYSIS OF THE MARKETING EFFECTIVENESS OF THE FARMERS
351-358

356Hind Agricultural Research and Training Institute
Agric. Update, 11(4) Nov., 2016 :
Table 5: Price spread (n=90 )
Sr. No. Crop Marketing channelConsumer’s average purchase
price (Rs./wtl)Producer’s selling
price (Rs./qtl)Price spread
1. Rice Channel I 2772.5 2088.89 683.61
Channel II 2736.50 2055.50 671.00
Channel III 2490.55 2490.55 0
2. Wheat Channel I 1945.5 1435.00 510.5
Channel II 1670.15 1540.50 129.65
Channel III 1560.80 1560.80 0
3. Tomato Channel I 2240 1139.67 1080.33
Channel II 2030 1260.30 770.30
Channel III 1450.75 1450.75 0
Table 6 : Producer’s share in consumer price (n=90)
Sr. No. Crop Marketing channelConsumer’s average
purchase price (Rs./qtl)Producer’s net price
(Rs./qtl)Producer share in
consumer price (%)
1. Rice Channel I 2772.5 1978.14 71.34
Channel II (Processor) 2736.5 1942.05 70.96
Channel III 2490.55 2205.05 88.53
2. Wheat Channel I 1945.5 1333.30 68.53
Channel II 1670.15 1419.85 85.01
Channel III 1560.80 1439.45 92.22
3. Tomato Channel I 2240 1008.37 45.01
Channel II 2030 1120.10 55.10
Channel III 1450.75 1260.35 86.87
efficiency of channel I is 4.71; channel II is 5.79; channelIII is 7.72, in wheat crop, marketing efficiency of channelI is 4.31; channel II is 6.74; channel III is 11.86 and intomato crop, marketing efficiency of channel I is 2.62;channel II is 4.47; channel III is 6.61.Channel III is themost efficient marketing channel of tomato, wheat andrice while channel II was second most efficient channel.The study depicts that higher marketing margins pocketed
by the intermediaries resulted in poor marketing efficiencyof tomato.
The present investigation was aimed at analyze themarketed surplus, price spread, marketing margin ofintermediaries, producer’s and marketing intermediaries’share in consumer’s price, marketing cost incurred byfarmer and marketing intermediaries and marketingefficiency of different marketing channel. During the
Table 7 : Wholesaler’s share in consumer price (n=90)
Sr. No. Crop Marketing channelConsumer’s average
purchase price (Rs./qtl)Wholesaler’s
market margin (Rs./qtl)Wholesaler’s share inconsumer price (%)
1. Rice Channel I 2772.5 120.8 4.35
Channel II (Processor) 2736.5 201.15 7.35
Channel III - - -
2. Wheat Channel I 1945.5 126.7 6.51
Channel II
Channel III - - -
3. Tomato Channel I 2240 133.5 5.95
Channel II
Channel III - - -
SUSHIL KUMAR, RASHMI SINGH AND VIKRAM YOGI
351-358
357Hind Agricultural Research and Training InstituteAgric. Update, 11(4) Nov., 2016 :
Table 8: Retailer’s share in consumer price (n=90)
Sr. No. Crop Marketing channelConsumer’s average
purchase price (Rs./qtl)Retailer’s marketmargin (Rs./qtl)
Retailer’s share inconsumer price (%)
1. Rice Channel I 2772.5 159.8 5.76
Channel II 2736.5 171.15 6.25
Channel III - - -
2. Wheat Channel I 1945.5 122.5 6.29
Channel II 1670.15 145.20 8.69
Channel III - - -
3. Tomato Channel I 2240 445.2 19.75
Channel II 2030 679.30 33.46
Channel III - - -
Table 9 : Marketing efficiency index (n=90)Sr. No. Crop Marketing channel Marketing efficiency
1. Rice Channel I 4.71
Channel II 5.49
Channel III 7.72
2. Wheat Channel I 4.31
Channel II 6.74
Channel III 11.86
3. Tomato Channel I 2.62
Channel II 4.47
Channel III 6.61
Table 10 : An analysis of three market channels of major farm produce of peri urban agriculture (n=90)Rice Wheat Tomato
Sr.No.
Particulars Channel I (cost)
ChannelII (cost)
Channel III (cost)
ChannelI (cost)
ChannelII (cost)
ChannelIII(cost)
ChannelI (cost)
ChannelII(cost)
ChannelIII(cost)
1. Producer
1. Gross price received 2088.89 2055.50 2490.55 1435.00 1540.50 1560.80 1139.67 1260.60 1450.75
2. Cost incurred 110.75 113.45 285.50 101.70 120.65 121.35 131.30 140.50 190.40
3. Net price received 1978.14 1942.05 2205.05 1333.30 1419.85 1439.45 1008.37 1120.10 1260.35
2. Wholesaler Processor
1. Purchase price 2088.89 2055.50 - 1435.00 - - 1139.67 - -
2. Cost incurred 272.7 252.65 - 169.8 - - 263.5 - -
3. Net margin 120.8 151.15 - 126.7 - - 133.5 - -
4. Selling price 2510.5 2459.85 - 1732 - - 1551 - -
3. Retailer
1. Purchase price 2510.5 2459.85 - 1732 1419.85 - 1551 1120.10 -
2. Cost incurred 102.2 105.50 - 91 95.10 - 223.8 230.60 -
3. Net margin 159.8 171.15 - 122.5 145.20 - 445.2 679.30 -
4. Selling price 2772.5 2736.50 - 1945.5 1670.15 - 2240 2030 -
4. Consumer
1. Purchase price 2772.5 2736.50 2490.55 1945.5 1670.15 1560.80 2240 2030 1450.75
2. Net price received by producer 1978.14 1942.05 2205.05 1333.30 1419.85 1439.45 1008.37 1120.10 1260.35
3. Producer share in consumerrupees (%)
71.34 70.96 88.53 68.53 85.01 92.22 45.01 55.10 86.87
AN ANALYSIS OF THE MARKETING EFFECTIVENESS OF THE FARMERS
351-358

358Hind Agricultural Research and Training Institute
Agric. Update, 11(4) Nov., 2016 :
investigation it was observed that majority of the farmersold their produce through marketing channel I. Share ofmarketed surplus in total production in wheat is low dueto more requirements of home consumption and in thecontext of tomato, it is low because of post harvest losses.Marketing cost and price spread is highest in marketingchannel I because of more number of intermediaries areinvolved in marketing of produce. The findings areconsistent with the Chole et al. (2003). The data showthat producer’s share in consumer’s price is highest whenproducer directly sell their produce to consumer. Thesame findings were found by Sashimatsung andLanusunep (2013). Marketing cost is increased whennumber of marketing intermediaries increased inmarketing channel which is showing in the result.Marketing efficiency of marketing channel III is highestin the marketing of all three crops because cost incurredin this channel is low comparatively other marketingchannels. Marketing efficiency of tomato marketing islesser than cereals because of high losses during transitand storage.
Conclusion :For marketing of crops like rice, wheat and tomato,
following three channels were patronized by the farmersfor marketing of their produce: Channel-I (Producer-wholesaler-retailer-consumer), Channel-II (Producer-retailer-consumer) Channel-III (Producer -consumer).The channel I was most favoured channel in the studyarea as maximum quantity was passed through thischannel. Share of marketed surplus of rice was highestin total production among three crops which wereanalyzed. The producer’s share in consumer’s rupee wasmaximum in channel III, followed by channel II andchannel I in case of all three major crop rice, wheat and
tomato. The total marketing cost was maximum inchannel I and minimum in channel III. It was alsorevealed that the marketing efficiency was higher inChannel-III followed by Channel-II and Channel-III.
Authors’ affiliations :RASHMI SINGH AND VIKRAM YOGI, Division of AgriculturalExtension, Indian Agricultural Research Institute, NEW DELHI, INDIAEmail: [email protected]; [email protected]
REFERENCES
Chole, V. M., Talthi, J. M. and Naik, V. G. (2003). Price spread inmarketing of brinjal in Maharashtra state, Agric. Mktg., 46 (2):5-8.
Druijven, P.C.J. and Singh, R.B. (1994). Environmentaldegradation and its impact on livelihood strategies in the urbanfringe of Delhi – some theoretical reflections. In: R.B. Singh,ed. Disasters, environment and development. p. 355-367.Proceedings of the International Geographical UnionSeminar, 9-12 December. Oxford and IBH Publishing, NEWDELHI, INDIA.
Hardoy, J.E., Mitlin, D. and Sattethwaite, D. (1992).Environmental problems in Third World cities. Earthscan,LONDON, UNITED KINGDOM.
McGee, T. (1991). The emergence of Desakota regions in Asia:Expanding a hypothesis. In: Ginsburg, N., Koppel, B. andMcGee, T. (eds) The extended metropolis: settlement transitionin Asia. University of Hawaii Press, Honolulu.
Sashimatsung, Giribabu M. and Lanusunep (2013). A studyon marketable surplus and price spread of tomato inMokokchung district of Nagaland. Internat. J. Human. & Soc.Sci. Invention, 2 (8) : 37-42.
Simon, D., McGregor, D. and Nsiah-Gyabaah, K. (2004). Thechanging urban–rural interface of African cities: definitionalissues and anapplication to Kumasi, Ghana. Environ. &Urbanizat., 16 : 245-247
SUSHIL KUMAR, RASHMI SINGH AND VIKRAM YOGI
351-358
11t h
of ExcellenceYear