Embed Size (px)
Citation preview

Survey ResearchGathering Self-Report Data
The art of getting people to give you accurate information
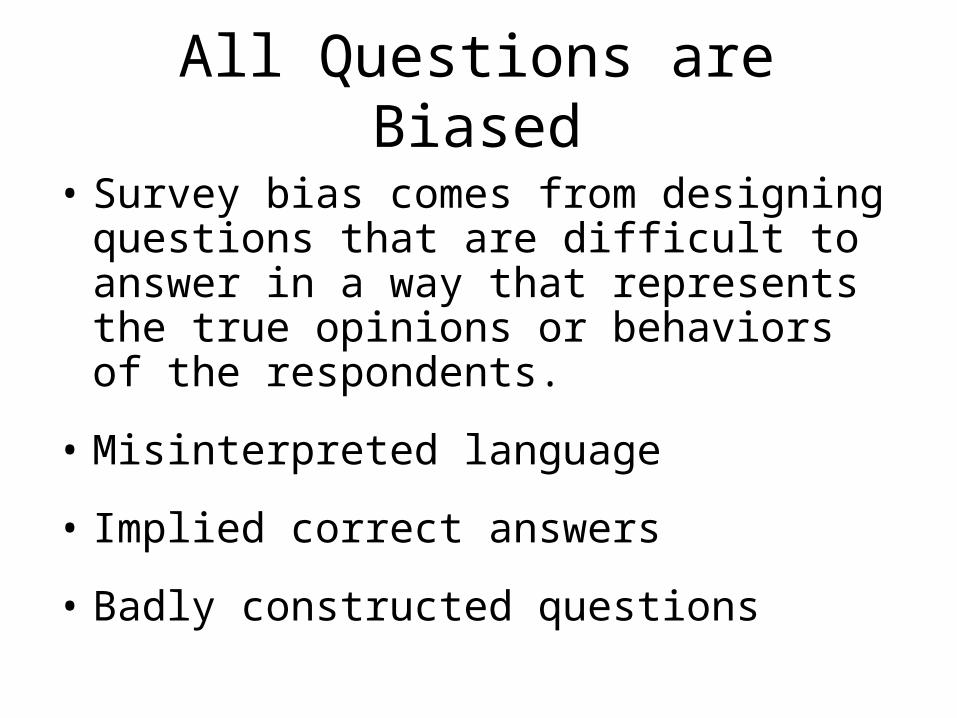
All Questions are Biased
• Survey bias comes from designing questions that are difficult to answer in a way that represents the true opinions or behaviors of the respondents.
• Misinterpreted language
• Implied correct answers
• Badly constructed questions
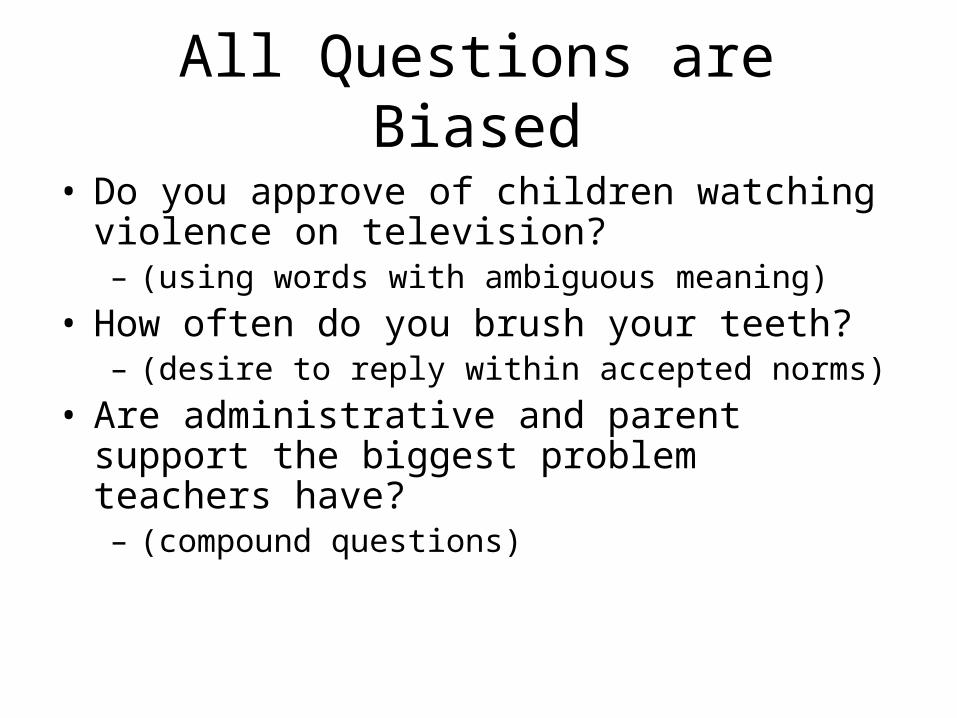
All Questions are Biased
• Do you approve of children watching violence on television?– (using words with ambiguous meaning)
• How often do you brush your teeth?– (desire to reply within accepted norms)
• Are administrative and parent support the biggest problem teachers have?– (compound questions)

Census Document Questionnaire
• Do you support President Bush’s initiatives to promote the safety and security of all Americans?
• Should students, teachers, principals and administrators be held to higher standards?
• Do you support President Bush’s pro-growth policies to create more jobs and improve the economy?
• Should the Inheritance or “Death Tax” be permanently repealed?

All Questions are Biased
Which object begins with the letter I?
Even well-worded questions often have the bias of assuming common experience and language.

Bias and Research Design• Qualitative Surveys
– Questions are designed to get respondents to describe their opinions.
– It is your job to make sense of what they tell you.– The quality of the survey is based on whether you can
identify themes.
• Quantitative Surveys– Questions are designed to measure characteristics of
individuals in a group.– This must be done consistently or you can’t make the
case that you have really measured the characteristic.– The quality of the survey is based on its reliability.

All Questions are Biased• Look at your questions– Can you imagine that the way you have asked
a question makes it so that a respondent cannot or will not give you accurate information?
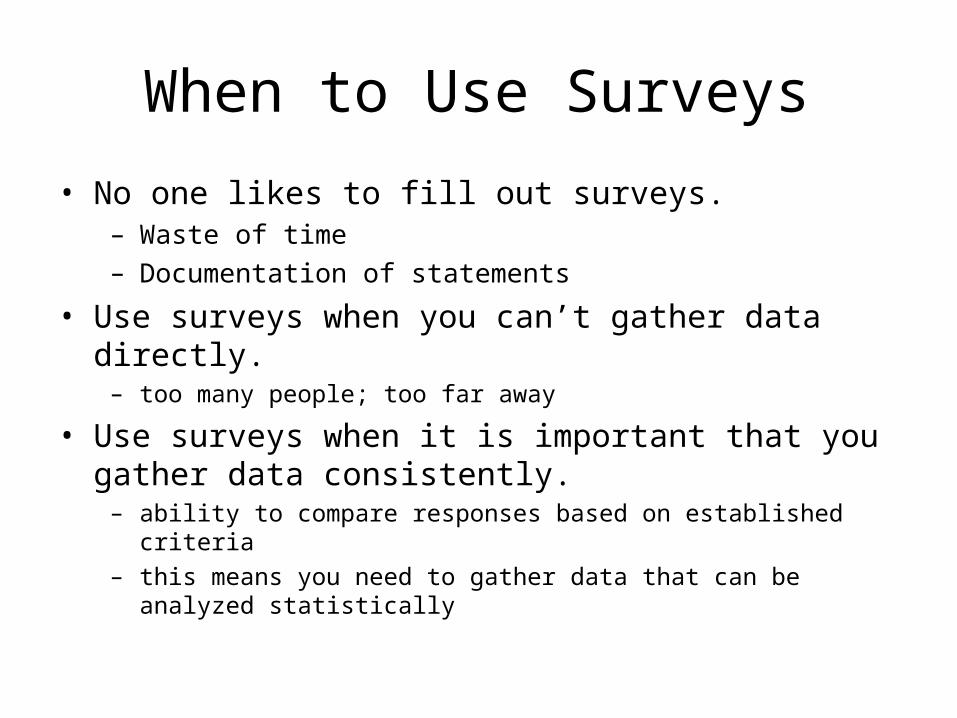
When to Use Surveys
• No one likes to fill out surveys.– Waste of time
– Documentation of statements
• Use surveys when you can’t gather data directly. – too many people; too far away
• Use surveys when it is important that you gather data consistently. – ability to compare responses based on established criteria
– this means you need to gather data that can be analyzed statistically
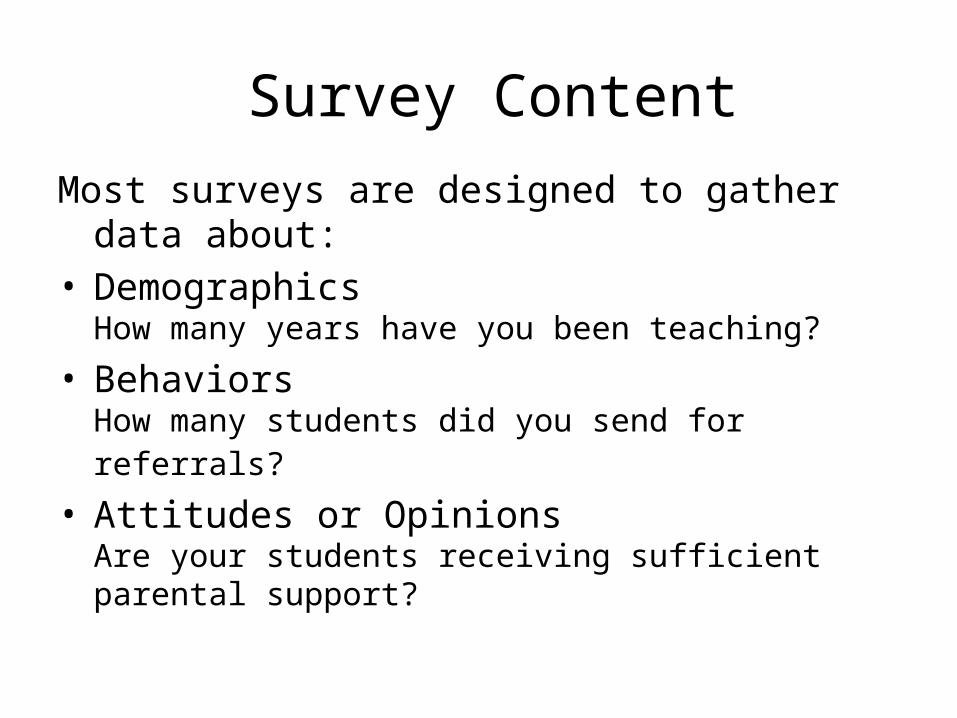
Survey Content
Most surveys are designed to gather data about:• Demographics
How many years have you been teaching?
• BehaviorsHow many students did you send for referrals?
• Attitudes or OpinionsAre your students receiving sufficient parental support?
Quantifying Responses
• Open-Ended Questions
• Questions with Response Categories

Survey Analysis Types• Nominal/Ordinal Data– chi square: are counts within categories likely to
have occurred by chance?• Doesn’t allow looking at the relationship of independent
and dependent variables.
• Interval Data– analysis of variance: are group mean differences
likely to have occurred by chance?• greater ability to focus on impact of independent
variables.
Quantifying Opinions
• All respondents must interpret the questions in the same way.
• All respondents must interpret the response categories in the same way.
• Improving the ability to represent an opinion on an interval scale.
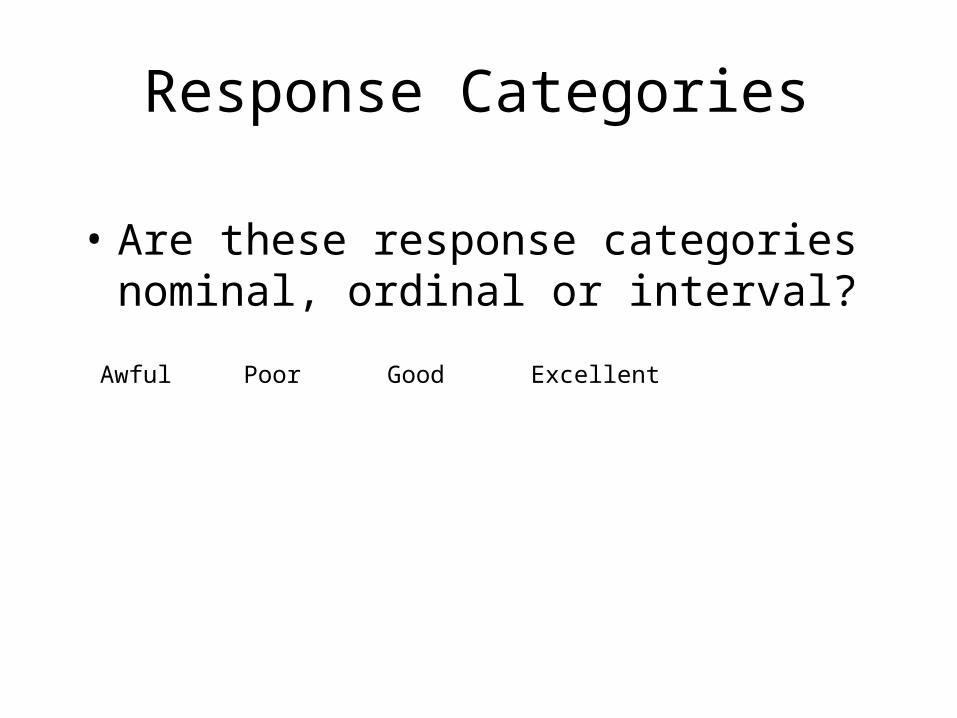
Response Categories
• Are these response categories nominal, ordinal or interval?
Awful Poor Good Excellent

Using Ordinal Data as Interval
• Logic of response categories must imply they are equally spaced.
• Rate your supervisor on congeniality.low 1 2 3 4 5 6 7 high
• My supervisor is congenial.Strongly Disagree—Disagree—Agree—Strongly Agree
Moving Toward Equal Spacing
• Category comprehensiveness• Designing logical extremes.
– Avoid absolutes
• Selecting the number of intermediate responses.• Design responses as symmetrical.• Label all response categories.• Ask multiple questions around each issue.
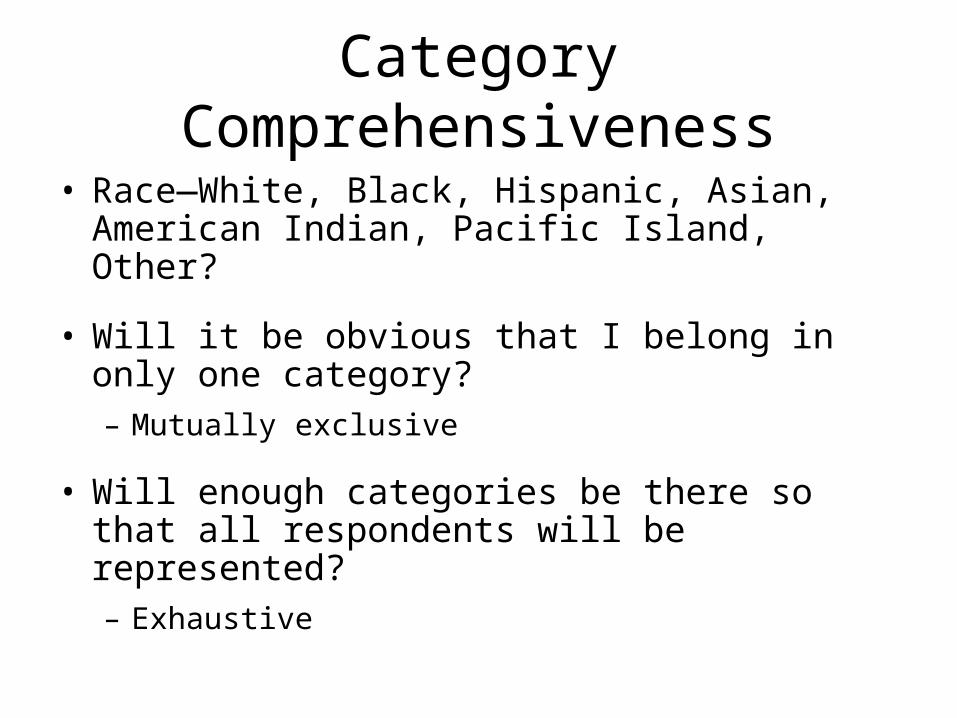
Category Comprehensiveness
• Race—White, Black, Hispanic, Asian, American Indian, Pacific Island, Other?
• Will it be obvious that I belong in only one category?– Mutually exclusive
• Will enough categories be there so that all respondents will be represented?– Exhaustive

Absolutes
Rarely Occasionally Commonly Most of the Time
Never Rarely Occasionally Always

Number of Response Categories
Strongly Disagree Disagree Agree Strongly Agree
Strongly Disagree Disagree Not Sure Agree Strongly Agree
• Is the center point a reasonable response on the continuum?
• Does a response on the center point mean that the respondent can’t or won’t answer the question?
• The more response categories the more information the survey provides
• At some point too many response categories makes it difficult for the respondent to answer
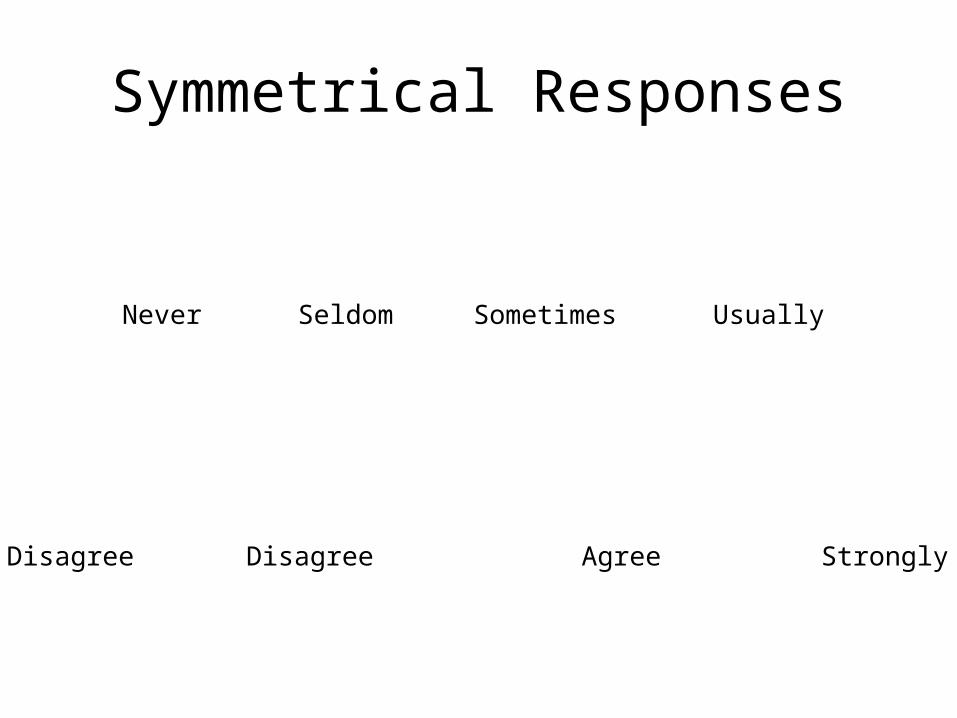
Symmetrical Responses
Strongly Disagree Disagree Agree Strongly Agree
Never Seldom Sometimes Usually

Increasing Equal Spacing
• Designing logical extremes.– Avoid absolutes
• Selecting the number of intermediate responses.• Design responses as symmetrical.• Label all response categories.• Ask multiple questions around each issue.

Likert Scales
• Almost always assessment of attitude or opinion
• Anchors on the scale remain constant through the instrument
• Usually agree and disagree
• Intermediate points often labeled
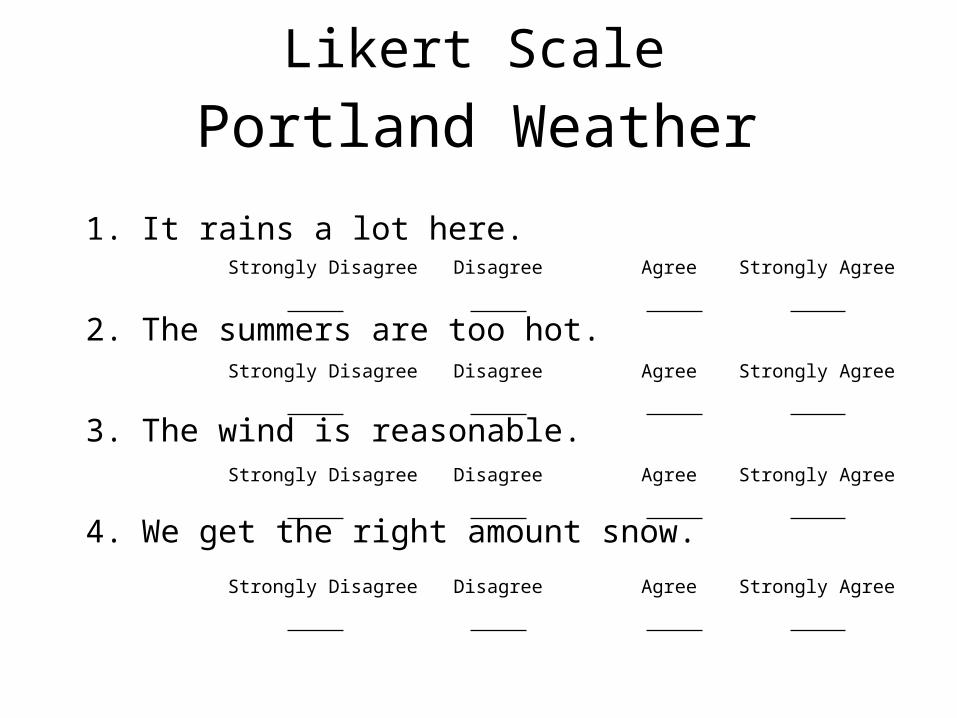
Portland Weather
1. It rains a lot here.
2. The summers are too hot.
3. The wind is reasonable.
4. We get the right amount snow.
Likert Scale
Strongly Disagree Strongly AgreeDisagree Agree
Strongly Disagree Strongly AgreeDisagree Agree
Strongly Disagree Strongly AgreeDisagree Agree
Strongly Disagree Strongly AgreeDisagree Agree
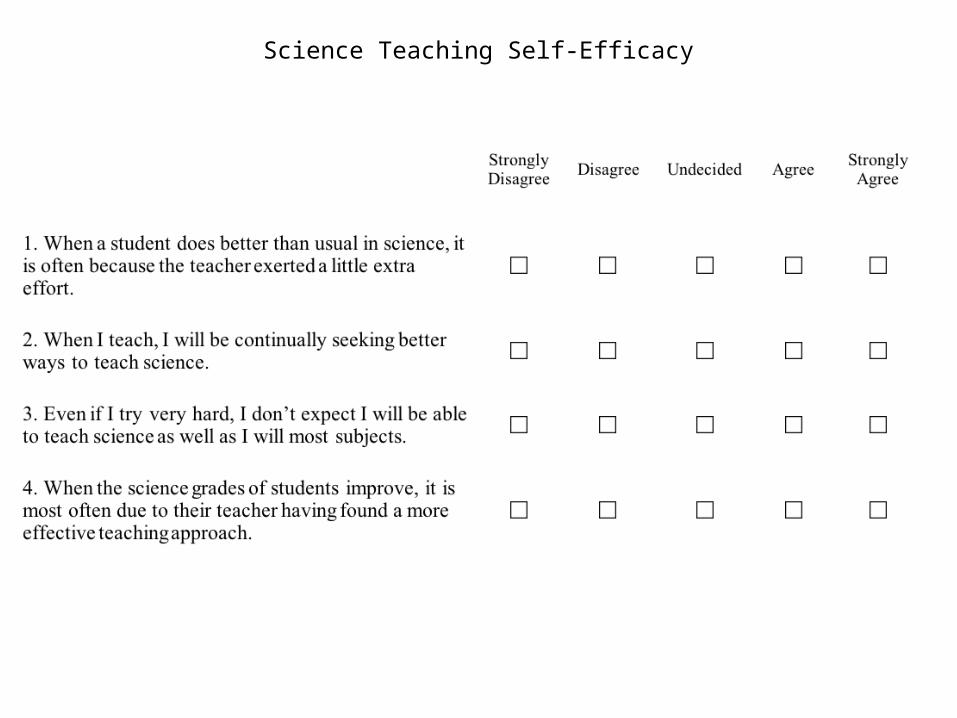
Science Teaching Self-Efficacy
Developing Likert Scales
• Identify the construct to be assessed.• Develop as many questions as you can around the construct.• Test the questions on as large a group as possible.• Analyze the responses to see which questions are answered
similarly by most respondents (correlation).• Figure out how few of those questions can be answered to get
the same level of correlation.
Analyzing Likert Data
• Likert items are ordinal data. • To even out the inconsistencies in the ordinal
responses and to be able to report interval data Likert scales always include multiple questions to assess a single construct.
• Always talk about the construct assessment (all the items together) before looking at individual items.
Testing Interval Design
• Reliability (consistency)– Are responses correlated with each other?• Kuder-Richardson
– Does the scale encompass the full range of variation in the sample? • Clumping at the ends or middle of the response scales
• Has anyone else tested the instrument?
Design for Analysis
• Use the same scale for all responses if at all possible.
• Use multiple questions around sub-issues.
• Design questions to be mutually exclusive between sub-issues.– Test this through correlation.
• AVOID QUESTIONS THAT ADDRESS MORE THAN ONE CONCEPT OR ISSUE (NO ANDS).

Unanswerable Questions
• Please rate your success related to your teacher preparation program. Use a scale of 5 to 1 with 5 meaning “excellent” and 1 meaning “not at all”
• Acquiring knowledge and practicing skills relating to information and technology literacy.

Steps of Survey Design
• If you aren’t sure what you are measuring don’t try to measure it (theoretical construct). Do the research work first.
• Opinion, behavior, and demographic data.• Do instruments already exist?
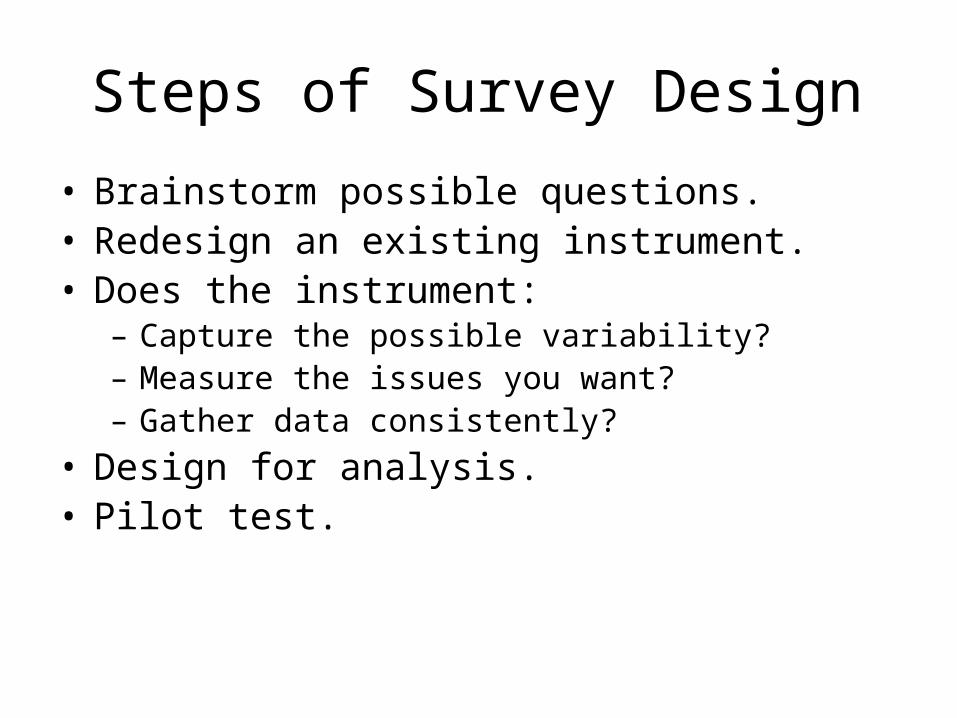
Steps of Survey Design
• Brainstorm possible questions.• Redesign an existing instrument.• Does the instrument:
– Capture the possible variability?– Measure the issues you want?– Gather data consistently?
• Design for analysis.• Pilot test.

Question Design
• Demographic Questions–Mutually exclusive and exhaustive
– Interval but answerable
• Use multiple questions around sub-issues
• Mix question direction
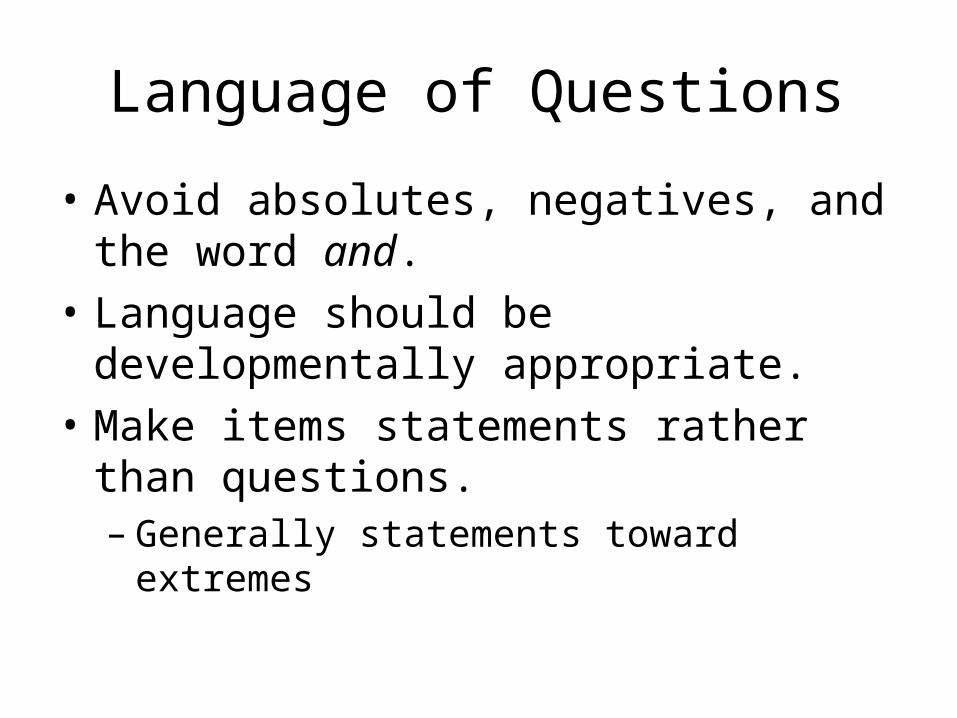
Language of Questions
• Avoid absolutes, negatives, and the word and.
• Language should be developmentally appropriate.
• Make items statements rather than questions.– Generally statements toward extremes

Instrument Design
• Good instructions are short and clear.• The survey should be easy to complete.• The order of the questions should reflect the
purpose of the survey.• Be sure answering one question doesn’t help
the respondent answer others.• Use clear well-designed response categories.
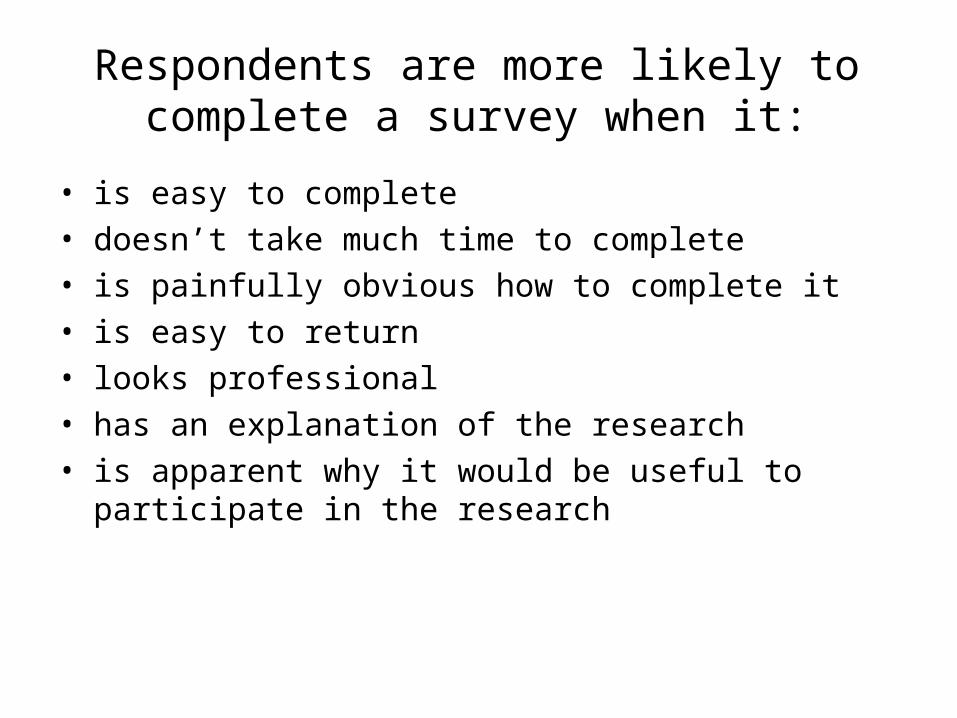
Respondents are more likely to complete a survey when it:
• is easy to complete
• doesn’t take much time to complete
• is painfully obvious how to complete it
• is easy to return
• looks professional
• has an explanation of the research
• is apparent why it would be useful to participate in the research
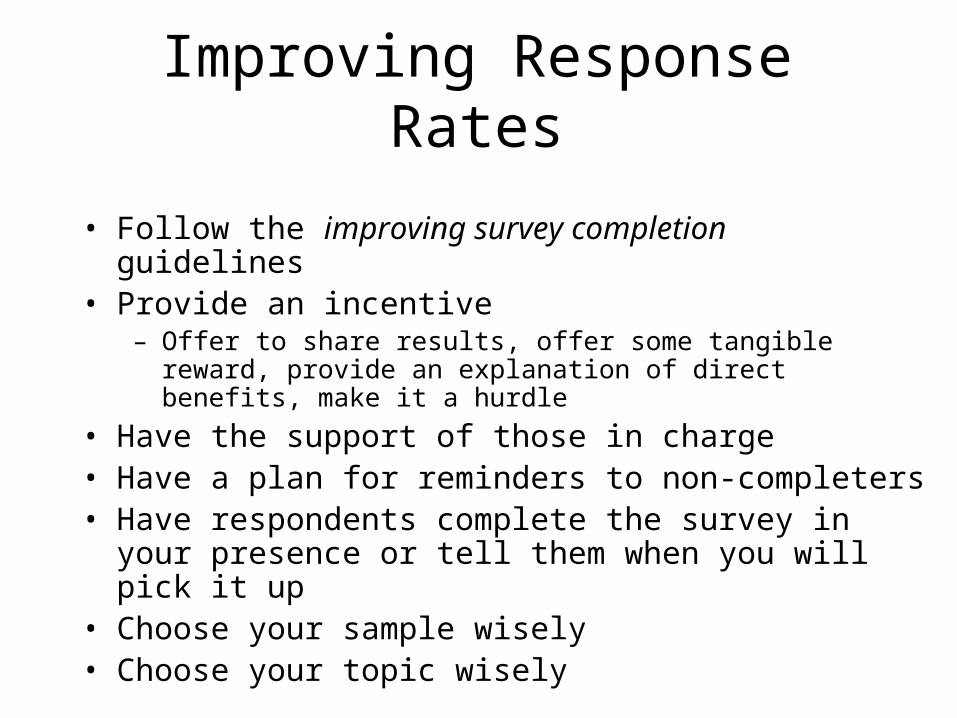
Improving Response Rates
• Follow the improving survey completion guidelines• Provide an incentive
– Offer to share results, offer some tangible reward, provide an explanation of direct benefits, make it a hurdle
• Have the support of those in charge• Have a plan for reminders to non-completers• Have respondents complete the survey in your presence or tell
them when you will pick it up• Choose your sample wisely• Choose your topic wisely
Exercise
• Write your problem statement at the top of the page.
• Start writing questions that you think will help you answer your problem.
• Rewrite the questions so that you can use a common response scale (Likert or not).
• Discuss what you have done with at least one other person.
• As a listener you need to be critical.