Embed Size (px)
Citation preview

Data gathering and analysis for Migration, Disaster Recovery and Business Continuance in Symmetrix environments
The Solution Architect’s role and responsibilities
EMC Proven Professional Knowledge Sharing November, 2007
Michael Schwartz Senior Solutions Architect
[email protected] Corporation
Copyright 2007 EMC Corporation. All rights reserved. Page 1 of 39

Table of Contents
OVERVIEW...................................................................................................................................................5 RECOMMENDED READING........................................................................................................................5 ACKNOWLEDGEMENTS.............................................................................................................................6 DATA GATHERING......................................................................................................................................7 COMMON DATA GATHERING ITEMS........................................................................................................7
SYMMETRIX BIN FILE(S) ..............................................................................................................................7 LUN MASKING CONFIGURATION ..................................................................................................................8 SYMAPI_DB.BIN FILE(S) .........................................................................................................................10 DEVICES AND DEVICE GROUP/COMPOSITE GROUP INFORMATION................................................................11 GRABS/EMC_REPORTS AND HEAT ..........................................................................................................13 ZONING AND SWITCH REPORTS .................................................................................................................13 PERFORMANCE METRICS...........................................................................................................................14
Performance Manager/STP................................................................................................................14 Host level............................................................................................................................................15
SYMMMERGE............................................................................................................................................15 DISASTER RECOVERY/BUSINESS CONTINUANCE DATA GATHERING............................................16
RPO/RTO................................................................................................................................................17 REQUIRED BANDWIDTH .............................................................................................................................17 CONNECTIVITY TOPOLOGY.........................................................................................................................17 PERFORMANCE METRICS...........................................................................................................................18
Performance Manager/STP................................................................................................................18 ChangeTracker/DeltaMark .................................................................................................................18
ANALYSIS CONSIDERATIONS AND PROCEDURES.............................................................................20 KNOW YOUR TEAM MEMBERS; PM, CE, TC, CSL, ETC................................................................................20 DETERMINING WHICH DATA IS PERTINENT FOR ANALYSIS .............................................................................21 GATHERING, AGGREGATING AND QUALIFYING DATA .....................................................................................22 DESIGN AND ANALYSIS STEPS FOR MIGRATION PLANNING ............................................................................22
Migration method(s)............................................................................................................................22 Array based ...................................................................................................................................................22 Host based.....................................................................................................................................................23
Interdependencies..............................................................................................................................24 Consolidating? SymmMerge! .............................................................................................................24
DESIGN AND ANALYSIS STEPS FOR REPLICATION PLANNING (DR/BC) ...........................................................24 What business drivers are you solving for? .......................................................................................24 RPO/RTO ...........................................................................................................................................24 Location of remote Datacenter ...........................................................................................................26 Determine apps to be replicated ........................................................................................................26 Profile of workload..............................................................................................................................26 Model of future growth based on profile .............................................................................................27 Required bandwidth/throughput .........................................................................................................27
Bandwidth vs. Throughput .............................................................................................................................27 Acquisition of Bandwidth ....................................................................................................................28
Latency and Bandwidth..................................................................................................................................28 Distance.........................................................................................................................................................29 Protocol..........................................................................................................................................................29 Protocol Conversion Impact...........................................................................................................................30 Distance Impact .............................................................................................................................................30 Total Impact ...................................................................................................................................................30 Compression..................................................................................................................................................30
Copyright 2007 EMC Corporation. All rights reserved. Page 2 of 39

Fiber Channel Replication Considerations.....................................................................................................31 IP Replication Considerations........................................................................................................................32 Network Quality .............................................................................................................................................32 MTU Size .......................................................................................................................................................33
Implementation schedule/timeframe ..................................................................................................33 Consistency ........................................................................................................................................33 Restartable or Recoverable?..............................................................................................................34 EMC Remote Replication Designer....................................................................................................34 SymmMerge .......................................................................................................................................37
FINALIZING THE DESIGN WITH THE CUSTOMER .............................................................................................38 SUCCESSFUL HANDOFF TO IMPLEMENTATION PERSONNEL (IC’S, CE’S, ETC.) ...............................................38 KEYS TO SUCCESS FOR CUSTOMER TEST AND ACCEPTANCE ........................................................................38 PROJECT COMPLETION ..............................................................................................................................39
Disclaimer: The views, processes or methodologies published in this article are those of the authors. They do not necessarily reflect EMC Corporation’s views, processes or methodologies.
Copyright 2007 EMC Corporation. All rights reserved. Page 3 of 39

Table of Figures Figure 1 – SymmWin Screen Shot .................................................................................. 8 Figure 2 – ParseSymmask Dialog box ............................................................................ 9 Figure 3 – ParseSymmask Excel output ......................................................................... 9 Figure 4 – symcfg list output ......................................................................................... 10 Figure 5 – symcli -def output ......................................................................................... 11 Figure 6 – symdg list output .......................................................................................... 12 Figure 7 – symdg show output ...................................................................................... 12 Figure 8 – SymmMerge Utilization Map ........................................................................ 15 Figure 9 – SymmMerge Component Utilization............................................................. 16 Figure 10 – DeltaMark Analyzer .................................................................................... 18 Figure 11 – SAR Calculator........................................................................................... 19 Figure 12 – RPO Diagram............................................................................................. 25 Figure 13 – RTO Diagram............................................................................................. 26 Figure 14: Packet Loss Impact on Network Throughput................................................ 32 Figure 15: EMC Remote Replication Designer Network Characteristics ...................... 35 Figure 16: EMC Remote Replication Designer Source Configuration .......................... 35 Figure 17: EMC Remote Replication Designer Analysis .............................................. 36 Figure 18: SymmMerge SRDF/A screen ....................................................................... 37
Copyright 2007 EMC Corporation. All rights reserved. Page 4 of 39

Overview There are many ways to gather and analyze the requisite data for planning and implementing migrations, Disaster Recovery and/or Business Continuance. Here are some considerations, tools and methodologies that you can use to accelerate and improve data gathering, analysis and planning. While this article is comprehensive, it is not all inclusive. If you have any ideas, tools, processes, etc. to add please feel free to share. This document is written from the point of view of a Solutions Architect who does design work only. We will discuss ‘handing off’ to implementation personnel. For those of you who perform design and implementation functions, the handoff discussion may not apply. NOTE: Many of the tools and websites presented in this document are for EMC Internal Use Only. Please be aware of this and make sure that you don’t send anything that is EMC internal to your customers.
Recommended Reading I strongly recommend that you review the Solutions Enabler documentation on Powerlink to help familiarize yourself with the capabilities of Solutions Enabler. I also recommend that you review the Product Guides, Solution Guides, Instruction Manuals, etc. for the various tools and products discussed in this document. Technology Solutions (TS) Service Kits offer a comprehensive set of documentation for designing and implementing migration and/or replication solutions. These kits include effort estimators, project plans, practitioner’s guides, test and acceptance plans, configuration guides and more. These can be found on Powerlink. The Solutions Validation Center (SVC) is the approving organization for the majority or DR/BC implementations. It is vital that you familiarize yourself with their Solution Qualification (SQ) process, as it is mandatory for most solutions. Following the SVC SQ process will help to ensure that the solution is viable and the implementation will be successful. Please make sure that you understand and follow their processes. If you are new to the SQ process, seek help from someone in your area who is familiar with it and ask them to mentor you through the process. If you happen to be SPEED certified, you will also be able to make use of the SymmMerge analysis tool. If you are not certified, it would be worthwhile to become so. Seek out your local SPEED Guru and ask them to show you SymmMerge, along with the other resources available to SPEED certified community members.
Copyright 2007 EMC Corporation. All rights reserved. Page 5 of 39

Acknowledgements I would like to acknowledge and thank the countless thousands of pioneering and creative people who have made contributions, both great and small, in the IT industry. Without their efforts, I would not be here writing this today. I would also like to acknowledge and thank the many folks here at EMC who have helped me and inspired me - directly or indirectly - to achieve the level of success I have now; a level that I would not have dreamed possible seven years ago when I joined EMC. To those who have mentored, educated and guided me; to those who spent countless hours honing the technologies, processes and procedures; to those who have tested, re-tested, tested again and documented the results; to those who do the front line work in the trenches that we call the field, I humbly tip my hat and say thank you. There are concepts and excerpts from various EMC documents, many of which I don’t know the author(s) of, included in this document. If you are reading this document and you see an excerpt of something that you authored, just smile and know that you have contributed to the greater good. “It is amazing what you can accomplish if you do not care who gets the credit.” -- Harry S. Truman
Copyright 2007 EMC Corporation. All rights reserved. Page 6 of 39

Data Gathering The importance of proper and accurate data gathering cannot be stressed enough. This is the one of the most critical steps in the design process. If inaccurate data is collected from the current environment, your analysis will be fundamentally flawed. It is up to you to ensure that appropriate and accurate data is gathered. Clearly define the issue that you are attempting to address before starting your data gathering efforts. For example, if you are gathering data for a synchronous replication solution (SRDF/S), collecting ChangeTracker/DeltaMark data is of no practical use. Once you confirm the solution design requirements, you can begin data gathering. You will want to begin this process as early as possible. It is much easier to design and analyze the requirements for a solution if you have a clear picture of the ‘current state’ of the environment. You may be able to economize your efforts by first determining if there is an existing design guide that was delivered to the customer during a prior project. If so, you may be able to use that data as a baseline and just update the contents from the ‘then current state’ to the ‘now current state’. For the purposes of this article, I assume that we have no prior design guide to work from.
Common Data Gathering Items The items described in this section are common for the design and analysis of both migration and replication solutions. The items that only apply to Disaster Recovery and/or Business Continuance are described in the appropriate section, further along in this document.
Symmetrix BIN file(s) The BIN file for the Symmetrix array is best provided by the Customer Engineer (CE) who maintains the site. You will need SymmWin to read the BIN file. Instructions for the usage of SymmWin are outside the scope of this document. If you need to download the latest version of SymmWin, go to http://www.cs.isus.emc.com/csweb2/ftp.htm, choose the FTP site closest to you and then find the folder that contains the latest version of the required code. Below is a screen shot of the volume map in a BIN file, as displayed in SymmWin.
Copyright 2007 EMC Corporation. All rights reserved. Page 7 of 39

Figure 1 – SymmWin Screen Shot
LUN Masking Configuration If the customer has a SAN, you will need to identify the LUN masking that is in place. In a Symmetrix, the LUN masking configuration is contained in a database on the array. This database is called the VCM database, or more commonly, the VCMDB. There are two ways to collect the VCMDB information.
1. Ask the customer to run a symmaskdb list database command from a locally attached host on each candidate array and redirect the output into a text file. Example: symmaskdb list database > symmaskdb_list_db.txt
2. Ask the customer to provide a copy of the VCMDB via the symmaskdb backup command.
It is worth noting that Solutions Enabler now has the ability to create xml output of CLI commands. This is discussed in more detail in the Analysis Procedures section of this document.
Copyright 2007 EMC Corporation. All rights reserved. Page 8 of 39

You can use a parsing tool to create an Excel file from the symmaskdb list database command. It is called ParseSymmask and it can be downloaded from the Applied Technologies/Tools eRoom.
Figure 2 – ParseSymmask Dialog box Click the browse button to locate the file, enter the symm name (typically the last 4 digits of the serial number) and click the process button. It will generate an Excel document similar to the illustration below.
Figure 3 – ParseSymmask Excel output
Copyright 2007 EMC Corporation. All rights reserved. Page 9 of 39

SYMAPI_DB.BIN file(s) The SYMAPI_DB.BIN file is a host resident file on every host that has Solutions Enabler installed. The file contains information about the Symmetrix arrays that it is aware of as well as Device Group and Composite Group information. It also contains device associations (TimeFinder) and pairing relationships (SRDF). NOTE: If the customer has multiple Business Continuance Volumes (BCVs) associated with Standard volumes, a query command may not show all of the associated BCV devices. Confirm with the customer whether they are using multiple BCVs and then validate it during your analysis. Before collecting the file(s) from the customer site, run a symcfg discover on a host that sees all candidate Symms. Then make a copy of the SYMAPI_DB.BIN file. The file is usually in: /var/symapi/db/symapi_db.bin (Unix) C:\program files\emc\symapi\db\symapi_db.bin (Windows) If there is no host that sees all arrays, run it on the smallest number of hosts that in combination see all the arrays. Be sure to identify which s/n's are captured in each DB file. When you copy the file(s), it is helpful to use a naming convention that identifies the customer and Symmetrix array(s) contained in file(s). Example: CustomerName_symm_123_symm_456_symapi_db.bin You can verify which Symms are visible to a host with a symcfg list command; as displayed in the figure below.
Figure 4 – symcfg list output Once you have the file(s), configure Solutions Enabler to operate offline. You will need to set one required environmental variable and one optional variable. The SYMCLI_OFFLINE variable is required to allow the commands to run on your laptop. You must set this variable each time that you begin a CLI session. To set the variable, type set SYMCLI_OFFLINE=1.
Copyright 2007 EMC Corporation. All rights reserved. Page 10 of 39

The SYMCLI_DB_FILE variable will set the path and name of the file you wish to use. If this variable is not set, Solutions Enabler will use the default path and look for the SYMAPI_DB.BIN file there. To set the variable, type set SYMCLI_DB_FILE=<path> where <path> is the path to the file. You can verify that your variables are set correctly by typing symcli –def as shown in the figure below.
Figure 5 – symcli -def output You can perform this process automatically by using a tool called the symapi_db_loader. It will automatically configure the environment variables for offline use and display a symcfg list for you. It can be downloaded from: http://gstools.corp.emc.com/tools/index.php?dlid=137
Devices and Device Group/Composite Group Information You will need to confirm that your candidate device list is accurate. Typically, the customers can confirm the candidate devices. They can be gleaned from the BIN files and/or the Device Group/Composite Group information described below. If there is a requirement for net new devices, review the requirements and confirm with the customer. Once you have a copy of the Symapi_db.bin file(s), you can run a symdg list and a symcg list to identify all of the groups that are in place. This will show you how many groups, what type(s) and any associated BCVs or VDEVs. A typical symdg list output is shown on the following page:
Copyright 2007 EMC Corporation. All rights reserved. Page 11 of 39

Figure 6 – symdg list output Next, a symdg show on each group will display the members of each group. If you have multiple symapi_db.bin files, point to each one of them and run the commands against them to collect all of the DG info. A typical symdg show output is displayed below:
Figure 7 – symdg show output
Copyright 2007 EMC Corporation. All rights reserved. Page 12 of 39

Grabs/EMC_Reports and HEAT A ‘Grab’ is an EMC provided script that runs on a customer’s UNIX server to collect configuration information about the server. This collection includes:
• Physical server hardware • Installed software (both EMC and non-EMC) • Software levels • Patch levels • Logical Volume Manager/multi-pathing information • Volume/device information • Cluster information (if the host is clustered) • HBA information
An ‘EMC_Report’ is effectively the same as a grab; except it is used for collecting data on Windows or OpenVMS servers. GRABs and EMC_Reports can be downloaded from here: http://gstools.corp.emc.com/tools/index.php?cid=2 The Host Environment Analysis Tool, commonly known as HEAT, is used to process the Grab/EMC_Report data collections. The data collection files are uploaded to the HEAT website and processed against the current eLab Support Matrix. An HTML report is then generated to document the results. The EMC internal website for HEAT is located here: http://toolbox.isus.emc.com/heat.php The HeatIt tool adds a quick link to your right click menu so you can easily upload Grabs/EMCreports to the HEAT website. When you right click on a file, you will see a menu item called “HEAT”. Click this item and it will process the Grab and create the HEAT html file in the directory where the Grab is located. It can be downloaded from: http://gstools.corp.emc.com/tools/index.php?dlid=28
Zoning and Switch Reports Simply stated, zoning allows a server to use the path(s) to the port(s) on the storage array(s) that contain the desired data volume(s) for the server. You can perform a data collection process on the switch to determine the switch configuration and the zoning currently implemented in the switch. The format of the data collection will vary by switch manufacturer but they can all be processed through the SWAT website. The SWAT website is located at: http://toolbox.isus.emc.com/swat.php
Copyright 2007 EMC Corporation. All rights reserved. Page 13 of 39

Once you process the switch report, an HTML file will be emailed to you that contains a well organized parsing of the switch information. It typically includes:
• General switch information o Firmware o WWN o Serial Number o Domain ID
• ISL information • Active Zone set • Port Configuration (number, name, type) • Port Login Data (number, type, attached WWN)
Performance Metrics It is important to get a baseline of current performance in the environment. If there is any change in Symmetrix hardware, performance capabilities must be taken into consideration. For example, if you are performing a data migration from one array to another and the new array has fewer physical disks or less cache, it may not be able to handle the existing workload. Array consolidation is another example. If you are consolidating two arrays (or more) on one, you must ensure that the new array can support the combined workloads of the existing arrays. This includes physical spindle count, cache, protection levels (mirrored, RAID5, etc.) number of front end and back end directors, etc. If the combined workload overwhelms the new array, you will have a customer satisfaction problem. It will normally take 3-5 days to collect metrics, captured during a peak I/O time for the customer – typically a month end or quarter end. If your analysis work is based on non-peak metrics, your solution may not meet peak I/O processing demands. There are many different tools for gathering performance metrics. I’ve described some of the most often used tools and when to use them below.
Performance Manager/STP Performance Manager data is a comprehensive collection of array level statistics that are captured in pre-determined intervals and stored via EMC Control Center® (ECC). These statistics track the performance of nearly every element in the Symmetrix array; physical disk, logical volume, disk directors, cache, front end directors, ports, CPU’s, I/O profiles, etc. The metrics are stored in files called ‘btp’ files - since the file name is in the format of yyyymmdd.btp; where y=year, m=month, d=day and .btp is the filename extension.
Copyright 2007 EMC Corporation. All rights reserved. Page 14 of 39

The default collection intervals are 15 minutes and 1 hour. However, it is best to set the interval for 10 minutes when collecting metrics for analysis. This is the interval that is required by the SVC for the SQ process and it is more accurate than a 15 minute interval. You may be thinking, “isn’t 10 minutes still a long interval when I/O is measured in milliseconds?”. Yes it is. But consider the impact to the array, the size of the data collection and the processor power required to parse it if we captured metrics at a ‘real time trace’ level. It is just not viable to use too granular of an interval. If a customer does not have EMC ControlCenter, we can still capture these metrics on the Symmetrix service processor with a tool called STP. STP will capture the same metrics as Performance Manager (and in some cases more) and store them in the same format as Performance Manager. You will need to have your local Customer Engineer (CE) or Regional Technical Specialist (RTS) set this up for you and collect the files. Once you have the .btp files, you can open them with a stand alone installation of ECC/ Performance View or STP Navigator. This can be downloaded from: http://www.cs.isus.emc.com/MyGSi.asp These files are used for analyzing array performance, SRDF/S and SRDF/A
Host level If array level statistics can’t be collected for some reason, then you will have to use host level tools such as SAR, IOSTAT (Unix), PerfMon (windows) or RMF (Mainframe). These tools are beyond the scope of this document.
SymmMerge SymmMerge is an EMC internal only tool that is restricted to SPEED gurus. SymmMerge provides a means of using an existing customer’s BIN file(s) and Performance Manager/STP files for both analysis and modeling. You can see the various component utilization rates in the array as depicted in the figure below:
Figure 8 – SymmMerge Utilization Map
Copyright 2007 EMC Corporation. All rights reserved. Page 15 of 39

SymmMerge will also create a utilization percentage graph:
Figure 9 – SymmMerge Component Utilization For more details on SymmMerge, contact your local SPEED guru.
Disaster Recovery/Business Continuance Data Gathering There are many considerations when implementing a DR or BC strategy. Business requirements are the primary driver. These requirements must then be evaluated using a cost/benefit analysis. Then, consider the initial capital investment in the enabling technology and quantify the operational requirements. In addition to these items, consider people; employees, customers, and the general public. It is prudent to create a strategic plan and to conduct a Business Impact Analysis (BIA) before making any technology decisions. For the purposes of this document, we will focus primarily on the technology requirements while still giving credence to the key business drivers for a given solution.
Copyright 2007 EMC Corporation. All rights reserved. Page 16 of 39

RPO/RTO This is one of the most critical decision criteria to define up front. There is a section below dedicated to this topic. Once the RPO/RTO requirements are defined, they will dictate what solution(s) must be implemented to meet the requirements. For example, if the RPO is seconds to minutes, then SRDF/S or SRDF/A are the only viable solutions. SRDF/AR is not designed to meet that RPO.
Required Bandwidth If there is an existing replication solution, you will have already have bandwidth in place. You will want to confirm the following:
• Type of network (Dark Fiber, OC-x, DS-3, etc.) • Protocol(s) in use (ATM, IP,.etc.) • Total bandwidth • Whether the bandwidth dedicated or shared • Amount of bandwidth dedicated to replication
Also, note of any intended or planned growth that will occur from application growth or net new server attachment. The performance metrics and growth factor of these items will factor into overall required bandwidth. If this is a new implementation, refer to the required bandwidth/throughput guidelines below.
Connectivity topology If this is an existing replication solution, confirm the following:
• Type(s) of RA in use (ESCON, FC, GigE) • Protocol(s) in use (ATM, IP, etc.) • Channel extender(s) in use (DWDM, Ciena, Brocade, Cisco MDS, etc.) • Quantity of all components • Configuration parameters (bandwidth ceiling/floor, throttling, QoS, etc.)
If this is a new implementation, refer to the required bandwidth/throughput guidelines below.
Copyright 2007 EMC Corporation. All rights reserved. Page 17 of 39

Performance Metrics
Performance Manager/STP This was discussed earlier, but it is worth noting again that these metrics are used for analysis of SRDF/S and SRDF/A solutions.
ChangeTracker/DeltaMark ChangeTracker and DeltaMark are tools to capture track level changes on the Symmetrix. ChangeTracker is run on the Mainframe and offers more flexibility than the open systems DeltaMark tool. However, each captures the required track change data. The Mainframe version requires the collected data to be run through a ‘reporter’ job on the Mainframe. The output is a text file with track change numbers in hourly intervals. This format allows you to calculate changes over many different intervals without running the collection again. DeltaMark is a licensed feature of Solutions Enabler that is run from the command line via the symchg command. You will need to know the desired SRDF/AR cycle time in advance of setting up the data collection, as you can only set it for 1 interval length per capture session. For example, if you have a desired cycle time of 24 hours, you would need to set the capture interval for 12 hours. If you want to analyze a different interval, you will need to re-run the collection at the different interval setting. The DeltaMark Analyzer allows quick identification of the peak cycle in a DeltaMark (symchg) session. It can be downloaded from the tools eRoom. A sample of the DeltaMark Analyzer is displayed below:
Figure 10 – DeltaMark Analyzer
Copyright 2007 EMC Corporation. All rights reserved. Page 18 of 39

Once you have determined the peak number of changed tracks, that number is entered into a tool called the SAR Calculator. This tool will help to determine the viability of completing the SRDF/AR cycle within the desired cycle time, based on the environmental information you enter. A sample of this tool:
Figure 11 – SAR Calculator ChangeTracker/DeltaMark is used for the point in time copy part of an SRDF/AR sizing analysis. NOTE: If you have an existing SRDF/AR solution in place, you will not be able to run this collection due to long duration device lock conflicts. The SRDF/AR software places a lock on the devices during the cycling of data that effectively blocks the data collection process. The only way around this is to stop the replication cycle and most customers will not allow that. Make sure that you notify the SVC of this when you submit an SQ. This will hopefully be addressed in future code releases.
Copyright 2007 EMC Corporation. All rights reserved. Page 19 of 39

Analysis Considerations and Procedures The following sections will provide general considerations as well as a high level explanation of some procedures to accomplish your goal. Exact, step by step procedures are beyond the scope of this document. Make sure that you have a current version of Solutions Enabler installed on your laptop. By loading the customer’s symapi_db.bin file on your laptop, you will be able to execute many show, list and query commands. This will ease the discovery of device info, SRDF/TF relationships, Device groups/Composite groups and more. Tip : Solutions Enabler has the ability to create xml output of most commands by simply adding a -output xml to the command. You can either cut and paste the command results from the screen or redirect the output to a file. Xml structure allows for easy importing into Excel as well as simplified parsing with scripting languages like PERL (if you happen to have scripting skills). Example: symdev list –output xml > C:\symdev_list.xml Once all of the details are captured in your Excel document, it becomes quite easy to sort/filter the current information and to plan your migration/replication implementation.
Know your team members; PM, CE, TC, CSL, etc. The importance of knowing and working well with the team members on any project can not be over-emphasized. A good working relationship with clear two-way communication will mitigate the majority of problems that typically occur in a project. Get involved before the sale is completed so you can set proper expectations – for the product capabilities as well as their implementation. While most pre-sales personnel have a good understanding of products, they don’t have the same hands on experience as delivery personnel. The experience and insight of a post-sales resource can ensure that the project gets sold correctly. Sometimes, it even leads to increasing the size of the deal; and that is always good. Make sure there is a reasonable delivery timeline. There needs to be a balance between ‘right’ and ‘fast’. Remember, there never seems to be enough time to do it right the first time but there is always time to do it right the second time.
Copyright 2007 EMC Corporation. All rights reserved. Page 20 of 39

Determining what data is pertinent for analysis The EMC Design for Storage Replication document on Powerlink has an excellent write- up on this. For the purpose of this document, I have provided a summary table.
Solution Tool(s) Data Source(s) Migration SymmWin
Solutions Enabler SymmMerge HEAT SWAT ParseSymmask
BIN file Symapi_db.bin file BIN file/ Performance Manager .btp file Grab/EMC Reports Switch reports VCMDB (symmaskdb list database output)
SRDF/S SymmWin Solutions Enabler SymmMerge HEAT SWAT ParseSymmask ET
BIN file Symapi_db.bin file BIN file/ Performance Manager .btp file Grab/EMC Reports Switch reports VCMDB (symmaskdb list database output) .btp file
SRDF/A SymmWin Solutions Enabler SymmMerge HEAT SWAT ParseSymmask ET
BIN file Symapi_db.bin file BIN file/ Performance Manager .btp file Grab/EMC Reports Switch reports VCMDB (symmaskdb list database output) .btp file
SRDF/AR SymmWin Solutions Enabler SymmMerge HEAT SWAT ParseSymmask ChangeTracker (MF) DeltaMark Analyzer (OS) SAR Calculator
BIN file Symapi_db.bin file BIN file/ Performance Manager .btp file Grab/EMC Reports Switch reports VCMDB (symmaskdb list database output) Istats report from MF collection Symchg log ChangeTracker/DeltaMark results
Copyright 2007 EMC Corporation. All rights reserved. Page 21 of 39

Gathering, aggregating and qualifying data Some of the data you gather will be required for both migration and replication. Using the chart in the section above as a guideline, make sure you have collected all of the requisite data for your project. Then, check your data for completeness and accuracy. For example, check the symapi_db.bin file(s) and make sure it has the Symmetrix array(s), Device Groups, etc. Also, check your .btp files to ensure the collection intervals are 10 minutes and that the data collections are complete for each 24 hour period.
Design and analysis steps for migration planning
Migration method(s) Confirm with the customer which method(s) are desirable for migration. It could be SRDF based, host based, or a combination of both. You will need to consider the following:
• Uptime requirements • Disk geometry changes • Servers that have associated BCVs that are presented to other servers • Mirror positions • Applications that need to migrate at the same time • Unique customer requirements
The answers to the above will dictate which migration methods and tools can be used for the project. Here is a brief overview of the tool sets.
Array based There are two array based tools that can be used; SRDF and Open Replicator. Risks
• Outages may be required for connection changes and/or reconfiguration • Level of complexity may affect project timeline • If connectivity changes are made at the same time, problem resolution may take
longer • Open Replicator accesses the host’s array FA’s; this may affect FA bandwidth • SRDF must have available mirror positions on the array
Considerations for Geometry change
• Host OS/DB/Application must be reconfigured to recognize new/larger volumes • Application repointing • Backup reconfiguration
Copyright 2007 EMC Corporation. All rights reserved. Page 22 of 39

Considerations for larger hypervolumes • Is there sufficient disk space for all of the hosts • 1:1 volume relationship required
o Target must be equal or greater in size than source
Host based The available tools will be determined by one key factor; will there be volume aggregation or not? If there is no aggregation, then you can use Open Migrator, LVM mirroring, native host mirroring tools (such as Volume Shadow on OpenVMS) or a copying technology such as Robocopy (windows) or DFDSS (Mainframe). If there is aggregation, Open Migrator may not be used. NOTE: If the customer requires migration to a smaller target volume, confirm that all of the source data will fit on the smaller target. This type of migration is discouraged. Without Aggregation Risks
• Outages may be required for connection changes and/or reconfiguration • Takes up host CPU cycles • Level of complexity may affect project timeline • If connectivity changes are made at the same time, problem resolution may take
longer Considerations for Geometry change
• Host OS/DB/Application must be reconfigured to recognize new/larger volumes • Application repointing • Backup reconfiguration
Consideration for larger hypervolumes
• Is there sufficient disk space for all of the hosts With Aggregation Risks
• Outages may be required for connection changes and/or reconfiguration • Takes up host CPU cycles • Level of complexity may affect project timeline • If connectivity changes are made at the same time, problem resolution may take
longer Considerations for Geometry change
• DB schema reconfiguration • Application repointing • Backup reconfiguration • Host OS/DB/Application must be reconfigured to recognize new/larger volumes
Copyright 2007 EMC Corporation. All rights reserved. Page 23 of 39

Consideration for larger hypervolumes • Is there sufficient disk space for all of the hosts
Interdependencies If there are server or application interdependencies, they must be taken into consideration when planning the migration. Most migrations will have two or more ‘Migration Events’ due to the large number of servers in the environment. If there are interdependent environments (and there usually are), they will need to migrate during the same migration event. Make sure that this is accounted for and that the customer agrees.
Consolidating? SymmMerge! If there is any consolidation of arrays or decrease in array hardware, I strongly recommend SymmMerge analysis. Customers will often try to balance the capital investment in new hardware with the performance trade-offs by purchasing larger drives in a smaller quantity, changing protection levels or reducing the number of directors in the array. While this makes economic sense, and newer arrays will perform better than older arrays, there is a point of diminishing returns where the impact of the reduction of hardware elements outweighs the improved capabilities of the new hardware elements. The most notable point of impact in this scenario is the physical spindle count. At some point, a reduction of spindles will impact the performance of the workload. SymmMerge can demonstrate that impact before implementation, thus avoiding a “less than optimal” customer experience.
Design and analysis steps for replication planning (DR/BC)
What business requirements are you solving? It is always best to make technology decisions based on business requirements. When embarking on a design effort, it is important to keep in mind what problem or problems you are trying to solve. If a solution is offered to a problem that doesn’t exist, it is not of much use.
RPO/RTO Recovery Point Objective (RPO) The RPO is a point of consistency to which a user wants to recover or restart. It is measured in the amount of time from when the point of consistency was created or captured to the time the disaster occurred. This time equates to the acceptable amount of data loss. Zero data loss (no loss of committed transactions from the time of the disaster) is the ideal goal, but the high cost of implementing such a solution must be weighed against the business impact and cost of a controlled data loss. Some organizations, notably banks, have zero data loss requirements. The database transactions entered at one location must be replicated immediately to another location. This can have an impact on application performance when the two locations are far apart. On the other hand, keeping the two locations close to one another might not protect against a regional disaster like power outages or hurricanes.
Copyright 2007 EMC Corporation. All rights reserved. Page 24 of 39

Defining the required RPO is usually a compromise between the needs of the business, the cost of the solution and the risk of a particular event happening.
Recovery Point Objectives (RPO)
Business Needs Drive the Technology Choice
Wks Days Hrs Mins Secs Secs Mins Hrs Days Wks
Recovery Point Recovery Time
Synchronous Replication
Asynchronous Replication
Periodic Replication
Tape Backup
Figure 12 – RPO Diagram Recovery Time Objective (RTO) The RTO is the maximum amount of time allowed for recovery or restart to a specified point of consistency. This time involves many factors. For example, the time taken to:
• Provision power, utilities and so forth • Provision servers with the application and database software • Configure the network • Restore the data at the new site • Roll forward the data to a known point of consistency • Validate the data
Some delays can be reduced or eliminated by choosing certain DR options, like having a hot site where servers are preconfigured and on standby. Also, if storage based replication is used, the time taken to restore the data to a usable state is completely eliminated.
Copyright 2007 EMC Corporation. All rights reserved. Page 25 of 39

As with RPO, each solution for RTO has a different cost profile. Defining the RTO is usually a compromise between the cost of the solution and the cost to the business when databases and applications are unavailable.
Recovery Time Objectives (RTO)
Tape Restore
Manual Migration
Global Cluster
Recovery Time includes:
Fault detection Recovering data Bringing apps back online
Business Needs Drive the Technology Choice
Recovery Point Recovery Time
Wks Days Hrs Mins Secs Secs Mins Hrs Days Wks
Figure 13 – RTO Diagram
Location of remote Datacenter What are the requirements? In-house building or third party provided? New or existing? Any compliance requirements?
Determine applications to be replicated Do they need to be consistent with each other in a BC/DR scenario? Have you considered the inbound/outbound feeds that the application depends on?
Profile of workload This must be determined in order to define the technical requirements. There are two key tools that are used for this; ET and SymmMerge. These tools are discussed in a section below.
Copyright 2007 EMC Corporation. All rights reserved. Page 26 of 39

Model of future growth based on profile It is important to size out future requirements so that a solution is not under or over configured.
Required bandwidth/throughput The workload profile and future growth modifier will be the basis for determining this. Estimating the link bandwidth generally includes summing up all of the writes to volumes that are planned to be part of the replication. A tool (or tools) that collects write throughput (KB/sec, I/O’s, I/O size) is necessary for this analysis. Estimating future growth is essential for a successful implementation for at least two significant reasons. At a minimum, the lag between the planning phase and the implementation phase can cause an inaccurate estimate and must be taken into account. If a replication analysis is based solely on a point in time data collection, albeit peak duration, the final solution is outdated soon after it is implemented. To fully address this risk, you must plan the solution for the future and incorporate a ‘growth factor’ in the figures that correspond to predictable application workload growth for six months to a year at a minimum. Growth factors of 30-50%, even 100% in specific cases, would not be unreasonable based on the expected increase in customer storage workload over a one year period. Unfortunately, there is no ‘ideal’ growth factor for workload growth planning as it is based on very specific growth and business metrics of the environment. The analysis team, therefore, needs to provide an estimate for existing applications as well as future net new implementations over the period of the growth estimate.
Bandwidth vs. Throughput When determining the sizing of bandwidth, it is important to consider the throughput requirements for successful replication. While any network has theoretical maximum of bandwidth it can provide, we must consider actual throughput vs. theoretical limits. For example, a 2Gb Fiber Channel link has a theoretical max of 2000 Gigabits per second but to approach the full 2000 gigabits, you would need to have 100% utilization of the link. The nature of I/O is to have a mix of reads and writes. Since read I/O is not propagated over the link, the link is not utilized during the time of the read I/O. This results in less than 100% utilization. Of course, protocol overhead, latency, etc. factor into this, but the important point here is that bandwidth calculations should be made based on required throughput, not potential bandwidth maximums.
Copyright 2007 EMC Corporation. All rights reserved. Page 27 of 39

Acquisition of Bandwidth Provisioning of networks can take several months. I recommend choosing your network early. I also recommend negotiating for burstable bandwidth so that unforeseen anomalous activity can be accommodated.
Latency and Bandwidth The two most basic measurements of any communication technology’s ability to move data are:
• Latency — The amount of time required to move a single piece of data from one end of the link to the other.
• Bandwidth — The amount of data that can be moved across the link in a given period of time.
When analyzing the relative merits of any communications protocol, it is vital to understand how these terms are applied and to view the data in context. It is of little value to have a high-bandwidth, low-latency link between the two outside points of a local and remote site if the links within each site cannot take advantage of it. Say, for instance, the connection between the storage system and a communications link interface (e.g., a bridge or router) adds 10 milliseconds of latency to each end of the complete communications path. In that case, another 20 milliseconds must be added to the latency between the external connections. To completely understand the solution’s ability to meet the stated requirements, it is crucial to do an end-to-end analysis of all the communications factors. The I/O traffic patterns that will be associated with the remote replication should be used as a basis for evaluating communications technology. While a given link may be able to handle the average amount of traffic, it might have problems providing the bandwidth necessary to absorb the bursts of I/Os that generally characterize open systems I/O environments. In addition, future growth requirements for potential I/O traffic must be considered, as any solution that only handles current requirements will presumably be inappropriate in the future environment. If the communications link is shared with other applications, the amount of bandwidth available for remote replication must also be considered. Adding a high-bandwidth remote replication solution to an existing link can dramatically reduce the bandwidth available to the other users of that link, impacting their performance. Conversely, if a high-bandwidth application is added later to a communications link being used for remote replication, the result may be that the solution no longer meets the business requirements.
Copyright 2007 EMC Corporation. All rights reserved. Page 28 of 39

Distance The distance between any two sites tends to directly impact the value of any communications technology. Both the latency and associated cost of any communications technology generally increase as the distance increases. Most remote replication solutions vendors provide some form of maximum supported distance limit with their solutions, and you should understand the context of these limitations. Many newer storage technologies, such as Fibre Channel over IP (FCIP) and iSCSI, promise to reduce the impact of distance considerations by allowing the use of general-purpose networks for remote replication. However, these solutions tend to invoke a severe penalty in other areas, such as performance and security.
Protocol There are 2 basic types of network protocols, packet based and circuit based. Packet based protocols such as IP and ATM will encapsulate data into uniformly sized datagrams and then source, route, ordering and destination information will be added as a header to the packet. The packets are then placed on the network for transport to their target. When the datagrams are received at the target location they are re-ordered, the header is removed and the data is presented to the final target. If a packet is lost in transit, the protocol will request a retransmit from the source. Packet based protocols are typically used for asynchronous replication but can be used in synchronous replication if the latency and packet loss are within acceptable parameters. Circuit based protocols are most easily described by using a telephone as an example. When you dial a phone number, you create a circuit from your phone (source) to the phone you called (target). The circuit stays active until you hang up, thereby disconnecting the circuit. This technology operates at a lower level in the protocol stack (think of the physical layer of the OSI model), therefore it creates less overhead when transporting data. Circuit based protocols are typically used in traditional Telco links such as T1 and T3, also referred to as DS-1 and DS-3 (the difference being T-x is typically transported via copper and DS-x is transported via optical). Think of it this way, packet protocols provide a user experience similar to browsing the web. Circuit protocols provide a home telephone type of experience. How a given solution uses the communications link is as important as the link itself. If the solution does not operate in a manner that minimizes link traffic, a higher bandwidth link may be necessary to meet business requirements, increasing the cost. For example, a remote replication protocol that uses a synchronize/acknowledge (SYN/ACK) feature before sending any data results in a significantly higher number of I/Os being sent over the link for each transfer. This reduces the amount of actual data that can be sent over a given period of time or mandates a higher bandwidth/lower latency link be used to meet the same requirements.
Copyright 2007 EMC Corporation. All rights reserved. Page 29 of 39

Organizations should carefully analyze the impact of layered protocol implementations. For example, running the Fibre Channel protocol over the TCP/IP networking protocol can add a large amount of overhead to the communications between sites. The result is less available bandwidth for actual data transfer. The ability of a protocol to adjust bandwidth utilization is a significant advantage for any remote replication solution. This feature allows the user to specify limits on how much bandwidth each implementation can use, thus permitting a single link to be shared among multiple applications while still addressing each specific business requirement. Even more advanced, a protocol can automatically tune itself, based on the current situation. For example, if a link is having a temporary problem with noise that results in more errors and subsequent reduced bandwidth availability, the solution could adjust its transfer properties accordingly, and then readjust them when the link is fixed.
Protocol Conversion Impact Any process of converting data frames from a GigE, Fibre, or ESCON format to be placed onto any type of circuit for transport between two remote sites introduces latency into the connection. The amount of latency will vary depending on the protocol and the bridging equipment that is used at the two sites to convert the data from the default format and back again at each site.
Distance Impact The impact of distance increases at a rate of approximately 1 ms for each 200 km (125 miles) of the link. For traffic that begins as GigE or ESCON, the distance considered for calculating latency is one round trip. For traffic that begins as Fibre Channel, two round trips are needed to ship a data frame, so four times the actual distance must be considered. For example, for one write operation, data centers that are 200 km apart will add 4 ms to overall latency.
Total Impact By considering the replication mode, the channel extenders/converters, and distance, you can estimate the response time per I/O as viewed by the application.
Compression Compression is the ability of a communications component to reduce the amount of data being transferred without losing any of the data in the process. Many points along a communications path can potentially provide compression capabilities—from the bridges or routers connecting two sites, to the software protocol used by the replication solution. Compression allows a greater amount of data to be moved over the same communications link and is usually dependent on the type of data being moved. When evaluating the solution, both the communications infrastructure and the remote replication solution itself should be evaluated to determine any compression could be used.
Copyright 2007 EMC Corporation. All rights reserved. Page 30 of 39
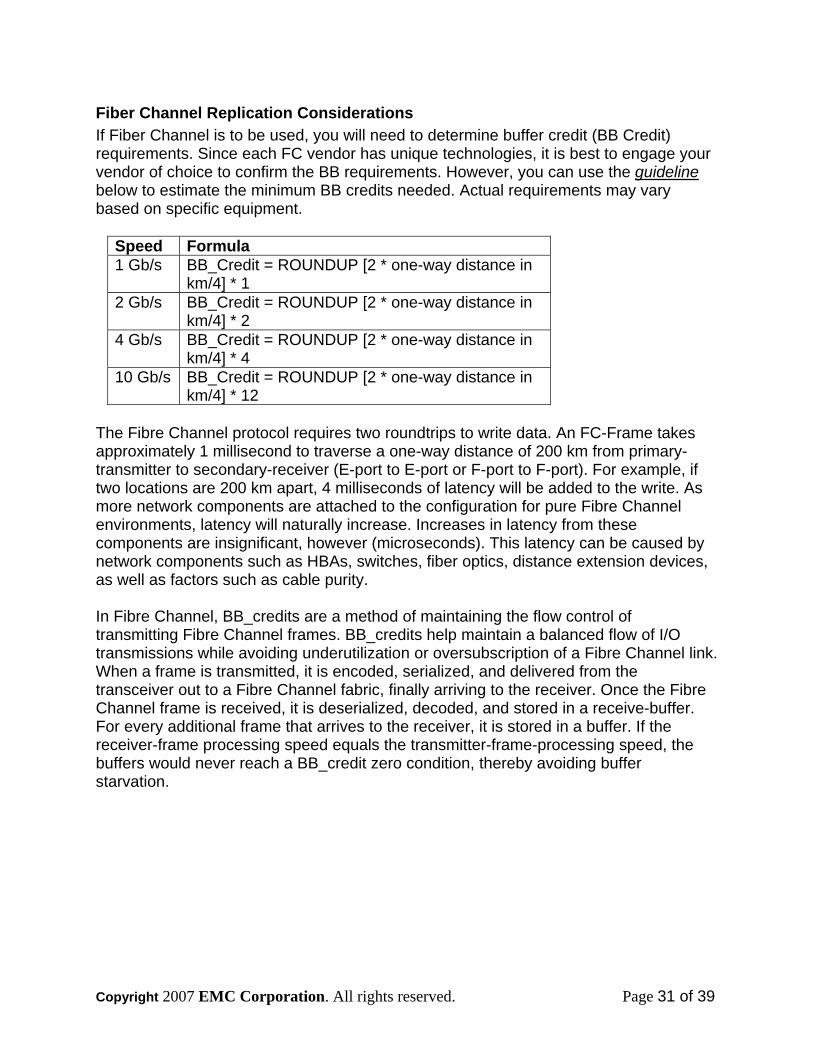
Fiber Channel Replication Considerations If Fiber Channel is to be used, you will need to determine buffer credit (BB Credit) requirements. Since each FC vendor has unique technologies, it is best to engage your vendor of choice to confirm the BB requirements. However, you can use the guideline below to estimate the minimum BB credits needed. Actual requirements may vary based on specific equipment.
Speed Formula 1 Gb/s BB_Credit = ROUNDUP [2 * one-way distance in
km/4] * 1 2 Gb/s BB_Credit = ROUNDUP [2 * one-way distance in
km/4] * 2 4 Gb/s BB_Credit = ROUNDUP [2 * one-way distance in
km/4] * 4 10 Gb/s BB_Credit = ROUNDUP [2 * one-way distance in
km/4] * 12 The Fibre Channel protocol requires two roundtrips to write data. An FC-Frame takes approximately 1 millisecond to traverse a one-way distance of 200 km from primary-transmitter to secondary-receiver (E-port to E-port or F-port to F-port). For example, if two locations are 200 km apart, 4 milliseconds of latency will be added to the write. As more network components are attached to the configuration for pure Fibre Channel environments, latency will naturally increase. Increases in latency from these components are insignificant, however (microseconds). This latency can be caused by network components such as HBAs, switches, fiber optics, distance extension devices, as well as factors such as cable purity. In Fibre Channel, BB_credits are a method of maintaining the flow control of transmitting Fibre Channel frames. BB_credits help maintain a balanced flow of I/O transmissions while avoiding underutilization or oversubscription of a Fibre Channel link. When a frame is transmitted, it is encoded, serialized, and delivered from the transceiver out to a Fibre Channel fabric, finally arriving to the receiver. Once the Fibre Channel frame is received, it is deserialized, decoded, and stored in a receive-buffer. For every additional frame that arrives to the receiver, it is stored in a buffer. If the receiver-frame processing speed equals the transmitter-frame-processing speed, the buffers would never reach a BB_credit zero condition, thereby avoiding buffer starvation.
Copyright 2007 EMC Corporation. All rights reserved. Page 31 of 39

IP Replication Considerations While IP is generally supported by vendors for synchronous replication, it is not recommended for high performance or performance sensitive applications. This is due to the protocol conversion impact as well as the potential of packet retransmission requests. Typical I/O sizes are much larger than the 1500 byte packet size used on most IP networks. Any time that is spent going up and down the protocol stack will add latency to the end-to-end I/O. When packets are lost in transit over the network, TCP has Slow Start and Congestion Avoidance algorithms to reduce the number of packets being sent. When packet loss is encountered, Slow Start will start by sending a single packet and waiting for an ACK (acknowledgement), then send two packets and wait for an ACK, SRDF Network Protocols then four packets, and so on. This exponential increase will continue until it reaches a window size of half the size of the one in which the packet loss had occurred. After this halfway value is reached, Congestion Avoidance takes over and the increase in the window size should be at most one packet each round-trip time.
Network Quality In a well-designed network, the latency should be as low as possible with the number of hops kept to a minimum given the geographical distance separating the sites. In addition, a quality link should have packet loss no greater than .01%. If there are higher levels of packet loss, the link is not considered a quality link and will result in severely impacted throughput. Packets should not be delivered out of order as this will create a major degradation in performance. The rapid variation in the latency on the network (known as jitter) should also be as low as possible. The figure below shows an example of the impact of packet loss over varying degrees of latency.
Figure 14: Packet Loss Impact on Network Throughput
Copyright 2007 EMC Corporation. All rights reserved. Page 32 of 39

MTU Size A standard Ethernet packet is 1500 bytes. Larger packets (jumbo frames) are any packet larger than 1500 bytes up to 9000 bytes. Maximum transmission unit (MTU) is the largest TCP packet size that can be sent across the network without the packet being fragmented. Packet fragmentation can have a negative impact. For instance, packets may not be reassembled or packets may be dropped. Fragmentation can cause such a high processor load on the device performing the fragmentation (for example, routers, encryptors, etc.) that it can severally impact (limit) throughput and/or cause the packets to drop. To prevent packet fragmentation, verify that every device in the network path has the same MTU value set so that fragmentation does not occur.
Implementation schedule/timeframe Develop a reasonable project plan that has achievable milestones and sufficient time to accomplish tasks.
Consistency Data consistency is something often talked about, but rarely do we fully understand what consistency means when multiple computing platforms are involved. Is it that our mainframe data is consistent, or our UNIX or Windows data is consistent? In fact, it means all of the above. For example, most databases require that a transaction first be written to disk before it is acknowledged as committed in the log file. If this order weren't ensured, you could have a failed transaction showing as committed in the log, but without any data on disk. This could lead to inability to restart the application, or to deep and invisible logical corruption. SRDF/CG protects against these problems. Its ability to expand this to a number of devices, then to a number of applications, and even to a number of storage arrays is what makes SRDF/CG so powerful. The fidelity of ordered writes is always maintained, even when there is no external linkage between disparate operations but a logical linkage remains important. Consistency becomes important when you want to make sure that all of these platforms are treated as a single, logical object. Imagine that in a Banking system, one piece of data passes through a Windows Web server, then maybe a UNIX proxy server, then maybe a mainframe-based transaction-staging area in the final transaction system of record. If you were backing up or recovering that data, or even moving it, you’d want to make sure you always got all the data at the same point in time. You wouldn’t want to have a transaction caught in mid-flight while you experience a rolling disaster. That’s the basic idea behind SRDF/Consistency Groups. How do you group together various objects, either on a single system or across systems so that you can move and copy them as a group, and so that they’re treated as a group? You want to get either all of the data or none of it—you don’t want to get part of the data.
Copyright 2007 EMC Corporation. All rights reserved. Page 33 of 39

Restartable or Recoverable? Disaster recovery implies the use of backup technology that copies data to tape, that is then shipped offsite. When a disaster occurs, the remote site copies are restored and logs are applied to bring the data to a point of consistency. Once all recoveries are completed, the data is validated to ensure that it is correct. Coordinating to a common business point of recovery across all applications and other platforms can be difficult, if not impossible, using traditional recovery methods. Disaster restart solutions allow the restart of all participating DBMS’s to a common point of consistency utilizing the automated application of DBMS recovery logs during DBMS initialization. The restart time is comparable to the length of time required for the application to restart after a power failure. Restartable images that are dependent write consistent, which can be used for restart, created locally, and then transported to an offsite storage site via array based replication. These restartable images can also be created remotely. Dependent write consistency is ensured by array technology, such as EMC consistency technology and transactional consistency is ensured by the DBMS restart, similar to recovery from a local power failure. Transactional consistency is made possible by the dependent write I/O philosophies inherent in logging DBMS systems. Dependent write I/O is the methodology all logging DBMS systems use to maintain integrity internally. Data writes are dependent on a successful log write in these systems and, therefore, restartability is guaranteed. Restarting a database environment instead of recovering it enhances availability and reduces operational complexity. Restart is significantly faster than traditional recovery methods.
EMC Remote Replication Designer A detailed review of the workings of this tool is beyond the scope of this document. You are encouraged to read the documentation and install the tool. For the purposes of this document, the basic analysis steps and some screen shots are provided below. The EMC Remote Replication Designer, informally referred to as ET, is a modeling tool that allows you to set up the basic parameters of your Symmetrix and the network, input performance metrics from the customer environment and model the replication requirements for SRDF/S and SRDF/A. It is capable of using host level performance metrics but array level metrics (like STP) are preferred.
Copyright 2007 EMC Corporation. All rights reserved. Page 34 of 39

First, you will configure the network information as seen below:
Figure 15: EMC Remote Replication Designer Network Characteristics Next, you configure the array information:
Figure 16: EMC Remote Replication Designer Source Configuration
Copyright 2007 EMC Corporation. All rights reserved. Page 35 of 39
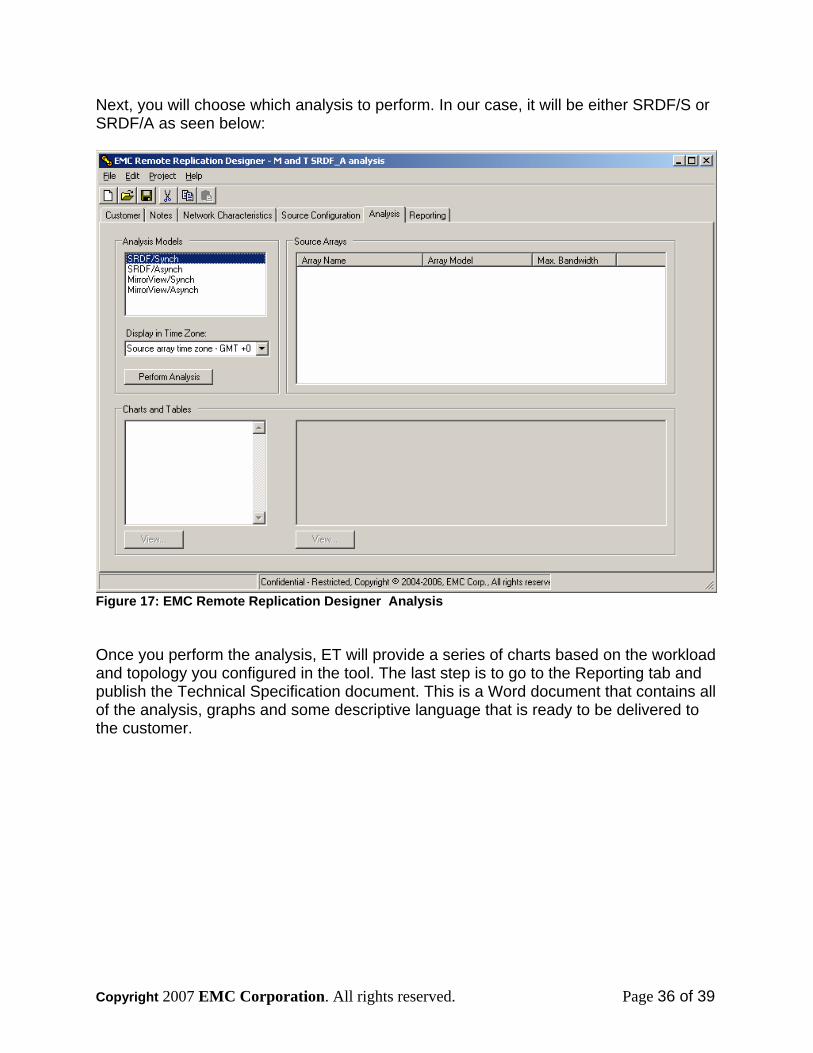
Next, you will choose which analysis to perform. In our case, it will be either SRDF/S or SRDF/A as seen below:
Figure 17: EMC Remote Replication Designer Analysis Once you perform the analysis, ET will provide a series of charts based on the workload and topology you configured in the tool. The last step is to go to the Reporting tab and publish the Technical Specification document. This is a Word document that contains all of the analysis, graphs and some descriptive language that is ready to be delivered to the customer.
Copyright 2007 EMC Corporation. All rights reserved. Page 36 of 39

SymmMerge SymmMerge has an excellent calculator for SRDF/A sizing. If you are working on an SRDF/A implementation, this is the best tool to use. You will load the BIN file and the performance metrics as described in the Migration section above. Then go to the SRDF/A calculator and it will display a screen like the one following:
Figure 18: SymmMerge SRDF/A screen
Copyright 2007 EMC Corporation. All rights reserved. Page 37 of 39

Finalizing the design with the customer Once the draft implementation documentation is completed, review it with the customer and ask for their signature verifying that it meets their expectations. This can be accommodated by a project milestone sign off, activity assurance form, etc. Make sure that everyone agrees before moving into implementation, as it is easier to change documentation now than configurations later.
Successful handoff to Implementation personnel (IC’s, CE’s, etc.) The success of the handoff is always determined by how involved the hands-on implementation personnel are before the start of the implementation phase. Make sure to keep these folks involved during the design phase so they understand both the customer’s requirements and the documentation they will receive from you. Keep them on copy as you email draft documents back and forth; both internally and externally so they can review and comment. More often than not, they will be able to help you streamline and improve your design work, and that is good for everyone.
Keys to success for customer test and acceptance Set realistic criteria While there is no easy formula for this, experience will tell you what is reasonable and what is not. If you are unsure, seek the guidance of others who are more experienced. Use the TS Kit T&A plan This should be your starting point for the test and acceptance plan. Start with this document and then modify as appropriate for the customer situation. Do they realize what they are asking for? The number one example of unrealistic testing expectations is a ‘real’ failover and failback test. While the EMC components are actually reliable and simple, it is the customer requirements that cause complexity. For example, what network changes need to occur? Do any of the servers or applications have hard coded IP addresses? Do you have the capability to have your production users easily point to the DR site, access applications and then failback to the primary site? When this is clearly explained to a customer, they usually come to understand that a controlled DR test is more viable. Make sure that the T&A requirements are realistic and achievable.
Copyright 2007 EMC Corporation. All rights reserved. Page 38 of 39

Project completion Final documentation After the implementation is complete, make any changes necessary to your documentation and deliver it to the customer. It should reflect the environment’s end state at project completion. Review the documentation with the customer one last time and encourage them to treat it as a living document; updating it as the environment changes. Not only is it a good reference source for them, but up to date documentation will make the next project with that customer even better. Knowledge transfer Make sure that the customer has a good working knowledge of the theory of operations of what you have implemented. Also, work with the IC, CE, etc. to make sure they have operational knowledge of the hardware and software. NOTE: Knowledge transfer is an informal process and is not intended to replace formal training. Make sure the customer is aware of this and encourage them to read the documentation for their products and to attend EMC Education Services’ training. Celebrate! Now that you have successfully completed your project, celebrate with your customer; you have earned it!
Copyright 2007 EMC Corporation. All rights reserved. Page 39 of 39