Embed Size (px)
Citation preview

© 2014 MSCI, Inc. All rights reserved. Please refer to the disclaimer at the end of this document.
Page 1 of 20
November 2014
Governance Issue Report
2014 Survey of Women on Boards
KEY FINDINGS
There continues to be a slow increase in the overall percentage of women on boards globally. Among MSCI World
companies, women currently hold 17.3% of all directorships. In the US, among S&P 500 companies, women
currently hold 19.0% of directorships, up from 16.9% in 2013. Upon closer examination, however, the vast majority
of the gains are coming from markets that have instituted mandates and regulations to boost the ranks of women
on boards. In markets lacking the regulatory ‘stick,’ the gains are minimal. In this year’s report, our key findings
include:
� Boards with gender diversity above and beyond regulatory mandates or market norms had fewer instances
of governance-related scandals such as bribery, corruption, fraud, and shareholder battles.
� There is some indication that the orientation toward regulatory arbitrage may apply to aspects of corporate
governance such as director characteristics as we found companies domiciled in Tax Havens exhibit lower
rates of women on boards than their peers domiciled in developed markets.
� Subsequent to appointing a female CEO, companies exhibit a greater rate of female director appointments
compared to male-led companies.
� There is preliminary evidence that companies with more women on their boards tend to display overall
stronger management of ESG-related risks.
FIGURE 1 Percentage of Industrialized Market Companies with ≥ 1 Women on the Board, 2014
GO VE RNANCE CONTROV ERSIES AND
WOME N O N BOA RDS, 2014
(S E E P AGE 10 F OR DE T A IL S )
SCOPE
MSCI ESG Research analyzed more than 6,500
company boards and nearly 1,600 constituents of
the MSCI World Index for controversy and ESG data.
REP ORT CO NTENT
Global Trends p. 2
Country Trends and Case Studies p. 3
Tax Havens and Regulator Arbitrage p. 8
ESG, Controversy, and Women on Boards p. 9
Female Leadership and Women on Boards p. 11
Appendix A: Data and Methodology Notes p. 13
Appendix B: Global and Regional Data p.14
Appendix C: Country Data p.16
AUTHOR
Linda Eling-Lee, Global Head of ESG Research
Damion Rallis, Senior Analyst
Matt Moscardi, Senior Analyst

© 2014 MSCI, Inc. All rights reserved. Please refer to the disclaimer at the end of this document.
Page 2 of 20
November 2014 2014 Survey of Women on Boards
Global Trends in Board Gender Diversity
Slow and Steady Rise…
Our analysis shows that progress on most measures of female board representation
continues a slow but steady rise. Women now hold over 12% of board seats at the
world’s largest and best-known companies, up 1.4% from a year ago but only a
total increase of 3.1% since 2009. Among these companies, 64% have at least one
female director, and nearly 13% have at least three women—a level that some
research suggests may constitute a critical mass and allow women’s leadership
styles to come to the fore. As we noted last year, women make up a higher
percentage of directors in developed markets (13.4%, up from 11.8% last year) than
they do in emerging markets (8.8%, up from 7.4% last year).
Underlying the incremental pace of global change are very heterogeneous trends in
female board representation in different countries and regions. Leading the globe
on gender-diverse boards is Europe, where legal requirements for women’s
representation exist or are being considered at both the EU level and in various
countries. Nordic countries continue to lead the developed world in their
percentage of female directors, with 29.6% overall, led by Norway and Sweden with
39.1% and 28.9%, respectively. Significant increases in women’s representation are
also happening in Italy and France, following the passage of recent laws on board
diversity. France now ranks 3rd in the world with 28.3% female directors, while the
percentage of women on boards in Italy skyrocketed from 8.2% to 22.1% thanks to
recent "pink quota" laws requiring Italian-listed and state-owned companies to
ensure that women comprise one-third of their board members by 2015. In addition
to raising their percentages of female directors over the last year, several European
countries, including Austria, Belgium, Denmark, France, Italy, and Norway, have all
seen sharp, double-digit increases in the proportion of boards with at least three
women. Over 80% of French boards, and two-thirds of those in Italy, now have at
least three female directors.
…With Regional Variations
The European impact on global trends can be seen through a regional analysis of
rates of change. The percentage of women on boards of companies in the Nordic
region (Denmark, Finland, Norway and Sweden) in our coverage has risen 6.0
percentage points since 2009; it has risen 10.3 percentage points in the rest of
developed Europe (including the UK); and it has risen 8.1 percentage points in the
developed countries of Australasia (Australia and New Zealand). In the rest of the
world outside Europe, meanwhile, the proportion of female directors has risen only
1.8 percentage points in the same period. Currently, female directors serving in
industrialized Europe represent over one-quarter (27.2%) of our sample, although
these companies account for only 17% of the total board seats in the sample.
Indeed, a closer look at the data reveals that 100% of the companies considered in
Finland, Norway, and Sweden have at least one woman on their boards, as do 99%
of the companies in France, 96.4% in Italy, 96% in Denmark, and 95.7% in Belgium.
In North America, where board diversity advocates have emphasized investor
pressure and voluntary change over legislative mandates, board diversity is
increasing very slowly. Among the 1,891 companies in US and Canada that we have
been tracking since 2009, the percentage of female directors has risen only 1
percentage point. Similarly lackluster progress is evident in much of Asia, where
Japan’s 2.2% female directors—the lowest in the industrialized world by a
considerable margin—is up only 1.3 percentage points since 2009. Progress in
China, Hong Kong, and Singapore is also essentially flat; Hong Kong, in fact, is the
only developed economy to show a decrease in the percentage of female directors
from 2013 to 2014. In India, there has been a modest increase since 2009 (3.0%, in
line with the global trend).
FIGURE 2 WOB %, Industrialized Markets vs Emerging Markets, 3Q2014

© 2014 MSCI, Inc. All rights reserved. Please refer to the disclaimer at the end of this document.
Page 3 of 20
December 2012
November 2014 2014 Survey of Women on Boards
Country Trends and Case Studies
Growing Investor Pressure in the US
There continues to be pressure in a number of markets to institute mandates and
other policies to increase board diversity. In the US, in the absence of legal
mandates, pressure has tended to come from large institutional investors
committed to greater board diversity. The California State Teachers’ Retirement
Fund (CalSTRS) and the California Public Employees’ Pension Fund (CalPERS), among
the largest pension funds globally, have been successful in encouraging US
companies to diversify their boards. Both support the 30 Percent Coalition, which
aims to gain female representation for 30% of board seats by 2015. In 2014, 17 of
100 companies to which CalSTRS and the Thirty Percent Coalition wrote letters
concerning board diversity elected to install a woman on the board. There is also
the 2020 Women on Boards campaign, seeking to have U.S. boards be 20% female
by 2020.
CalSTRS and CalPERS have been instrumental in kicking off an initiative to build a
tool – the Diverse Directors Database, housed at MSCI ESG Research -- to support
boards seeking to nominate diverse board members. The Diverse Directors
Database currently includes information on nearly 800 potential candidates, two-
thirds of whom are women, and roughly half from the US. Nearly 40% of the
candidates have already served or are currently serving as directors on the boards
of public or private companies, and 25% of the candidates have served as chair of
the board. The argument that there are few women directors due to a low ‘supply’
of qualified candidates would seem to be debunked by the credentials of the
candidate pool in the Diverse Directors Database.
The supply of qualified diverse candidates may soon be matched by the demand for
new board members. Among the 274 companies in the S&P 1500 that currently
have no women on the board of directors, 237 of them has at least one director
with a tenure of 10+ years on the board; 211 of them have at least one director
aged 70 older. Similarly, in the MSCI World Index, among the 255 companies with
no woman on the board, 182 of them has at least one director with 10+ years of
tenure, and 137 of them have at least one director aged 70 or older. As these seats
open up, they may create space for more female candidates to be considered.
The Effect of Changing Mandates
In January 2011, France’s National Assembly passed a law requiring French boards
to be 20% female within three years and 40% female within six years. Female
representation on French boards began to accelerate in anticipation of the law’s
adoption, and rose a total of 19.3 percentage points between 2009 and 2014. The
percentage of female directors in France now stands at 28.3%, and all but one
French company in our coverage has at least one woman on the board. Perhaps
most striking of all, eight out of ten French firms that we assessed have at least
three female directors. Despite the good news, the rate of female chairs at French
companies is still remarkably low, even under the industrialized country average of
3.5%. So, despite responding positively to board mandates, French firms clearly still
believe that men rather than women should be in power roles.
FIGURE 3 Mandate Effect: WOB % in France, 2009-2014

© 2014 MSCI, Inc. All rights reserved. Please refer to the disclaimer at the end of this document.
Page 4 of 20
December 2012
November 2014 2014 Survey of Women on Boards
In 2012, to learn more about how French companies were responding to this
legislative requirement, GMI Ratings conducted a detailed study of all the female
directors who joined French boards for the first time in 2011. The report, “The
French Board Diversity Law: New Female Directors Dispelling Mandate Myths” (May
2012), showed that the overwhelming majority of the women were highly qualified
professionals, many of whom were new to public board service in France. Most
served on only one board. They included high-ranking executives of both public and
private companies (including some CEOs), as well as academics and executives of
nonprofit organizations. In sum, the French experience seems to be validating the
theory of many diversity advocates as well as the evidence found in the Diverse
Directors Database: there are many women who are well-qualified to serve as
public company directors, but who are not routinely recruited.
FIGURE 4 WOB in France vs. Industrialized Countries, 2014
A number of other countries are either nearing implementation of quotas or
debating them. In Canada, for instance, a federal advisory panel proposed in late
June 2014 that the government should require 30% female directors on boards by
2019. Then, in October 2014, the securities regulatory authorities in nine Canadian
provinces finalized rule amendments calling for increased disclosure on women on
boards (WOB), including policies regarding director term limits (a move aimed at
bringing new voices to the board), the representation of WOB, and WOB targets.
The movement in Canada is very similar to what is happening in the UK. Business
Secretary Vince Cable stated in July 2014 that he expects to meet the target of 25%
women on FTSE 100 boards by 2015. The target was set out in a 2011 report by Lord
Davies, sponsored by the UK Government, entitled “Women on Boards”. Mr. Cable’s
statement followed the first appointment of a female director by Glencore, a
company that had faced pressure for years to appoint a woman and was ultimately
the last FTSE 100 firm to do so.
Similar to France, the EU adopted a proposal to European Union law in 2013 with a
goal to fill 40% of non-executive board positions with female directors by 2020.
While small and medium sized companies are expected to be exempt, at least
initially, the 40% directive aims to increase female representation on large boards
that have been historically dominated by males. In many cases, EU Member States
have already begun introducing laws for company boards, including Belgium,
France, Italy, the Netherlands, Spain, Portugal, Denmark, Finland, Greece, Austria
and Slovenia.
However, even in Europe the mandates are not necessarily politically guaranteed.
In 2013, Germany’s parliament rejected a law that would have required its
companies to maintain gender quotas on their supervisory boards. In what was
described as an emotionally charged political battle, the largely conservative
governing coalition blocked attempts at quota law by the more center-left leaning
Social Democrats and Green Party. In India, a new Companies Act was enacted in
2013 requiring all stock exchange listed companies to have at least one female on
its board. However, some companies are not committing to the spirit of the law,
appointing a woman with close company ties rather than a qualified outsider, such
as Reliance Industries, which named the wife of its chairman as a director.
© 2014 MSCI, Inc. All rights reserved. Please refer to the disclaimer at the end of this document.
Page 5 of 20
December 2012
November 2014 2014 Survey of Women on Boards
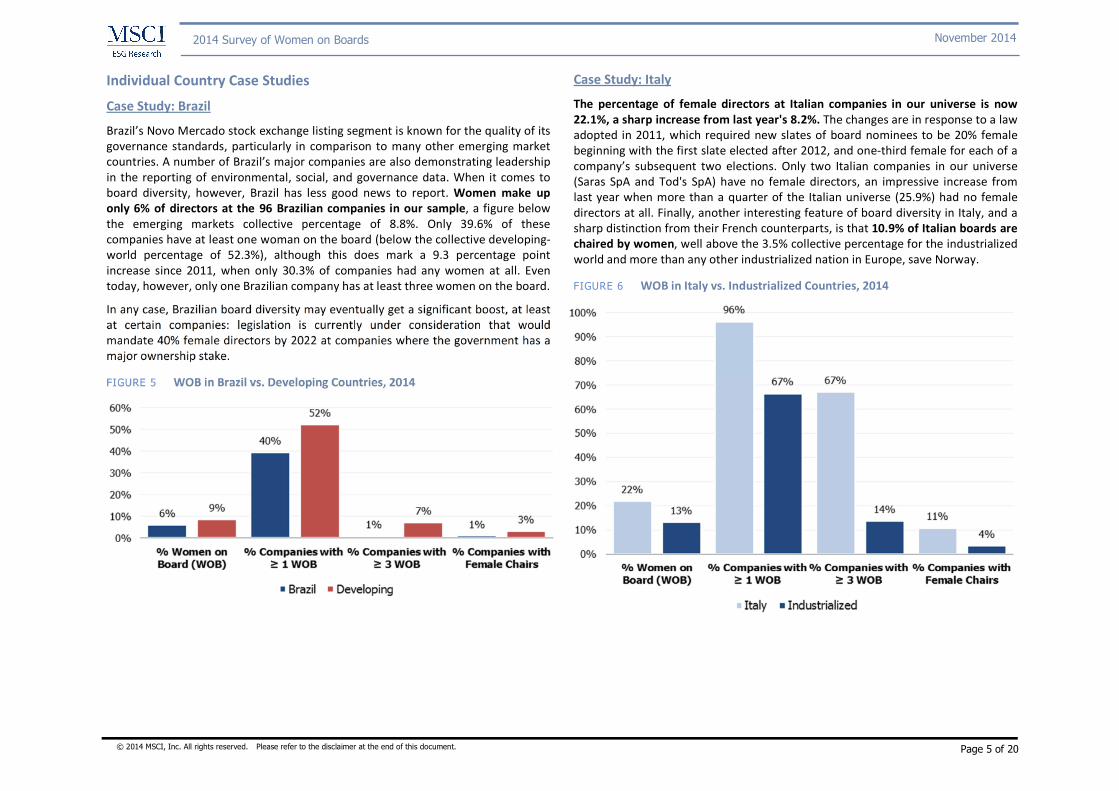
Individual Country Case Studies
Case Study: Brazil
Brazil’s Novo Mercado stock exchange listing segment is known for the quality of its
governance standards, particularly in comparison to many other emerging market
countries. A number of Brazil’s major companies are also demonstrating leadership
in the reporting of environmental, social, and governance data. When it comes to
board diversity, however, Brazil has less good news to report. Women make up
only 6% of directors at the 96 Brazilian companies in our sample, a figure below
the emerging markets collective percentage of 8.8%. Only 39.6% of these
companies have at least one woman on the board (below the collective developing-
world percentage of 52.3%), although this does mark a 9.3 percentage point
increase since 2011, when only 30.3% of companies had any women at all. Even
today, however, only one Brazilian company has at least three women on the board.
In any case, Brazilian board diversity may eventually get a significant boost, at least
at certain companies: legislation is currently under consideration that would
mandate 40% female directors by 2022 at companies where the government has a
major ownership stake.
FIGURE 5 WOB in Brazil vs. Developing Countries, 2014
Case Study: Italy
The percentage of female directors at Italian companies in our universe is now
22.1%, a sharp increase from last year's 8.2%. The changes are in response to a law
adopted in 2011, which required new slates of board nominees to be 20% female
beginning with the first slate elected after 2012, and one-third female for each of a
company’s subsequent two elections. Only two Italian companies in our universe
(Saras SpA and Tod's SpA) have no female directors, an impressive increase from
last year when more than a quarter of the Italian universe (25.9%) had no female
directors at all. Finally, another interesting feature of board diversity in Italy, and a
sharp distinction from their French counterparts, is that 10.9% of Italian boards are
chaired by women, well above the 3.5% collective percentage for the industrialized
world and more than any other industrialized nation in Europe, save Norway.
FIGURE 6 WOB in Italy vs. Industrialized Countries, 2014

© 2014 MSCI, Inc. All rights reserved. Please refer to the disclaimer at the end of this document.
Page 6 of 20
December 2012
November 2014 2014 Survey of Women on Boards
Case Study: Spain
The percentage of female directors on Spanish boards in our sample is 12.8%, an
increase from its 2013 rate of 9.5%. This figure remains below the developed-world
collective percentage of 13.4%, and far below the 40% by 2015 that was dictated by
a 2007 law. One possible reason that legislative action has been less effective in
Spain than in other countries is that there is no penalty for non-compliance;
gender diversity is merely taken into account when public subsidies and state
contracts are awarded. Other countries, in contrast, have used a range of serious
penalties. For example, in Italy, non-compliance will result in fines after several
months; if non-compliance continues, elected directors lose their offices several
months later. In Norway, persistent non-compliance could lead to dissolution of the
company. In France, directors at non-compliant boards will not be paid their fees.
FIGURE 7 WOB in Spain vs. Industrialized Countries, 2014

© 2014 MSCI, Inc. All rights reserved. Please refer to the disclaimer at the end of this document.
Page 7 of 20
December 2012
November 2014 2014 Survey of Women on Boards
Country Case Study: United States
The greater depth of our coverage on US companies allows us to analyze significant
variations in board diversity by market capitalization. In general, larger companies
have more diverse boards: currently 19.0% of S&P 500 directors are women,
compared to 15.2% of the S&P Midcap Index and 12.6% of the S&P Smallcaps.
Overall, the S&P 1500, which is made up of the preceding three indexes combined,
has 15.8% women on its boards. In the S&P 500, more than 96% of companies have
at least one female director, and nearly 3 in 10 companies have at least three; in the
S&P Smallcaps, in contrast, only two-thirds of companies have at least one woman
director, and fewer than 9% have at least three.
FIGURE 8 Small Caps Lead Growth: Change in WOB by US Index since 2001
Female board chairs, moreover, remain rare across the US universe. Only 4.0% of
S&P 500 company chairs are women, along with 3.1% of S&P MidCaps board chairs
and only 2.3% of S&P SmallCaps board chairs. The percentage of female chairs in
the full S&P 1500 has only increased 0.7 percentage points since our last report, to
the current level of 3.3%, with most of that change having occurred in the S&P 500.
The rate of growth in the US has also been slow, but led by the SmallCaps. A look
back at data collected in 2001 by The Corporate Library indicates that since that
date, the percentage of female directors has risen by less than 7 percentage points,
both in the S&P 1500 and all three of its sub-indexes.
FIGURE 9 WOB in US vs. Industrialized Countries, 2014
3Q2014 1Q2013 4Q2011 2Q2001 CAGR
S&P 500 19.0% 16.9% 16.4% 12.0% 3.6%
S&P MidCaps 15.2% 13.5% 12.4% 8.7% 4.4%
S&P SmallCaps 12.6% 11.3% 10.0% 6.5% 5.2%
S&P 1500 15.8% 14.0% 13.1% 9.3% 4.2%
S&P 500 96.4% 91.5% 90.7% 82.6% 1.2%
S&P MidCaps 83.8% 80.3% 74.3% 59.1% 2.7%
S&P SmallCaps 67.1% 63.5% 56.9% 41.7% 3.7%
S&P 1500 81.4% 77.3% 72.9% 60.5% 2.3%
S&P 500 29.7% 25.7% 20.7% 9.7% 9.0%
S&P MidCaps 14.4% 12.1% 8.7% 2.8% 13.4%
S&P SmallCaps 8.6% 7.5% 4.9% 1.1% 17.1%
S&P 1500 17.3% 14.8% 11.2% 4.5% 10.9%
S&P 500 4.0% 3.0% 3.0% n/a 2.2%
S&P MidCaps 3.1% 2.5% 1.3% n/a 6.9%
S&P SmallCaps 2.3% 2.3% 2.0% n/a 1.1%
S&P 1500 3.3% 2.6% 2.2% n/a 3.2%
* CAGR since 2Q2011
% Women
on Board
(WOB)
% ≥ 1 WOB
% ≥ 3 WOB
% Female
Chair*

© 2014 MSCI, Inc. All rights reserved. Please refer to the disclaimer at the end of this document.
Page 8 of 20
December 2012
November 2014 2014 Survey of Women on Boards
Tax Havens and Regulatory Arbitrage
Companies employing aggressive tax practices have come under increasing scrutiny
in recent years. While technology companies have received the bulk of the media
attention, MSCI’s analysis indicated that companies with subsidiaries in tax havens
have spanned a wide range of industries. In our Issue Brief The ‘Tax Gap’ in the
MSCI World, we found that as much as 21.4% of MSCI World index constituents
paid tax rates that were substantially below the weighted average tax rate of the
countries in which they generate revenue. At the time of the report, 15.6% of the
MSCI World was domiciled or had a major subsidiary in a Tax Haven.
Beyond tax payments, does a company’s choice of tax strategy – and the use of Tax
Haven status – signal a particular management style in matters of regulation,
compliance, and market norms and standards?
While seeking Tax Haven status does not necessarily lower the floor on corporate
governance standards—listing requirements typically establish the minimum
corporate governance guidelines necessary for stock exchange listing—the action
does suggest a taste for regulatory arbitrage that could apply to governance
standards overall, to the possible detriment of the company's shareholders and
stakeholders alike.
For this report, we specifically analyzed companies with operations or major
subsidiaries in countries or territories that are generally recognized as Tax Havens
(those designated as offshore financial centers by the International Monetary Fund
(IMF), the Financial Secrecy Index (managed by the Tax Justice Network), and the
Organization for Economic Co-operation and Development (OECD)).
The percentage of Women on Boards for companies with operations in Tax
Havens is relatively low, and resembles rates in emerging markets rather than
industrialized nations. The percentage of female directors on the boards of
companies in Tax Havens, 10.3%, is more in line with developing nations, 8.8%, then
with industrialized nations, 13.4%. The same can be said for the data on boards with
at least one woman, at least three women, and female chairs. While there is no
direct evidence that would suggest operating in a Tax Haven would shield
companies from the pressure to add more female directors, the data suggests
otherwise. Of the 28 companies in this dataset that are operating primarily in the
US, UK, or Australia, 20 have a lower percentage of women their boards than the
average for their ‘home’ country. In fact, these 20 companies have either no
women on their boards or only one woman on their boards, substantially
underperforming their peers in their ‘home’ markets.
In the context of greater regulatory scrutiny of global corporate tax practices, the
fact that companies seeking Tax Haven status lag market peers in the move to
diversify board membership could signal a management style that skirts
regulatory and stakeholder pressure. Whether an eagerness to evade regulatory
constraints and market norms is perceived positively or negatively by shareholders,
at minimum it contributes one more piece of information on a company’s
orientation toward risk taking.
FIGURE 10 WOB %, Industrialized Markets vs Emerging Markets, 2014
Source: MSCI ESG Research
© 2014 MSCI, Inc. All rights reserved. Please refer to the disclaimer at the end of this document.
Page 9 of 20
December 2012
November 2014 2014 Survey of Women on Boards
ESG, Controversy, and Women on Boards
We noted some interesting correlations between WOB and broader ESG metrics in
this report. Specifically, we found the following takeaways:
• Companies with a higher percentage of WOB tend to be involved in fewer
governance related controversies, including fraud, accounting, bribery, and
corruption-related controversies, in the last three years;
• Companies with a higher percentage of WOB tend to have strong ESG
management scores on MSCI ESG Research’s Universal Key Issues (including
management of carbon emissions, toxic releases, water, labor, and health & safety
issues).
• Companies with a higher percentage of WOB tend to have higher ESG ratings
than peers.
Women on Boards and ESG: Correlation Study
For our first data study of the issue, we tested the correlation between higher
percentages of WOB and our “universal” ESG metrics (specific data points in
common to all companies in the MSCI ACWI universe) in our database with the
thesis that board diversity could manifest in more progressive or heterogeneous
approaches to policy-based risk management. While we found positive correlations
to a number of our core indicators, the correlations were relatively weak on an
individual basis. Figure 11 shows the correlations for our universal metrics for every
company on the MSCI World Index, comparing absolute and country-relative
numbers.
FIGURE 11 Correlating WOB and Common ESG Management Scores, 2014
Source: MSCI ESG Research
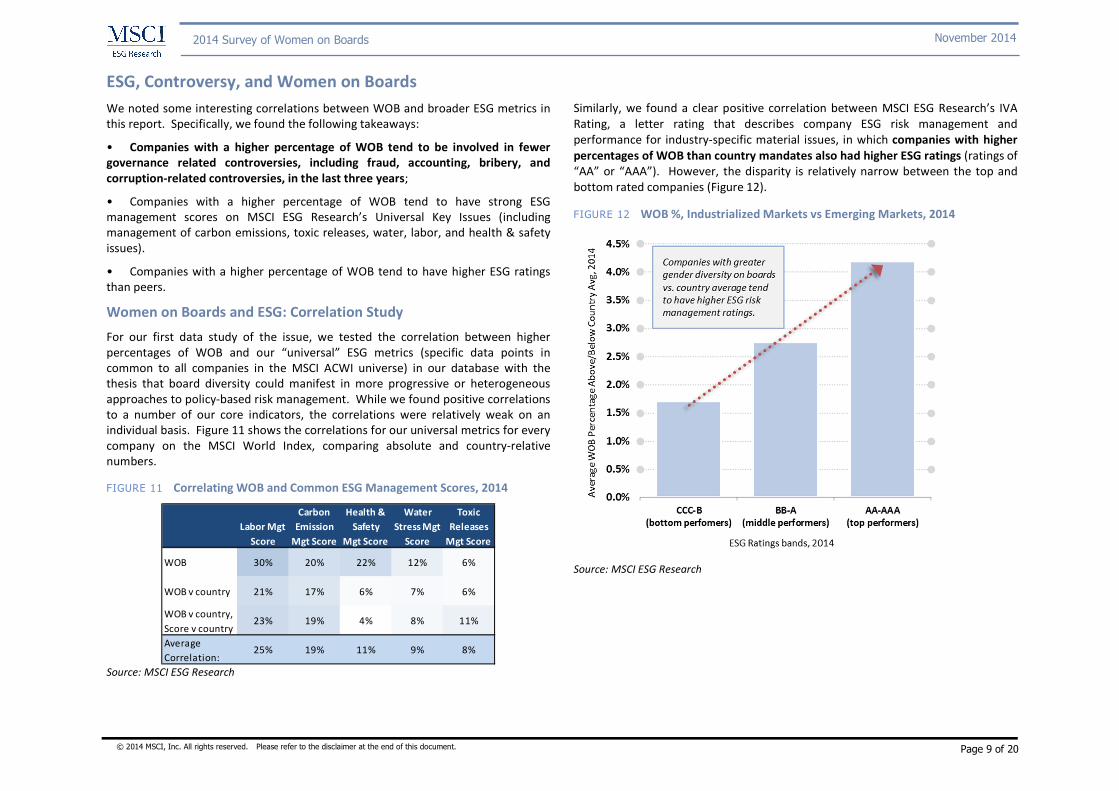
Similarly, we found a clear positive correlation between MSCI ESG Research’s IVA
Rating, a letter rating that describes company ESG risk management and
performance for industry-specific material issues, in which companies with higher
percentages of WOB than country mandates also had higher ESG ratings (ratings of
“AA” or “AAA”). However, the disparity is relatively narrow between the top and
bottom rated companies (Figure 12).
FIGURE 12 WOB %, Industrialized Markets vs Emerging Markets, 2014
Source: MSCI ESG Research
Labor Mgt
Score
Carbon
Emission
Mgt Score
Health &
Safety
Mgt Score
Water
Stress Mgt
Score
Toxic
Releases
Mgt Score
WOB 30% 20% 22% 12% 6%
WOB v country 21% 17% 6% 7% 6%
WOB v country,
Score v country23% 19% 4% 8% 11%
Average
Correlation:25% 19% 11% 9% 8%

© 2014 MSCI, Inc. All rights reserved. Please refer to the disclaimer at the end of this document.
Page 10 of 20
December 2012
November 2014 2014 Survey of Women on Boards
Women on Boards and Governance Controversies
While the correlations between board gender diversity and ESG-related
management policy may be positive but weak, the strongest relationship we noted
was outcome driven – using our database of controversial business activity, boards
with gender diversity above and beyond regulatory mandates had fewer instances
of governance-related scandals such as bribery, corruption, fraud, and shareholder
battles. Using a sample of global large cap companies, we compared percentage
bands of WOB above and below country average (to correct for market-based
regulatory mandates or expectations) and to total governance controversies
between 2011 and 2014 per USD billion in market cap (to correct for size bias).
Figure 13 details the results – a clear trend pattern between having higher-than-
mandated percentages of WOB and fewer governance-related controversies.
These findings gel with academic findings on gender diversity and risk management
broadly.
While there is more work to do in isolating the effect of board diversity on
outcomes, WOB may be a piece of the puzzle in managing enterprise and market
risks more effectively.
FIGURE 13 Women on Boards vs. Country Average and Governance Controversies per USD billion in Market Cap
Source: MSCI ESG Research

© 2014 MSCI, Inc. All rights reserved. Please refer to the disclaimer at the end of this document.
Page 11 of 20
December 2012
November 2014 2014 Survey of Women on Boards
Female Leadership and Women on Boards
Finally, we took a closer look at S&P 1500 companies led by female CEOs compared
to those led by male CEOs to understand the relationship between the CEO’s gender
and the overall makeup of the board. As of October 9, 2014, there were only 67
female CEOs at S&P 1500 companies, a number that has remained low since we
began full coverage of the S&P 1500 universe in 2009.
Over the same time period, the increase in female directors on the boards of S&P
1500 companies mirrors the slow rise of female CEOs. Whereas there was an
average of 1.2 female directors (12.5% of the board) at S&P 1500 companies in
2009, there is currently an average of only 1.5 female directors (15.8% of the
board). However, we do see some correlation between the presence of a female
CEO and higher numbers of female directors. At female-led S&P 1500 companies,
there is currently an average of 2.8 female directors, or 28.6% of the board; the
count includes the CEO. Male-led companies currently average 1.4 female directors,
or 15.2% of the board.
While the female CEO accounts for one directorship on all 67 female-led boards,
there is still an indication that female-led companies account for higher female
representation on their respective boards. If we were to exclude the female CEO
from this count, female-led companies on average have 29% more women on
boards than their male-led counterparts, 1.8 to 1.4.
FIGURE 14 Female CEOs and the Effect on WOB, 2009-2014
2014 2013 2012 2011 2010 2009
Avg WOB / Female CEO
2.8 2.5 2.6 2.5 2.4 2.5
Avg WOB (ex CEO) / Female CEO
1.8 1.5 1.6 1.5 1.4 1.5
Avg WOB / Male CEO
1.4 1.3 1.3 1.2 1.2 1.1
WOB: Female CEO vs. Male CEO
29% 15% 23% 25% 17% 36%
Source: MSCI ESG Research
The more compelling assessment comes from a look at boards with 3 or more
female directors. Overall, 17.2% of S&P 1500 companies are comprised of boards
with at least 3 female directors. However, nearly 54% of the boards at the 67 S&P
1500 companies with female CEOs have at least 3 female directors, led by Avon
Products, Inc., where 7 of the company's 11 directors are women. At companies
with male CEOs, only 15.5% of companies have boards with at least 3 female
directors. The difference points to a few hypotheses: 1) The possibility that female
CEOs deepen the director applicant pool, suggesting that the true problem with lack
of female board representation is a lack of female leadership and that with more
female CEOs would come more women on boards; 2) the presence of a female CEO
in the first place is an indication of the company's culture that is more amenable to
appointing female leaders; and 3) after breaking the proverbial glass ceiling at a
given company, the appointment of more female leadership could become easier
over time.
FIGURE 15 Changes in Female Leadership, 2009-2014
Source: MSCI ESG Research
In looking at companies that appointed female CEOs during our period of study, our
analysis suggests that having a woman in leadership could contribute to the
increase of women on boards. During the time period of our study, 35 companies
appointed a female CEO; three of these dropped off the S&P 1500 the following
year, leaving a sample size of 32. Of those 32 companies, 18 saw an increase of
between one and two women on the board within the following one to four years,

© 2014 MSCI, Inc. All rights reserved. Please refer to the disclaimer at the end of this document.
Page 12 of 20
December 2012
November 2014 2014 Survey of Women on Boards
12 companies saw no increase and only 2 companies showed a drop in the number
of women on their respective boards. This suggests that over 56% of the time, the
appointment of a female CEO led to the addition of at least one new female
director in the ensuing four years.
FIGURE 16 Changes in Female Leadership, 2009-2014
Female CEOs 2009-2014 n %
Companies with new female CEOs 35
Company dropped off S&P 1500 3
Increase of 1+ WOB from time of new CEO to current 4 12.5%
Increase of 1 WOB from time of new CEO to current 14 43.8%
No increases of WOB 12 37.5%
Decrease of 1 WOB from time of new CEO to current 2 6.3%
Decrease of 1+ WOB from time of new CEO to current 0 0.0%
Source: MSCI ESG Research
To compare, we looked at all companies that remained on the index from 2009 to
2014. In 37% of the time, versus 56% in the case of a female CEO appointment,
companies added one or more female directors in this timeframe. Given the very
small sample of companies appointing a female CEO, the analysis cannot be
conclusive. Yet, it does suggest that companies that appoint a female CEO do
subsequently differ from other companies in the characteristics of their board
appointments.
FIGURE 17 Changes in Corporate Leadership, 2009-2014
CEOs 2009-2014 n %
Companies still on index 1167
Increase of 1+ WOB from 2009 to current 96 8.2%
Increase of 1 WOB from 2009 to current 341 29.2%
No increases of WOB 616 52.8%
Decrease of 1 WOB from 2009 to current 99 8.5%
Decrease of 1+ WOB from 2009 to current 15 1.3%
Source: MSCI ESG Research
FIGURE 18 Changes in Corporate Leadership: New Female CEOs, 2009-2014
Source: MSCI ESG Research
FIGURE 19 Changes in Corporate Leadership: All CEOs, 2009-2014
Source: MSCI ESG Research
© 2014 MSCI, Inc. All rights reserved. Please refer to the disclaimer at the end of this document.
Page 13 of 20
December 2012
November 2014 2014 Survey of Women on Boards
Appendix A: Methodology and Data Notes
Data and Report Framework MSCI ESG Research's 2014 Women on Boards survey is based on a larger set of companies than any of our previous reports. The 2014 report includes data as of September
15, 2014, covering 6,566 companies in 58 countries and 12 dependencies and special areas of sovereignties. This includes the constituents of the MSCI World Index, the
MSCI Emerging Markets Index, the Russell 3000, and most of the best known large-cap indices in Europe, North America, and the Asia/Pacific region. While the discussion of
change over time in past WOB surveys were based on a predominantly large-cap subset of our universe that we have been tracking for this report since 2009, we have
expanded our coverage universe in the 2014 report to include all covered companies on which we collect board-specific data. We have included all companies from all
markets to reflect the true status of women on boards going forward.
For this report, we specifically analyzed companies with operations in countries or territories that are generally recognized as Tax Havens (those designated as offshore
financial centers by at least two of the following organizations: the International Monetary Fund (IMF), the Financial Secrecy Index (managed by the Tax Justice Network),
and the Organization for Economic Co-operation and Development (OECD)).
The data was analyzed as of September 2014, and rates of change were calculated compared to the data as of March 2013.
Also in this report, we used ESG data and company ratings that included data points for the entire MSCI ACWI Index constituency covering how companies manage a variety
of future balance sheet issues. The data fell into two categories: “common” ESG data points (data points in common with all companies in the MSCI ACWI Index), and ESG
Ratings (industry-relative ratings on corporate risk management of material ESG issues). The “common” data points focus on policies (i.e., policies related to employee
incentives and internal leadership development), performance (i.e., GHG emission reductions against targets and peer companies), and governance (i.e., executive
accountability for water management) in the following categories: Carbon Emissions management, Water Stress management, Toxic Release management, Labor
Management, and Health & Safety management.
We also leveraged our database of controversial business activity between 2011 and 2014 for the same company universe, with more than 11,000 active or ongoing
controversies in the last three year. Both sets of ESG data were compared to the more than 5,200 companies for which we had WOB data in 2014, with final analyses
completed on MSCI World Index constituents and Large Cap (market capitalization in excess of USD 10 billion as of October 31, 2014) companies.

© 2014 MSCI, Inc. All rights reserved. Please refer to the disclaimer at the end of this document.
Page 14 of 20
December 2012
November 2014 2014 Survey of Women on Boards
Appendix B: Global and Regional Data
FIGURE 20 Global Aggregate Samples and Percentages,2009-2014
Quarter Q3
2014 Q1
2013 Q4
2011 Q4
2010 Q4
2009
Companies Analyzed 6,566 4,332 4,028 4,205 4,233
Aggregate Percentage Women on Boards (WOB) 12.4% 11.0% 10.5% 9.8% 9.3%
Aggregate Total Directors 60,951 46,269 40,144 41,838 41,968
Aggregate Total WOB 7,550 5,077 4,230 4,097 3,910
% Companies with ≥ 1 WOB 63.7% 62.5% 60.1% 58.2% 56.1%
% Companies with ≥ 3 WOB 12.5% 13.0% 10.1% 8.5% 8.3%
% Companies with a Female Chair 3.5% 2.3% 2.2% 2.2% 2.0%
FIGURE 21 Economic Development Samples and Percentages, 2009-2014
Quarter Q3 2014 Q1 2013 Q4 2011 Q4 2010 Q4 2009
Economic Market Industrial Emerging Industrial Emerging Industrial Emerging Industrial Emerging Industrial Emerging
Companies Analyzed 5,244 1,322 3,481 851 3,324 704 3,570 635 3,678 555
Aggregate Percent of Women on Boards (WOB) 13.4% 8.8% 11.8% 7.4% 11.2% 7.4% 10.3% 7.1% 9.7% 6.9%
Aggregate Total Directors 48,041 12,910 37,403 8,866 33,062 7,082 35,391 6,447 36,246 5,722
Aggregate Total WOB 6419 1131 4423 654 3704 526 3642 455 3514 396
% Companies with ≥ 1 WOB 66.5% 52.3% 66.6% 45.8% 63.2% 45.6% 60.6% 45.0% 57.9% 44.0%
% Companies with ≥ 3 WOB 13.9% 7.3% 14.4% 7.4% 10.9% 6.4% 9.0% 5.7% 8.5% 6.5%
% Companies with a Female Chair 3.5% 3.3% 2.3% 2.5% 2.0% 3.1% 2.0% 3.3% 1.8% 3.4%
FIGURE 22 Regional Samples and Percentages, 2009-2014
Region # of
Companies (2014)
% of Women on Boards
(WOB)
2009 to 2014 Δ in WOB %
% Companies with ≥ 1 WOB
2009 to 2014 ∆ in ≥1 WOB
% Companies with ≥ 3 WOB
2009 to 2014 ∆ in ≥3 WOB
% of Companies
with Female Chairs
2009 to 2014 ∆ in Female
Chairs
Australia/New Zealand 242 16.7% 8.1% 72.3% 25.9% 9.1% 7.1% 5.4% 3.0%
Industrialized Asia 613 3.5% 1.0% 27.4% 7.1% 2.1% 1.1% 1.0% 0.5%
Industrialized Europe 893 18.6% 10.3% 84.8% 28.2% 29.7% 29.7% 3.8% 2.1%
Nordic Countries 123 29.6% 6.0% 99.2% 8.0% 48.8% 12.8% 7.3% 5.7%
US/Canada 3,373 13.1% 1.0% 67.2% -2.3% 10.9% 0.7% 3.5% 1.3%
Americas 171 6.3% 1.2% 42.7% 9.2% 4.1% -0.1% 0.6% -4.7%
Emerging Asia 655 7.0% 1.3% 46.1% 7.8% 4.1% 0.2% 3.0% 0.9%
Emerging Europe 71 8.9% 2.5% 53.5% 4.7% 5.6% 3.3% 8.6% 6.3%
Middle East and Africa 178 15.1% 2.2% 78.1% 2.3% 21.3% -0.5% 6.2% -1.1%
Tax Havens 247 10.3% n/a 56.7% n/a 8.1% n/a 2.4% n/a
Global 6,566 12.4% 3.1% 63.7% 7.6% 12.5% 4.3% 3.5% 1.5%
Global Ex-IndEur/Nordic 5,550 10.9% 1.8% 59.5% 4.4% 9.0% 1.5% 3.2% 1.1%
© 2014 MSCI, Inc. All rights reserved. Please refer to the disclaimer at the end of this document.
Page 15 of 20
December 2012
November 2014 2014 Survey of Women on Boards
Appendix B, continued: Global and Regional Data
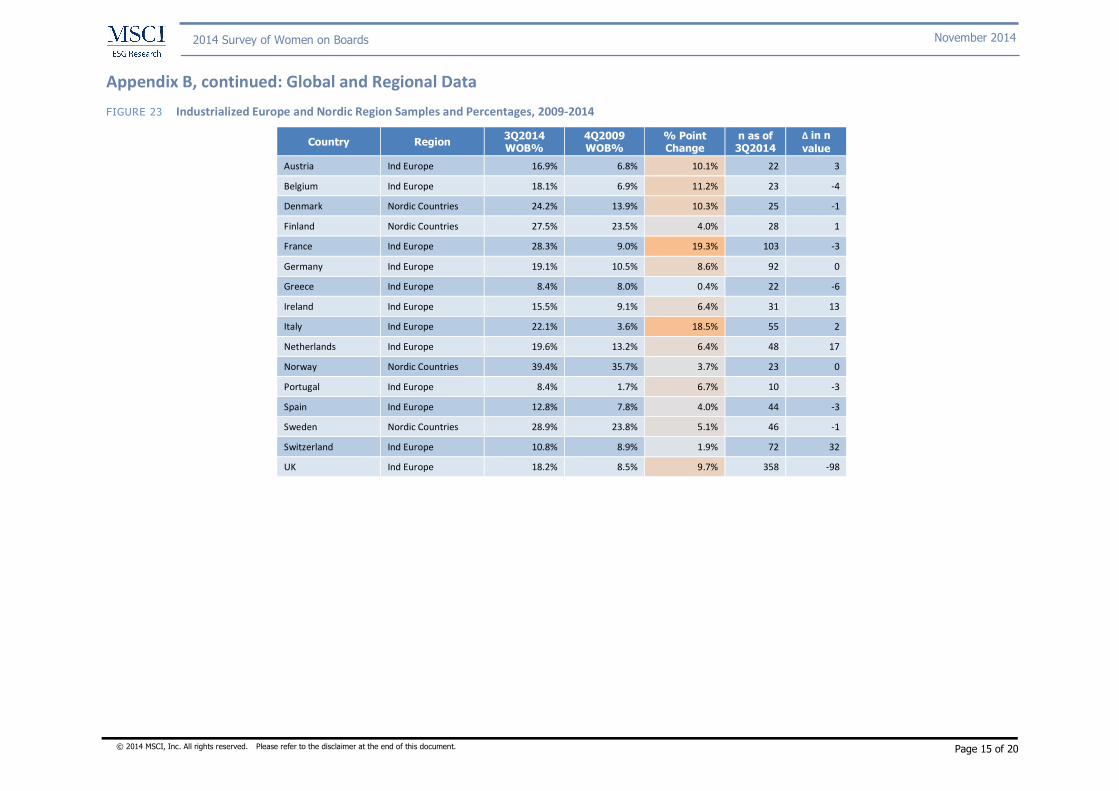
FIGURE 23 Industrialized Europe and Nordic Region Samples and Percentages, 2009-2014
Country Region 3Q2014 WOB%
4Q2009 WOB%
% Point Change
n as of 3Q2014
Δ in n
value
Austria Ind Europe 16.9% 6.8% 10.1% 22 3
Belgium Ind Europe 18.1% 6.9% 11.2% 23 -4
Denmark Nordic Countries 24.2% 13.9% 10.3% 25 -1
Finland Nordic Countries 27.5% 23.5% 4.0% 28 1
France Ind Europe 28.3% 9.0% 19.3% 103 -3
Germany Ind Europe 19.1% 10.5% 8.6% 92 0
Greece Ind Europe 8.4% 8.0% 0.4% 22 -6
Ireland Ind Europe 15.5% 9.1% 6.4% 31 13
Italy Ind Europe 22.1% 3.6% 18.5% 55 2
Netherlands Ind Europe 19.6% 13.2% 6.4% 48 17
Norway Nordic Countries 39.4% 35.7% 3.7% 23 0
Portugal Ind Europe 8.4% 1.7% 6.7% 10 -3
Spain Ind Europe 12.8% 7.8% 4.0% 44 -3
Sweden Nordic Countries 28.9% 23.8% 5.1% 46 -1
Switzerland Ind Europe 10.8% 8.9% 1.9% 72 32
UK Ind Europe 18.2% 8.5% 9.7% 358 -98

© 2014 MSCI, Inc. All rights reserved. Please refer to the disclaimer at the end of this document.
Page 16 of 20
December 2012
November 2014 2014 Survey of Women on Boards
Appendix C: Country Level Data
FIGURE 24 Women on Boards: Industrialized Markets, 2014
FIGURE 25 Women on Boards: Emerging Markets, 2014

© 2014 MSCI, Inc. All rights reserved. Please refer to the disclaimer at the end of this document.
Page 17 of 20
December 2012
November 2014 2014 Survey of Women on Boards
Appendix C, continued: Country Level Data
FIGURE 26 Companies with ≥1 Woman on Board: Industrialized Markets, 2014
FIGURE 27 Companies with ≥1 Woman on Board: Emerging Markets, 2014

© 2014 MSCI, Inc. All rights reserved. Please refer to the disclaimer at the end of this document.
Page 18 of 20
December 2012
November 2014 2014 Survey of Women on Boards
Appendix C, continued: Country Level Data
FIGURE 28 Companies with ≥3 Woman on Board: Industrialized Markets, 2014
FIGURE 29 Companies with ≥3 Woman on Board: Emerging Markets, 2014

© 2014 MSCI, Inc. All rights reserved. Please refer to the disclaimer at the end of this document.
Page 19 of 20
December 2012
November 2014 2014 Survey of Women on Boards
Contact Us
Notice and Disclaimer • This document and all of the information contained in it, including without limitation all text, data, graphs, charts (collectively, the “Information”) is the property of MSCI Inc. or its subsidiaries (collectively, “MSCI”), or MSCI’s licensors, direct or
indirect suppliers or any third party involved in making or compiling any Information (collectively, with MSCI, the “Information Providers”) and is provided for informational purposes only. The Information may not be modified, reverse-
engineered, reproduced or redisseminated in whole or in part without prior written permission from MSCI.
• The Information may not be used to create derivative works or to verify or correct other data or information. For example (but without limitation), the Information may not be used to create indexes, databases, risk models, analytics, software,
or in connection with the issuing, offering, sponsoring, managing or marketing of any securities, portfolios, financial products or other investment vehicles utilizing or based on, linked to, tracking or otherwise derived from the Information or any
other MSCI data, information, products or services.
• The user of the Information assumes the entire risk of any use it may make or permit to be made of the Information. NONE OF THE INFORMATION PROVIDERS MAKES ANY EXPRESS OR IMPLIED WARRANTIES OR REPRESENTATIONS WITH
RESPECT TO THE INFORMATION (OR THE RESULTS TO BE OBTAINED BY THE USE THEREOF), AND TO THE MAXIMUM EXTENT PERMITTED BY APPLICABLE LAW, EACH INFORMATION PROVIDER EXPRESSLY DISCLAIMS ALL IMPLIED WARRANTIES
(INCLUDING, WITHOUT LIMITATION, ANY IMPLIED WARRANTIES OF ORIGINALITY, ACCURACY, TIMELINESS, NON-INFRINGEMENT, COMPLETENESS, MERCHANTABILITY AND FITNESS FOR A PARTICULAR PURPOSE) WITH RESPECT TO ANY OF THE
INFORMATION.
• Without limiting any of the foregoing and to the maximum extent permitted by applicable law, in no event shall any Information Provider have any liability regarding any of the Information for any direct, indirect, special, punitive, consequential
(including lost profits) or any other damages even if notified of the possibility of such damages. The foregoing shall not exclude or limit any liability that may not by applicable law be excluded or limited, including without limitation (as applicable),
any liability for death or personal injury to the extent that such injury results from the negligence or willful default of itself, its servants, agents or sub-contractors.
• Information containing any historical information, data or analysis should not be taken as an indication or guarantee of any future performance, analysis, forecast or prediction. Past performance does not guarantee future results.
• The Information should not be relied on and is not a substitute for the skill, judgment and experience of the user, its management, employees, advisors and/or clients when making investment and other business decisions. All Information is
impersonal and not tailored to the needs of any person, entity or group of persons.
• None of the Information constitutes an offer to sell (or a solicitation of an offer to buy), any security, financial product or other investment vehicle or any trading strategy.
• It is not possible to invest directly in an index. Exposure to an asset class or trading strategy or other category represented by an index is only available through third party investable instruments (if any) based on that index. MSCI does not issue,
sponsor, endorse, market, offer, review or otherwise express any opinion regarding any fund, ETF, derivative or other security, investment, financial product or trading strategy that is based on, linked to or seeks to provide an investment return
related to the performance of any MSCI index (collectively, “Index Linked Investments”). MSCI makes no assurance that any Index Linked Investments will accurately track index performance or provide positive investment returns. MSCI Inc. is
not an investment adviser or fiduciary and MSCI makes no representation regarding the advisability of investing in any Index Linked Investments.
• Index returns do not represent the results of actual trading of investible assets/securities. MSCI maintains and calculates indices, but does not manage actual assets. Index returns do not reflect payment of any sales charges or fees an investor
may pay to purchase the securities underlying the index or Index Linked Investments. The imposition of these fees and charges would cause the performance of an Index Linked Investment to be different than the MSCI index performance.
• The Information may contain back tested data. Back-tested performance is not actual performance, but is hypothetical. There are frequently material differences between back tested performance results and actual results subsequently
achieved by any investment strategy.
• Constituents of MSCI equity indexes are listed companies, which are included in or excluded from the indexes according to the application of the relevant index methodologies. Accordingly, constituents in MSCI equity indexes may include MSCI
Inc., clients of MSCI or suppliers to MSCI. Inclusion of a security within an MSCI index is not a recommendation by MSCI to buy, sell, or hold such security, nor is it considered to be investment advice.
• Data and information produced by various affiliates of MSCI Inc., including MSCI ESG Research Inc. and Barra LLC, may be used in calculating certain MSCI equity indexes. More information can be found in the relevant standard equity index
methodologies on www.msci.com.
• MSCI receives compensation in connection with licensing its indices to third parties. MSCI Inc.’s revenue includes fees based on assets in investment products linked to MSCI equity indexes. Information can be found in MSCI’s company filings on
the Investor Relations section of www.msci.com.
Americas Europe, Middle East & Africa Asia Pacific
+1.212.804.5299 +44.207.618.2510 +612.9033.9339

© 2014 MSCI, Inc. All rights reserved. Please refer to the disclaimer at the end of this document.
Page 20 of 20
December 2012
November 2014 2014 Survey of Women on Boards
• MSCI ESG Research Inc. is a Registered Investment Adviser under the Investment Advisers Act of 1940 and a subsidiary of MSCI Inc. Except with respect to any applicable products or services from MSCI ESG Research, neither MSCI nor any of its
products or services recommends, endorses, approves or otherwise expresses any opinion regarding any issuer, securities, financial products or instruments or trading strategies and neither MSCI nor any of its products or services is intended to
constitute investment advice or a recommendation to make (or refrain from making) any kind of investment decision and may not be relied on as such. Issuers mentioned or included in any MSCI ESG Research materials may include MSCI Inc.,
clients of MSCI or suppliers to MSCI, and may also purchase research or other products or services from MSCI ESG Research. MSCI ESG Research materials, including materials utilized in any MSCI ESG Indexes or other products, have not been
submitted to, nor received approval from, the United States Securities and Exchange Commission or any other regulatory body.
• Any use of or access to products, services or information of MSCI requires a license from MSCI. MSCI, Barra, RiskMetrics, IPD, FEA, InvestorForce, and other MSCI brands and product names are the trademarks, service marks, or registered
trademarks of MSCI or its subsidiaries in the United States and other jurisdictions. The Global Industry Classification Standard (GICS) was developed by and is the exclusive property of MSCI and Standard & Poor’s. “Global Industry Classification
Standard (GICS)” is a service mark of MSCI and Standard & Poor’s.
About MSCI ESG Research MSCI ESG Research products and services are designed to provide in-depth research, ratings and analysis of environmental, social and governance-related business practices to companies worldwide. Ratings and data
from MSCI ESG Research are also used in the construction of the MSCI ESG Indexes. MSCI ESG Research Inc. is a Registered Investment Adviser under the Investment Advisers Act of 1940.
About MSCI MSCI Inc. is a leading provider of investment decision support tools to investors globally, including asset managers, banks, hedge funds and pension funds. MSCI products and services include indexes, portfolio risk and
performance analytics, and ESG data and research.
The company’s flagship product offerings are: the MSCI indexes with approximately USD 8 trillion estimated to be benchmarked to them on a worldwide basis1; Barra multi-asset class factor models, portfolio risk and
performance analytics; RiskMetrics multi-asset class market and credit risk analytics; IPD real estate information, indexes and analytics; MSCI ESG (environmental, social and governance) Research screening, analysis
and ratings; and FEA valuation models and risk management software for the energy and commodities markets. MSCI is headquartered in New York, with research and commercial offices around the world.
1 As of September 30, 2013, as reported on January 31, 2014 by eVestment, Lipper and Bloomberg