Embed Size (px)
Citation preview

Surface modification of thin-film
composite membranes by direct
energy techniques
A thesis submitted for the degree of Doctor of Philosophy
by
Ms. Rackel Reis
Victoria University
Institute for Sustainability and Innovation
March 2016

I
Declaration
I, Rackel Reis, declare that this thesis entitled “Surface modification of thin-film
composite membranes by direct energy techniques” is no more 100,000 words in length,
exclusive of tables, figures, appendices, bibliography, references and footnotes. This
thesis contains no material that has been submitted previously, in whole or in part, for
the award of any other degree or diploma. This research has been conducted in
collaboration with a number of partners, whose contributions have been appropriately
acknowledged throughout. Thus, except where otherwise indicated, this thesis is my
own work.

II
Journal publications, conference proceedings and conference presentations
relevant to the scope of this thesis
Refereed journal publications
R. Reis, L. F. Dumée, A. Merenda, J. D. Orbell, J. A. Schütz and M. C. Duke, Plasma-
induced physicochemical effects on a poly(amide) thin-film composite membrane,
Desalination, 403 (2017) 3-11.R. Reis, L. F Dumée, B. L. Tardy, R. Dagastine, J. D.
Orbell, J. A. Schutz, M. C. Duke, Towards Enhanced Performance Thin-film Composite
Membranes via Surface Plasma Modification, Scientific Reports, 6 (2016) 29206.
R. Reis, L. F Dumée, L. He, F. She, J. D. Orbell, B. Winther-Jensen, and M. C. Duke,
Amine enrichment of thin-film composite membranes via low pressure plasma for anti-
microbial adhesion, ACS Applied Materials and Interfaces, 7 (2015) 14644–14653.
L. He, L. F. Dumée, C. Feng, L. Velleman, R. Reis, F. She, W. Gao, L. Kong,
Promoted water transport across graphene oxide–poly(amide) thin film composite
membranes and their antibacterial activity, Desalination, 365 (2015) 126–135.
L. F. Dumée, F. M. Allioux, R. Reis, M. Duke, S. Gray, M. Tobin, L. Puskar, L. He, P.
Hodgson, L. Kong, Qualitative spectroscopic characterization of the matrix–silane
coupling agent interface across metal fibre reinforced ion exchange resin composite
membranes, Vibrational Spectroscopy, 75 (2014) 203–212.
Submitted manuscript
R. Reis, M. C. Duke, J. D. Orbell, B. L. Tardy, D. T. Oldfield, R. Dagastine, and L. F.
Dumée, Gamma-ray induced surface grafting across thin-film nano-composite
membranes for enhanced performance and tuned surface charge.

III
Conferences Presentations
Oral Presentations
1. R. Reis, L. F. Dumée, F. She, J. D. Orbell, J. A. Schutz, B. Winther-Jensen, M.
C. Duke, In Exploring plasma technique for surface modification of thin-film
composites membranes, Gaseous Electronics Meeting (GEM), 2016, Geelong,
Australia.
2. R. Reis, L. F. Dumée, F. She, J. D. Orbell, J. A. Schutz, B. Winther-Jensen, M.
C. Duke, In Radiation techniques for surface functionalization of thin-film
composite poly(amide) membranes, In 2nd International Conference on
Desalination using Membrane Technology, 2015, Singapore.
3. R. Reis, L. F. Dumée, Li He, F. She, J. D. Orbell, B. Winther-Jensen, M. C.
Duke, Plasma Polymerization for the versatile nanoscale functionalization of
thin-film composite membranes, In International Conference of Nanoscience
and Nanotechnology (ICONN), 2014, Adelaide, Australia.
4. R. Reis, L. F. Dumée, F. She, J. D. Orbell, M. C. Duke, Plasma surface
modification of RO membranes, In Membrane Society of Australasia (MSA),
2012, Brisbane, Australia.

IV
Poster Presentations
1. R. Reis, L. F. Dumée, F. She, J. D. Orbell, M. C. Duke, Amine enrichment of
thin film composite membrane via y-ray radiation, In Membrane Australasian
Symposium MSA - Committee member, 2014, Geelong, Australia.
2. R. Reis, L. F. Dumée, F. She, J. D. Orbell, B. Winther-Jensen, M. C. Duke,
Plasma Polymerization for Surface Functionalization in Thin Film Composite
Membranes, In International Membrane Science and Technology (IMSTEC),
2013, Melbourne, Australia.
3. R. Reis, L. F. Dumée, F. She, J. D. Orbell, B. Winther-Jensen, M. C. Duke,
Plasma Polymerization for Surface Functionalization in Thin Film Composite
Membranes, In International Workshop of Infrared Microscopy and
Spectroscopy (WIRMS), 2013, Lorne, Australia.
4. R. Reis, L. F. Dumée, A. Merenda, John D. Orbell, J. A. Schütz and M. C.
Duke, Impact of plasma on the chlorine tolerance of poly(amide) RO
Membranes, In Membrane Australasian Symposium (MSA), 2013, Xi’an, China.
5. R. Reis, L. F. Dumée, A. Merenda, J. D. Orbell, J. A. Schütz and M. C. Duke,
Impact of plasma on the chlorine tolerance of poly(amide) RO Membranes, In
Membrane Separation Process Symposium (SIMPAM), 2013, Rio de Janeiro,
Brazil.

V
Awards and grants
1. Prize for best student paper: Oral presentation, Gaseous Electronics Meeting
(GEM), Geelong, Australia, 2016.
2. Grant award: R. Reis, L. F. Dumée and M. C. Duke, Australian Institute of
Nuclear Science and Engineering (AINSE) grant ID: ALNGRA 14050 - Surface
functionalization of thin-film composite membranes via gamma-rays irradiation-
induced grafting, 2015 (4,800 AUD).
3. Grant award: R. Reis, L. F. Dumée and M. C. Duke, Brazilian Synchrotron
Light Laboratory (LNLS), Nanoscale physical-chemical characterization of thin-
film composite membrane: molecular chemical level study of surface roughness
- Infra red beamline equipped with a scattering-type Scanning Near-Field
Optical Microscope (s-SNOM), Brazil, 2015 Proposal ID: 20150123. Travel
Award from the Australian Synchrotron (6,400 AUD) Proposal ID: 10608oposal
ID: 10608.
4. Postgraduate top up scholarship: National Centre of Excellence in Desalination
Australia, 2013-2016 (30,000 AUD).
5. Prize for best student poster presentation: Poster presentation, Impact of plasma
on the chlorine tolerance of poly(amide) RO Membranes, In Membrane
Australasian Symposium (MSA), 2013, Xi’an, China – ( 100.00 AU$).
6. Grant award: R. Reis, L. F. Dumée, J. D. Orbell, J. A. Schütz and M. C. Duke,
Australian Synchrotron Beamline grant, synchrotron infra-red micro-
spectroscopy (IRM) beamline ID:M6419- Analysis of chemically modified
polyamide reverse osmosis active layers for enhanced chemical resistance and
performance, 2013.

VI
Acknowledgement
Firstly I would like to thank my principle my supervisor Prof. Mikel C. Duke for his
encouragement and direction leading me to where I am today. I am so grateful for the
opportunity that he has given me to undertake this research allowing me to develop the
skills that I never thought I had.
I would also like thank my co supervisor Prof. John D. Orbell for his calming support
throughout. His ability to recognise the positives despite the challenges being faced was
valuable especially when deadlines were tight. I was fortunate to closely observe his
creative process when analysing data then formulating theories beyond my own
imagination.
It is difficult to describe how grateful I am for the assistance of my co supervisor Dr.
Ludovic F. Dumée. His relentless pursuit for perfection has taught me the drive
necessary to achieve the results we all strive for in research.
I also thank my co supervisor Dr. Mary She for advice provided.
I was fortunate to have had significant assistance from Prof. Bjorn Winther-Jensen and
Dr. Jürg A. Schütz, who was kind in providing leading edge knowledge of plasma
technique.
I would like to express my sincere gratitude to Victoria University and the Institute of
Sustainability and Innovation for hosting and supporting me. A special thanks to Prof.
Stephen Gray for his humour and support, Dr Marlene Cran for advice and Catherine
Enriquez for her assistance at ISI. Thank you to my fellow students and friends from the
institute that have shared this journey, best wishes in your own endeavours.
My special thanks to Mark Tobin for his fundamental assistance at the Australian
Synchrotron, Daniel T. Oldfield (RMIT University), Andrea Merenda (Deakin
University), Blaise Tardy (The University of Melbourne), Nicolas Goujon (Deakin
University) and Daniel Gunzelmann (Deakin University) for instrumentation support.

VII
To my dear family and lovely partner Charles who supported me unconditionally and
my very special friends Barbara, Behnoosh, Bartek, Eugene, Felipe, Izabel, Jennifer,
Koen, Laura, Marina, Mick, Nichole, Ranthini, Vera and all support from the Brazilian
community at Paul Stephen Spiritual Centre I cannot find words to express my gratitude
and love.
Finally, I would like to acknowledge PhD stipend and project funding from the
Collaborative Research Network initiative of the Australian Department of Industry.
Also the postgraduate top up scholarship from the National Centre of Excellence in
Desalination Australia, funded by the Australian Government through the National
Urban Water and Desalination Plan.

VIII
“Nothing in life is to be feared, it is only to be understood. Now is the time to
understand more, so that we may fear less.”
― Marie Curie

2
Abstract
Reverse osmosis (RO) for water desalination is a pressure driven technology that
utilizes thin-film composite (TFC) membranes as its core technological component. The
selectivity of commercial RO TFC membranes is provided by a ~100 nm thin semi-
dense and negatively charged poly(amide) (PA) layer, where performance is highly
influenced by electrostatic interactions between the liquid (water and solutes) and the
net surface charge of the membrane surface. Furthermore, the interfacial polymerization
manufacturing process leads to the formation of a rough surface, due to surface tensions
effects between the two non-miscible phases - carboxylate and aromatic amide. Over
the past four decades, the remarkable development of such membrane materials has
contributed to reducing RO energy consumption and increasing salt rejection to the
99.9% level. However, the chemistry and morphology of the PA layer continues to
promote unfavorable affinity with contaminants in the water – a phenomenon referred to
as fouling. ‘Foulants’, such as biological, inorganic and organic compounds, may
aggregate and accumulate on surface due to chemical affinity, electrostatic interactions
and physical adsorption in between the protusions of the rough material. Such
interactions across the surface of the membranes lead to reduced water transport and in
severe cases may cause membrane failure. Therefore, new routes to further refine the
properties of PA membranes are still required to develop more permeable membranes
with controlled surface charge.
Plasma and irradiation-induced grafting are controllable and rapidly developing
techniques that can uniformly induce the grafting/polymerization of selected monomers
and introduce surface specificity for dedicated applications. These routes require little
quantity of chemicals and therefore are environmentally friendly techniques. In
membrane technology, surface grafting via plasma and irradiation have been mostly
applied to micro and ultrafiltration membranes and to the best of our knowledge no
work has applied gamma-rays to modify TFC membranes. The nanoscale capillary
network across a composite membrane exhibits vulnerability to radiation and energy
absorption which may compromise the membrane’s essential flux and salt rejection.
Therefore, an understanding of the physico-chemical processes involved in such
techniques, as well the detailed characterization of the modified thin-film surface, are

3
crucial factors for the successful application and implementation of such novel
advanced environmentally friendly technologies.
In this project, the feasibility of both plasma and gamma-rays techniques to the
functionalization or modification of TFC membrane surfaces was studied in order to
tune surface properties such as charge, morphology and chemistry without
compromising permeation and selectivity properties. Also, this work aims at improving
the understanding of physico-chemical interactions of nascent bond dissociations and
grafting mechanisms involved during modification processes through characterization
techniques such as X-ray spectroscopy, streaming potential and Fourier transform
infrared spectroscopy (FTIR). Also advanced techniques such as atomic force
microscopy (AFM) and high spatial resolution synchrotron FTIR mapping were
employed to investigate resultant chemical distribution, topographic uniformity and the
thickness of the formed film.
In the plasma technique, two different routes were explored - the first used reactant
gases, such as argon, helium and water to chemically etch and modify the texture of the
membrane. The second involved polymerization of monomers such as 1-
vinyl(imidazole) (VIM) and maleic anhydride (MA) to increase the density of either
amines or carboxylic functional groups and therefore alter the surface charge and
morphology characteristics. Surface etching promoted by plasma treatment was shown
to be beneficial to enhance wettability, negative charges, and in the case of argon
plasma glows. The water permeation was found to be increased by up to 22% at low
power densities without compromising salt rejection (98%). The plasma polymerization
processes lead to the formation of uniform coatings which thicknesses were found to
increase with longer process duration. The increasing density of functional groups also
led to significant surface charge alterations. After plasma polymerization with VIM
monomer, negatively charged control membrane enhanced positive charges with
increasing amine groups on the surface. On the other hand, plasma polymerization with
MA significantly enhanced the density of negative charges with increasing density of
carboxylic groups. High density of amines on surface was demonstrated with the
attachment of silver nanoparticles where coordinated active sites were further tested
with a bacterial media. This experiment also provided a possibility to producing anti-
biofouling membrane material.

4
An irradiation-induced grafting technique, utilizing gamma-rays irradiation from a high
energy radiation source (Cobalt-60) was used to induce grafting of amine functional
groups using the VIM monomer. A systematic investigation of the degree of grafting
was accomplished by increasing the dosage and monomer concentration. This resulted
in a long-lasting positively charged surface, and shifted the isoelectric point of the
membranes, measured by streaming potential from close to zero for the control
membranes at pH 3, up to pH 7 for grafting with 1 v/v% of monomer concentration at 1
kGy irradiation dose. Furthermore, the irradiated membranes offered enhanced
permeation as high as 50% larger than the control membranes without significantly
compromising membrane salt rejection during desalination. Referred computational
chemistry analysis predicted bond dissociations energy from the bonds across the VIM
monomer and PA polymer in order to predict the generation of free radicals as well as
potential by-products produced upon irradiation. The impact on the surface charge on
Donnan exclusion mechanisms was also evaluated by comparing NaCl rejection with a
divalent salt such as CaCl2 rejection.
Both plasma and gamma-rays routes open the way for versatile and environmentally
friendly surface modification techniques which provide uniform, versatile and tuneable
functionalization pathways for post-treatment of commercial membrane products and
potentially favouring anti-fouling and pH selective permeation behaviours.

5
Erratum
This published thesis version contains corrections made to the originally examined
version. The original issue requiring the change and affected chapters are summarized
in this brief Erratum. The changes were not critical to the overall outcome of the thesis,
but were made to ensure the correct representation of the work as a published document.
Specifically, the maleic anhydride reagent used in the plasma polymerization technique
presented in Chapter 5 was incorrectly referred to as maleic acid. However, maleic
anhydride converts to maleic acid after samples are exposed to air and, potentially,
during the plasma polymerization process where the ring system of maleic anhydride
could also open up with an input of energy.
The corrections regarding this incorrectly cited chemical were made for this published
thesis version and more detail including the original text is available in Appendix 4.

6
Table of Contents
Abstract ........................................................................................................................... 2
Erratum ........................................................................................................................... 5
1. Introduction .............................................................................................................. 15
1.1 Challenges in the research ................................................................................ 17
1.2 Summary and research aims ............................................................................ 20
1.3 Summary of the chapters .................................................................................. 21
2. Literature review ...................................................................................................... 24
2.1 The Application of TFC membranes in RO technology ................................. 25
2.1.1 A background of TFC membranes in RO technology.......................... 25
2.1.2 Synthesis and structure of TFC membranes ......................................... 26
2.1.3.1 Surface morphology of the TFC membranes ......................... 30
2.1.3.2 Surface charge of TFC membranes ........................................ 31
2.2 Conventional wet chemistry techniques for surface modification and main
targets ........................................................................................................................ 32
2.2.1 Surface grafting ....................................................................................... 33

7
2.2.2 Surface coating ......................................................................................... 40
2.3 Direct energy techniques to modify TFC membranes .................................... 42
2.3.1 Plasma technology ................................................................................... 42
2.3.1.1 Plasma generators..................................................................... 43
2.3.1.3 Plasma mechanisms .................................................................. 47
2.3.1.4 Plasma polymerization ............................................................. 48
2.3.1.5 Plasma polymerization in membrane technology .................. 48
2.3.2 Gamma-ray irradiation technologies ..................................................... 52
2.3.2.1 Irradiation-induced grafting in membrane science ............... 53
2.4 Conclusions and research rationale ................................................................. 54
3. Experimental details ................................................................................................. 57
3.1 Materials and methods ...................................................................................... 57
3.2 Surface modification methods .......................................................................... 58
3.2.1 Membrane conditioning prior to plasma treatment and
polymerization .................................................................................................. 58
3.2.2 Plasma treatment ..................................................................................... 58
3.2.3 Plasma Polymerization ............................................................................ 59
3.2.4 Gamma-ray induced grafting ................................................................. 60
3.2.4.1 Irradiation facilities .................................................................. 60
3.2.4.2 Grafting and control series ...................................................... 61

8
3.2.4.3 Degree of grafting ..................................................................... 63
3.3 Surface characterization ................................................................................... 64
3.3.1 Scanning electron microscopy (SEM) and energy dispersive
spectroscopy (EDS) ........................................................................................... 65
3.3.2 Atomic force microscopy (AFM) ............................................................ 65
3.3.3 Attenuated total reflection-Fourier transform infrared spectroscopy
(ATR-FTIR) ...................................................................................................... 66
3.3.4 Streaming potential ................................................................................. 68
3.3.5 Contact angle ........................................................................................... 69
3.3.6 X-ray photoelectron spectroscopy (XPS) .............................................. 70
3.4 Desalination tests ................................................................................................ 71
3.5 Functional tests .................................................................................................. 71
3.5.1 Silver attachment onto amine rich TFC membranes ........................... 72
3.5.2 Bacterial adhesion assessment ................................................................ 72
4. Plasma gas treatment of poly(amide) thin-film composite membranes .............. 74
4.1 Membrane desalination performance controls .................................................... 75
4.2 Preliminary investigations using water and helium plasma .......................... 76
4.2.1 The impact of water and helium plasma treatments on the
performance of the membranes....................................................................... 77

9
4.2.2.1 Morphology characterization of the plasma modified
membranes ............................................................................................ 78
4.2.2.2 Chemical assessment of TFC membrane surfaces after water
and helium plasma treatments ............................................................ 83
4.2.3 Summary .................................................................................................. 91
4.3 Surface modification with argon plasma: investigation of plasma
mechanisms on TFC membranes ........................................................................... 93
4.3.1 The impact of argon plasma treatments on membrane performance 93
4.3.2 Characterization of surface properties after argon plasma treatment
............................................................................................................................ 97
4.3.2.1 Morphology assessment after argon plasma treatment ........ 97
4.3.2.2 Chemical assessment after argon plasma treatment ........... 101
4.3.2.3 Surface energy assessment and the role of surface charge on
wettability ............................................................................................ 104
4.3.2.4 Stability of water contact angle ............................................. 106
4.3.2.5 Analysis of the effect of etching on surface properties ........ 108
4.3.3 Summary of argon plasma exposure ................................................... 112
4.4 Analysis of the impact of different plasma treatments in this study ........... 113
4.5 Conclusions ....................................................................................................... 115
5. Plasma polymerization across poly(amide) thin-film composite membranes ... 117
5.1 The impact of AC argon plasma on pre-conditioned TFC membranes ..... 118

10
5.1.1 The impact of AC argon plasma on the performance of the TFC
membranes ...................................................................................................... 118
5.1.2 The impact of AC argon plasma on the surface morphology of the
TFC membranes ............................................................................................. 119
5.1.3 The impact of AC argon plasma on the surface chemistry of the TFC
membranes ...................................................................................................... 120
5.2 Plasma polymerization of VIM monomer using pre-conditioned TFC
membranes ............................................................................................................. 122
5.2.1 The impact of plasma polymerization on the performance of the TFC
membranes ...................................................................................................... 122
5.2.2 Characterization of the surface properties of the pre-conditioned
plasma polymerized membranes ................................................................... 124
5.2.2.1 Morphology assessment after plasma polymerization ........ 124
5.2.2.2 Chemical assessment after plasma polymerization ............. 127
5.2.3 Demonstration of amine rich active sites for attachment of silver
nanoparticles ................................................................................................... 131
5.3 Improving the performance of plasma polymerized TFC membranes ...... 134
5.3.1 Plasma polymerization of the VIM monomer onto TFC membranes
.......................................................................................................................... 134
5.3.1.1 Optimization of performance after VIM plasma
polymerization .................................................................................... 134
5.3.1.2 Morphology assessment after plasma polymerization with
VIM ...................................................................................................... 135

11
5.3.1.3 Chemical assessment after plasma polymerization with VIM
.............................................................................................................. 136
5.3.2 Plasma polymerization of the MA monomer onto TFC membranes 141
5.3.2.1 The impact of MA plasma polymerization on the
performance of the membranes......................................................... 141
5.3.2.2 Morphology assessment after plasma polymerization with
MA ....................................................................................................... 142
5.3.2.3 Chemical assessment after plasma polymerization with MA
.............................................................................................................. 143
5.4 Quantum chemical calculations of the relative C-H or C-N homolytic bond
dissociation energies (BDEs) across the VIM, MA and model PA molecules. . 146
5.5 Conclusions ....................................................................................................... 154
6. Gamma-ray irradiation induced grafting across thin-film composite membranes
...................................................................................................................................... 157
6.1 Performance of modified TFC membranes ................................................... 158
6.2 Characterization of surface properties of grafted layer ............................... 162
6.2.1 Morphology analysis of the grafted layer and PA surface integrity . 162
6.2.2 Chemical analysis of grafted layer and PA surface integrity ............ 165
6.2.3 Analysis of surface charge and impact on membrane performance . 170
6.3 Conclusions ....................................................................................................... 175
7. A comparative overview of plasma polymerization and gamma irradiation
techniques for TFC membranes surface modification ............................................ 177
7.1 Comparative effects on membrane performance ......................................... 178

12
7.2 Monomer deposition characteristics .............................................................. 183
7.2.1 The gamma-ray technique (GRI) ......................................................... 183
7.2.2 Plasma polymerization technique (PP) ................................................ 184
7.2.3 Comparison between the techniques.................................................... 185
8. References................................................................................................................ 188
9. Appendices .............................................................................................................. 219
Appendix 1 .............................................................................................................. 219
Appendix 2 .............................................................................................................. 223
Appendix 3 .............................................................................................................. 228
Appendix 4 .............................................................................................................. 236

13
List of Abbreviations
Alternate current AC
Atomic force microscopy AFM
Attenuated Total Reflection-
Fourier Transform Infrared
Spectroscopy
ATR-FTIR
Chemical vapour deposition CVD
Cellulose acetate CA
Deionized water DI
Direct current DC
Dissolved organic carbon DOC
Electric double layer EDL
Energy dispersive spectroscopy EDS
Focus Ion Beam FIB
Gamma-ray irradiation GRI
Infrared IR
Interfacial polymerization IP
Isoelectric point IEP
Maleic anhydride MA
Methanol MeOH
m-phenylenediamine MPD
Plasma polymerization PP
Poly(amide) PA
Poly(ester) PE
Poly (ethylene) glycol PEG

14
Poly(sulfone) Psf
Radio frequency RF
Reverse osmosis RO
Scanning electron micrographs SEM
Silver nanoparticles Ag NPs
Sodium metabisulphite SMBS
Thin-film composite TFC
Total dissolved solids TDS
Trimesoyl chloride TMC
Ultraviolet UV
1-vinyl(imidazole) VIM
X-ray photoelectron spectroscopy XPS

Chapter 1
15
1. Introduction
According to the United Nations demographers, current world population has reached
7.2 billion in mid-2013 and perspectives for 2050 to be achieved 9.6 billion people [1].
This global statistic illustrates a trend towards increasing water demand and foresees
irreversible impacts on traditional freshwater resources such as rivers, lakes and ground-
water. The United Nations General Assembly declared the period of 2005 to 2015 as the
International Decade for Action, “Water for Life”. Currently almost 4 billion people of
the global population enjoy potable piped drinking water. However, 748 million people
have no access to reliable water and from these, 173 million still rely on untreated
surface water [2]. The lack of access to safe drinking water and sanitation may cost to
countries about 7% of their annual gross domestic product. The development of new
technologies for safe, cost-effective and sustainable water production is a global
concern. Reverse osmosis (RO) technology is an alternative to produce drinking water
from more abundant water supplies that are too saline to drink such as seawater and
brackish water.
About 1,182 km3 of water from industrial and municipal users around the world was
withdrawn from the environment in 2011. Of this, only 17 km3 was produced by
desalination of seawater and brackish water [3]. These records are an indication that
traditional water resources remains dominant attributed to low-costs about $0.01/m3
compared to RO and thermal desalination with 0.47$/m3 and 0.57$/m
3 respectively.
Due to the relatively lower cost, RO has been the leading desalinated water technology
in the last 5 years with approximately 80% of the market in comparison to conventional
thermal technology such as multi-stage flash [4]. The largest water production rate by
RO seawater is up to 110 million m3 per year
in Ashkelon, Israel [5]. The commercial
demand for RO technology is due to technological improvements and less energy
consumption compared to thermal methods, which requires large quantities of fuel to
vaporize seawater. Since the 1970’s, advances in membrane materials, modules design,
feed pre-treatments and energy recovery strategies contributed to reduce the cost per
volume of water produced by 10-fold. In particular, the development of TFC membrane
materials significantly contributed to maximise desalination efficiency by improving

Chapter 1
16
process applicability via increased membrane mechanical and chemical stability [6].
Furthermore, RO TFC membranes are also applied in advanced wastewater reclamation
to produce water for indirect potable use [7]. In advanced wastewater reclamation
microfiltration (MF) or ultrafiltration (UF) treats the secondary wastewater effluent
prior to the RO process (i.e. pre-treatment) in order to remove suspended and colloidal
matter. However, a considerable amount of dissolved organic macromolecules remains
in water once such macromolecules are smaller than the pore size of MF and UF
membranes. These macromolecules also known as foulants, are composed by low to
high molecular weight compounds including proteins, polysaccharides, amino-sugars,
cell components, nucleic acids, humic and fulvic acids which have strong chemical and
physical affinity to the polymeric membrane surface [8-12].
In membrane technology, the accumulation of foulants from the feedwater on the
polymeric surface lead to progressive permeability loss (increased flow resistance) and
consequently increased energy consumption. If this fouling is not controlled with
cleaning, the process will be unsustainable [13]. Furthermore, interactions with
contaminants on membrane surface may affect the ability to reject dissolved solids
(salts), a feature which is dependent on the solution pH. The pH dictates the charge on
the functional groups of the membrane and of the molecules in solution where species
of ions are repelled and retained by electrostatic forces [14, 15]. The charge density,
polarity and isoelectric points (IEP) of the membrane plays significant role in the
component rejection due to electrostatic interactions. Thus, the control of surface charge
of the membranes is also a parameter to be considered on the choice for suitable
wastewater or management of wastewater conditions [16]. Therefore, the key goals in
RO technology are to reduce energy consumption which is affected by fouling and
increase solute rejection capabilities. Besides membrane surface charge, we will also
see that this depends on morphology.
The control of fouling and therefore energy consumption in RO technology is widely
studied field of research. Some researches address the issue by the adjustment of
operational process such as water pre-treatment [17-19], membrane cleaning [20, 21]
and operating conditions (e.g. pressure, temperature) [22-27]. Other approaches focus
on membrane material improvements in order to produce more permeable membranes.
The development of novel membrane materials mainly focus on the fabrication of anti-
fouling and flux enhanced membranes [28-31]; another route includes the fabrication of
Chapter 1
17
membranes followed by an in situ surface modification during the synthesis [32-34] and
also improvements of their microporous support layer separately [35-39]. Other
approaches investigate the development of post-treatments or surface modification of
commercial membranes in order to alter the surface properties such as charge and
roughness that can potentially reduce fouling across the surfaces [40-43]. The latter
approach is studied in this thesis. A primary motivation to use commercial membranes
is due to their high performance due to fabrication methods that manufacturers have
developed over decades. Therefore, the desired functionalisation though surface
modifications are achieved on high performance well stablished membranes. The main
challenge is to perform surface modification techniques which are able to alter surface
properties without compromising the performance integrity.
1.1 Challenges in the research
About 80% of the surface modifications applied in TFC membranes are performed
through conventional chemical routes. Figure 1.1a shows a search on 63 consulted
articles published from 1998 to 2016. Conventional routes have been investigated for
about 10 years with 35% of research focused on surface grafting, 24% in surface
coating and 21% in electrostatic depositions. On the other hand, alternative techniques
are on the cutting-edge of trends within the past 5 years of research. About 9% of
published articles explored plasma polymerization, followed by 6% with chemical
vapour deposition (CVD), 5% plasma treatment with reactant gases and no reports
related to gamma-rays induced grafting. Specifically for plasma polymerization, most of
the works have investigated plasma under atmospheric plasma rather than low pressure
plasma as presented in this study [44, 45]. From these publications, 36% cover
biofouling, 22% chlorine resistance, 21% organic fouling, 9% flux enhancement
followed by 11% distributed in other foulants such as humic acid, emulsions and
alginates (Figure 1.1b).

Chapter 1
18
Figure 1.1: Literature survey obtained from articles published via Science Direct on
TFC membrane surface modification research over the period of 1998 to 2016. A total
of 63 publications found.
Conventional techniques such as surface grafting, coating and electrostatic depositions
typically require a great amount of chemicals, multiple steps which can be
environmentally unfriendly [6, 46]. In grafting techniques, it is required continuous
monitoring of chemical initiators to induce covalent bonds in order to achieve high
surface coverage of functional materials on the membranes [47]. In surface coating the
adhesive interactions between polymer and monomer mostly depend on the choice of a
suitable monomer to react with chemical groups present on the material [48-51].
Furthermore, modified surfaces may not be homogeneous and the control of surface
charge with increasing density of the functionalities is a challenge. Also, the extra layers
onto PA may increase hydraulic resistance and either decrease flux or require higher
pressure to achieve a desired operational flux [52, 53]. Energy directed techniques such
as plasma and irradiation-induced grafting, on the other hand, are one-step, rapid and
efficient techniques. Such routes utilize plasma and gamma-rays radiation, as sources to
induce polymerization grafting and homogeneously alter the surface chemical properties
of polymeric materials [54-56].
Plasma-assisted techniques have been used for almost four decades across a range of
different industries including microelectronics, biomedicine, packaging and more
recently, membrane science [57-60]. Plasma technologies are versatile and
environmentally friendly techniques which offer a rapid and controlled functionalization
of thin-film materials, allowing for the simultaneous modification of surface energy and

Chapter 1
19
morphology [61]. A great advantage of low pressure plasma is the high control of
polymerization or functionalization thus providing a more uniform modification [59,
62]. Low pressure plasma is also applied in surface finishing vacuum depositions.
Physical chemical deposition (PVD) and chemical vapor deposition (CVD) are
emergent technologies in coatings industry. Some notable finishing companies such as
Kohler have adopted vacuum coating in order to improve their products [63].
In the plasma technique, two different routes can be explored - surface treatment with
reactant gas [64-66] and plasma polymerization with monomers [67]. In membrane
technology, plasma treatment has been intensively studied over the last two decades in
attempts to increase the hydrophilicity and reduce fouling in UF and MF membranes
[68]. Although plasma technologies are well established, the understanding of the
impact at the molecular level of plasma glows on materials chemistry and
microstructure is not widely understood [69]. The majority of the research on plasma
treatment of polymeric materials has been primarily focused on understanding surface
texturation mechanisms [66, 70, 71]. A challenge in applying gas plasma treatments and
plasma polymerization to TFC membranes is the difficulty to characterizing the
precisely incorporated functionalities on surface in both routes since the functionalities
of the modified surface can be unpredictably rearranged [67]. Also the impact of etching
on thin-films and stability of the modified surfaces via gas plasma treatments is a
challenge. Furthermore, the substrate has to be subjected to vacuum conditions during
the plasma process and substrates must be dry since such condition is a prerequisite in
vacuum depositions technologies. Usually membranes are washed as a pre-conditioning
step prior to surface modifications in order to remove preservative materials introduced
by the manufacturer. The process of drying and re-wetting RO membranes can cause
capillary stresses across the pores of the membrane material and ultimately impact on
liquid permeability [72-74].
Furthermore, surface modifications using gamma-rays do not however require the
substrate to be dried. This up-scalable technique can be operated at atmospheric
pressure and room temperature in bulk or confined environments, making of it a very
suitable tool for fine modifications of polymeric materials [56, 75]. For irradiation-
induced grafting the simultaneous method induces polymerization in one step with the
substrate immersed in monomer solution. The degree of grafting is controlled by the
monomer concentration, and irradiation dose. Furthermore, to the best of our

Chapter 1
20
knowledge, the surface modification of TFC membrane materials via gamma-rays has
not been investigated. Such technique however, has been applied for surface
modification of UF and MF membranes [76] thus demonstrating its potential as a TFC
membrane modification technique.
1.2 Summary and research aims
It may be seen that TFC membranes are well established materials for water
desalination and wastewater treatment. However, further modifications of these
materials, especially at the surface, are expected to lead to improved desalination
technologies resulting in less fouling or better fouling recovery, the equivalent (or
improved) salt rejecting capability and reduced flow resistance. Modifications involving
conventional chemical routes tend to be time consuming and generate chemical waste.
Furthermore, in terms of surface properties the control of surface charge and uniformity
of the modified surface is a great challenge. In this regard, the versatility and advantages
of both low pressure plasma and irradiation-induced grafting on TFC membranes has
been demonstrated in this thesis. Resultant modifications were critically characterized at
the micro, nano and molecular levels.
Using low pressure plasma and gamma-ray irradiation techniques, this work has aimed:
To tune surface properties including morphology, chemistry and charge and
improve or maintain membranes water flux and salt rejection in order to
demonstrate the feasibility of both of these energy directed techniques on the
ultrathin PA network layer;
To attempt to explain the mechanisms and film formation processes involved in
plasma and irradiation routes considering the inherent and undisclosed chemistry
of commercial TFC membrane;
To analyse the resultant physical aspects of the modified surfaces such as
uniformity, thickness and degree of grafting in order to correlate these with
membrane salt rejection and flux performance (for a given pressure); and
To provide insights into grafted or modified surfaces as candidates for potential
applications in desalination, or more generally in thin soft materials where
tailored surfaces dictate their application performance.

Chapter 1
21
1.3 Summary of the chapters
Chapter 2 is an in depth, critical, literature review of research into the specific chemical
and physical surface characteristics of TFC and the research that has been carried out to
date in relation to the different surface modification techniques that have been applied
for improving their performance.
Chapter 3 describes the experimental setups used in this research from the plasma and
gamma-ray irradiation processes to advance surface characterization techniques. The
characterization techniques are divided by morphology analysis and chemical analysis.
The morphology characterization techniques are scanning electron microscopy (SEM),
atomic force microscopy (AFM). Thus, the chemical techniques includes contact angle,
streaming potential, X-ray photoelectron spectroscopy (XPS), attenuated total
reflection-Fourier transform infrared spectroscopy (ATR-FTIR) including Synchrotron
mapping for thickness and uniformity analysis.
Chapter 4 shows results from the initial experiments explored plasma technique. A
systematic investigation of modification with reactant gases critically analysed the
impact of membrane surface properties with permeation performance. Also this Section
provides insights for membrane conditioning prior to plasma treatment as well as the
use of the same suitable carrier gas for subsequent plasma polymerization. This chapter
provides the understanding of the conditions for working with plasma gas on TFC
membranes.
The main characteristic of direct energy techniques is the uniform coverage
accomplished by the energy sources to initiate polymerization.
In Chapter 5, the benefit of low pressure plasma was demonstrated by the precise
control of the density of functional groups upon adjustments of the plasma conditions
and the pre-conditioning impact on membranes. Synchrotron FTIR analysis investigated
chemical distribution and estimated thickness of plasma polymerized coating. Refined
experiments targeted improved desalination performance using membranes without pre-
conditioning step. Plasma polymerization process utilized monomers such as 1-
vinyl(imidazole) (VIM) and maleic anhydride (MA), in separated experiments, in order
to demonstrate the feasibility of film formation onto PA surface. The range of probe
monomers used in this work demonstrated the versatility of film formation onto PA
surface with the effect of adding the desired surface charges promoted by the nature,

Chapter 1
22
density and bond dissociation energies (BDE) of the functional groups introduced
across the surface. These experiments were critically discussed in relation to
desalination tests and characterization of surface properties.
In Chapter 6 a higher energy source explored amine enrichment using VIM monomer
with gamma-rays at the Australian Nuclear Science and Technology Organization
(ANSTO). The impact of irradiation on the TFC membranes was investigated.
Increasing the monomer concentration and the irradiation total doses were performed
and correlated to the membrane performance and stability.
In Chapter 7 the significant challenges for implementation of direct energy techniques
and potential desalination applications of modified TFC membranes
A general conclusion is then proposed, highlighting the outcomes and drawbacks of this
work as well as recommendations for future endeavours.

23

Chapter 2
24
2. Literature review
In this study the aim is to explore the alternative routes to uniformly modify membrane
surfaces with controllable density of functionalities and surface charge without
declining the essential performance of the membranes. Plasma and gamma-rays are
versatile surface modification techniques which are relatively easy to control and do not
require large quantities of modification chemicals. This literature review studies the
thin-film composite (TFC) membranes for reverse osmosis (RO) application,
specifically expanding upon the limited surface property options by these direct energy
plasma and gamma-ray techniques. It aims to investigate targeted surface properties in
the field of surface modification, including the surface charge and morphology, while
maintaining water permeable and salt rejecting membranes. An introduction of plasma
and gamma-rays irradiation techniques including the specific chemistry and
mechanisms involved is discussed. There is also an emphasis on working with pre-
conditioning of the membranes prior to plasma treatment, the impact of reactant gases
(helium, water and argon) and the effect of different plasma systems.
The application of monomers for both plasma and gamma-ray polymerization processes
has also been explored to assess the beneficial features of polymerized films in regards
to membrane performance. The review will set the direction of the work to be
undertaken in this thesis.
Chapter 2
25
2.1 The Application of TFC membranes in RO technology
2.1.1 A background of TFC membranes in RO technology
The development of membrane materials was an essential part of the practical
implementation of RO technologies known today developed over two key time periods.
Beginning in the 1960’s through to the late 1980’s involved the search for a suitable
material in terms of chemical composition and membrane formation mechanism. Since
the 1980’s there has been a significant developments of fabrication conditions to
enhance functionality and durability [6].
The first RO membrane material was developed by Samuel Yuster and two of his
students: Sidney Loeb and Srinivasa Sourirajan in the 1960’s. These were based on
cellulose acetate (CA) materials. CA paved the way for RO application commercially,
as it exhibits high water flux, good salt rejection and has great chlorine tolerance.
Despite this, CA membranes do not fully meet the industrial requirements due to
compaction problems and gradual flux decline. Other limitations include restricted
operational conditions in terms of low range of pH, low resistance to organic solvents
and vulnerability to biological attack [77, 78]. In the 1980’s, Cadotte et.al [78]
presented a major breakthrough in the advancement of membrane desalination materials
developing the TFC membrane. This membrane was found to have a key advantage
whereby a thin poly(amide) (PA) layer is formed on a porous support and the dense PA
thin-film active layer can be separately optimized in order to achieve the best
performance and membrane stability [79]. Further, TFC membranes are stable and may
operate under diverse range of pH (pH 3 to 11) [78]. Also the TFC membranes exhibit
superior hydrophilicity compared to CA essential for high water permeation.
Furthermore, TFC membranes have better chemical stability when exposed to organic
solvents, which can be interesting for surface modification proposes [78]. In terms of
the global market, the PA membranes dominate RO/Nanofiltration (NF) market sales
with a 91% share [80]. Asymmetric CA hollow fibre membranes hold a distant second
spot. However, state of the art the chemistry and morphology of TFC membranes of the
Chapter 2
26
PA layer still can facilitate the affinity with contaminants known as fouling. Therefore,
new routes to further refine their properties are still needed.
2.1.2 Synthesis and structure of TFC membranes
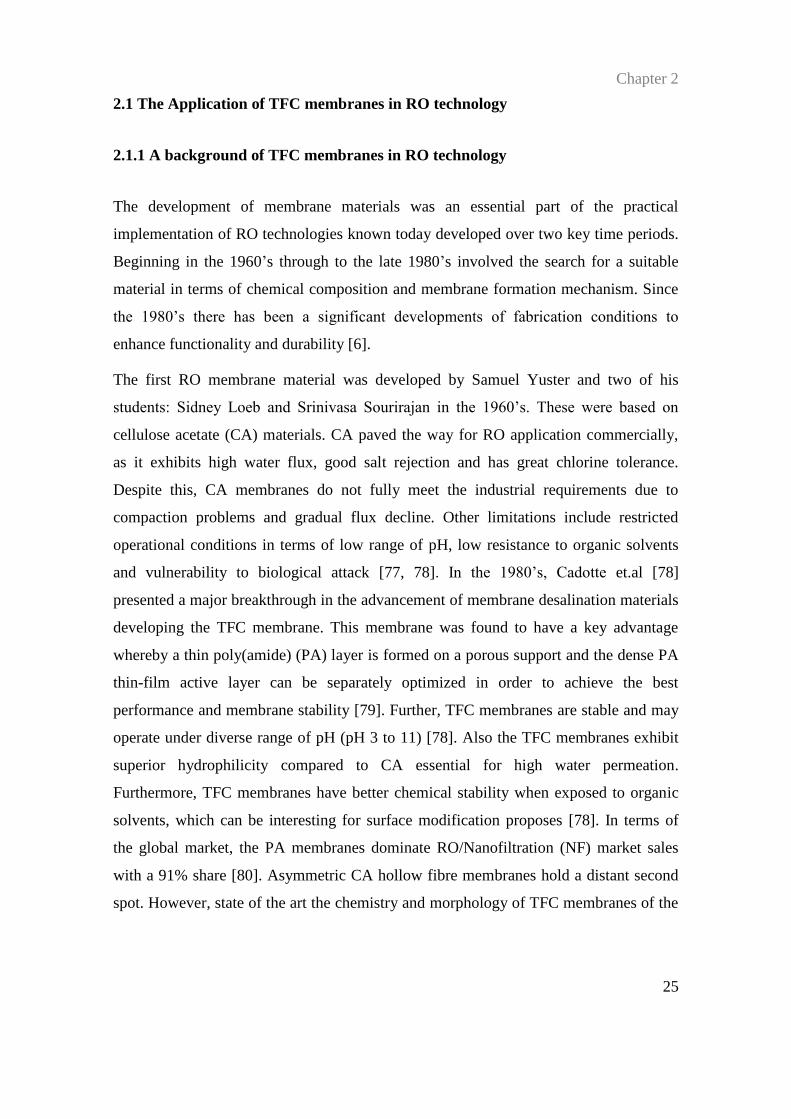
As opposed to CA, the TFC RO membrane as shown in Figure 2.1 is a multilayer
material composed of an extremely thin active (~100-200 nm) semi-dense layer of PA.
This layer is deposited on top of a thick porous support substrate (e.g. poly(sulfone)
(Psf)) coated on to a nonwoven (e.g. poly(ester) (PES)) fabric structure (Figure 2.1)
[78]. The PA layer acts as a selective layer, while the Psf ultrafiltration (UF) layer
simultaneously provides an anchoring point for the PA layer and a diffusion pathway
for water molecules. The PES on the other hand, only provides flexibility and
mechanical robustness. The chemistry of the active PA layer governs water transport
and ion rejection via the membrane where permeated water is typically up to 99.5%
rejected of dissolved salts and organic molecules. The high salt retention capability of
PA TFC membranes is a combination of the material narrow free-volume distribution
from 0.259 to 0.289 nm, corresponding to the spaces between macromolecular chains,
and of surface electrostatic repulsions at the liquid/membrane interface [81, 82].
Figure 2.1: Cross-section of a TFC membrane [83].

Chapter 2
27
The active PA layer is formed prepared by interfacial polymerization (IP) of two
monomers at the interface between two non-miscible solvents [84, 85]. The resultant
PA chemical composition is obtained from an IP manufacturing process whereby two
mutually reactive monomers, typically diamine and acyl chloride based, are prepared in
separate immiscible phases and are co-polymerized at the solvent interface. As shown in
Figure 2.2 one monomer contributes to the high degree of crosslinking due to the
presence of an acyl group within the molecule, which may undergo hydrolysis with
unreacted amine groups within the second monomer. Diffusion of the diamine monomer
across the film during IP towards the organic phase produces cross-linked protrusions
which gives rise to a rough surface morphology [84]. In this regard, one side may
present unreacted amine groups from acid chloride leaving hydrolysed carboxylic
groups and the other side more amines as shown in Figure 2.2.
Figure 2.2: Chemical composition of TFC membranes. Modified from [86].
The final effect causes asymmetry with cation and anion-exchange regions in the
material, resulting in a semi-hydrophilic and negatively charged material facing the feed
solution. Thus the asymmetry of the cation and anion-exchange regions can also cause
salt rejection and flux variations [87]. The IP process leads to the formation of a rough
surface, with protuberances in the order of 100 to 200 nm, due to surface tension effects
between the two non-miscible phases. The resultant morphology facilitates water

Chapter 2
28
transport across the membrane by offering high actual surface area to the planar area
[88]. Although such rough and negatively charged chemistries may facilitate water flux
and repel negatively charged species, their presence may tend to physically adsorb
contaminants and electrostatically attract positively charged species in solution such as,
proteins and cationic surfactants [15, 89]. This can cause undesirable fouling effects, so
more surface chemistry options are desired for PA membranes.
2.1.3 The surface properties of TFC membranes
The surface properties of the RO TFC membranes are of fundamental importance in
order to produce high water quality. The physico-chemical properties of the PA layer
essentially determine the performance (flux and rejection) of TFC membranes. Several
studies have investigated the influence of the PA active layer and the Psf support on the
performance of the RO membranes. It is believed that the membrane selectivity and flux
are mainly controlled by the PA active layer while the porous Psf support assuming a
minor influence [90, 91]. For instance, zeta potential (surface charge) has been
correlated to the transport of some trace organic solutes through RO and NF membranes
and also flux and fouling behavior [92, 93]. Other properties, such as the chemical
composition and morphology of the PA layer, are also important to RO membrane
performance [94]. Consequently, the understanding of physico-chemical properties of
the PA layer is critical to control membrane fouling and specifically to control surface
modification processes.
When modifying the surface chemistry of TFC membranes, the combination of a more
permeable and defect-free modified surface is important to be considered. Some
techniques such as grafting, coating and electrostatic depositions have shown to be
promising to control fouling. However, within the surface modifications field, the
mechanisms behind additional functional groups and/or additional coating layers on the
PA surface and resultant performance are not adequately understood with some
conflicting results reported in the literature. These conflicts are mainly related to the
difficulties in the characterization of the modified PA layer since only the outer layers
of the PA surface chemistry and morphology is considered. For these reason

Chapter 2
29
investigations of surface modifications involving microfiltration (MF) and UF
membranes are by far in more developed stages [95].
Furthermore, bulk PA properties and the extent of the modification within the PA layers
has never been clarified from the results achieved with different techniques. Thus, only
few studies such as in surface coating techniques may superficially touch the subject
[34, 96]. Outside the surface modification field there are also ongoing debates to clarify
salt and water transport such as solution diffusion mechanisms with the same challenge
based on the inherent structure of the nanoscale PA material. For instance synthesis of a
thicker PA layer above 500 nm (Figure 2.3) enabled to assess bulk polymer properties
including surface charge of the PA side facing support layer (e.g. Psf) in order to
develop good models of salt and water transport [84]. For instance, most of the models
for salt transport assume that the membrane charge is uniform throughout the bulk of
the active layer [97]. However, this assumption may not be validated since only the
charge on the top surface can be measured [84].
Figure 2.3: SEM cross-section of a fabricated thick PA layer ( >500 nm). Modified
from [84].

Chapter 2
30
2.1.3.1 Surface morphology of the TFC membranes
As mentioned above, the surface morphology of TFC membranes plays a significant
role in terms of water flux and rejection of uncharged contaminants [91, 94, 98]. The
rough morphology which yields high surface area has inspired researchers into
optimising surface morphology. A study on the skin layers of PA TFC membranes
reported an approximate linear relationship between surface roughness and water flux
with tests conducted at 15 bar and 1,500 ppm NaCl solution [91]. In this study, various
membranes were synthesized with different degrees of average roughness (from ~ 20
nm to 100 nm) measured by AFM (atomic force microscopy) analysis. The linear
relationship was attributed to the high surface area of the irregular skin layer. On the
other hand, a similar investigation using different commercial RO membranes did not
find correlations between roughness and flux once membranes with similar roughness
values exhibited different flux and vice versa [88]. However, this investigation
concluded that RO membrane surfaces are not homogeneous and AFM measurements
resulted in up to 33% variation in surface roughness. Also, AFM conducted in water
showed roughness increased by 35% after 2 h of soaking in water. Therefore, the
surface morphology of TFC RO membranes is subject to variations depending on the
manufacturer and also exposure of the membranes to different environments.
Furthermore, the influence of PA film thickness in liquid transport has also been
studied. An investigation of membrane synthesis showed an outstanding permeance
with organic solvent for membranes with thickness is below 100 nm [99]. Also an
investigation of the nano-voids (Figure 2.4) of commercial TFC membranes concluded
that the presence of the voids and free volume increases the effective water transport of
the active layers compared with an active layer without any voids [100].

Chapter 2
31
Figure 2.4: TEM image of the nano-voids (~20-60 nm) which size and distribution can
influence on the water transport across the PA structure [100].
While the measurement of roughness under exposure to water is a more challenging
setup, clearly roughness measurements are a critical aspect of understanding functional
properties of modified TFC membranes providing potential application and should be
included as part of investigations in this thesis. However, not only that but the chemical
interactions with the membrane surface must also be assessed in this work.
2.1.3.2 Surface charge of TFC membranes
The high salt retention capability of PA TFC membranes is a combination of the
material narrow free-volume distribution, corresponding to the spaces between
macromolecular chains, and of surface electrostatic repulsions at the liquid/membrane
interface [81, 82]. Electrostatic interactions are directly related to charge effects from
the influence of polar surface groups present on the membrane material leading to a
Donnan exclusion layer [101]. This pH dependant layer acts as a selective ionic barrier
allowing for rejection based on the charge, valence and size of ions, repelled from the
surface of the membrane by electrostatic interactions. Most studies on electrostatic
interactions have reported an increase in repulsion between the negatively charged

Chapter 2
32
membrane and the negatively charged organic solute [93]. Such negatively charged
chemistries may however favour adsorption of positively charged proteins, cationic
surfactants, solvent molecules or ions due to preferential electrostatic interactions,
which may physisorb onto the surface. These adsorption mechanisms, typically referred
to as fouling or scaling depending on the nature of the contaminants, would lead to
permeation decline and to pH dependent salt rejection capabilities [14, 15].
In surface modification most of the works have focused to functionalize the surfaces
and induce negative charges. However, in this area little research has focused on the
adjustment of the RO membrane surface charge to improve its anti-fouling. Also no
commercial positively charged aromatic PA RO membrane is available which could
enlarge RO membranes application. Positively charged PA membranes are currently
most relevant to NF membranes such as mining [16], pharmaceutical [102], agriculture
[103], textile effluents [104] where water must be recovered from highly concentrated
and charged contaminants streams [16, 105]. Therefore, NF membranes is known as a
preferable wastewater treatment in specific industries (e.g. mining) over TFC RO
membranes once NF membranes provides higher flux at lower pressure with operational
costs 30% lower than RO membranes [16, 106].
In this thesis we propose possibilities for rapid surface modification processes with
plasma and gamma-rays in order to alter the surface charge in two opposite route
directions accordingly to the nature of the functional groups used: amines (1-vinyl
(imidazole) -VIM) and carboxylic groups (maleic anhydride -MA). More details are
given in the Section 2.3.
2.2 Conventional wet chemistry techniques for surface modification and main
targets
The majority of surface modifications techniques applied in TFC membranes are
surface grafting, surface coating and electrostatic depositions. These chemical
techniques are mainly targeted at improving water flux especially when exposed to
water borne fouling material. This review will focus on the surface grafting and coating
techniques (summarized in Table 2.1) since these routes also react grafting and

Chapter 2
33
polymerization of monomers to functionalise the surface. The gas plasma treatment is a
unique surface modification which only uses small quantities of gases or water as
compared to chemical conditioning techniques, and therefore the most important effects
to TFC surface properties will be assessed.
2.2.1 Surface grafting
Surface grafting and polymerization is achieved through an activation of the treated
surface in order to generate and immobilize initiators (free-radicals) to initiate the
reaction [47]. The chemical initiators therefore propagate the polymerization reaction
leading to a formation of a highly cross-linked chain network. The density of
crosslinking changes the physical and chemical properties of the materials and is
harnessed to increase thermal stability, resistance to solvents and enhance mechanical
strength [47]. Also, crosslinking may change the local molecular packing and alter the
free-volume [107]. As free-volume is one of important features to the permeation of
water in TFC membranes, clearly any modification technique that promotes
crosslinking should be assessed against water permeation studies to ensure that the
essential water flux element of the membranes is not lost.
Across the surface of TFC membranes, redox reactions and UV are utilised to generate
free-radicals and chain propagation [108]. A redox system for surface modification of
TFC membranes was achieved by grafting vinyl hydrophilic groups [40, 52, 108-112].
Chemical initiators were composed of potassium persulfate and potassium
metabisulphite and used to cleave the hydrogen atom from the polymeric substrate,
which in turn produced free-radicals across the surface [6]. Grafting with UV - initiation
step is produced by a photochemical reaction in the presence of photo initiators where
competitive mechanisms of crosslinking and chain scissions are controlled by the UV
wavelength [113].
Various hydrophilic monomers including acrylic acid (AA), methacrylic acid (MA),
poly(ethylene)glycol methacrylate (PEGMA), 3-sulfopropyl methacrylate (SPM), vinyl
sulfonic acid (VSA) and 2-acrylamido-2-methylpropane-sulfonic acid (AMPS) were
used for surface modification of PA layers [40, 114]. For instance, grafting of AA

Chapter 2
34
covalently bonded to Poly(N-isopropylacrylamide) backbone, showed reduced contact
angle with increasing grafting process duration from ~52o (control) to 39
o after 120 min
of grafting duration [115]. The negative zeta potentials at pH 7 were increased from -38
(control) to -50 mV after 120 min of grafting duration which was attributed to the
increased grafting yield of 1%. The surface roughness tended to be increased with
increasing duration of the grafting process. The water flux was declined by 25% and
rejection slightly increased to from 97.5 to 99%. These results in performance suggest
that increasing the grafting yield onto PA would lead to more flux decline. Other work
has utilized similar redox routes for grafting amino methacrylate based monomers
across the surface of the membranes [116]. The whole grafting process was completed
after 48 h and required a further step consisting of a surface quaternization reaction with
3-bromopropionic acid (3-BPA) to obtain zwitterionic carboxybetaine methacrylate
(CBMA) polymer chains on the membrane surface. At pH 7 the surface charge was
altered from a negative value of -40 mV to a maximum positive value of + 22.5 mV.
Interestingly, the water contact angle and roughness values were not significantly
altered. The water flux was increased by 22% with salt rejection slightly reduced from
98 to 97%. The permeation tests with lysozyme and negatively charged bovine serum
albumin (BSA) as model foulants showed flux recovery around 92% and 95%
respectively, compared to 74% and 70% observed for the control membrane after 5 h of
fouling and cleaning with deionized water for 30 min. Another study investigated the
impact of grafting yield to modified TFC membranes with grafting of a variety of
methacrylate based hydrophilic monomers [111]. The polymerization was carried out
with initiators and cross-linker agent. The kinetic of homopolymerization was
controlled by measuring the solutions turbidity. The increase of grafting yield and
subsequent homopolymerization led to decreased water flux by 40%. However, the salt
rejection was slightly declined around 97-96%. In terms of membrane morphology,
roughness rapidly increased from 80 (control) to 100-110 nm at low and medium
grafting yield with little variations at high grafting yield.
As shown most of the surface modification works have focused on functionalization of
the surfaces to induce negative charges. However, recent study investigated surface
grafting of amine based monomers on commercial RO membranes. In this study the

Chapter 2
35
grafting was performed using different poly(ethylenimine) (PEI) monomer at different
molecular weight (MW) from 600 to 70,000 [102]. After the grafting the zeta-potential
curve shifted toward positive charge, giving rise to an increasing isoelectric point at pH
8 achieved with grafting of high molecular weight PEI. The benefits of positively
charged surfaces were demonstrated and shown to lead to reduced protein deposition at
pH 7, compared to reference materials therefore opening new avenues for the design of
fouling resistant materials. However, significant enhancement of the positive charges
was only achieved when using 10,000 and 70,000 MW PEI which resulted in flux
declined by ~20% while salt rejection was maintained at 98%.
Therefore modified TFC membrane surfaces therefore play an important role in
improving fouling tolerance, which is an important feature for widening their market
applicability. Grafting technique was shown to lead to an improved flux during organic
fouling tests carried out under operating conditions, due to repulsive interfacial
interactions by grafted functionalities [117]. However, the efficiency of the grafting
route mostly depends on the choice of a suitable monomer to react with chemical
groups present on the substrate [48]. That is why it will always be important to assess
the critical flux and salt rejection properties, and only consider most optimal
modifications that have minimally impacted, or not impacted, these important
parameters. It may be possible that the modifications may improve flux and salt
rejection, which would be both a valuable practical outcome and interesting from a
scientific perspective, should be further investigated.
Chapter 2
36
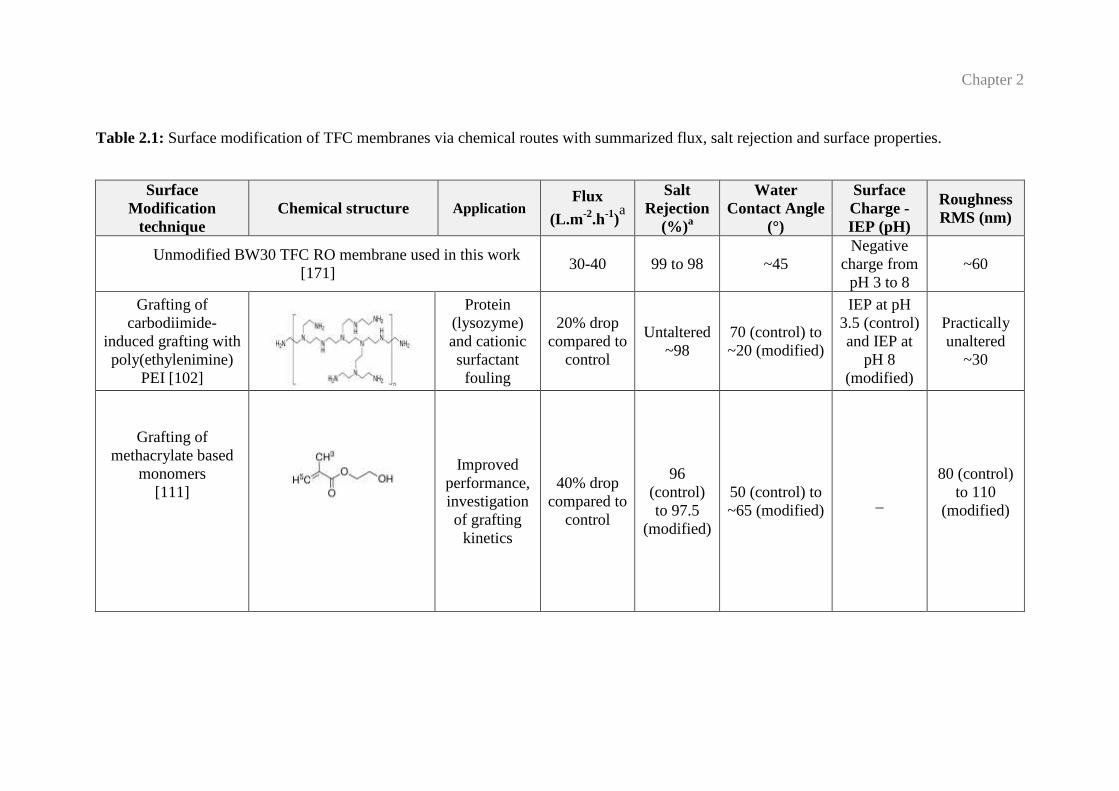
Table 2.1: Surface modification of TFC membranes via chemical routes with summarized flux, salt rejection and surface properties.
Surface
Modification
technique
Chemical structure Application Flux
(L.m-2
.h-1
)a
Salt
Rejection
(%)a
Water
Contact Angle
(°)
Surface
Charge -
IEP (pH)
Roughness
RMS (nm)
Unmodified BW30 TFC RO membrane used in this work
[171] 30-40 99 to 98 ~45
Negative
charge from
pH 3 to 8
~60
Grafting of
carbodiimide-
induced grafting with
poly(ethylenimine)
PEI [102]
Protein
(lysozyme)
and cationic
surfactant
fouling
20% drop
compared to
control
Untaltered
~98
70 (control) to
~20 (modified)
IEP at pH
3.5 (control)
and IEP at
pH 8
(modified)
Practically
unaltered
~30
Grafting of
methacrylate based
monomers
[111]
Improved
performance,
investigation
of grafting
kinetics
40% drop
compared to
control
96
(control)
to 97.5
(modified)
50 (control) to
~65 (modified) _
80 (control)
to 110
(modified)

Chapter 2
37
Grafting of N-
isopropyl acrylamide
(NIPAM) followed
by acrylic acid (AA)
[115]
Protein and
chlorine
resistance
NIPAM:
~0.5%
increase
compared to
control and
NIPAM-
AA: up to
25% drop
compared to
control c
NIPAM:
98
(control)
to 97
(modified
and
NIPAM-
AA: 97
(control)
to 99
(modified)
NIPAM: 60
(control) to ~
50 (modified)
and NIPAM-
AA: 52
(control) to 39
(modified)
NIPAM and
NIPAM-
AA:
Negative
charge from
pH 3 to 8
for both
control and
modified
NIPAM-
AA: From
102
(control) to
109
(modified)
Grafting of N,N′-
dimethylaminoethyl
methacrylater
zwitterionic polymer
[116]
Biofouling
22%
increase
compared to
control
~98
(control)
to 98- 97
(modified)
38 (control) to
~ 42
(modified)
Negative
charge from
pH 3 to 8
(control)
and IEP at
pH 7
(modified)
Practically
unaltered
~61
Grafting of
poly(ethylene glycol)
(PEG) diglycidyl
ether [180]
Surfactants
and
emulsions
fouling
15-30%
drop
compared to
control
Untaltered
~99 _
Negative
charge from
pH 3 to 8
55 (control)
to 77
(modified)

Chapter 2
38
Coating of positively
charged amino
zwitterionic
polymers [123]
Protein
fouling
Practically
unaltered
compared to
control
~98
(control)
to 98- 97
(modified)
55 (control) to
15 (modified)
Practically
unaltered
with IPE at
3.5 for both
control and
modified
-
Coating of PVA
[96]
Protein
fouling
5-75% drop
compared to
control
Untaltered
~99
48 (control) to
30 (modified)
Negative
charge from
pH 3 to 8
(control)
and IEP at 4
and
5(modified)
86 (control)
to 46
(modified)
Coating of
polyether–polyamide
PEBAX [34]
Oil/surfactant
/water
emulsion
fouling
29-80%
drop
compared to
control b
~97
(control)
to 97 -99
(modified)a
~ 60 for
control and
modified
_
129
(control) to
99
(modified)
Coating of PEG
terminated
poly(amido amine)
dendrimers [49]
Protein and
biofouling Unaltered
99
(control)
to 98
(modified)
60 (control) to
18 (modified) _ _

Chapter 2
39
Coating of sericin
polymer [50]
Protein
fouling
22% drop
compared to
control c
97
(control)
to 98
(modified)
68 (control) to
~41 (modified)
Negative
from pH 3
to 8
(control)
and IPE at
pH 4
(modified)
87 (control)
to 52
(modified)
Coating of N-
isopropylacrylamide-
co-acrylic acid
copolymers [51]
Protein
fouling
10 to17%
drop
compared to
control c
Lowered
by 22-35%
~73 (control)
to ~54-45
(modified)
Unaltered
97 (control)
to 89-111
(modified)
PVA treated with
poly(hexamethylene
guanidine)
hydrochloride
(PHMG) polymer
[122]
Biofouling
45 to 78 %
drop
compared to
control
97
(control)
to 92
(modified)
~53 (control)
to ~15
(modified)
-
68 (control)
to 42
(modified)
a Flux was determined using 1500-2000 mg/L, NaCl solution 15 bar; temperature ~25 °C, pH ~6.
b Flux was determined using distilled water; 11.3 bar ; temperature ~21 °C pH ~6.
c Flux was determined using 500 mg/L NaCl solution; 5 bar; temperature ~25 °C, pH ~6

Chapter 2
40
2.2.2 Surface coating
Surface coatings are a route to explore covalent immobilization of large macro-
molecules containing a number of specific functionalities [47, 118]. Surface coatings
may act as protective layers to reduce or eliminate the adsorption and deposition of
foulants onto the surface of membranes. Typically, surface coatings involve two steps,
including: i) immersion of the PA active surface layer in a coating/polymer solution,
and ii) evaporation of residual solvent to form the coating layer. One important example
was the launching of Hydranautics LFC series in 1996, and the introduction of the
LFC3-LD in 2005 both targeting applications in wastewater treatment/reclamation
[119]. These membranes are designed to minimise the adsorption of organic foulants.
Furthermore, within the conventional chemical methods surface coatings appears to
have more control of the modification processes and functionalities on the surface since
the synthesised coating polymers are characterized separately. Most of the works in
surface coating have investigated hydrophilic coatings such as poly(vinyl)alcohol
(PVA) [96, 120-122]. Nevertheless, these investigations are in more advanced stages in
UF and pervaporation (PV) since these membranes are less affected by the high
densities of coating than RO membranes, caused by the casting of macromolecular
polymeric chains. For instance, a systematic investigation of the coating processes was
performed recently on RO membranes [96]. In this work PVA was casted under
controlled curing conditions including relative humidity and temperature. Also the
swelling ratio tests, gel content tests were performed on the PVA membranes in order to
assess degrees of crosslinking. The practical crosslinking degree was calculated based
on the ratio of peak heights such as O-H and C-H (2941 cm-1
) in the FTIR analysis
which was correlated to the molecular weight of the PVA units and crosslinking agent.
The coated membrane showed reduced contact angle and roughness with increasing
coating solution concentration from 48o (control) to ~30
o and from 67.6 (control) to 42
nm respectively. The water flux was shown to be varied and declined by 5 to 75% with
increasing coating solution while the salt rejection was slightly declined from 99.5 to
~98.5%. The surface charge tended to be neutral with increasing coating solution and
the maximum negative charge reached only ~-24 mV at pH 7 and IEP found around pH

Chapter 2
41
5. After two filtration and rinsing cycles, coated membranes exhibited water flux
recoveries of ~83% which was significantly higher than that of 72% for the control RO
membranes. The efficiency of the coating membranes during fouling tests was attributed
to higher degree of coating coverage but no conclusions around the membrane
chemistry. Similarly, in another study, PVA but modified with antimicrobial cationic
poly(hexamethylene guanidine) hydrochloride (PHMG) polymer was coated onto TFC
membranes [122]. The water flux was also shown to be severely declined (by 45 to
78%) and salt rejection strongly compromised from 97% (control) to 92% modified
membranes. However, the coated surfaces led to physiochemical anti-adhesion surface
properties with significant reduced (~50%) number of E.coli cells attached on modified
membranes. Also, high densities of coating layers severely impacted water permeation
[34]. The coating of polyether–polyamide (PEBAX® 1657) solution onto commercial
TFC RO membranes led to dramatic flux decline by 29 to 80% however, salt rejection
was slightly increased from 97 to 99%. The flux decline was attributed to the density of
the polyether-polyamide block copolymer in which thickness of the PEBAX layer
estimated from SEM micrographs was approximately 0.3 μm. On the other hand, water
flux and salt rejection was minimally impacted after surface coating of amino acid 3-
(3,4-dihydroxyphenyl)-l-alanine (l-DOPA) onto commercial TFC RO membranes [123].
The surface morphology properties were not fully discussed but roughness was
potentially slightly altered, since most of the surface coatings tend to smoothen and
reduce surface area to volume (Table 2.1). On the other hand, the hydrophilicity was
dramatically enhanced with water contact angle reduced by 70% which potentially
contributed to higher recovery ratios during protein fouling tests compared to the
control membrane. Similarly, another investigation using amino based polymer for
surface coating of commercial TFC membranes showed to minimally affect flux and
salt rejection [49]. The coating of amine-functional polyamidoamine (PAMAM)
dendrimers and PAMAM–polyethylene glycol (PAMAM–PEG) potentially delivered
thin coating layers due to the molecular structural arrangement of the three-dimensional
dendrimers. In terms of hydrophilicity, water contact angle was significantly reduced by
70% and roughness was slightly smoothed according to SEM micrographs analysis.

Chapter 2
42
The decades of effort already made by commercial membrane suppliers to improve
resilience in water treatment applications is therefore a critical starting point to further
improvements. That is why this work will focus on modification of commercial
membranes where any improvements/changes to their features will more likely be
forward step in building on the state of the art.
2.3 Direct energy techniques to modify TFC membranes
Direct energy techniques, i.e. plasma and gamma-rays irradiation, can be used as
sources of energy to directly initiate reactions across the treated substrate rapidly
modifying the surface. Plasma and gamma-ray irradiation generate free-radicals and
excited species that propagate bond scissions and polymerization processes without
monitoring of chemical initiators. Plasma and radiation polymerization are comparable
at the level of the empirical polymer formation process. In polymerization via plasma,
the collisions of excited species initiates propagation of polymer chains in different
phases (vapour and solid), while in radiation polymerization the monomer propagation
occurs in the same phase i.e. liquid [124]. In this review we covered the surface
modifications via plasma technology including gas plasma, plasma polymerization and
polymerization /grafting processes via gamma-rays irradiation.
2.3.1 Plasma technology
The term plasma can be described as the partially-ionized gas produced when a neutral
gas is heated until interatomic collisions gain high energy states enough to detach
electrons from atoms [125]. The resultant plasma environment is composed of ions,
electrons, UV emissions, neutral atoms and is also referred as glow discharge. Plasma
was first described as the fourth state of matter by Crookes in 1879 in his studies of
electrified gases in vacuum tubes. However, it was not universally accepted until 1928
when the term plasma was finally introduced by Irving Langmuir [126]. In the
laboratory, plasma can be generated by flames, lasers, controlled nuclear reactions and
shocks. Most experimental work, especially in the field of plasma treatment with non-
polymerizable gases or in polymerization processes, is carried out using an electrical

Chapter 2
43
discharge [127]. There are many industrial applications for plasma including: durable
coatings in precise optic materials and consumer eyewear, reproducible adhesion of
metals coatings in semiconductors, surface modification and texturing to amplify
surface work functions of sensors and displays. In the medical field, plasma is used to
produce corrosion resistant organic coatings which exhibit designable biological activity
[128].
2.3.1.1 Plasma generators
Plasma generated by an electric field is known as low temperature or cold plasma and
occurs where there is a flow of discharges across the electrodes such as direct current
(DC), alternate current (AC) and radio frequency (RF). In DC discharge, electrons are
generated by positive ion bombardment from the cathode. The intense acceleration of
electrons away from the cathode leads to an energy gain and promotes collisions
ionizing gas molecules or atoms [61]. In AC discharge, the frequency plays a key role
on the collision mechanisms. The mechanisms of low frequency plasmas, such as 50-
Hz, are similar to the DC method but with alternating electrons generated by changes in
the polarity of the electrodes. AC systems at high frequencies (>500-Hz) lead to short
alternating half-cycles causing low mobility of positive ions. This effect reduces the loss
of charged particles across the system and forces the electrons and ions to collide within
the body of the plasma. In RF discharge (11.56 MHz), the plasma is initiated and
maintained with external electrodes and the glow therefore has no direct contact with
the electrodes. Electron - electron collisions are generated by waves which are
continuous or pulsed. The pulsed waves are less likely to damage the treated substrate
which suits the synthesis or modification of thin-films as investigated in this work
[129]. The RF system is particularly well suited for etching and surface cleaning of thin
material structures using only gas or polymerization of monomers due to excellent
uniformity of the resulting treatment without the presence of hot arcs, which can burn
matter into holes [130].

Chapter 2
44
2.3.1.2 Gas plasma treatments in membrane technology
Plasma technologies offer advanced platforms for a rapid functionalization of thin-film
materials, allowing for the simultaneous tuning of surface energy and morphology [61].
Plasma treatment routes are versatile and environmentally friendly techniques which
only utilize gas as a reactant to rapidly and uniformly modify surfaces [131]. Such
techniques have been successfully used for almost four decades to treat bulk polymers
and have been applied across a range of industries, including microelectronics,
biomedicine, packaging and, more recently, membrane science [57-60].
To date, the potential impact of plasma glows for the durable modification of TFC
membranes has not been extensively studied [79, 132]. The nanoscale capillary
networks, known as free-volume, is composed by dense porosity across the active layer
of TFC membranes with ultra-thin thickness of the coverage around 100-200 nm. Such
configuration makes TFC membranes more vulnerable to surface reactions than MF or
UF membranes which have much thicker selective layers and are porous. For this
reason plasma treatments have been extensively applied across a range of macro-porous
membrane materials used for MF or UF. On the other hand, plasma treatment was
performed on different commercial TFC NF membranes with ammonia as reactant gas
in order to increase hydrophilicity and reduce protein and humic acid fouling [133]. In
this study the treated surface showed a tendency to become rougher (only analyzed by
SEM) and water contact angle was decreased by 35.7 to 78% depending on the brand of
the commercial membranes. Also in this study, the effect of ammonia plasma was
shown to be more pronounced on rough and hydrophobic membranes than on smooth
hydrophilic. Therefore, the altered surface properties may also depend on the nature of
the treated surface.
In other studies where plasma treatment of UF and MF membranes has been applied
they have shown improved performance and anti-fouling properties. A range of reactant
gases have been used including inert (He, Ar), oxidative (CO2, H2O) and reductive
gases (CF3Cl, CF2, NH3) [66, 95, 134-136]. One study highlighted applied water plasma
to modify the surface of polycarbonate and polyethylene terephthalate aiming to
permanently increase hydrophilicity of the membranes [137]. The result was a reduction

Chapter 2
45
in contact angle with increasing duration (after 2 min to 30 min) from 97o to 38
o. The
samples exhibited a slight hydrophobic recovery as they aged, with the contact angle of
the upstream side increasing by 17% after 1 month. X-ray photoelectron spectroscopy
(XPS) and scanning electron microscopy (SEM) analysis revealed increased oxygen
incorporation onto the surface of the membranes without any damage to the surface.
Another water plasma study investigated whether significant chemical and morphology
alterations on PES, Psf and poly(ethelene) (PE) membranes could be achieved [138].
The results were that the pores of the membranes were significantly affected and tended
to be more opened and water flux was increased by ~23% compared to the control
membranes. However, in this this study the fouling tests were not performed and
selectivity with contaminants was not reported. Meanwhile, hydrophilicity of all
modified membranes tended to be decreased with increasing duration from 2 to 9 min
by 60o. Also, it was demonstrated that the extent and stability of hydrophilic
modification of polymeric membranes was dependent on the plasma mechanisms,
incorporation of oxygen species and the degree of penetration of these species through
the porous structure. Therefore, water plasma appears to promote hydrophilicity which
is an important feature for water transport however, the depth of the modification may
penetrate within the treated material and may physically change molecular
conformation.
Surface treatments with inert gases, such as helium, have also been applied but impact
surfaces significantly less. A study on the impact of helium plasma on PES showed that
helium alone promoted surface roughening with increasing duration of the treatment
[139]. The pure water flux however, was not significantly altered and the real impact of
the plasma treatment on the pure water flux was not conclusive since a large variation of
the commercial control membrane was reported to be varied from 45 to 70 L.m-2
.h-1
.
However, the surface roughness showed a significant increase by ~3 times compared to
the control membrane and variations in flux were attributed to the altered morphology.
The water contact angle was also decreased by ~55% with increasing treatment time
and the hydrophilic surfaces showed good stability for at least 3 weeks especially when
kept in water. The treated membranes provided good anti-fouling properties. The pure
water flux values were 25% higher and the flux ratios after protein fouling were 73%

Chapter 2
46
higher after plasma treatment. Also, cleaning with water and caustic solution was more
effective for the plasma treated membranes. However, the bovine serum albumin (BSA)
concentrate concentration was 20% lower which was attributed to potential defects
caused by plasma. Although defects in the morphology occurred, the significant
increase of hydrophilicity promoted by plasma was shown to be essential to create an
anti-adherent surface. Furthermore, argon plasma treatment of PES membranes, showed
decreased contact angles but with low stability. Also, SEMs showed no signs of
degradation and the surface was quite uniform.
Therefore, gas plasma treatments are a cost effective reactant for tuning the membrane
surface morphology and grafting favorable bonding functionality for subsequent
processing. Comparing between pure gases and mixtures of inert gases demonstrated an
ability to increase hydrophilicity and consequential water flux of UF and MF
membranes [135, 140]. These treatments led to a formation of polar groups on the
surface and increased openness of the pores due to oxidative processes. Such oxidative
reactions directly improved the surface hydrophilicity which was detectable by reduced
contact and increased oxygen element species by XPS analysis. However, such dramatic
alterations are facilitated by the simplicity of the nature of the substrates that was
mainly composed of C-C and C-H bonding. Unlike the Psf, poly(vinylidene fluoride)
(PVDF) or poly(ethersulfone) (PES) membrane polymers used to fabricate UF
membranes, the PA used to fabricate RO membranes, is highly complex and already has
polar groups [61, 127]. Many plasma parameters must be considered when comparing
treatments such as excitation power, pressure and duration. However, the nature of the
plasma has shown to play a significant role on the surface properties of the modified
surfaces.
The combination of chemical and physical alterations across these membranes may
therefore simultaneously affect the surface morphology and chemical microstructure of
the material, which translates to performance changes in water transport and salt
rejection [141]. Therefore, plasma conditions must be determined in order to avoid
damaging the treated thin-film surfaces to achieve higher flux whilst maintaining
selectivity.

Chapter 2
47
2.3.1.3 Plasma mechanisms
Plasma glows are complex environments, where ionized species, elementary particles
and ultra-violet (UV) radiation are simultaneously generated and co-exist. They are able
to initiate and promote reconfiguration of chemical bonds as well as inducing bond
scission [142]. These activated species may react with the molecular structure of the
surface layer through a number of reaction mechanisms. Surface etching is a well
reported consequence of plasma treatments [143] that results in morphological changes,
such as roughening or smoothing, promoted by chain scission and re-deposition. Chain
scission may lead to the removal of near surface materials, which may be further
rearranged, vaporized and/or re-deposited onto the substrate [58]. Such chemical
changes may lead to high surface densities of functional groups across the outermost
surface regions [127] and/or to the formation of highly cross-linked, nanoscale thick
layers [144, 145]. Furthermore, the outcome of the treatment may vary according to the
nature of the substrate and reactant gas in association with the plasma parameters
chosen - which include excitation power, pressure and treatment duration. Therefore
these are the main parameters by which plasma treatment can be optimized for TFC
membrane modification.
In comparison, competitive plasma surface reactions arise from the etching processes,
which can lead to differing degrees of surface functionalization and roughening [43]. If
plasma conditions are intensified, a net re-deposition of vaporized materials can result
in the surface becoming smoother by crosslinking and free-volume densification [31].
Chemical effects from etching, in conjunction with re-deposited, vaporized materials,
may also occur as a result of high excitation power and long exposure time, which leads
to reduced surface roughness. Oxygen containing gases can especially promote aromatic
rings scissions [45, 46] and lead to severe PA degradation due to potential polymer
backbone bond scissions [47].

Chapter 2
48
2.3.1.4 Plasma polymerization
Plasma polymerization is a rapidly developing surface modification technique that has
been used for almost four decades across a broad range of industries [61, 146, 147].
Polymerization of monomers is induced by plasma-generated free-radicals formed in a
plasma chamber and on the material’s surface [124]. This technique allows the surface
deposition of a controlled, stable and uniform thin-film which is independent of
monomer and substrate reactivity. The advantage of a low frequency AC system is a
higher control of deposited chemical structures since the monomer molecules are not
completely degraded during the polymerization processes. This pseudo-stability is due
to low to the use of a carrier gas (i.e. inert gas) used to generate plasma in
polymerization processes [62]. A challenge of applying plasma polymerization to TFC
membranes is the difficulty of characterizing the plasma polymerized coatings, since the
functionalities of the polymerized surface can be unpredictably rearranged [67, 124].
The ultrathin films may also possibly be compromised by the etching even at lower
intensities [61]. Another challenge may be related to the fact that AC plasma systems
require very low pressures as mentioned in Chapter 1.
2.3.1.5 Plasma polymerization in membrane technology
Plasma polymerization for surface modification of TFC RO, NF and other membranes
(i.e. MF, UF) involves the use of RF plasma generator the most commonly available to
induce grafting [95]. However this plasma generator have shown to induce harsh
conditions which can result in degradation of both substrate and monomer molecules
besides a high degree of branching and crosslinking [62]. For this reason plasma has not
been extensively explored in TFC membranes. When working with RF plasma system
on TFC membranes the etching is a common issue that can easily damage the PA layer.
For this reason in some application with RF plasmas, additional steps are inserted prior
to the plasma polymerization process. Another issue may be related to the integrity of
the monomer used since RF can easily destroy the molecules before it can be grafted on
surface [62]. A study on plasma polymerization of NF membranes performed the

Chapter 2
49
modification in there steps: initially NF membranes were functionalized with particular
desired hydrophilic monomer prior to the plasma treatment. The second step performed
treatment with argon and hydrogen gas plasmas in order to induce crosslinking and then
finally amine functionalities were grafted with ammonia gas plasma in order to create
an amine rich surface. The modified NF membranes showed good retentions with
charged contaminates such as methylene blue (positively charged) which was 100%
retained. Other investigations performed plasma polymerization using atmospheric
conditions on TFC surfaces. Another study performed polymerization of PEG monomer
onto commercial TFC membrane in order to reduce organic fouling [71]. In this study,
RF plasma generator was also used at different polymerization duration (10, 15, 30, 60
and 120 s. The modified membranes exhibited reduced contact angle by 78% which
contributed to improve organic fouling resistance. During organic fouling tests the flux
was recovered up to 99% after cleaning with only water. However, water flux with
saline solution was reduced by 10-15% with increasing duration of the polymerization
process. Some chemical changes were observed with increased OH groups on surface
however, the control of the grafting/polymerization chemistry was not conclusive. The
AC plasma system may therefore offer a possibility to reduce surface etching on thin-
films and in one single step is possible to work with longer durations which enable
polymerization processes to induce high degree of functionalization and controlled
chemical structures [59, 62]. Table 2.2 show summarized surface properties after
plasma modifications of TFC membranes. The published works in this thesis are
discussed in Chapter 4 [148, 149] and 5 [59].
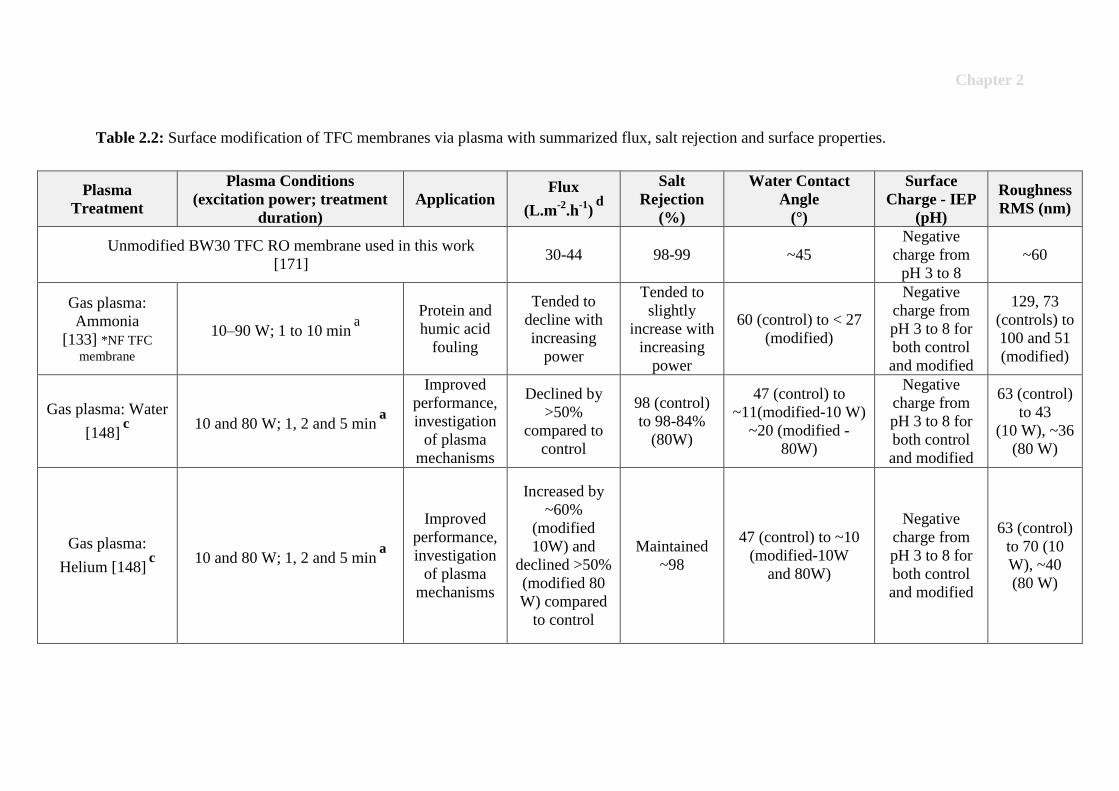
Chapter 2
50
Table 2.2: Surface modification of TFC membranes via plasma with summarized flux, salt rejection and surface properties.
Plasma
Treatment
Plasma Conditions
(excitation power; treatment
duration)
Application Flux
(L.m-2
.h-1
) d
Salt
Rejection
(%)
Water Contact
Angle
(°)
Surface
Charge - IEP
(pH)
Roughness
RMS (nm)
Unmodified BW30 TFC RO membrane used in this work
[171] 30-44 98-99 ~45
Negative
charge from
pH 3 to 8
~60
Gas plasma:
Ammonia
[133] *NF TFC
membrane
10–90 W; 1 to 10 min a
Protein and
humic acid
fouling
Tended to
decline with
increasing
power
Tended to
slightly
increase with
increasing
power
60 (control) to < 27
(modified)
Negative
charge from
pH 3 to 8 for
both control
and modified
129, 73
(controls) to
100 and 51
(modified)
Gas plasma: Water
[148] c
10 and 80 W; 1, 2 and 5 min
a
Improved
performance,
investigation
of plasma
mechanisms
Declined by
>50%
compared to
control
98 (control)
to 98-84%
(80W)
47 (control) to
~11(modified-10 W)
~20 (modified -
80W)
Negative
charge from
pH 3 to 8 for
both control
and modified
63 (control)
to 43
(10 W), ~36
(80 W)
Gas plasma:
Helium [148] c
10 and 80 W; 1, 2 and 5 min
a
Improved
performance,
investigation
of plasma
mechanisms
Increased by
~60%
(modified
10W) and
declined >50%
(modified 80
W) compared
to control
Maintained
~98
47 (control) to ~10
(modified-10W
and 80W)
Negative
charge from
pH 3 to 8 for
both control
and modified
63 (control)
to 70 (10
W), ~40
(80 W)

Chapter 2
51
Gas plasma: Argon
[149] c
10, 50 and 80 W; 1, 5, 15 and 30
min a
Improved
performance,
investigation
of plasma
mechanisms
Increased by
22% (10-50
W) and
dropped with
increasing
power density
by 78% (80
W;30 min)
compared to
control
98 (control)
to 97 (10-50
W; 1-15min),
~60% (50
W;30min),
~6% (80
W;30min)
60 (control) down to
~15 with increasing
power density
Negative
charge from
pH 3 to 8 for
both control
and modified
60 (control)
down to
~40 (80
W;30min)
Plasma
polymerization of
1-vinyl(imidazole)
[59] c
5, 9 and 15 min b
Improved
performance,
antimicrobial
properties,
investigation
of plasma
mechanisms
Declined by
>50%
compared to
control
98 (control)
to 95% with
increasing
duration
_
Negative from
pH 3 to 8
(control) and
IEP at pH 3.5
to ~5
31 (control)
to 24 (15
min)
Plasma
polymerization:
PEG [71] 1 W, 10, 15, 30, 60 and 120 s
a
Protein
fouling
10-15%
decline
compared to
control e
Maintaned
~98
32 (control) to 7
(modified 120s) _
62 (control)
to 89
(modified
120 s)
a Plasma generator: RF; low pressure ~20 Pa
b Plasma generator: AC; low pressure 7 Pa, 2 W
c Article published from this thesis
d Flux was determined using 2000 mg/L, NaCl solution; 15 bar; temperature ~25 °C, pH ~6
e Flux was determined using 3000 mg/L, NaCl solution; >15 bar; temperature~25 °C, pH ~6

Chapter 2
52
2.3.2 Gamma-ray irradiation technologies
Gamma-rays were discovered by Ernest Rutherford in 1900. Gamma rays are a form of
electromagnetic radiation similar to ultraviolet (UV) light, X-rays and microwaves
which does not make the irradiated objects radioactive. Gamma rays together with alpha
and beta rays belong to the class of ionizing radiation which detaches electrons away
from atoms and molecules. The most common way to produce gamma-rays in the
laboratory is by atomic nuclei decay of a radioactive source (e.g. cobalt-60) where
energy transitions from high to lower states. Although gamma-rays deliver high
frequency and energy, it does not cause changes in the nucleus of the materials.
However, in living organisms this can damage cells and breakdown the DNA which
makes organisms such as bacteria or mould unable to further divide.
During irradiation processes a certain amount of energy is absorbed by an irradiated
material known as radiation dose. The unit of absorbed dose is the Gray (Gy), which is
equivalent to the absorption of 1 joule of energy per kilogram. Doses can vary from 1
Gy to 1 MGy and the duration of the whole process depends on the actual dose rate of
the source. In order to obtain safe and precise doses, the radiation source rate decay is
calculated and calibrated with specific dosimeters coupled with the materials to be
irradiated.
The radiation facilities are practical for scaled up commercial production of modified
materials. The sources are stored in an underground water pool when not in use and it is
surrounded by walls made of ~1.7 m normal concrete. The size of the irradiation
chamber can vary to approximate 65 m3 and irradiation is performed under atmospheric
conditions. For this reason, gamma-rays facilities have been widely used across
contemporary technologies since 1960’s when the first industrial-scaled facility was
installed in Sydney, Australia - Australian Nuclear Science and Technology
Organization (ANSTO). Significant advances in spectroscopy studies have allowed
gamma rays to be utilized in the detection of materials for geochemical investigations,
nuclear industry and astrophysics due to its unique feature of photo effect transform that
enables detection of electrons in the analysed material. In the field of medicine, it has

Chapter 2
53
been used for cancer treatment, health care products, material modification and medical
imaging while in food industry, sterilization of fruits and processed food [76].
2.3.2.1 Irradiation-induced grafting in membrane science
Irradiation-induced grafting routes are a one-step and efficient technique requiring
direct energy radiation, such as X-ray or gamma-ray radiation sources, to induce
polymerization grafting and durably alter the surface chemical properties of polymeric
materials [54, 55]. As opposed to X- ray irradiation used for fundamental research only,
gamma-rays irradiations have been already scaled-up for pharmaceutical synthesis, food
sterilization and cleaning procedures [76]. In addition, gamma-rays irradiations can be
operated at atmospheric pressure and room temperature in bulk or confined
environments, becoming very suitable surface modification tools for ultra-thin
alterations of polymeric materials [56, 75]. A large variety of monomer precursors,
containing reactive and cleavable sites, may be activated in mild environments and
specifically polymerized to alter the surface properties of materials [75].
In membrane science irradiation induced grafting has not been extensively explored
compared to other chemical techniques, and has been only performed on bulk polymeric
membrane materials such as UF and MF membranes. One of the reasons is that this
technique cannot be reproduced in laboratory scale and also the impact of gamma-rays
irradiation on TFC membranes has been only recently studied [150, 151].
A study on surface modification of PVDF membranes performed gamma-rays radiation
to induce grafting of glycidyl methacrylate in order obtain a charged membrane with
improved oily emulsion fouling resistance. A noticeable diminution of the pore size was
evidenced from 43.8 nm for the control membrane to 4.18 nm after grafting [152]. In
this regard, this technique may induce significantly high grafting yields which in TFC
may affect free-volumes.
The choice of the monomer is an important task and it should be associated with an
ideal solvent that can induce good grafting yields. The degree of grafting is generally
increased with increasing gamma irradiation dose up to reach a plateau [153]. Also the

Chapter 2
54
rate of chain termination and homopolymer formation may increase faster than surface
grafting. The homopolymerization can be associated to the initial monomer
concentration associated with longer durations of the processes [76]. Therefore the use
of solvent systems has shown to play an important role in enhancing the grafting
process since diluting the monomer, may influence on the rate of propagation and
kinetic chain length. Also the solvent may also swell the polymer substrate to facilitate
accessibility and diffusion of the monomer across the surface which can potentially
increase the homogeneity [53]. A study on preparation of PVA membranes, used
gamma-rays to graft acrylic acid and N-vinyl (imidazole) monomers on the surface
[154]. In this study the influence of monomer concentrations in water/methanol solvent
system on the degree of grafting was investigated. Results showed that as the water
content increase in the solvent system the grafting yield is increased, reaching a
maximum value at a water/methanol composition of 40/60 for a grafting at 7 KGy.
However the use of gamma-ray irradiation of TFC membranes is in need of more work
to uncover beneficial surface modifications. Unique features of gamma-rays
modification are that the material does not need to be placed in a vacuum as is the case
for plasma systems, where vacuum can influence hydrophilic PA structures by
removing water molecules. Therefore this means of post modification of commercial
TFC membranes will be explored in this thesis.
2.4 Conclusions and research rationale
Although plasma technologies are well established techniques, the understanding of the
impact at the molecular level of plasma glows on materials chemistry and
microstructure is yet to be improved [69]. The vast majority of research on plasma
treatment of polymeric materials has been primarily focused on understanding surface
texturation mechanisms [66, 70, 71]. For membranes, focus has been made on
improving hydrophilicity, particularly for MF and UF membranes which have open
porous structures and thicker selective layers. Some work on TFC membranes has
mostly focused on increasing hydrophilicity where improvements to flux and fouling
have been observed. However plasma techniques (gas and polymerization) have many

Chapter 2
55
more impacts to the surface than simply increased hydrophilicity and thus forms one of
the key motivations for this study. Further, benefits from other means to impose the
energy for modifying the surface, such as with gamma-rays, add further conveniences
such as allowing the modification to occur in the conditions suitable to the modifying
compound (i.e. operate in atmospheric conditions instead of vacuum). This review has
therefore identified the current gaps in knowledge that justify the work undertaken in
this thesis, which is primarily about the detailed investigation of the capacity of direct
energy techniques to offer tailored surface features on top of commercial state of the art
TFC membranes for water desalination. The ultimate aim is to provide chemists and
engineers the convenient conditions by which they can choose desired surface features
of TFC membranes using plasma or gamma-ray irradiation techniques, which can be
applied directly to TFC desalination membranes, or more widely to modification of
sensitive polymer surfaces.

56

Chapter 3
57
3. Experimental details
3.1 Materials and methods
In RO membrane technology, the TFC membranes are packed into spiral wound
configurations, which are versatile and low cost module technologies, and major
suppliers include Dow, Toray, Hydranautics and Toyobo [86]. The membranes used for
surface modification and desalination tests in this work were spiral wound BW30 TFC
purchased from Dow Filmtec Corp. (IMCD limited, Australia). Flat sheet poly(sulfone)
(Psf) membranes (MWCO 30,000-50,000) used in Chapter 5 was purchased from
Beijing Puqirui technology respectively. Analytical grade sodium chloride (NaCl) used
in Chapters 4, 5 and 6 and CaCl2 in Chapter 6 were purchased from Sigma Aldrich and
used for the preparation of saline feed solution to give a concentration of 2,000 ppm.
Milli-Q water was used for the preparation of all aqueous solutions.
The reagents used for surface grafting were purchased from Sigma Aldrich. Namely 1-
vinyl(imidazole) (VIM), was used in plasma polymerization and radiation–induced
grafting, and maleic anhydride that was used only in plasma polymerization. Silver
nanoparticles (AgNPs), with a mean particle size of 20 nm and coated with 0.3 wt% of
poly(vinyl)pyrrolidone (PVP) were purchased from Nanostructured & Amorphous
Materials. These were used for attachment onto amine rich modified surfaces via
plasma polymerization with VIM (Chapter 5). The subsequent bacterial assessment was
carried out using Luria-Bertani agar, purchased from Sigma Aldrich.

Chapter 3
58
3.2 Surface modification methods
3.2.1 Membrane conditioning prior to plasma treatment and polymerization
Membrane pre-conditioning methods were applied prior to plasma treatment and plasma
polymerization shown in Chapters 4 and 5. The TFC membranes used in this work were
collected from the spiral wound membrane and were cut into flat sheets, with pieces of
membrane of around 21.0 x 29.7 cm in size and these samples were then placed in
poly(ethylene) (PE) bags at 4oC and separated into two groups: i) wetted membranes:
that were kept humid after sprayed sodium metabisulphite (SMBS) solution at 1 w/v%
and ii) as non-wetted membranes, i.e. membranes stored without any storage solution.
For desalination tests the above membranes were cut in 7 x 6 cm samples to fit into the
apparatus.
Prior to the plasma treatment, two types of control samples were prepared: i) pre-
conditioned membranes - the wetted membranes stored in SMBS, were soaked in
deionized water for 5 h in order to remove preservative materials and then dried in
ambient air for 12 h; ii) The non-wetted membranes were placed directly in the plasma
chamber without any pre-conditioning. After plasma treatment all membranes were
immediately rinsed with DI water and stored in SMBS.
3.2.2 Plasma treatment
Plasma gas treatment experiments were carried out at the CSIRO laboratories
(Commonwealth Scientific and Industrial Research Organization, Geelong, Victoria)
using a vacuum plasma system from Diener Plasma Surface Technology (Figure 3.1),
with a Pico-RF-PC - coupled with a radio frequency (RF) generator of 13.56 MHz with
an aluminium electrode. The plasma chamber of this apparatus is stainless steel with a
volume of 7.75 L. The gases injected were: helium, argon and water at a pressure of 200
Pa within the range of 10, 50 and 80 W, corresponding to power densities of 1.29 to
10.3 W/L, respectively, and with exposure times at each power setting of 1, 2 and 5 min
for helium and water and 1, 5, 15 and 30 min for argon plasma.

Chapter 3
59
Initially the vacuum conditioning stage was performed where the system was pumped
down from an initial reactant gas environment to 20 Pa. After this stage plasma was
generated and maintained according to the duration set.
Figure 3.1: a) CSIRO Plasma reactor; b) schematic diagram of the RF chamber.
3.2.3 Plasma Polymerization
Plasma polymerization experiments were carried out using the equipment at chemical
engineering department at Monash University, shown in Figure 3.2. Membranes were
placed separately into the vacuum chamber (reactor) (2 L) and firmly attached using a
Scotch Magic® tape manufactured by 3M onto a plastic support - exposing the
membrane active side only. The plasma polymerization process was divided into three
stages inside the chamber; i) the vacuum conditioning stage: the system was pumped
down from an initial argon gas environment to 5 Pa; ii) polymerization stage: the VIM
monomer was injected into the system together with argon gas to a pressure of 7 Pa.
The flow rate was 1.60 mL/min and the energy delivered was 1 W/L. At this stage the
time exposure could be controlled, being a crucial parameter for the generation of free-
radicals on the membrane surface and for control of the etching effect; iii) reaction

Chapter 3
60
stage: the argon plasma is switched off allowing completion of the reaction involving
the monomer.
Figure 3.2: a) Monash University plasma reactor; b) schematic diagram of the AC
chamber.
3.2.4 Gamma-ray induced grafting
3.2.4.1 Irradiation facilities
Radiation grafting was performed at the Gamma Technology Research Irradiator
(GATRI) Facility at the Australian Nuclear Science and Technology Organization
(ANSTO) (Figure 3.3a). The radiation source was cobalt-60 (60
Co) offering a dose rate
of 2.35 kGy/h, determined by reference dosimetry analysis in a previously reported
procedure [56]. The dosimeters used during the grafting process were Red
Perspex/4034NC and Amber Perspex/3042Y. The membranes were placed in PE bags,
with a tolerance level of 1,000 kGy [155] and filled with the grafting solutions, as
described below. The plastic bags were sandwiched between two glass plates to ensure
homogeneous wetting of the membrane materials during irradiation, and packed in a

Chapter 3
61
box with the dosimeters, as shown in Figure 3.3b. The experiments were performed at
an ambient temperature of ~24 oC. The overall uncertainty associated with an individual
dosimeter reading was calculated by the ANSTO technicians to be 4% providing a level
of confidence of approximately 95%. The uncertainty evaluation was carried out in
accordance with the ISO guide for the expression of uncertainty in measurement.
Figure 3.3: a) radiation chamber and b) samples apparatus where membranes inside PE
plastic bags were sandwiched between glass frames.
3.2.4.2 Grafting and control series
Grafting series
The grafting process was performed for total irradiation doses of 1, 10 and 100 kGy.
Giving that the dose rate was equivalent to 2.35 kGy/h, the irradiation total doses of 1,
10 and 100 KGy corresponded to 0.4, 4 and 42 h of irradiation, respectively. The
irradiation-induced grafting was performed with pre-conditioned membranes without
drying step, immersed in three different VIM solutions dissolved in MeOH/water at 50
v/v %. Scheme 1 summarizes the experiment design for the surface grafting.

Chapter 3
62
Scheme 1: Surface grafting with VIM solutions and irradiation total doses.
Control series
A series of control membranes were prepared using wetted control membranes (stored
in SMBS as described in Section 3.2.1). Control membranes exposed to VIM solutions
without irradiation in order to simulate the direct impact of the monomer for a duration
equivalent to that of the highest irradiation total dose of 100 kGy of 42 h. The series of
MeOH/water solution assessed the direct impact of the radiation on the membrane
surface. Scheme 2 shows the experiment design for the control series.

Chapter 3
63
Scheme 2: Series of control membranes exposed to VIM and MeOH/water solutions.
3.2.4.3 Degree of grafting
The mass gain in this study was used as a quantitative tool to accessing polymerization
which occurred across the surface of the treated material [156]. After irradiation, the
membranes were thoroughly washed with deionized water, in order to remove any
remaining non-polymerized materials, and dried for 1 h at 65oC followed by weighing
on a Metler MS40025/01 balance (+/- 0.001 mg). The irradiated samples were cut into 7
X 6 cm pieces to provide a manageable surface area of 42 cm2 (+/- 0.3 cm
2).
The degree of grafting was calculated using Equation 1:
% Grafting = (W1−Wo)
Wo× 100 (1)
where Wo and W1 are the dry weights of the control membrane and the grafted
membrane respectively.

Chapter 3
64
3.3 Surface characterization
The characterization techniques are divided into morphology analysis and chemical
analysis as described in Table 3.1. The morphology characterization techniques are
scanning electron microscopy (SEM) and atomic force microscopy (AFM). The contact
angle is considered an intermediary technique between morphology and chemical
analysis. Thus, the chemical techniques include the streaming potential, X-ray
photoelectron spectroscopy (XPS), attenuated total reflection-Fourier transform infrared
spectroscopy (ATR-FTIR) that includes synchrotron map analysis for thickness and
uniformity assessment.
Table 3.1: Analytical instrumentation techniques
Instrumentation
Techniques
Morphological surface properties Chapter
SEM Qualitative analysis of surface roughness 4,5,6
FIB Qualitative analysis of cross-sections of the
material
5,6
EDS Elemental quantification 5
AFM Quantification of surface roughness 4.5.6
Instrumentation
Techniques
Chemical surface properties Chapter
ATR-FTIR
Qualitative analysis of functional groups across
the surface
4,5,6
ATR-FTIR-map Homogeinity and thickness analysis 5,6
XPS Qualitative analysis of chemical bonds and
quantitative elemental analysis
4,5,6
Streaming
potential
Surface charge analysis of ionizable chemical
moieties
4,5,6
Contact angle Hydrophillicity measurement 4,6

Chapter 3
65
3.3.1 Scanning electron microscopy (SEM) and energy dispersive spectroscopy
(EDS)
SEM and EDS were performed at the Institute of Frontier Materials, Deakin University
were used to analyse the surface topography after modification. Both techniques are
coupled with an electron beam column. The bombarded electrons interact with atoms in
the sample which produce signals to form an image. EDS is also able to detect elements
present on the surface, however more sensitive for metals such as silver, and presents at
atomic % (at%). Also, Focus Ion Beam (FIB) can simultaneously perform cross-
sectioning and images of samples with a column of ion beam.
SEM micrographs and EDS spectra were acquired on a dual beam Gallium (Ga) Focus
Ion Beam (FIB) Quanta Scanning Electron Micrographs fitted with an EDAX sensor -
after deposition of a 1 nm thick carbon coating performed on a Balzers Sputter Coater
SCD 050. The images for the SEM and EDS elemental maps were acquired at 5 and 20
keV, respectively, for a working distance of 10 mm and a current of between 0.1 and 0.4
nA.
3.3.2 Atomic force microscopy (AFM)
AFM is a quantitative technique used to confirm changes in surface roughness visually
detected by the SEM micrographs. AFM analysis is form of scanning probe microscope
that scans across the surface of a material with an extremely fine probe on the end of a
cantilever. The surface is profiled by measuring the deflection of the cantilever which
therefore allows a 3D profile of the surface to be produced at high magnifications which
can provide more sensitive topographical information than optical or scanning electron
microscopes.
AFM analysis was carried out on relevant samples, where results are shown in Chapter
4 Section 4.1 and Chapter 5 Section 5.1 was performed at the Institute of Frontier
Materials, Deakin University using a Cypher AFM coupled with Herzian TS-150 active
vibration table and an ARC2 SPM controller. The samples were cut and mounted, using
double sided tape, on a magnetic support. The resonance frequency and spring constant

Chapter 3
66
for the cantilever were specified at 300 kHz (±100 kHz) and the spring constant was
specified as 40 N/m. The actual resonance frequency was determined using the
automated routine on Igor Pro 6.35A5 software. Data were collected using a scan speed
of 0.4 Hz and scan sizes of 20 and 5 µm. AFM analysis was performed in tapping mode
using a Bruker AFM equipped with a Nanoscope V multimode scan and coupled with
microscope camera 10xA Nikon series 110422. The resonance frequency and force
constant for the probe were 300 kHz (±100 kHz) and 40 N/m, respectively. Data were
collected using Nanoscope 8.4 software and images were evaluated using Gwyddion
2.36 software. The tapping mode was used in order to avoid damages to the PA layer
from the AFM probe [88].
The AFM analysis in Chapter 4 Section 5.2 and Chapter 6 was performed at the
Materials Characterization and Fabrication Platform (MCFP) at the Melbourne
University. Analysis was performed on a Cypher atomic force microscope (AFM) using
a Herzian TS-150 active vibration table and an ARC2 SPM controller using the same
parameters as above.
3.3.3 Attenuated total reflection-Fourier transform infrared spectroscopy (ATR-
FTIR)
FTIR is a powerful vibrational analysis tool for structural characterization of molecules
and their chemical bonds. The resulting spectrum is therefore, composed by a unique
molecular fingerprint from particular vibration created by each molecule. In this work
FTIR was used to assess chemical changes across the PA surface after surface
modification.
Infrared (IR) spectroscopy consists of decoding interferogram signals at different
frequencies of transmitted and absorbed IR radiation. Scheme 3 illustrates the process of
IR analysis in 5 steps i.e. 1. Initially the IR radiation beam enters the interferometer
which generates an interferogram signal; 2. The beam continues and reach the sample
where some of the radiation is absorbed by the sample and some is transmitted or
reflected off the sample; 3. A new interferogram is created from specific molecular
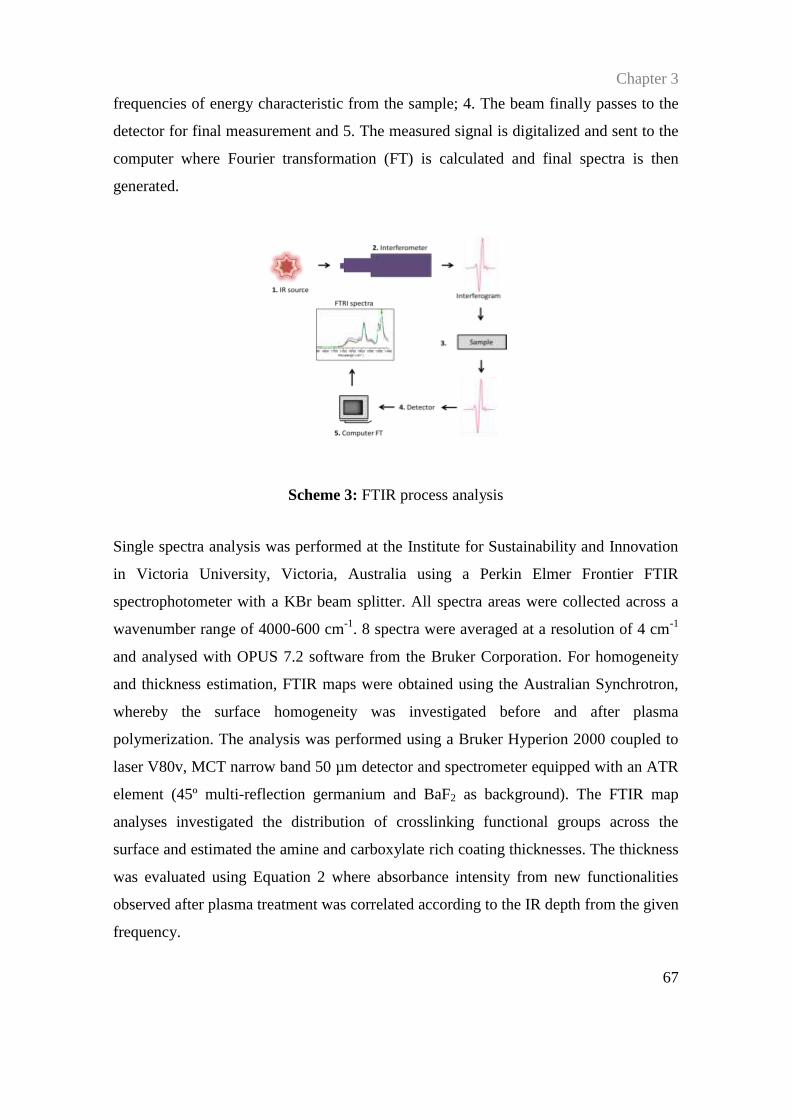
Chapter 3
67
frequencies of energy characteristic from the sample; 4. The beam finally passes to the
detector for final measurement and 5. The measured signal is digitalized and sent to the
computer where Fourier transformation (FT) is calculated and final spectra is then
generated.
Scheme 3: FTIR process analysis
Single spectra analysis was performed at the Institute for Sustainability and Innovation
in Victoria University, Victoria, Australia using a Perkin Elmer Frontier FTIR
spectrophotometer with a KBr beam splitter. All spectra areas were collected across a
wavenumber range of 4000-600 cm-1
. 8 spectra were averaged at a resolution of 4 cm-1
and analysed with OPUS 7.2 software from the Bruker Corporation. For homogeneity
and thickness estimation, FTIR maps were obtained using the Australian Synchrotron,
whereby the surface homogeneity was investigated before and after plasma
polymerization. The analysis was performed using a Bruker Hyperion 2000 coupled to
laser V80v, MCT narrow band 50 µm detector and spectrometer equipped with an ATR
element (45º multi-reflection germanium and BaF2 as background). The FTIR map
analyses investigated the distribution of crosslinking functional groups across the
surface and estimated the amine and carboxylate rich coating thicknesses. The thickness
was evaluated using Equation 2 where absorbance intensity from new functionalities
observed after plasma treatment was correlated according to the IR depth from the given
frequency.

Chapter 3
68
ln [At
A0] =
2t
dp (2)
Where t = thickness of coated film; At = IR absorbance after polymerization; A0 = IR
absorbance before polymerization; dp = depth of IR beam
All spectra for map analysis were collected with a 20 µm knife-edge aperture,
corresponding to a spot size through the crystal of 5 x 5 µm. For each measurement
point, 64 spectra were averaged at resolution of 4 cm-1
, background was collected every
5 spectra and analysed with OPUS 7.2 software from the Bruker Corporation.
3.3.4 Streaming potential
The surface charge measurement was performed to identify chemical components
present on a surface and to bench mark the optimum pH conditions for modified
membranes. The membrane surface exhibit charge when in contact with a fluid. The
charge on the surface attracts counter-ions in the solution and forms an electric double
layer (EDL) (Figure 3.4). The EDL consists of two layers one very close to the surface
(Stern layer) and another distributed away from the surface (diffuse layer). The surface
charge is calculated as the electrokinetic (zeta) potential, which is the difference in
potential from the surface of shear in the EDL to the surface/liquid interface. The zeta
potential value is utilized to quantify surface charge via streaming potential technique
where zeta potential measurements are associated with the motion of ions across a
steady surface under different pressures and range of pH [157]. Therefore, this
technique is extemely sensitive to surface composition changes and may be correlated to
the density of resultant outer layer functional groups [158]. Electrostatic interactions
between the solution and the surface ionizable functional groups result in protonation
and deprotonation of amine and carboxylic groups respectively as a function of the pKa
of the moeities, and therefore as a function of the test solution pH. Modified TFC
membranes were evaluated at the Institute for Sustainability and Innovation in Victoria
University, Victoria, Australia using Surpass Anton Paar Electro Kinetic Analyser
(EKA) utilizing Visiolab software (version 2.2). In the EKA analyser, membranes were
placed onto a 20 × 10 mm adjustable gap cell of thickness < 2 mm. The streaming

Chapter 3
69
channel dimension was approximately 0.1 mm at the pressure adjusted to reach
maximum of 400 mbar. A pH electrode (Schott Instruments) was used for measuring
the zeta potential. A KCl 1mM solution was used, and 0.1M HCl and NaOH were used
for pH adjustment. An average value of the zeta potential was calculated based on four
repeat measurements obtained from both directions of flow in the cell.
Figure 3.4: Schematic representation of the distributions of ions around a charged
surface.
3.3.5 Contact angle
Hydrophobicity or wettability can be accessed by water contact angle measurements.
The contact angle is a sensitive tool that is strongly be affected by chemical and
morphological characteristics. This analysis was performed at the Institute of Frontier
Materials (Deakin University) using Biolin Scientific goniometer. Prior to contact angle
measurements, the membranes were dried in air overnight. The test involved adding 4
μL of deionized water drops in three different spots across the membrane surface.
Images were acquired 5 s after drop impact and contact angles were calculated by fitting
the outline of the drop’s image to the Young-Laplace equation using the Biolin
software.

Chapter 3
70
3.3.6 X-ray photoelectron spectroscopy (XPS)
XPS is a well stablished and sensitive analysis that can detect chemical elements on
surface up to 5 nm in depth. As most of the polymers are non-conductive, X-ray can
activate and excite species on surface upon injection of photo electrons which can
generate charge on the sample. The XPS spectra is obtained from simultaneous
measurement of the kinetic energy and number of electrons that escape from the top of
0 to 10 nm depth of the material analysed [159]. Depending on the softness of the
material, the X-ray wavelength may damage the analysed substrate. Therefore, the total
dose of the X-rays, temperature of the surface and the level of the vacuum conditions
should be controlled.
The XPS results presented in Chapter 4 Section 4.2.2.2, Chapter 5 Section 5.2.2.2 and
Chapter 6 Section 6.2.3 where measured at the Physics Department, School of Applied
Sciences, RMIT University using a Thermo K-alpha Spectrometer. A quantitative
elemental composition of the modified PA was provided for a surface depth of 1–5 nm.
The technique was able to detect elements with a detection limit of 0.1% of the bulk
material. An Al Kα (1486.6 eV) X-ray source was used as the excitation source, and the
anode was maintained at 250 W, 10 kV, and 27 mA at a chamber pressure of 2.67 x 10⁻⁸
Pa with a beam spot size of 400 μm x 400 μm. The peak position was calibrated using
the C1s peak at 284.6 eV. XPS analysis results shown in Chapter 4 Section 4.2 and
Chapter 5 Section 5.2 was measured at the Centre for Materials and Surface Science,
Department of Physics, La Trobe University. XPS analysis was performed using an
SSIS probe and Spectrometer Kratos AXIS Nova (Kratos Analytical Ltd,
Manchester,UK). The same parameters were used as described above. Elemental spectra
were decomposed using Origin software with Gaussian peak fitting and Tougaard
baseline.

Chapter 3
71
3.4 Desalination tests
This analysis was performed at the Institute for Sustainability and Innovation in
Victoria University, Victoria, Australia. Salt rejection and water permeation
performance were tested with a laboratory-scale cross-flow filtration system (CF042,
Sterlitech Corp., WA, USA). The concentrated feed stream containing a saline solution
(2000 ppm at 25°C) was pumped to the system with an effective membrane area of 42
cm2 and flowing tangentially across the membrane surface under 15 bar and trans-
membrane pressures were monitored and maintained at the target working pressure
within a +/- 2% accuracy. The outlet permeate flow was collected after 120 min and salt
rejection conductivity measured immediately after the test. Salt concentration was
determined using an electrical conductivity meter (Hach HQ40d) and mass of permeate
was measured with a balance Metler MS40025/01 balance (+/- 0.001 mg).
Salt rejection R (%) was calculated according to Equation 3:
𝑅 = 1 − (𝐶 𝑝𝑒𝑟𝑚𝑒𝑎𝑡𝑒
𝐶𝑓𝑒𝑒𝑑) × 100% (3)
where Cpermeate and Cfeed are the conductivity of salt concentration in the permeate and
feed respectively, in µS/cm. Permeate flux F (L/m2.h
-1) was calculated by Equation 4:
𝐹 =𝑉
𝐴×𝑡 (4)
where V is permeate volume (L), A is effective membrane area (m2) and t is time over
which the volume V was collected (h).
3.5 Functional tests
The following tests were performed in Chapter 5 (Section 5.2) in order to confirm
increased active sites of amine functionalities on surface. The same plasma
polymerization process was further repeated using the same parameters in Section 5.3.
This Section focused on the optimization of membranes permeation and these tests were
no longer repeated.

Chapter 3
72
3.5.1 Silver attachment onto amine rich TFC membranes
Amine rich and control TFC membranes were immersed separately into an AgNP
solution (0.1 mM, 50 mL) for 12 h, rinsed with deionized water and dried at 35oC.
Membranes were then subjected to microbial adhesion assessment and silver contents
were evaluated with XPS and EDS analysis. Three plasma polymerization durations of
5, 9 and 15 min were used on TFC membranes. In order to ensure correct assessment of
the plasma effect, a control sample was inserted into the plasma vacuum chamber with
only the vacuum conditioning stage carried out.
3.5.2 Bacterial adhesion assessment
The antimicrobial property on the membrane surface was assessed by exposing the
active side of the membrane to Escherichia coli (E. coli strain, Nissle 1917). E.coli is a
model candidate media for general antimicrobial experiments because it is a facultative
microorganism that exhibits similar responses to silver ions under aerobic and anaerobic
conditions. This media is also found in water treatment plants and therefore, in
biofouling assessments in literature. E.coli was prepared following the same protocol as
previously reported [160]. Functionalized membranes were exposed to E.coli, and a 100
µL aliquot of the E.coli suspension was pipetted onto an agar plate and spread over the
surface. The membranes (7 mm diameter disks) were placed onto a bacteria-agar
surface with the silver-embedded side facing the agar and incubated for 24 h at 37oC.
An optical microscope, coupled with an Olympus DP70 Digital Microscope Camera,
was used to image the petri dishes and quantify antimicrobial inhibition zones around
the functionalized membranes (at 20x and 50x magnifications). The inhibition zone
distances were averaged from five perpendicular points and measured according to an
image size of 300 pixels/cm.

73

Chapter 4
74
4. Plasma gas treatment of poly(amide) thin-film
composite membranes
In this chapter, the potential benefits of plasma treatment of PA TFC membranes using
different reactant gases were systematically investigated. Altered surface properties
after plasma treatment were correlated to subsequent membrane desalination
performance and plasma operating parameters including excitation power and duration.
Preliminary control tests before plasma investigations were performed to analyze the
permeation and salt rejection performance against control membranes. The impact of
the membrane pre-conditioning, such as washing to remove protective coating layers,
followed by drying and subsequent re-wetting was also considered. The first series of
experiments was carried out with water and helium plasma. This experimental work
investigated the effect of these different types of plasma, specifically comparing
differences between the effects of oxygen containing gas plasma (water) versus inert gas
plasma (helium) on the TFC membrane. Secondly, this study involved argon plasma
atmosphere to compare against the water and helium plasma modifications. The argon
investigation also provided background knowledge to support the subsequent plasma
polymerization process described in Chapter 5 since argon was used in this specific
Section as a carrier gas upon injection of the monomer. Morphology and chemical
characterizations of the modified surfaces revealed the effects of plasma etching and
supported conclusions of re-deposition mechanisms. Such characterization and
understanding of nano-thin effects in association with the assessment of membrane
performance provided insights for potential desalination applications.

Chapter 4
75
4.1 Membrane desalination performance controls
According to the manufacturer [162], the water flux of the flat sheet laboratory scale
membranes at 15 bar could be estimated at around 30 L.m-2
.h-1
and for 99.4% of salt
rejection using a 2,000 ppm NaCl solution. However, variation in flux and rejection for
such materials have been reported and the source of these variations, primarily due to
surface inhomogeneity, is an ongoing discussion [163]. Studies have attributed such
variations to the IP process during membrane synthesis due to a resultant asymmetry of
cation and anion-exchange regions in the material [87] as previously detailed in Chapter
1 Section 1.2. In this analysis, the repeatability of the desalination tests were
investigated using a cross flow system as described in Chapter 3, Section 3.4.
In order to assess potential variation of saline water flux and rejection capabilities, 7
samples were collected from random locations across the spiral wound membrane
module. This was considered to give a realistic variability study as spiral wound
modules are sold by the supplier meeting the specified flux and rejection performance.
Meanwhile, membranes supplied as sheets for testing purposes may not necessarily
meet performance criteria. In Figure 4.1 the water fluxes and salt rejections are
displayed with error bars calculated based on the estimated standard error of the mean.
The calculated mean value of 44.9 ± 1.2 L.m-2
.h-1
from the fresh control samples was
about 50% higher than of the estimated value from the manufacturer. On the other hand,
the selectivity trade-off was compensated with lowered salt rejection i.e. 98% ± 0.3.
The water flux from fresh membrane samples subjected to pre-conditioning was also
evaluated. Pre-conditioning procedures have been reported as simple methods to clean
any surface in order to remove impurities or preservative materials prior to surface
modification including plasma [79, 164-167]. The method consists in washing the
samples with DI water or other solvents such as ethanol following by drying in oven or
in air. Figure 4.1 shows that water flux of re-wetted membranes severely declined by
70% compared to fresh control samples however, salt rejection was not compromised.
Such drying and re-wetting steps may cause irreversible flux decline upon the collapse
of the Psf pores and/or clogging of PA free-volume and nano-voids [74, 168, 169]. For
instance, a study related to plasma surface modification of commercial TFC membrane

Chapter 4
76
reported flux declined by 7.5% after 15 s of plasma polymerization with poly(ethylene)
(PEG) based monomer. Such loss was attributed to membrane pre-conditioning step
[43]. Therefore, significant flux decline suggests that pre-treatment conditions prior to
desalination tests can severely affect the membranes water flux.
Figure 4.1: Flux and salt rejection for control membranes. Cross-flow desalination test
conditions: 15 bar inlet pressure and 2,000 ppm NaCl solution at 25oC. The error bars
for the manufacturer’s control membrane was not provided by the manufacture.
4.2 Preliminary investigations using water and helium plasma
In this Section, the TFC membranes were treated with pure helium and water gas
plasma for different excitation powers (10 and 80 W) and exposure durations (1, 2 and 5
min). The series of membranes modified with water and helium plasma were part of
initial investigations in this work and were subjected to the pre-conditioning step as
mentioned above and described in Chapter 3.

Chapter 4
77
4.2.1 The impact of water and helium plasma treatments on the performance of
the membranes
Initially water and helium plasma treatments were performed at 10 W of excitation
power with increasing duration from 1 to 5 min. The water flux through the membranes
after water plasma treatment was found to be statistically greater than the pre-
conditioned membranes and about 50% below to that of the fresh control membranes at
any plasma treatment duration. On the other hand, no significant loss in salt rejection
could be observed between these samples, as shown in Figure 4.2. At 80 W of
excitation power (Figure 4.2), the flux was significantly reduced to the level of pre-
conditioned control membranes after plasma treatment, while rejection remained
unaffected for plasma durations between 1 and 2 min. For longer treatment duration of 5
min, a sharp loss in salt rejection was observed, down to 84%. Conversely, the
permeation of helium plasma treated membranes at 10 W (Figure 4.2) showed
systematic flux increases as a function of the exposure duration while simultaneously
exhibiting a potentially slight rejection loss with statistically significant drop to 96% for
2 min duration, but potentially no change after 5 min duration. The flux across the 1 and
2 min treated samples was about 3 times higher than that of the re-wetted membranes,
while however 21% below that of the fresh control membranes. However, for increased
duration of 5 min of treatment, the water flux was improved by about 4 times compared
to the pre-conditioned control membranes. These values of flux were found to be
slightly enhanced compared to the fresh control membranes which were not re-wetted.
Fluxes corresponding to helium exposed samples at 80 W are shown in Figure 4.2.
Although, the water flux severely declined, salt rejection remained approximately
constant, around 98.8% ± 0.5.
In conclusion, plasma modifications altered the flux and intrinsic characteristics of the
membrane, such as morphology and hydrophilicity. The nature of the gas and the
treatment duration did affect the integrity of PA layer. In order to understand the effect
of plasma treatments on the modified surface, further physico-chemical characterization
of modified membrane surfaces were performed.

Chapter 4
78
Figure 4.2: Membrane flux and salt rejection measured after 2 h of testing with 2,000
ppm of NaCl in water at 15 bar feed pressure after plasma modification at 20 Pa.
4.2.2 Characterization of surface properties after water and helium plasma
treatments
4.2.2.1 Morphology characterization of the plasma modified membranes
Competitive plasma surface reactions arise from simultaneous etching and re-deposition
processes, which can lead to differing degrees of surface texturization [58]. Initial
investigations of morphology changes were performed by acquiring SEM images of the
membrane surfaces as a function of the treatment conditions. Figure 4.3a shows the
SEM of the control membrane. As shown in Figure 4.4, the surface of the water treated
membranes was significantly smoothed with increasing treatment duration, with the

Chapter 4
79
effect intensified for higher excitation power. In contrast, the topographical SEM
analysis for helium plasma in Figure 4.5 shows that modified membranes at 10 W were
slightly smoothed for short plasma treatments, while roughening occurred for a
treatment time of 5 min which was also detected at 80 W.
Figure 4.3: a) SEM and b) AFM analysis of control membrane with Ra 63 ± 3.3 nm.
Figure 4.4: SEM from water plasma modified membranes.

Chapter 4
80
Figure 4.5: SEM from helium plasma modified membranes.
In order to confirm topology variations found by SEM, the average roughness (Ra) of
the modified membranes was measured by AFM as presented in Figure 4.6 and
compared to control membranes (Figure 4.3b). As shown in Figure 4.6, water treated
membranes at 10 W showed reduced Ra from 63 nm (control) down to 43 ± 2.6 nm
after only 1 min of plasma treatment. Beyond 1 min, the roughness values increased
back up to Ra 57 ± 5.0 nm between 2 and 5 min. At 80 W increased plasma durations
led to increased smoothing effect with Ra reduced down to 57 ± 2.5 nm at 1 min, to 36
± 2.2 nm at 2 min, and then 47 ± 4.3 nm at 5 min. Previous studies on CO2 plasma
treatment of PES membrane also demonstrated that smoothed morphologies were
achieved for the treated surfaces [170]. The SEMs showed that between 1 to 5 min of
plasma treatment pores were gradually reduced in diameter and progressively
disappeared. However, beyond 5 min, the pore size started to increase again and to
reappear across the surface. The alterations of pore diameters were attributed to etching
and re-depositions on the surface. Interestingly, the etching rate was found to be more
largely depending on the power density than the re-deposition rate.

Chapter 4
81
Figure 4.6: AFM topology maps for the water plasma modified membranes.
In contrast, the topographical SEM analysis for helium plasma in Figure 4.7 shows that
modified membranes at 10 W were only slightly smoothed for short plasma treatments,
while roughening occurred for treatment durations of 5 min. For shorter treatments
between 1 and 2 min, the roughness was slightly reduced to 60 ± 0.5 nm and 58 ± 1.2
nm. However, a significant roughening effect was observed with longer plasma
treatment, with Ra increasing to 70 ± 1.5 nm at 5 min which is in good agreement with
previously reported study [139]. A similar roughening effect was observed with helium
plasma (25 W) treatment on poly(ethersulfone) (PES) membranes. Although,
significantly increased roughness were measured from 11 nm (control) to 39 nm after
30 s of plasma treatment, roughening mechanisms was attributed to fragments of re-
deposited materials but the mechanisms involved were not conclusive [139]. Helium
plasma at 80 W, however, showed a smoothing trend, stronger than observed for water
plasma, with Ra reduced to around 40 ± 2.7 nm for all durations which therefore can be
attributed to re-deposition of molecular fragments of removed materials.

Chapter 4
82
Figure 4.7: AFM topology maps of helium plasma modified membranes.
The AFM results are consistent with the findings from the SEM analysis. The altered
surface texture supports the findings from prior studies on polymer surface plasma,
which leads to the explanation of the potential etching and re-depositions. Etching and
re-deposition mechanisms are indicative that water plasma potentially enlarged the
nano-voids across the PA structures primarily as a function of increasing excitation
power. The potential increase in nano-voids size relates to reactive species diffusion
across the voids structure, thereby exposing the voids walls to etching radicals, which in
turn can enlarge the patterns. Simultaneously, fragments of etched materials may have
been re-deposited across the enlarged patterns thus resulting in surface smoothing. This
trend was well associated with flux decline. The same mechanism appeared to occur
with helium plasma treatments where surfaces were smoothed. However, the
enlargement of free-volumes or nano-voids were potentially not as intense as
hypothesized for water treatment once salt rejection was not significantly affected as
seen in water plasma treatments at 80 W. On the other hand, surface roughening
detected for helium treated surface can be attributed to re-deposition of more
fragmented moieties, a similar effect found in plasma surface grafting of hydrophilic
monomers [71, 170]. Therefore, mechanisms involving etching and re-depositions are
required to be investigated at the molecular level.

Chapter 4
83
4.2.2.2 Chemical assessment of TFC membrane surfaces after water and helium
plasma treatments
Investigation of the chemical functional group changes across the membranes was
performed by ATR-FTIR analysis. Variations in absorbance from studied frequencies
(described in Table 4.1) showed potential degradation caused by etching and re-
deposition mechanisms of materials related to the aromatic polymer backbone.
Table 4.1: FTIR and PA studied frequencies
The analysis of the FTIR spectra (Figure 4.8) for the water plasma modified membranes
at both 10 and 80 W showed that the absorbance decreased with the broadening of the
band at 3330 cm-1
, corresponding to N-H and OH groups near aromatic rings stretching
vibration. This effect suggests presence of hydrophilic species such as containing O-H
groups [170] however, chemical degradation cannot be discarded once referred nascent
band was diminished. Although the band at 3330 cm-1
was observed to broaden at both
power intensities, possible etching at 80 W suggests an intensified physical sputtering
behavior as previously discussed in morphology analysis, which is in agreement with
significant salt rejection loss with only 84 % after 5 min of treatment (Figure 4.2).
The bands at 1663, 1609 and 1541 cm-1
showed similar absorbance patterns with that
observed for both 10 and 80 W. Such absorbance alterations are potentially an
indicative of crosslinking with re-deposited fragments from the amide backbone.
FTIR band frequency (cm-1
) Description
3330 N-H groups and O-H groups stretching vibration
[171]
1663 Amide I band: stretching vibration from the C=O
and C-C-N deformation vibration [172]
1609 Aromatic amide N–H deformation vibration or
C=C ring stretching vibration [172]
1541 Amide II band: N-H in-plane bending and N-C
stretching vibration of a –CO-NH- [173]

Chapter 4
84
However, for longer exposure durations such as 5 min at 80 W (Figure 4.8), a new
broad carbonyl band at around 1734 cm-1
appeared, which may not only be attributed to
re-deposition mechanisms but also to post-plasma reactions with unreacted gaseous
radicals or plasma generated peroxide radicals [58].
Figure 4.8: FTIR analysis from water plasma modified membranes. Top: analysis of N-
H and O-H bands at 3330 cm-1
for modified membranes at 10 and 80 W. Bottom:
analysis of amide bands from 1663 to 1541 cm-1
for modified membranes at 10 and 80
W.

Chapter 4
85
For the helium plasma modified membranes, the band at 3330 cm-1
(Figure 4.9)
increased in intensity and partially shifted in frequency as a function of duration. At 10
W, the significant increase in intensity for the 5 min duration compared to 1 and 2 min
may indicate re-deposition of hydrophilic fragments in the amide groups [65, 170, 173].
Figure 4.9: FTIR analysis from helium plasma modified membranes: on the top,
analysis of N-H and O-H bands at 3330 cm-1
for modified membranes at 10 and 80 W;
on the bottom, analysis of amide bands from 1663 to 1541 cm-1
for modified
membranes at 10 and 80 W.

Chapter 4
86
At 80 W, the band at 3330 cm-1
shifted to 3400 cm-1
, which suggests changes to the
neighbouring hydrogen bonding and crosslinking at the amide vicinities [173, 174]. The
bands at 1663, 1609 and 1541 cm-1
at 10 W showed similar absorbance patterns.
However, stronger absorbance variations were found at 80 W, which may indicate a
potential increase in the etching effect and re-deposition mechanisms.
In order to investigate re-deposited materials at the molecular level, a XPS analysis
elemental survey analyzed the N/C and O/C ratios. The O/C ratio for water plasma
(Appendix 1 - Table A-4.1 and Table A-4.2) was found to slightly altered from 0.3
(control) to a range between 0.2 and 0.4. The O/C ratio for the water plasma treatments
was stable, and may be related to the nature of PA. As the material already supports
oxygen functional groups across in the polymer backbone, the incorporation of larger
densities of oxygen rich functional groups, via plasma treatment, will make them much
less visible than with other polymers treated in similar conditions [175]. Another
potential explanation is based on the ageing effect of the samples over time, since XPS
analysis in this study was performed 1 month after the plasma treatments due to
constraints in accessing the XPS system. A study on water plasma treatment detected
low O/C ratio in treated membranes which was attributed to hydrophobicity recover.
Also the water contact angle was progressively increased by 8% after 1 month of
storage [137]. On the other hand, in this work, the N/C ratio, was significantly increased
from 0.03 (control) to 0.1 nearly 3 times for both helium and water plasma, with
increased excitation power and duration. The nitrogen source is potentially associated
with N2+ metastable species in the gaseous mixture from residual nitrogen, or
introduced as purge gas after plasma treatment. Also minimal nitrogen concentrations
(> 1 at%) can easily react with aromatic structures due to the inherent electron
delocalization from aromatics [176]. Previous studies using argon and helium plasma
for surface treatment of PES membranes showed increased elemental species by up to
1.7 at% which was attributed to further reactions with air [139, 177]. The significantly
increased ratio detected for water and helium treated samples suggests strong
correlations between fragmented materials re-deposited on the surface, which therefore

Chapter 4
87
promoted chemical changes. However, further analysis of C1s high resolution is
necessary for an in depth assessment of re-depositions mechanisms.
In this study, only water plasma treated samples were investigated. Figure 4.10 presents
the C1s peak at 284.5 ± 0.2 eV from a control membrane, which is characteristic of C-C
and C-H bonds. The peak at 286.1 ± 0.3 eV may be attributed to either C-O groups,
which could only originate from the surface coating material, or to inherent C-N sites,
which are commonly present in commercial PA matrix [171, 172]. The peak at 287.8 ±
0.1 eV is attributed to amide and carboxylate N-C=O and C=O functional groups, which
appear as backbone groups within the PA polymer.
Figure 4.10: XPS C1s high resolution of a control membrane
Figure 4.11, shows that the peak at 286.1 eV consistently decreased with increasing
power density with total disappearance at 80 W which is an indication of PA structural
degradation. On the other hand, a large peak at 287.9 eV (C-N; C–O) was found to
consistently increase upon chain scission of amide groups and carboxylates (N-C=O;
C=O) at 286.4 eV which may indicate new conformation of the polymer chain [159].
Furthermore, complex alterations in the aromatic structures were found around 293 eV

Chapter 4
88
and 295.9 eV. This effect corresponds to π-π* shake-up and σ*C-C resonance transitions
which may indicate the presence of re-configured structures and potential molecular
deterioration [137, 170, 178].
Figure 4.11: XPS C1s high resolution of water plasma modified membranes.
The detection of aromatic π-π* shake-up and σ* C-C resonance transitions could also be
an indication of loss of selectivity once aromatic rings were affected once selectivity is
dependent on intact aromatic structures [32]. On the other hand, the presence of
resonance transitions has also been reported as an indicative of presence of aromatic
structures [65, 137]. Therefore the chemical reconfiguration detected by XPS analysis
also suggests alterations of the surface energy, which were caused by plasma re-
depositions of the etched materials. Such chemical alterations may also promote

Chapter 4
89
hydrophilicity increase once the reconfigured polymer backbone may exhibit reoriented
oxygen containing species at the outermost layers.
In order to assess hydrophilicity changes, water contact angle analysis was performed
and values for the series of plasma treated samples are reported in Figure 4.12. As
expected, the water contact angle for all plasma modified membranes was significantly
reduced. With water plasma at 10 W and 1 min, the contact angle decreased from 46.6 ±
3.0o (control) to 17.3 ± 3.0
o. After 1 min the contact angle continued to decrease, with
some oscillations with increasing duration, but still contact angles remained lower than
the original sample. At 80 W, the contact angles were also decreased and were varied
between 15.7 ± 2.5o to 25.9 ± 5.7
o. Helium plasma at 10 W similarly showed sustained
decreased contact angle with increasing duration from 13.3 ± 5.0o after 1 min down to
10.1 ± 2.0o after 5 min of plasma duration. At 80 W, similar consistency was found with
increasing duration from 16.6 ± 2.5o after 1 min to 11 ± 2.2
o after 5 min of plasma
treatment duration.
Competitive processes between etching and re-deposition have led to hydrophilicity and
also morphological alterations as previously discussed. Resultant hydrophilicity of the
outer modified layers is however, influenced by both morphology [179] or chemical
changes [180]. Some of the roughness values as presented in Figure 4.12 were well
correlated to decreased values of the contact angles. The contact angle decrease was
correlated with the decreased surface roughness, as for the water plasma treated samples
at 10 W and between 0 and 1 min.
Meanwhile, beyond 1 min, roughness values were slightly lowered than or similar to the
original sample. Overall, the effect of increased hydrophilicity may be correlated to the
chemical nature of the modified surfaces. Helium plasma at 10 W similarly showed
sustained increased hydrophilicity compared to the original membrane, but there was
less roughness variability. Specifically, decreased contact angles were more correlated
with reduced roughness for 1 and 2 min durations, with stronger re-depositions
processes occurring after 5 min. However, much like the water plasma, the decreased
contact angle did not occur in turn with an equally significant change in roughness
leading to the conclusion that plasma was having a stronger influence on the surface

Chapter 4
90
chemistry. All membranes were more hydrophilic after plasma treatment which may
lead to improved organic fouling resistance since hydrophilicity is an important index
for antifouling properties of membranes [12]. The optimum conditions were found for
helium plasma at 10 W which showed enhanced hydrophilicity and also flux
enhancement. However, although such conditions yielded a highly hydrophilic surface,
the rough surface morphology may not be resistant to colloidal foulants once
contaminants can be encrusted in between the protusions of a rough surface [181, 182].
At 80 W, hydrophilicity was also seen to be consistently reduced, but uniquely at this
higher power treatment contact angles were very well correlated to reduced roughness.
In this case, hydrophilicity was better correlated also with morphology where roughness
was significantly reduced, as well as contact angle. Comparing to flux data in Figure
4.2, we see that a more hydrophilic membrane does not necessarily mean higher flux,
where only helium at 10 W showed fluxes increasing due to plasma. The highest flux
achieved was the helium 10 W membrane treated for 5 min, where uniquely an
increased roughness was observed as well as increased hydrophilicity. Therefore, the
rougher aspect combined with the hydrophilicity achieved with low contact angle, led to
favored water transport across modified membranes. Such result is in agreement with
other surface modification techniques, such as grafting of hydrophilic moieties via
plasma and chemical routes that increased roughness upon surface hydrophilization
with reduced contact angle, which resulted in flux enhancement [42, 139, 183, 184]. On
the other hand, flux decline in this study may be associated with both drying impact as
previously discussed and excessive re-depositions which potentially increased internal
PA crosslinking for stimulated by UV light from the RF plasma generated as described
in Chapter 2 [144, 183].

Chapter 4
91
Figure 4.12: Comparison of contact angle and roughness values with increasing plasma
treatment durations. Each value from contact angle and roughness represents the mean
of three measurements in the sample associated with their estimated standard error.
4.2.3 Summary
Sufficient data on flux and salt rejection changes with plasma treatment, together with
chemical and physical characterization, enabled a discussion on the possible impact and
modification mechanisms of the plasma treatment on the surface properties. The results
and key findings are summarized:
1. Inert gas plasma such as helium has been shown to be beneficial in modifying
PA material structure at low power density and improved water transport.

Chapter 4
92
2. Helium plasma increased membrane flux by 11% with a 5 min treatment at the
lower excitation power of 10 W, without significant loss in salt rejection. This
enhancement was attributed to balanced reactions between etching and re-
deposition mechanisms which resulted in a combination of resulting surface
roughening and hydrophilization.
3. Higher power density lead for both gases to significantly reduced membrane
flux, and for water plasma to physical damages across the surface of the
membranes leading to loss of salt rejection with exposure time. Surface
smoothing has been shown as an effect of excessive re-deposition mechanisms
which may have led to increased mass transfer resistance and therefore reduced
water permeation.
4. Re-deposition mechanisms were detected with C1s high resolution in XPS
analysis with significant increase of band 287.9 eV attributed to re-depositions
binding at the vicinity of amide groups.
5. Surface hydrophilization was detected by increased N/C ratio and C1s high
resolution in XPS analysis, and reduced contact angles in all plasma
treatments. However, at low power densities the hydrophilization was
influenced by chemical changes while at high power densities contact angles
were more correlated to reduced roughness and therefore more influenced by
morphology alterations.
6. The salt rejection drop noticed after water plasma treatment was correlated to
degradation of aromatic structures from the amide groups detected with
reduced 3300 cm-1
band in the FTIR analysis and excessive bond dissociations
of the amide groups and simultaneous formation of bands associated with π-π*
shake-up resonance peaks.
As in this study desalination results were also under the influence of membrane pre-
conditioning, further investigation of plasma impact on membranes without pre-
conditioning step were assessed.

Chapter 4
93
4.3 Surface modification with argon plasma: investigation of plasma mechanisms
on TFC membranes
In this Section, correlations between altered surface properties associated to plasma
mechanisms and desalination performance were investigated considering the impact of
the plasma under the influence of preservative materials. The purpose of exposing the
membranes this time to argon plasma in comparison to the helium and water plasma just
presented is to i) confirm the effects associated with inert gas plasma observed for
helium where positive improvement to water flux was uniquely seen for the inert gas,
and ii) establish the basis performance of plasma polymerization utilizing argon carrier
gas which is to be presented in Chapter 5.
4.3.1 The impact of argon plasma treatments on membrane performance
The impact of the plasma treatments on the performance of the pre-conditioned
membranes under different plasma dose matrixes was first investigated. Model saline
water permeation results, shown in Figure 4.13, indicate that the plasma treatments led
to lower flux decline compared to fresh control membranes. Also, the flux of fresh
control membrane was 60% higher than of the pre-conditioned control membrane.
However, increasing the excitation power to 80 W and 15 min of duration significantly
enhanced the flux while compromised the membrane integrity. The salt rejection trends
indicated a progressive decline with increasing power density. The salt rejections were
found to decrease from 98% for the control membranes down to 6% after 15 min and 80
W. Physical damage caused argon plasma by excessive etching of the PA structure is
most likely the cause of this loss of performance due to increased gas molecules -
surface collisions promoted by high power densities [124].

Chapter 4
94
Figure 4.13: Flux and salt rejection for control and pre-conditioned plasma modified
membranes. Cross-flow desalination test conditions: 15 bar inlet pressure and 2,000
ppm NaCl solution at 25oC. The displayed data from flux and salt rejection represents
replicates associated with their estimated standard error of the mean.

Chapter 4
95
Conversely, as seen in Figure 4.14, plasma treated membranes without pre-conditioning
led to consistent flux enhancement for treatment durations between 1 and 5 min, while
rejection remained essentially unchanged compared to the fresh control membrane
materials. However, beyond 15 min of treatment, clear reduction of flux relative to fresh
control membrane were found at all tested power densities. Specifically, at 10 W, the
flux relative to the control membrane (44.9 ± 1.2 L.m-2
.h-1
) was increased by 22% and
5% for treatment durations, at 54.6 L/m2.h and 47.1 L.m
-2.h
-1for 1 and 5 min,
respectively. Past 5 min, the permeation was found to plateau at 43.4 L.m-2
.h-1
, to a
nominal value ~3% lower than that of the control membranes. A similar pattern
occurred at 50 W, where the flux increased by 11% and 20% at 49.8 and 53.3 L.m-2
.h-1
for 1 and 5 min of treatment respectively, prior to dropping progressively by 43% at
24.9 L.m-2
.h-1
below reference flux at 30 min of plasma exposure. At 80 W, the flux was
again increased by 20% with increasing duration to 5 min of treatment, prior to
dropping dramatically by 76% after 30 min of treatment compared to the control
membranes.
Interestingly, the salt rejection across the series of treated membranes at 10 W was
found to be maintained between 98% and 96.9% at 1 and 5 min and slightly declined to
96.7% at 15 min which is within range of acceptable brackish water RO membranes
performance as reported in the literature [162]. However, with increasing duration to 30
min, salt rejection significantly declined to 91.5%. This result suggests that the
membranes were stable at low power densities for this plasma regime. On the other
hand, increasing the excitation power to 50 W led to a significant reduction of salt
rejection for plasma durations beyond 5 min. High salt rejections were only maintained
around 97.5 % between 1 and 5 min, prior to decreasing to 95.7% and 59% after 15 and
30 min of plasma duration respectively. An increase of the plasma power to 80 W
strongly accentuated the behaviors observed at 50 W. The salt rejections at short
treatment durations between 1 and 5 min were slightly reduced to 97% and 96.2%
respectively, while longer treatment durations, of 15 and 30 min led to impractically
low salt rejections of 90.5% and 5% respectively. In comparison to pre-conditioned

Chapter 4
96
membranes treated with helium and argon plasmas results in Figure 4.2 and Figure 4.13,
show increasing fluxes relative to the pre-conditioned membranes by~60%.
Figure 4.14: Flux and salt rejection for fresh control and plasma-modified membranes.
Cross-flow desalination test conditions: 15 bar inlet pressure and 2,000 ppm NaCl
solution at 25oC. The displayed data from flux and salt rejection represents the mean of
four replicates associated with their estimated standard error.

Chapter 4
97
Also similarly to fresh argon treated membranes, rejections of pre-conditioned
membranes were largely unaffected up to 5 min of treatment at any powers. Pre-
conditioned membranes were shown to be less resistant to the plasma etching after 15
min. On the other hand, fresh membranes showed consistent stability at low power
density which enabled to handle etching effects up to 30 min at 10 W, 15 min at 50 W
and 5 min at 80 W. Water soluble coatings added by the manufacturer to enable storage
of the membranes in dry conditions, appear to have a beneficial effect of protecting the
membrane in the vacuum plasma condition. This coating still enabled flux improvement
with inert gas plasma but may have acted as a barrier to excessive etching.
In order to understand the processes behind these changes and compare to the helium
plasma, it is necessary to further study the surface properties of the modified
membranes and the overall energy absorbed by the membrane materials. This will be
evaluated by surface characterization.
4.3.2 Characterization of surface properties after argon plasma treatment
4.3.2.1 Morphology assessment after argon plasma treatment
Surface roughness was analyzed by SEM and AFM to evaluate the physical impacts of
plasma on the morphology of the membranes caused by the suspected competing
etching and re-deposition mechanisms within different plasma regimes. As seen in
Figure 4.3a and 4.3b, morphology of control membrane was found to be irregular and
rough, which were attributed to the fabrication mechanisms of these materials by IP.
During IP of PA, diffusion of the diamine monomer molecules across the nascent thin-
film towards the organic phase were shown to produce crosslinked protrusions, giving
rise to a micron-scale rough surface morphology, characteristic of this type of
membranes [84]. Figure 4.15 shows SEMs of plasma treated membranes resulted in
different types and varying levels of surface texturization compared to control
membrane Figure 4.3a. Interestingly, short plasma treatment durations, up to 5 min, at
10 W, were generally flattening these protrusions generating a smoother layer. This
layer was starting break down for longer treatment durations. Although, increasing the

Chapter 4
98
plasma power density accelerated and accentuated the process, the same morphological
trend was observed at 50 and 80 W. A quantification of the level of texturization was
obtained from measuring the average roughness (Ra) for the samples, calculated from
AFM maps, are presented in Appendix 1 Figure A-4.1. The calculated values were
plotted in Figure 4.16a in order to further illustrate the morphological variations. The
roughness of the 10 W plasma treated membrane series initially decreased by nearly 35
% after 1 min of treatment, from an initial 60.5 ± 2.5 nm to 39.2 ± 2.8 nm, then
plateaued around 45 nm for treatment durations greater than 5 min. The sharp drop in
roughness is consistent with the flattening and fusing of protrusions observed during
SEM investigations. As found at 10 W, the roughness at 50 W series was sharply
reduced for short treatment durations between 1 and 15 min down to an average value
of 43.1 ± 3.5 nm. The roughness was however found to plateau around 50 ± 3 nm, at a
value slightly higher than that of the 10 W series between 5 and 30 min of plasma
duration. At the highest power density of 80 W, the roughness was found to steadily
reduce with increasing treatment duration. Similarly at 10 and 50 W, between 15 and 30
min of treatment, the roughness was found to significantly decrease from 51.6 nm ± 6.0
nm to 40.6 nm ± 4.0 nm. A quantification of the level of texturization was obtained
from measuring the average roughness (Ra) for the samples, calculated from AFM
maps, are presented in Figure 4.16b and Appendix 1 - Figure A-4.2. The roughness of
the 10 W plasma treated membrane series initially decreased by nearly 35 % after 1 min
of treatment, from an initial 60.5 ± 2.5 nm to 39.2 ± 2.8 nm, then plateaued around 45
nm for treatment durations greater than 5 min. The sharp drop in roughness is consistent
with the flattening and fusing of protrusions observed during SEM investigations. As
found at 10 W, the roughness at 50 W series was sharply reduced for short treatment
durations between 1 and 15 min down to an average value of 43.1 ± 3.5 nm. The
roughness was however found to plateau around 50 ± 3 nm, at a value slightly higher
than that of the 10 W series between 5 and 30 min of plasma duration. At the highest
power density of 80 W, the roughness was found to steadily reduce with increasing
treatment duration. Similarly at 10 and 50 W, between 15 and 30 min of treatment, the
roughness was found to significantly decrease from 51.6 nm ± 6.0 nm to 40.6 nm ± 4.0
nm.

Chapter 4
99
Figure 4.15: Surface morphology performed by SEMs for the plasma powers (10, 50
and 80 W) and treatment durations (1, 5, 15 and 30 min) series. All scale bars represent
5 µm.
Irregular morphology, as expected for the control membrane material. It is interesting to
see that across the power densities tested in this work, increasing surface uniformity
was observed through sharper AFM profile peaks for all short treatment durations (1
min shown here for example). However, as shown in Table 4.2, the FWHM determined
from each of these distributions, which correlates the broadness of the height
distributions, revealed that these profiles become more irregular upon reaching 30 min
of treatment.

Chapter 4
100
Table 4.2: FWHM values from morphology height distribution of argon plasma
modified membranes.
Plasma duration
(min) 10 W 50 W 80 W
0 Control 0.17 - - -
1 0.09 0.11 0.12
5 0.11 0.14 0.11
15 0.12 0.13 0.13
30 0.13 0.16 0.11
The height distribution analysis suggests that the plasma treatment, while initially
smoothing the membrane surface and increasing protrusion uniformity, ultimately
reduced for longer plasma durations the surface uniformity. These results therefore
indicate that plasma treatments performed at 10 W significantly smoothed and
uniformly modified the surface area before the surface roughness increased again. This
is a critical point, since the flux of these membranes were improved without loss of salt
rejection suggesting that smoothening the membrane surface had a positive impact by
improving flux performance of the membranes, as illustrated in Figure 4.14 for plasma
treatments up to 5 min. These trends also suggest that performance was largely
independent of power density, at similar treatment durations. However, this criterion
alone is not sufficient to explain the permeation behaviors of the membranes treated at
high power density (80 W for 15 min or longer), also found to be smoother but
exhibiting poor performance. Further chemical analyses were therefore performed to
better understand the nature of the surface properties changes.
Although not investigated within the scope of the present work, another possible benefit
of smoother more uniform surfaces could be improved fouling resistance to colloidal
matter, where researchers have attributed reduced fouling to reduced surface roughness
[11, 185].

Chapter 4
101
Figure 4.16: Morphology analysis: a) Average roughness (Ra) calculated from AFM
surface roughness maps and b) height distribution histogram of the inset were calculated
from 5 x 5 µm AFM maps, indicated by values of Z and ƿ represents the density or
histogram-frequency of respective height values. Each value from roughness represents
the mean of three measurements in the sample associated with their estimated standard
error.
4.3.2.2 Chemical assessment after argon plasma treatment
Chemical analysis using XPS C1s deconvolutions were performed since carbon bonds
are the most vulnerable sites during plasma treatment. For instance, argon excited
species exhibit high dissociation bond energies in the order of 11.7 eV, which was
demonstrated to be sufficient to induce various bond scissions, including C-C (3.7 eV),
C-H (4.7 eV), C-N (3.2 eV), C-O (3.7 eV), N-H (4.0 eV), O-H (4.8 eV) and C=C
aromatic bonds (5.5 eV) [186, 187]. Figure 4.17a, presents a similar impact of plasma
etching as found in water plasma with the peak at 285.9 eV consistently decreased with
increasing power density. The peak 285.9 eV dropped by nearly 30% (Figure 4.17a)
relative to the control membrane material while the peak at 287.5 eV (Figure 4.17b) was
shown steadily increased by 8% compared to control membrane.

Chapter 4
102
These trends suggest that saturated C-N and/or C-O bonds shown in Figure 4.17a are
under these conditions the most vulnerable bonds. However, it is most likely that C-O
bonds were cleaved in the process because these groups are commonly found in the
outermost regions of the PA layer potentially associated with preservative materials
bound electrostatically, as discussed elsewhere [171, 172]. As previously mentioned in
Chapter 1, the native control membranes are multi-layer composite materials and the
active top layer is coated with a thin (nanoscale) preservative material which protects
the membrane during dry storage and shipping [171]. These materials, although
undisclosed by manufacturers, involve chemistries based on ester or anionic surfactants
as determined by probing the commercial membranes using FTIR or XPS analysis [171,
172]. The resulting surface reconfigurations may also be associated with rearranged
ionized molecular groups from the material etching and re-deposition processes caused
by the plasma glow [188]. Unsaturated groups (Figure 4.17b) were potentially
rearranged and re-attached along with vaporized materials indicating specific re-
deposition mechanisms.
Figure 4.17: Analysis of plasma functionalization mechanisms with XPS C1s high
resolution of atomic ratio a) peak 285.9 eV reduction: C-O; C-N/C-C from peaks
285.9/284.4 eV and b) peak 287.6 eV increase: C=O/C-C from peaks 287.6/284.4 eV.
The pictures inserted in the figures are a generic illustration of how the functional
groups in C1s are affected by plasma treatment.

Chapter 4
103
The C1s deconvolution in Figure 4.18 shows additional peaks towards 300 eV which
can be attributed to the formation of polar groups upon rearrangement resulted from
etching and re-deposition mechanisms [159].
Figure 4.18: High resolution XPS C1s peaks of the argon plasma modified membranes.
These peaks were found at 290.2 eV, indicating ester carboxylic groups. Furthermore,
complex alterations within the aromatic structures were found to occur for the most at
290.8 eV and 295.8 eV. These resonance transitions transition bands were also found
with water plasma treated membranes which also may indicate the presence of re-
configured structures and potential molecular deterioration [188, 189] which led to loss
of selectivity due to a reduction of the macro-molecular weight of the polymer through

Chapter 4
104
breakage of structural bonds from within the PA. Therefore, etching may also play a
significant role on the altered surface properties and the relative intensity of the etching
process was shown to influence the density of removed materials leading to different re-
deposition processes. The chemical reconfiguration detected by XPS analysis also
suggests potential alterations of the surface energy, which were caused by plasma re-
depositions. An assessment of surface energy involving surface charge and wettability
is discussed in the following Section.
4.3.2.3 Surface energy assessment and the role of surface charge on wettability
Figure 4.19 shows the surface charge as a function of pH measured by streaming
potential technique. In all cases, increasing pH leads to an increased negative surface
charge. For plasma treated membranes, the magnitude of the negative charge also
increased. Such effect is commonly achieved during plasma modification of polymers
that is attributed to the effect of UV radiation which promotes crosslinking with re-
deposited materials that may exhibit negatively charged species [190]. The control
membranes exhibited a relatively smooth negative curve profile, reaching -24 mV at pH
8 which is similar to PA membranes reported previously [172]. Plasma treated
membranes exhibited an overall accentuated change towards negative charge that
resulted in a streaming potential of -60 mV at pH 8. At 10 W, the membrane treated for
5 min showed a significant negatively charged surface reaching -63 mV at a pH of 8.
On the other hand, after 1 min of plasma treatment a slight reduction of the negative
charge with appearance of an IEP at a pH of 3.7 reaching around +5.0 mV could be
observed. The presence of an IEP point may indicate that a low density of acidic species
was also re-deposited. However, acidic species were not detected across the XPS C1s
analysis. The surface charge analysis for the membranes treated at 50 W showed a
stronger chemical influence with increased negative charge. The negative charge was
significantly increased at the shortest treatment duration reaching -24 mV similar to the
control membrane with the longest 30 min treatment reaching -75 mV at a pH of around
8.0. On the other hand, at 80 W, surface charge values also presented increased negative
profiles however, less negative than at 10 or 50 W. The highest negative charge for the

Chapter 4
105
80 W series reached -45 mV at 30 min of treatment. Furthermore, the IEP of these
membranes was found to lie at 3.7, similarly to that obtained at 1min; 10 W. Therefore,
re-depositions suggested by the XPS analysis gave rise to an increased density of
hydrophilic species with ionizable functional groups reaching optimum OH- and Cl
-
ions adsorptions.
Figure 4.19: Streaming potential with increasing excitation power at 10, 50 and 80 W
power input and for 1, 5, 15 and 30 min plasma durations. The repeatability of all zeta
potential measurements varied ±2 mV.

Chapter 4
106
Figure 4.20 shows wettability of the plasma-modified surfaces which investigated
functionalization reactions. The hydrophilicity was significantly increased for all plasma
treated membranes. At 10 W, the water contact angles were found to decrease, with
increasing plasma treatment duration from 60.8 ± 5.0o
for the control membrane, down
to 23.5 ± 9.0
o after 30 min of treatment duration. A consistent and similar trend was
also found at 50 W in contact angle measurements. Water contact angles were reduced
at 50 W from 32.2 ± 9.0
o to 19.4
o ± 9.0 for 1 to 30 min of treatment duration.
Furthermore, the water contact angles were further reduced at 80 W when compared to
10 and 50 W, down to 29.4o
± 3.0 and 15.2 o
± 4.0 between 1 and 30 min of treatment
duration respectively. Therefore, the hydrophilicity increase detected by the reduced
water contact angles can again be attributed to chemical reconfigurations with polar
species as previously discussed within the XPS and streaming potential Sections [191].
These chemical changes may also contribute to a potential anti-fouling property on the
PA material where further long-term tests are required [71, 192].
4.3.2.4 Stability of water contact angle
The stability of the water contact angle values was assessed on the same membrane
materials after 5 months of storage, and is shown in Figure 4.20. The results indicated
strong wettability decay at lower power density over time while at 80 W, above 15 min
duration, wettability was shown more stable. Similar investigations have reported
hydrophobicity recovery upon RF plasma treatment of polymers. The wettability decay
was therefore correlated with the reorganization of polar functionality on the surface
with the passage of time, where work on plasma modified membranes attributed this to
storage condition upon exposure with air [177, 193, 194]. However, for the contact
angle measurements, membranes were kept dry while in practical terms, RO membranes
would be continuously subjected to water and high pressure would therefore be less
likely to be impacted by hydrophobicity recovery. For instance, helium plasma treated
PES membrane were kept immersed in water for 3 weeks and showed that hydrophilic
surfaces were quite stable, exhibiting static contact angles variations of only ±2o
over
this period [139]. Therefore, as previously discussed in the water and helium plasma

Chapter 4
107
Section contact angles may also be influenced by morphology. This combination of
results strongly suggests that the plasma regime at 10 and 50 W tended to promote more
chemical reactions while 80 W was primarily governed by the physical surface
properties promoted by etching and re-deposition mechanisms. Therefore, an in depth
analysis of the degree of etching as performed in the next Section, was required
necessary in order to better understand the impact of the plasma glow on the upper
layers of the PA material.
Figure 4.20: Investigation of hydrophilicity alterations by reduced water contact angles
with increasing power density. Each value from contact angle represents the mean of
three measurements in the sample associated with their estimated standard error.

Chapter 4
108
4.3.2.5 Analysis of the effect of etching on surface properties
ATR-FTIR analysis was used to investigate the etching mechanisms occurring during
these different plasma regimes, by considering the presence and alteration of the nascent
preservative materials. This investigation allowed accessing the etching behaviors
across the different surface layers of the materials, including ester or anionic surfactants
which may have shielded the PA internal layers and limited the depth of penetration of
the glow. In Figure 4.21, the FTIR spectra of the control membranes were compared to
membranes both as supplied and washed with deionized water, pre-treatment step
performed in order to remove preservative materials. The presence of a band at 1043
cm-1
relates to C-O and C-C stretching vibrations which may correspond to the
previously mentioned coated preservative materials electrostatically attached onto the
PA layer [171, 173]. This band, present on the native membrane, was absent on the
spectra corresponding to the washed membrane suggesting that preservative materials
was indeed easily removed upon gentle washing.
The membranes subjected to plasma glows were not washed prior to treatment, and
therefore the band at 1043 cm-1
was chosen as a reference to access the degree of
etching. Spectral analysis of the plasma modified membranes at 10 W (Figure 4.21b)
showed slight alterations of absorbance of the band at 1043 cm-1
. Therefore, this result
indicates that the etching was not intensive enough to completely remove the as
supplied preservative material. The degree of etching on the other hand, appeared to be
intensified at 50 and 80 W. The FTIR spectral analysis presented in Figure 4.21c and d,
showed that the integrated areas at the band at 1043 cm-1
significantly decreased by 50%
with 30 min of plasma treatment. This analysis suggests that at 50 and 80 W more
materials tended to be removed and therefore re-deposited. The plasma etching involves
bond scission mechanisms [145] which could potentially increase free-volume density
and physically affect the surface such as potential thinning or formation of defect across
the PA layer.
In order to assess the penetration depth of the etching mechanisms, XPS elemental
quantitative analysis, was able to probe down to 10 nm within a surface, was performed

Chapter 4
109
to investigate sulphur content across the surface of the membranes (Appendix 1 -Table
A-4.3). The % of sulphur is normally found at 0.09 +/- 0.03 for such membrane
materials and is attributed to sulfonic groups within the underlying Psf ultra-filtration
supporting layer below the PA. XPS elemental analysis revealed that the sulphur
content progressively increased at all power densities and with plasma treatment
duration. At 10 W, the sulphur at% reached 0.36 at% after 30 min, which is nearly 4
times that of the nascent material (Appendix 1 - Table A-4.3).
Figure 4.21: Degree of etching by FTIR analysis of the band 1043 cm-1
with increasing
excitation power: a) analysis between control membranes: washed membrane with
deionized water (for 1 h) and a membrane with preservative materials, b) modified
membranes at 10 W, c) at 50 W and d) at 80 W. Normalization was performed at 1240
cm-1
.

Chapter 4
110
Consistently, at 50 and 80 W, sulphur at% was increased by nearly 10-fold that of the
nascent material. Furthermore, the rate of increase was found to be larger with
increasing excitation power suggesting stronger etching of the PA layer at higher power,
which could lead to degradation or thinning of the material as previously discussed in
morphology analysis. A strong correlation was found between sulphur at% increase and
salt rejection decline as shown in Figure 4.22. This correlation indicates physical
degradation of PA layer caused by plasma etching which was strong enough to reveal
the Psf between the tortuous profiles of the PA layer and therefore likely rupture locally
at the nanoscale the PA layer. Recent study on the depth profile of an oxidized TFC
membrane performed radiofrequency pulsed glow discharge time of flight mass
spectrometry (RF-GD-TOFMS) in order to detect oxidized species across PA layer.
Elemental analysis was performed upon surface sputtering with argon plasma at 13.56
MHz using is a similar system used in this work [195]. Analysis performed in control
samples detected increased sulphur elements from Psf under layer with increasing
sputtering duration which is a comparable trend found in this work for modified
membranes under the influence of plasma etching.
Such etching mechanisms, valid for the different plasma regimes, led to an empirical
understanding in terms on surface morphology, and permeation is therefore found to be
improved for shorter treatment durations due to the smoother and thinner active layers
[196]. On the other hand, the permeation declines, for longer treatment durations, are
likely caused by re-deposition mechanisms which could have led to densification and to
a reduction of the free-volume across the PA [81]. The degree of etching potentially
generated different densities of re-deposition regimes and appeared to be strongly
correlated to the applied power density.

Chapter 4
111
Figure 4.22: Correlation between sulphur S2p at% and salt rejection with increasing
power and duration. Each value from sulphur at% represents the mean of five
measurements in the sample associated with their estimated standard error of the mean.

Chapter 4
112
4.3.3 Summary of argon plasma exposure
1. Flux enhancement achieved at low power densities and short durations (1 and 5
min) shown during membrane testing were primary driven by chemical
changes that promoted hydrophilicity confirmed with water contact angle and
streaming potential analysis; Also surface thinning due to concurrent material
removal and re-deposition mechanisms was evident from FTIR and XPS C1s
and elemental sulphur analysis.
2. XPS C1s, FTIR and elemental XPS analysis showed plasma etching and re-
deposition mechanisms are intensified with increasing argon plasma power -
the more removed materials also lead to more re-deposited materials;
3. All modified membranes treated with ≥ 15 min of duration, led to flux
reduction due to mechanisms which strongly altered morphology and promoted
excess of re-depositions.
4. At 80 W and long durations ≥ 15 min, significant reduced water contact angle
(hydrophilicity) by ~30% were attributed to intense etching and re-deposition
mechanisms causing significant physical changes on the surface while at 10
and 50 W increased hydrophilicity was attributed to chemical alterations.
Similar conclusions correlating increasing excitation power and physico-
chemical mechanisms were obtained for helium and water plasma modified
membranes.
5. Selectivity drop was associated with excessive etching which was detected by
XPS and FTIR at high power densities. Such effect potentially damaged the
aromatic structures detected by XPS with π-π* shake-up and σ*C-C resonance
transitions also found with water plasma treated membranes associated with
loss of salt rejection. Plasma etching at high power densities was shown to
physically affect the surface with potential thinning or formation of defect
across the PA layer also detected with increased % of sulphur element by XPS
analysis.

Chapter 4
113
4.4 Analysis of the impact of different plasma treatments in this study
As previously discussed in Chapter 2, one of the main targets in modifying the surface
of TFC membranes is to produce new materials with anti-fouling properties. The
challenge with membrane operation is primarily related to performance loss over time
due to the strong adherence of both organic and colloidal contaminants with surfaces of
membranes upon compaction. The targeted surface properties, generally considered as
favorable for low fouling or enhanced and facilitated cleaning of surfaces, are therefore
associated with increased hydrophilicity and reduced surface roughness.
All plasma treatments performed in this study led to significant enhancement of
hydrophilicity by up ~ 70% and to different degrees of surface roughness. Regardless on
the nature of the plasma reactant gas, the excitation power was a critical parameter to
intensify the etching impact which in turn also intensified re-depositions of removed
materials. Any reactant gas at low excitation power (10 W) and short durations (up to 5
min) led to altered surface properties without significantly compromising the salt
rejection. However, at 10 W some differences in the efficiency to reduce water contact
angle and roughness were found to occur.
Pre-conditioned membranes exhibited water contact angles ~18% lower with helium
plasma than with water plasma treatment. When helium plasma is compared to argon
plasma treatments, water contact angles were ~37% lower than that of the not pre-
conditioned argon treated membranes. In terms of surface morphology, at 10 W of
excitation power the roughness of the membranes was reduced upon argon treatment
while roughness was also found to be reduced by up ~33%, compared to 20% for water
plasma and only 3% with helium plasma. The significant roughness decrease seen upon
argon plasma treatment is also related to the fact that the membranes were not pre-
conditioned and therefore more removed materials corresponding to the preservative
coating, were re-deposited, as demonstrated in this chapter, across the surface. Part of
the flux enhancement achieved at low powers and for short durations could also be
related to surface thinning. Surface thinning, due to smooth surface etching may occur
for the near top-surface layers, which would in turn reduce water resistance and thus

Chapter 4
114
increase permeability. Also at 10 W, water plasma treatments were efficient to reduce
roughness which is potentially attributed to more intense etching mechanisms involved
with this reactant gas, which is known to generate free radicals.
In terms of membrane performance, specifically for water plasma treatment, salt
rejection significantly declined after only 5 min of duration and at high excitation power
of 80 W. Intense etching mechanisms for water plasma therefore was shown to degrade
PA layer upon reduced or disappearance of some of the PA nascent bonds. FTIR
analysis showed reduced absorbance of amide bands at 3300 cm-1
and C1s XPS analysis
showed disappearance of the peak at 286.1 eV corresponding to C-N bonds. Similar
impacts with inert reactant gases were only detectable with argon treated membranes
but only when subjected to pre-conditioning. Those membranes showed significant and
even higher impact on salt rejection after 5 min of duration, with the impact
progressively intensified with increasing excitation power. However, the impact of
etching associated with loss of salt rejection may potentially be reduced upon working
with membranes without pre-conditioning, i.e. with still a layer of preservative
materials present. The lower intensity etching was therefore attributed to the shielding
influence from this protective preservative layer across the surface of the PA thin film.
Similar bond scissions detected by C1s XPS analysis found for water treated
membranes at 80 W was found only after 15 min at high excitation power where
nascent bond was totally disappeared. Thus, significant salt rejection decline only
occurred after 15 min of duration at high excitation powers, where the PA was most
harshly attacked by the free- radicals induced by plasma.
The optimum conditions therefore were shown by the treatment with inert gas plasmas
at low power densities once membranes were more permeable and also exhibited
significant increased hydrophilicity and reduced roughness.

Chapter 4
115
4.5 Conclusions
The work presented investigated the impact of plasma conditions on the performance of
commercially available RO TFC membranes, and assessed the threshold of membranes
resistance to etching and re-depositions mechanisms. These results provided significant
evidence of altered surface properties such as roughness, charge and hydrophilicity
which enabled to suggest potential antifouling properties according to the surface
characteristics of the modified membranes. The benefit of nascent preservative
materials layer was shown to shield and simultaneously functionalize the PA surface
which led to improved performance. The significance of this chapter is to show a
threshold and the real impact of water, helium and argon plasmas on the PA layer for
the first time and provide insights about the penetration depth of the plasma
mechanisms on the bulk PA nanoscale network.
The findings in this study has implications for sample pre-conditioning, characterization
of surface properties and etching limitations on the PA layer when working with plasma
polymerization in Chapter 5.

116

Chapter 5
117
5. Plasma polymerization across poly(amide) thin-film
composite membranes
In this chapter, low pressure plasma was explored using an AC plasma generator to
control the deposition of functional moieties across the TFC membrane surface. The
surface charge was readily tuned according to the nature of the used monomer and
controlled by adjusting plasma process parameters. The monomer 1-vinyl(imidazole)
(VIM) was employed to deliver positive charges while the maleic anhydride (MA) to
enhance negative charges. The practical assessment of the performance of the
membranes included essential desalination tests to prove working membranes, as well
as the characterization of the surface properties of the membranes. Furthermore, the
reactivity of the amine-based functional groups introduced upon polymerization of the
VIM monomer molecules was demonstrated through the attachment by coordination of
Ag nano-particles (NPs). The AgNPs enriched membranes were further tested for their
anti-bacterial functionality. In the last Section, experiments targeted to improve
desalination performance using membranes fresh control membranes without a pre-
conditioning step in order to improve desalination performance. The range of probe
monomers used in this work demonstrated the versatility of film formation onto PA
surface with the effect of opposite surface charges promoted by the nature, density and
bond dissociation energies (BDE) of the functional groups introduced across the
surface.

Chapter 5
118
5.1 The impact of AC argon plasma on pre-conditioned TFC membranes
In this Section the impact of argon-only plasma was first investigated using pre-
conditioned TFC membranes in order to understand potential sources of surface
properties changes. Argon gas is essential to generate plasma in polymerization
processes in order to avoid monomer degradation [62]. The membrane pre-conditioning
consists in washing the samples with DI water following by drying in air prior to the
surface modification in order to remove preservative materials. The conditions of the
argon plasma presented in this chapter were different to those in Chapter 4 since the
treatments in previous chapter were performed on a RF system at higher excitation
powers and gas environment pressure (details in Chapter 3 - Section 3.2.2). However,
the potential chemical and morphology alterations were still assessed considering the
same nature of the plasma gas used. Argon plasma was performed at fixed parameters
(2 W and 5 Pa) and durations i.e. 5, 9 and 15 min, mimicking the conditions of the
plasma polymerization process presented in Sections 5.2 and 5.3.
5.1.1 The impact of AC argon plasma on the performance of the TFC membranes
As previously seen in Chapter 4, the control membranes under the effect of drying
conditions showed flux declined by 70% compared to fresh control samples. Membrane
performance with argon plasma presented in Figure 5.1 shows that membranes exposed
to argon plasma alone did not show superior decline than the pre-conditioned control
membrane. The flux of membranes exposed to argon plasma drops around 60 to 64%
which led to conclusions that flux was not declined by plasma. Therefore, as discussed
in Chapter 4, the impact on the water flux was more associated with the degree of
dryness of the material than with the plasma polymerization process. In terms of salt
rejection, the argon plasma without monomer did not affect the membranes selectivity
given that rejections were maintained in the range of 98 to 99% for all plasma durations
as shown in Figure 5.1. As the selectivity was maintained, it is suggested that argon

Chapter 5
119
plasma did not affected the integrity of the PA structure and therefore further
morphology and chemical analysis is required.
Figure 5.1: Permeation tests under 15 bar inlet pressure and 2,000 ppm NaCl solution,
27oC at pH 6.5 for series of controls membranes exposed to AC argon plasma and
process durations of 5, 9 and 15 min
5.1.2 The impact of AC argon plasma on the surface morphology of the TFC
membranes
Figure 5.2 shows SEM analysis performed on membranes exposed to argon plasma
alone in order to detect sources of morphology alterations. Argon plasma in this
experiment was shown to less affect the morphology of the PA as seen in similar argon-
only plasma presented in Chapter 4. The difference between the gas plasmas lies in their
plasma systems, where Chapter 4 showed results using RF plasma while the system

Chapter 5
120
here utilised AC plasma. The etching impact of argon in an AC plasma generator is
lower than in RF. The mobility of ions and electrons in AC system is lower than in RF
due to less intense collisions between gas phase and the treated substrate in order to
maintain the monomers integrity [62]. Therefore, while AC plasma is mainly suitable
for polymerisation, the RF system is mainly used for surface etching and cleaning [62].
However, further chemical analysis is required in order to confirm inertness of the
material upon argon exposure.
Figure 5.2: SEMs of pre-conditioned TFC membranes for series of controls membranes
exposed to AC argon plasma and process durations of 5, 9 and 15 min.
5.1.3 The impact of AC argon plasma on the surface chemistry of the TFC
membranes
ATR-FTIR analysis was performed in order to detect chemical functional group
changes after argon plasma exposure. Figure 5.3 shows amide I band stretching
vibration (C=O; C-C-N) at 1666 cm-1
, aromatic amide deformation vibration (N-H;
C=C) at 1609 cm-1
and amide II band stretching vibration (N-H; N-C) at 1541 cm-1
. As

Chapter 5
121
shown in Figure 5.3, no significant alterations were found in absorbance across the
studied bands for membranes exposed to argon plasma. Furthermore, surface charge
analysis was also assessed once in Chapter 4 argon significantly enhanced the negative
charges.
Figure 5.3: FTIR analysis of pre-conditioned membrane for series of controls
membranes exposed to AC argon plasma and process durations of 5, 9 and 15 min.
In Figure 5.4, streaming potential analysis showed that argon exposure slightly
increased the negative charges across all ranges of pH. The control membrane exhibited
zeta potential values close to zero at the acidic range and negative charges around -30
mV around neutral to alkaline pH range. The series of membranes exposed to argon
showed relative increased negative charges from -30 mV to -40 mV at pH 8; however
no IEP point was detected. The negative charges enhancement was also detected in
argon plasma treatment as seen in Chapter 4 but with a less intensity which is due to
lower etching provided by AC system used here.

Chapter 5
122
Figure 5.4: Streaming potential analysis for series of pre-conditioned controls
membranes exposed to AC argon plasma and process durations of 5, 9 and 15 min.
5.2 Plasma polymerization of VIM monomer using pre-conditioned TFC
membranes
5.2.1 The impact of plasma polymerization on the performance of the TFC
membranes
The first set of plasma polymerization tests involved VIM monomer on pre-conditioned
membranes. The performance of plasma polymerized membranes is presented in Figure
5.5. The water flux across the plasma polymerized membranes was significantly lower
by 77% than that of the fresh control membranes and 23% lower than that of the pre-
conditioned membranes. Also, the average flux obtained with plasma polymerized
membranes was about 44% lower than that of the argon-only exposed membranes
(Figure 5.1). In this regard, the impact on the water flux in polymerized membranes is
an association of the dryness of the material and the polymerization across the PA
surface.

Chapter 5
123
The salt rejection of the plasma polymerized membranes declined between 5 and 9 min
(95.5% and 95.7%) compared to 98% for the control membranes. At 15 min of process
duration, the rejection was found to decline down to 93.8%. In practical terms, this
means that the permeate salt concentration has increased by more than 3-fold as a result
of the plasma polymerisation. The drop in salt rejection suggests an association of
factors that influenced the PA microstructure. Evidence of the impact of plasma
polymerisation needs to be evaluated and both morphology and chemical alterations
were explored in this chapter.
Figure 5.5: Permeation test under 15 bar inlet pressure and 2,000ppm NaCl solution,
27oC at pH 6.5 for VIM plasma polymerized membranes using an AC plasma reactor
and polymerization durations of 5, 9 and 15 min.

Chapter 5
124
5.2.2 Characterization of the surface properties of the pre-conditioned plasma
polymerized membranes
5.2.2.1 Morphology assessment after plasma polymerization
Topographical analyses were performed by SEM and AFM on polymerized TFC
membranes in order to detect the morphology changes after plasma polymerization.
SEMs in Figure 5.6 show a smoothing effect consistent with increased plasma
polymerization process duration. Smoother surfaces became more evident between 9
and 15 min duration in contrast to the control membrane and membranes exposed to
argon-only as seen in Section 5.1.2.
A film rupture was detected for the polymerized membrane at 15 min of process
duration and more details of the cause and impact on the performance of the membrane
will be discussed in the following Section.

Chapter 5
125
Figure 5.6: SEMs of the pre-conditioned control membrane and pre-conditioned VIM
plasma polymerized membranes using an AC plasma reactor and polymerization
durations of 5, 9 and 15 min.
The smoothing effect was also observed from AFM analysis as shown in Figure 5.7.
The protusions were changed from high and sharp according to the scale bar to flattened
and rounded protusions shape with increasing duration. A decrease in surface roughness
occurred at longer plasma polymerization times. The average roughness (Ra) was
measured from three different locations across the surface of the membranes. The Ra of
the control TFC membrane was 24 ± 0.2 nm. A slight decrease of roughness was found
for the polymerized membranes after 5 min of duration with Ra of 22 ± 0.3 nm and 9
min of duration with Ra of 23 ± 0.5 nm. However, more significant smoothing effect
was found for polymerized membranes after 15 min of duration with Ra of 17 ± 0.4 nm.

Chapter 5
126
Figure 5.7: AFM morphology analysis and roughness values of pre-conditioned plasma
polymerized membranes using an AC plasma reactor and polymerization durations of 5,
9 and 15 min.
Significant smoothed surface obtained after 15 min suggests potential thicker
polymerized layer on the surface which covered the re-entrances of the PA structure.
Furthermore, the smoothed surface also presented multiple film ruptures visible (~ 600
nm length) as shown in the SEM analysis (Figure 5.6). The depth of the ruptures was
not assessed due to the limitations of the 2D surface SEM analysis. However, the source
of these ruptures may be associated with internal stress caused by swelling and
constraint of the PA chains upon polymer expansion during polymerization growth
[124, 197]. As the film rupture was only visible after 15 min of the process duration, it
is presumed that a potential high degree of polymerization was obtained at this duration.
The degree of polymerization can be detected with chemical distribution and density of
amine functionalities associated with the film thickness and therefore, further chemical
analysis is required.

Chapter 5
127
5.2.2.2 Chemical assessment after plasma polymerization
Given that plasma polymerization ideally consists in the deposition of thin-films and not
in the treatment of bulk materials, the internal stress causing films rupture (Figure 5.6)
may suggest that polymerization growth may had propagated cracks into the underlining
layers of the PA material. The propagated cracks potentially resulted in the direct
exposure of Psf under layer, generating a similar etching effect as reported for RF argon
treatment in Chapter 4. Quantitative elemental analysis was performed with XPS in
order to evaluate bonds scission (Table 5.1). The XPS elemental analysis can probe
down to 10 nm in depth, primarily across the ~100-200 nm PA layer. Previous XPS
tests performed on the control BW30 membrane in Chapter 4 detected only carbon,
nitrogen, oxygen, and very low sulphur contents (0.1 at%) from the Psf supporting layer
underneath the PA layer. However, uniquely for plasma polymerized membranes, the
S/C ratio was also increased from 2 to 9% (Table 5.1). Increased sulphur content
suggests that the Psf under layer became more apparent to XPS due to small ruptures
during plasma polymerization which would in turn adversely affect the TFC membranes
selectivity.
The plasma polymerized layer lowered the salt rejections from 98% to 95.5 and 95.7%
for the 5 and 9 min treatment respectively. However, these rejection drops from the 5
and 9 min membranes were not significant from a practical point of view, where
according to the manufacturer, the salt rejection of dissolved salts can vary between
95% to greater than 99% [198]. At 15 min, the film deposition appeared to have more
penetrating ruptures but only enough to lower salt rejection to 93.8 % which well
correlates to the S/C ratio increase. Therefore, the salt rejection drops are strongly
related to high degree of polymerized film. According to the values shown in Table 5.1,
the spectra obtained for the plasma polymerized samples showed 10% increase in the
N/C elemental ratio expected from the polymerization of the VIM monomer.
The N/C ratio values are therefore a good indication of the presence of the polymerized
film on the PA surface. Figure 5.8 shows the ATR-FTIR analysis of the plasma

Chapter 5
128
polymerized membranes which was undertaken to explore the chemical profile after
polymerization. Plasma polymerization process was investigated with Psf membrane as
a reference material as shown Figure 5.8a, as well as on TFC membrane as shown in
Figure 5.8b.
Table 5.1: XPS contents from pre-conditioned plasma polymerized membranes with
VIM monomer
Formation of a broad band was detected corresponding to a carbonyl (C=O) stretching
vibration around 1723 cm-1
, an amide I (C-N) stretching vibration at 1666 cm-1
and
aromatic amide (N-H) deformation vibration or C=C ring stretching vibration 1609 cm-1
[199, 200]. As seen for the water plasma modified membranes in Chapter 4, a carbonyl
band was also formed after plasma polymerization from the reaction of free radicals
generated by the plasma via atmospheric O2, a common reaction found in any polymer
after plasma polymerization [124]. In the amide I band, possible crosslinking related to
rearranged and ruptured imidazole rings present within the monomer were detected
across the surface. As an example, amide I stretching vibrations were previously
reported at the frequency at 1663 cm-1
and 1668 cm-1
. The band 1666 cm-1
was reported
for pyrimidine, an aromatic heterocyclic organic compound similar to the imidazole ring
present within the monomer [201]. The same bands corresponding to cross-linked bonds
were also found for amine rich TFC membranes, as shown in Figure 5.8b.
Plasma duration C (%) N (%) O (%) S (%) N/C S/C
Control 77.5 2.2 20.2 0.1 0.03 0.01
5 min 68.7 13.6 15.3 2.4 0.20 0.04
9 min 65.2 12.0 18.7 4.1 0.18 0.06
15 min 61.2 13.3 20.6 4.9 0.22 0.08

Chapter 5
129
Figure 5.8: TR-FTIR peak profile for absorption bands noted after plasma
polymerization (a) bands at 1700 to 1650 cm-1
for Psf and (b) 1700 cm-1 to 1650 cm-1
for TFC, (c) SIR-Map homogeneity analysis with integration of peak 1666 cm-1
.
The synchrotron ATR-FTIR map in Figure 5.8c shows the amine group content for both
of these membranes after different process duration, with respect to the absorption at
1666 cm-1
. This band was found to proportionally increase with longer plasma treatment
times for both Psf and TFC membrane materials. Equation 4 presented in Chapter 3-
Section 3.3.3 was used to estimate the thickness of the plasma polymerized film by
evaluating the penetration depth of the infra-red beam across this particular wavelength
range [87]. The degree of polymerization evaluated by the film thickness for the Psf
membrane was estimated to be 250 nm, 290 nm and 345 nm for 5, 9 and 15 min process
duration, respectively. On the other hand, a film thickness for polymerized TFC
membranes were lower and was only possible to be measured from 9 min onwards

Chapter 5
130
corresponding to 21 and 60 nm, from 9 and 15 min of duration respectively. The 5 min
of process duration offered the least amine enrichment coverage and the thickness of the
layer could not be evaluated due to the short period given for the polymerization
growth. However, the presence of small polymer chains on the surface after 5 min of
process duration cannot be discarded once N/C ratio was also significant increased for
this sample. As seen on the contour plot map, the density of the C-N stretching vibration
across the surface of control TFC membranes showed lower intensity and an irregular
distribution of the studied band. However, after plasma polymerization the density of
these functionalities increased as longer plasma polymerization duration increased
leading to a more homogeneous distribution – this was especially visible for after 15
min.
The surface charge was also investigated as a function of pH as shown in Figure 5.9.
This test was carried out in order to confirm the increased amine densities. Control
membranes presented a flat negatively charged surface (~ -30 mV) over a pH range of 3
to 9 and similar results were also previously reported [171]. At low pH, the magnitude
of the positive charge increased with longer plasma polymerization durations compared
to the control membranes. This trend was most notable between 9 and 15 min of
polymerization duration. This behaviour can be attributed the higher degree of
polymerization achieved at longer durations due to the protonation of the added
functional amine groups. On the other hand, all plasma polymerized membranes showed
proportional surface charges increasing in magnitude of negative charge between -40
and -50 mV at pH 8 which may be resulted from the influence of argon plasma as seen
in Figure 5.4. Another potential contribution with enhanced negative charges is
associated with formed carboxylates upon reaction with air after removal from the
plasma chamber, which is supported by the increased carboxylic bands at 1718 cm-1
(Figure 5.8b). Furthermore, the isoelectric point (IEP) was found to strongly shift as a
function of the plasma duration. The IEP is reached when the zeta potential was equal to
zero and therefore the salt rejection of the membranes at the particular pH may not be as
effective - for more details please refer to Chapter 3, Section 3.3.4. The IEP values were

Chapter 5
131
ranging from pH 3.7 at 5 min to pH 4.3 and pH 4.7 for 9 and 15 min of plasma
polymerization respectively, which was consistent with an increase of basic amine
moieties on the surface. The increased amine presence on the surface is also consistent
with the increase in the N/C ratio (Table 5.1) as measured by XPS as displayed in
Figure 5.9b.
Figure 5.9: a) Streaming potential for TFC-control with isoelectric point for amine rich
membranes between pH 3.7 to 4.7 and b) correlation between increased amine groups
detected by streaming potential and increased N/C ratio detected by XPS after plasma
polymer.
5.2.3 Demonstration of amine rich active sites for attachment of silver
nanoparticles
Amine rich membranes were further exposed to AgNPs solution in order to demonstrate
the coordination capacities of the amine active sites. Figure 5.10 presents the XPS
analysis of silver binding on the polymerized surface with quantification of the silver
(Appendix 2 - Figure A-5.1). The enhanced binding of silver was shown in wide scan
XPS spectra, Figure 5.10a contrasting with the control membrane as presented in Figure
5.10b. Figure 5.10c shows a closer zoom of the silver peak with the Ag3d core level

Chapter 5
132
spectrum split in two peaks at 372 and 366 eV, indicating Ag 3d5/2 and Ag 3d3/2,
respectively [202]. The percentage of silver was 6 wt % (Appendix 2 -Figure A-5.1)
measured by EDS from the peak at 3 keV in the spectra.
Figure 5.10: a) XPS wide scan spectra containing Ag3d peak enhancement on amine
rich surface; b) wide scan spectra containing Ag3d peak for amine rich membranes with
silver attachment and c) peak split Ag3d covering 372 eV and 366 eV energy binding.
The silver functionalized membranes were tested for antimicrobial properties by
exposure to E.Coli. A number of studies have correlated the silver ions release with the
bacteria elimination mechanism and as well the biocidal lifespan [203]. The release
rates are mainly influenced by the particle size and pH conditions although some
limitations on the methodology for separation of nanoparticles and ions prior to
detection potentially can led to experimental artefacts [204]. The particle etching is time
dependent over 6-24 h observation period [205]. For particles around 20 nm under
neutral aqueous medium as used in this study, fast biocidal activity (etching rate ~2-4
nm / h) enabled to eliminate bacteria in the first 5 h and elimination maintained within

Chapter 5
133
24 h [206, 207]. Inhibition zones indicating antimicrobial activity are shown in
(Appendix 2 - Figure A-5.2). The inhibition zone showed 5 different distances ranges in
the sample which distance differences could be potentially be caused by the
aggregation/agglomeration of the AgNPs. The control membrane shows a dense
bacterial area with no inhibition zone (Appendix 2 - Figure A-5.2). The inhibition zones
started to appear in contrast to the bacteria-free valleys for the 5 min plasma
polymerized membranes coordinated with silver. The inhibition zones are clearly
identified as dispersed colonies and the average distances was 304 µm with minimum
distance of 77 µm. For 9 and 15 min, Appendix 2 - Figure A-5.2, inhibition zones were
more defined with average of 342 µm and 330 µm and minimum distances of 266 µm
and 115 µm respectively. The amine enrichment was therefore found to be directly
correlated to the diameter of the inhibition zones and also showed minimum distances in
longer polymerization time. Therefore, longer plasma polymerizations durations lead to
more coordination sites are available for silver attachment.
While the silver attachment and associated antimicrobial functionality has been
demonstrated, the effect of ions leaching over time is an important issue. Silver leaching
from chemically modified silver nanoparticles bonded to the surface of TFC membranes
showed Ag+ release lasting months during operational cross-flow filtration [208]. This
indicates that the silver modified membranes may require reloading of silver
nanoparticles, possibly during routine cleaning of the operating membrane plant.
However, further investigations of the long term stability of the attached amine groups,
as well as the attached silver nanoparticles during operation conditions are out of the
scope of this work.
Therefore, plasma polymerization was demonstrated to be viable for the
functionalization of amine moieties onto PA layer and control of the surface charge. The
film thickness was readily controlled by plasma polymerization duration, and shown to
influence amine density and homogeneity. Increasing polymerization duration led to
increased values for the IEP which was consistent with increasing amine density
showed by XPS. However, membrane pre-conditioning compromised the water flux

Chapter 5
134
while thicker film layer obtained with 15 min of duration tended to decrease selectivity
due to film ruptures. As the set parameters used in this work was shown to successfully
control the density of amines and surface charge, further optimization of the
polymerization process using fresh membranes without pre-conditioning is further
assessed in Section 5.3.
5.3 Improving the performance of plasma polymerized TFC membranes
Optimization of the plasma polymerization process with VIM monomer was explored to
improve the water flux and salt rejection of polymerized membranes. Specifically, the
impact of pre-conditioning which was observed to play a significant role in maintaining
high fluxes in Chapter 4 will be considered. The versatility of plasma polymerization
and the control of surface charge were also assessed with the carboxylate enrichment
after polymerization with MA on fresh control membranes as shown Section 5.3.2.
5.3.1 Plasma polymerization of the VIM monomer onto TFC membranes
5.3.1.1 Optimization of performance after VIM plasma polymerization
Fresh control membranes (no pre-conditioning) were directly inserted into the plasma
chamber. In Figure 5.11a the water flux after plasma polymerization with VIM
monomer showed to be slightly increased practically maintained compared to the fresh
control membrane (44.9 L.m-2
.h-1
). In terms of selectivity, the salt rejection showed a
slight declining trend with increasing duration, but decreased more significantly after 15
min plasma duration from 98% (control) down to 96% which is still within the range of
RO membranes as previously discussed.
Much like the finding in Chapter 4, these results indicated that working with
membranes without pre-conditioning step is more advantageous. The real impact of
polymerization process on the water flux can be assessed without the interference of

Chapter 5
135
pores and nano-voids collapse caused by the drying effect. The surface properties
characterization of the polymerized film is discussed in the following Sections.
Figure 5.11: Permeation tests of membranes after plasma polymerization under 15 bar
inlet pressure and 2,000 ppm NaCl solution, 27oC at pH 6.5. a) VIM polymerization and
b) MA polymerization performed at 5, 9 and 15 min polymerization duration.
5.3.1.2 Morphology assessment after plasma polymerization with VIM
The degree of polymerization process was initially assessed with SEM cross-sections
Figure 5.12. Observing just the top layer at the very top of the images, similar
smoothing trends as discussed in Section 5.2.2.1 were detected with increasing process
durations for both monomers. No film ruptures could however be detected across the
large surface area surveys (5 mm2). However, at 5 min of process duration showed
texturization on PA layer an aerated aspect formed which is potentially caused by an
artefact upon cross-sectioning during FIB analysis. Although the cross-sections revealed
morphology alterations, the estimation of the film thickness through chemical analysis
was required in order to confirm the findings. The SEM 2D surface analysis in
Appendix 2 -Figure A-5.3 showed a gradual smoothing trend consistent with increased

Chapter 5
136
plasma polymerization process duration. The protusions became more smoothed
between 9 and 15 min duration in contrast to the control membrane.
Figure 5.12: SEM cross-sections of fresh plasma polymerized membranes with VIM
monomer. The PA layer for the 5 min membrane shows an aerated aspect which relates
to an artefact upon cross-sectioning during FIB analysis
5.3.1.3 Chemical assessment after plasma polymerization with VIM
Figure 5.13 presents spectra from the plasma polymerized membranes in which
enhanced bands were further used for chemical distributions and homogeneity analysis.
In Figure 5.13a, the area of the band at 1666 cm-1
was also chosen as a reference band
as seen in Section 5.2.2.2 in order assess amine enrichment after plasma polymerization
process. The reference bands were also shown to be increased with increasing duration
of the polymerization process as previously discussed. The contour colour maps in

Chapter 5
137
Figure 5.13c also confirmed the intensity of functional groups which were also
homogenously distributed once the colours were uniformly spread compared to control
samples. The thickness was also estimated using Equation 2 (Chapter 3 - Section 3.3.3)
based on evaluation of penetration depth of the infra-red beam corresponded to the
integrated wavelength area. The estimated thickness of the amine film coverage was
calculated at 31, 29 and 62 nm added to the surface associated with increasing process
durations of 5, 9 and 15 min respectively.
Figure 5.13: ATR-FTIR peak profile for absorption bands noted after plasma
polymerization a) plasma polymerization with VIM: reference band at 1666 cm-1 b)
plasma polymerization with MA: reference band at 1722 cm-1
and c) homogeneity
analysis on 5 µm x 5 µm maps with integration of bands around 1666 cm-1
and 1722
cm-1
.

Chapter 5
138
The reference bands were also shown to be increased with increasing duration of the
polymerization process as previously discussed. The contour colour maps in Figure
5.13b also confirmed the intensity of functional groups which were also homogenously
distributed once the colours were uniformly spread compared to control samples. In
comparison with Section 5.2, the film thickness of the amine enriched membranes also
reached a maximum value of ~ 60 nm obtained at 15 min of process duration. However,
the thickness of the film obtained in this Section did not significantly changed
particularly between 5 and 9 min. Indeed, limitations of the FTIR analysis to estimate
the film thickness should be considered. Also the flux was minimally impacted since
flux was only declined 1% after 15 min of duration compared to the fresh control
membrane. Therefore, the water flux in fresh plasma polymerized membranes was not
interfered with the impact of the dryness of the material.
The increasing density of functional groups generated upon plasma polymerization as a
function of the process duration was also assessed by the measuring the surface charge
by streaming potential for the series of samples. In Figure 5.14 the amine enrichment
showed similar trends as previously presented in Section 5.2 (Table 5.2) however, the
IEP was significantly shifted from approximately pH 3 for the control membrane to
around pH 7 after plasma polymerization. The increased IEPs indicate that more of the
protonable amine species were polymerized onto the surface and that the surface charge
of the material could be finely tuned by simply varying the plasma duration. Also, in
comparison with the IEPs from Section 5.2 (Table 5.2), the significant increase of IEP
may be attributed to the variations of the nascent irregular amide groups distribution,
previously shown in the homogeneity analysis Figure 5.8c and Figure 5.13b and
associated with the rough topology of the PA layer generated during the IP synthesis.
However, the resulting plasma polymerized films showed a homogeneous distribution
of amine film regardless of the nascent chemistry variations.

Chapter 5
139
Table 5.2: Comparison between Section 5.2 and 5.3 with increasing density of amine
groups after plasma polymerization
Section Membranes Film thickness
(nm)
Flux
(L.m-2
.h-1
)
N/C
ratio
IEP
pH
5.2
Pre-
conditioned
(control)
- 13.2 ± 1.2 0.03 -
5 min < 21 10.9 ± 0.5 0.20 3.7
9 min 21 10.2 ± 0.6 0.20 4.7
15 min 60 10.1 ± 0.4 0.22 5.2
Fresh
(control)
- 44.9 ± 1.2 0.1 -
5.3 5 min 31 47 ± 2.3 0.1 6.7
9 min 29 49 ± 2.4 0.2 6.7
15 min 62 44 ± 2.2 0.1 6.3

Chapter 5
140
Figure 5.14 Surface charge analysis of fresh plasma polymerized membranes a) plasma
polymerization with VIM and b) plasma polymerization with MA
Furthermore, the elemental XPS survey analysis also confirmed significant increase of
N at%, upon polymerization (Appendix 2 - Table A-5.2). However, the N/C ratio was
only significantly increased after 9 min of duration from 0.1 (control) to 0.2. The
plasma polymerized samples in Section 5.2 also exhibited N/C around 0.2, however the
C at% was shown dramatically declined ~ 21%. On the other hand, the polymerized
samples in this Section showed a C at% only by ~3%. Therefore, the C at% differences
detected in polymerized membranes were shown to be associated with the coexistence
of competitive etching and polymerization mechanisms. As shown in Chapter 4 the pre-
conditioned membranes are more vulnerable to etching while the presence of
preservative materials in fresh samples shield the PA layer but at the same time may
bury the amine functionalities within this complex network. However, surface charge
was still significantly enhanced compared to Section 5.2 suggesting that the
polymerized chains were looser and rotated to outer layers when in contact to the saline
solution. Further C1s deconvolution is required for more conclusive analysis of bond

Chapter 5
141
scissions involved between fresh and pre-conditioned samples however, for this work
XPS access was limited.
In this Section, the performance of the plasma polymerized membranes was
significantly improved compared to the pre-conditioned polymerized membranes. The
positive charges were equally enhanced for all polymerization durations and plasma
polymerized samples were also homogeneous. The salt rejection was minimally altered
from 98% to 96% which is still within the range RO according to the manufacturer.
Therefore, the polymerization of amine functionalities on the surface via low pressure
plasma was shown to efficiently functionalized membranes with or without preservative
materials. However the impact of preservative materials on the stability of the samples
is yet to be assessed in future work.
5.3.2 Plasma polymerization of the MA monomer onto TFC membranes
5.3.2.1 The impact of MA plasma polymerization on the performance of the
membranes
The performance of plasma polymerized membranes is presented in Figure 5.11b. The
water flux across the plasma polymerized membranes was practically maintained at 5
min of duration but significantly declined by 33% for 9 min followed by 18% decline
after 15 min of plasma duration. The salt rejection was practically maintained around
97.5% for 5 and 9 min of process duration while slightly declined to 96.8% for 15 min
duration. Therefore, such significant flux variations may be correlated to the film
thickness which may lead to hydraulic resistance on the membrane. Similar impact on
the flux associated with increasing film on the surface has been reported using
conventional chemical routes for surface coating. The surface coating with hydrophilic
polymers led to flux declined by 25 to 81% which was attributed to thicker coting layers
(thickness not reported) [34, 52]. Such flux variations promoted by the polymerization
with MA may be correlated to the different polymer growth mechanisms and therefore,
further characterization of surface properties is required.

Chapter 5
142
5.3.2.2 Morphology assessment after plasma polymerization with MA
The degree of polymerization process with MA was initially assessed with SEM cross-
sections Figure 5.15. The cross-sections showed significant densification and
texturization of the PA layer with increasing polymerization process. The film appeared
to be thicker after 9 and 15 min of process duration. The Psf layer of 15 min membrane
showed an aspect of densification in this layer. However, this effect is related to an
artefact of the FIB during cross-sectioning. The increased densification on the PA layer
aligns with observed flux loss as found for 9 and 15 min polymerized membranes
(Figure 5.11b) and further discussed in chemical analysis. SEM 2D surface analysis in
Appendix 2 - Figure A-5.4 showed similar texturization as found in the cross-sections
with gradual densification with increasing polymerization duration.

Chapter 5
143
Figure 5.15: FIB SEM cross-sections of control membrane and fresh plasma
polymerized membranes with MA monomer. The dense aspect seen on the 15 min
plasma polymerized membrane relates to an artefact during FIB cross-sectioning
5.3.2.3 Chemical assessment after plasma polymerization with MA
The XPS analysis on the C at% and O/C ratio contents was investigated. Appendix 2
shows some variation of carbon contents and for 9 min plasma polymerized membrane
the C at% was increased by 5% while for 15 min polymerized membrane the C at% was
significantly declined by 80%. The 15 min polymerization process also led to
significant increase of O/C ratio from 0.2 (control) to 0.5. Similar variation between
oxygen and carbon contents after plasma polymerization process has been previously
reported. In previous study on plasma polymerization of PEG chains on PET material,
also using an AC plasma system, investigated the degree of polymerization of combined
maleic anhydride and PEG chains on PET material [209]. The O/C ratios did not

Chapter 5
144
necessarily increased with increasing degree of polymerization which was attributed to
the fact that PET nascent material is already saturated with oxygen contents. The C 1s
however showed formation of ester species, and C-C, C-H and C-O bond scissions on
the nascent material therefore, further C1s is needed.
Furthermore, the formation of new carboxylate bands on the surface also led to surface
charge alterations as shown in Figure 5.14b. The polymerization of carboxylic groups
across the surface of the membranes led to a progressive and significant enhancement of
negative charges. The surface charge of the membrane was found to be reduced
reaching from - 20mV (fresh control) to ~-50 mV (5 and 9 min) and -80 mV (15 min) at
pH 8. As the carboxylate rich membranes exhibited minimal salt rejection decline the
enhanced electrostatic interaction caused by high negative charges suppressed potential
film defects from polymerization process. Therefore, the increase of negative charges
on surface may be related to the excess of available carboxylic species which can be
deprotonated.
The FTIR analysis as shown in Figure 5.13b showed formation of a broad band around
1722 cm-1
corresponding to carboxylate groups (C=O) which was also enhanced with
increasing polymerization duration [209]. Similar to plasma amine enrichment, MA also
confirmed that the intensity of functional groups was homogenously distributed once
the colours were uniformly spread compared to control samples (Figure 5.13b). For the
carboxylate enrichment with MA the estimated film thickness showed higher degree of
polymerization than of the amine enrichment process in this Section.
With only 5 min of process duration the film thickness was estimated at 37 nm added to
the surface, 20% above 5 min of duration obtained with amine enrichment from this
Section. Furthermore, with 9 min of process duration film thickness was estimated at
102 nm, which are about 3 times higher than obtained with 9 min of the amine
enrichment polymerization process. However, the estimated film thickness for
polymerized membrane at 15 min of process duration was estimated at 83 nm which is
19% lower than of the 9 min polymerized membrane. Also, the performance tests
showed that the flux varies inversely with the layer thickness as plotted in Figure 5.16a

Chapter 5
145
while as previously discussed for the plasma polymerization with VIM flux was not
significantly altered with increasing film thickness (Figure 5.16b).
Figure 5.16: Correlation between polymerized film thickness and water flux a) plasma
polymerization with MA and b) plasma polymerization with VIM.
Differences in film thickness over duration, between VIM and MA deposition, are
related to the kinetics of the polymerization process. As the plasma conditions for both
polymerization processes were the same, it may be assumed that the structural and
electronic characteristics of the individual monomer molecules, such as their relative C-
H homolytic bond dissociation energies, may influence their relative deposition rates
onto the PA layer. Indeed, plasma polymerization hydrogen atom detachment within the
monomer is reputed to play an important role in plasma polymerization yield [124]. The
specific structural features of such monomers, such as the presence of an aromatic
moiety like an imidazole ring, as in the case of the VIM monomer, may significantly
influence radical formation due to hydrogen atom cleavage, since the resulting unpaired
electron would exhibit varying degrees of delocalization [124, 210]. On the other hand,
monomers with other structural features, such the cyclic MA molecule, provide a
different molecular environment that would be expected to significantly alter the
relative C-H homolytic bond dissociation energy. Thus a detailed comparison of the

Chapter 5
146
structural and electronic features of all the molecules (monomers and substrate)
involved in the deposition process, particularly their relative C-H homolytic bond
dissociation energies, is critical for understanding the complex mechanisms and kinetics
involved. This understanding can be facilitated by the application of computational
chemical calculations, as described in the next Section.
5.4 Quantum chemical calculations of the relative C-H or C-N homolytic bond
dissociation energies (BDEs) across the VIM, MA and model PA molecules.
It may be hypothesized that the reactivity and mechanisms of reaction between the
monomers themselves (homopolymerization) and between the monomers and the PA
model (grafting) arise from the formation of radical species as a result of energy input,
either through plasma or through gamma-rays irradiation [124, 211]. Therefore, it may
be assumed that the homolytic bond dissociation energies within these molecules are
primarily determinative of the radical species that are formed under controlled energy-
threshold conditions1. Under a specific set of energy conditions some radicals, and
hence some products, formed in polymerization reactions will have a higher probability
of formation than others. This offers the possibility of predicting the most probable
radical reaction sites (i.e. those with the lowest BDEs) and therefore the most likely
products under controlled energy-threshold conditions. Such products can then be
subsequently modelled to obtain structural information. In this regard, computational
chemistry calculations (Density Functional Theory - DFT), as described below, have
enabled an evaluation of the relative homolytic bond dissociation energies (BDEs) for
the C- H bonds across the two different monomers (VIM and MA) and for the C-H and
C- N bonds across a model PA substrate
1Radical formation by ionization as opposed to homolytic bond dissociation may be shown to require
considerably more energy input, as is evident for the VIM molecule, BDE range = 118 to 135 kcal/mole -
compared to its calculated ionization energy of 199 kcal/mol.

Chapter 5
147
Computational Method
Homolytic BDEs were calculated as follows [212]:
RC(N) H RC(N). + H.
BDE = [Energy RC(N). + Energy H.] – [Energy RC(N) - H]
All relative BDEs were computed using the Density Functional Theory (DFT) facility
of Spartan’06 (Wavefunction, Inc.) on a standard PC. Each energy was a DFT single
point calculation based on an AM1 semi-empirical equilibrium structure from an
equilibrium conformer (MMFF) starting structure equilibrium conformer. The 6-31+G*
diffuse basis set was chosen since some of the molecules modelled are anionic as well
as to optimize the computational cost. All equilibrium structures of products were
computed using semi-empirical methods, AM1, PM3 or RM1. All relative energy
values associated with these calculations are provided in Appendix 2 -Table A-5.3.

Chapter 5
148
The BDE landscape for the PA structure
Figure 5.17: Relative C–H and C–N homolytic BDEs (kcal/mol) for the PA structure
showing the most probable N–H homolytic BDE (red). The relative BDEs range from
97 to 120 kcal/mol. Note that the lowest value is for the amide N – H bond and this is
taken to be the most likely site for product formation under controlled energy-threshold
conditions, all else being equal.

Chapter 5
149
The BDE landscape for the VIM monomer
Figure 5.18: Relative C–H homolytic BDEs (kcal/mol) for the VIM monomer and the
most probable C–H homolytic BDE (red). a) Relative VIM BDEs ranging from 118 to
135 kcal/mol. Note that the lowest values are on the vinyl moiety. b) The most probable
radical under controlled energy-threshold conditions; the secondary BDEs are also
shown and one of these is activated in the radical by 2 kcal/mol (green) – favouring
further reaction c) spin potential density distribution in the most probable radical. Note
the extent, and hence availability, of the unpaired electron.

Chapter 5
150
The BDE landscape for the MA monomer
Figure 5.19: Relative C–H homolytic BDEs (kcal/mol) for the MA monomer and the
most probable C–H homolytic BDE. a) Both C–H bonds are equivalent and have the
same BDE of 123.8 kcal/mol. Note that this is higher (by 5.8 kcal/mol) than the lowest
BDE of 118 kcal/mol for the VIM monomer. b) The most probable monomer under
controlled energy-threshold conditions. Note that the formation of this radical also
strongly deactivates the other C – H bond by 5.8 kcal/mol - from 123.8 to 118 kcal/mol.
c) spin density distribution in the most probable radical. Note the extent, and hence
availability, of the unpaired electron.
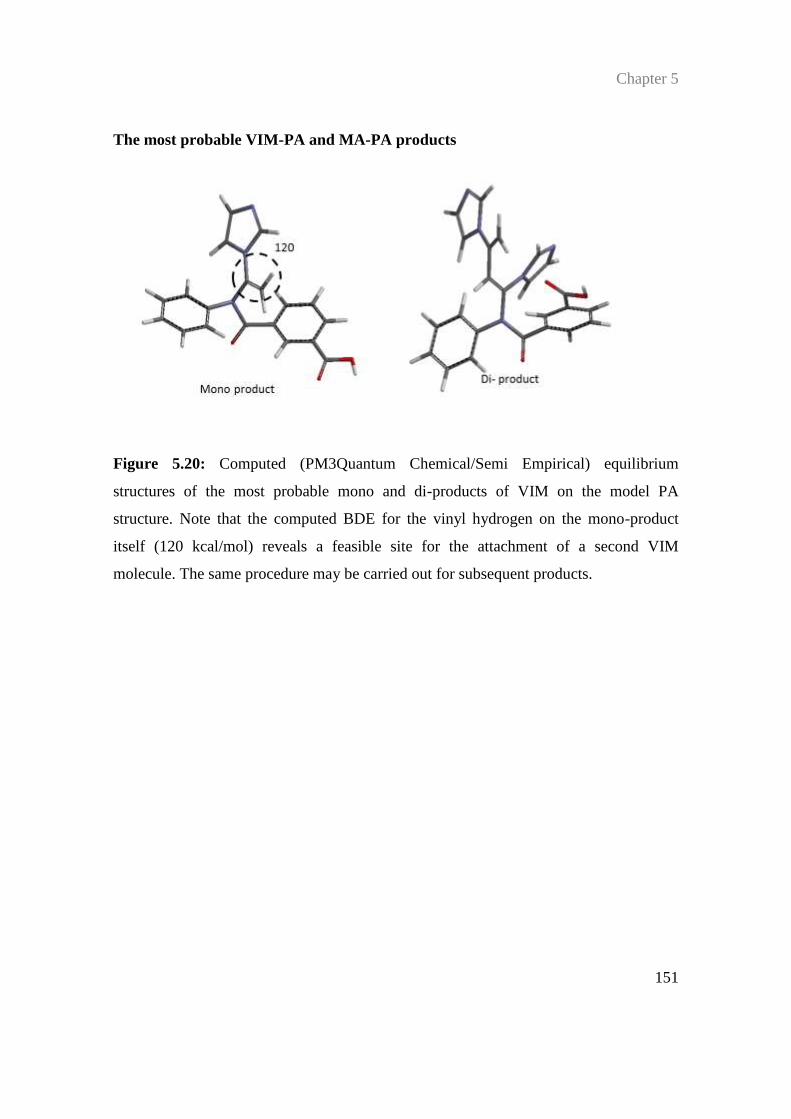
Chapter 5
151
The most probable VIM-PA and MA-PA products
Figure 5.20: Computed (PM3Quantum Chemical/Semi Empirical) equilibrium
structures of the most probable mono and di-products of VIM on the model PA
structure. Note that the computed BDE for the vinyl hydrogen on the mono-product
itself (120 kcal/mol) reveals a feasible site for the attachment of a second VIM
molecule. The same procedure may be carried out for subsequent products.

Chapter 5
152
Figure 5.21: Computed ( PM3 Quantum Chemical/Semi Empirical) equilibrium
structures of the most probable mono and di-products of MA onto the model PA
structure. Note that the computed BDE for the vinyl hydrogen on the mono-product
itself (125 kcal/mol) reveals a feasible site for the attachment of the second MA
molecule. It is notable that, unlike with VIM, the PA model is severely distorted in both
of these adducts that would suggest considerable steric hindrance of MA interacting
with an extended PA surface. This, together with the relatively higher BDE of MA
(123.8 kcal/mol) compared to VIM (118 kcal/mol), would suggest a lower reaction rate
of MA as compared to VIM, at least for the formation of the mono-adducts. However,
once formed the MA adducts could produce a more extensive layer and more surface
disruption, Fig 5.22.

Chapter 5
153
Modelling of the extended grafted structures of VIM4-PA and MA4-PA
Figure 5.22: Space filling representations of a) four VIM molecules grafted onto the
model PA b) four MA molecules grafted onto the PA, according to the most probable
calculated reaction sites (see above). MA forms a more extensive layer – as supported
by experimental observations.

Chapter 5
154
Commentary
Given the wide range of BDE values across both the VIM and MA monomers and the
PA model, it is feasible that, assuming controlled energy-threshold conditions, the most
probable grafted products can be predicted. Such products can then be subsequently
modelled to assess the probably and details of further grafting and to obtain relevant
structural information on the resulting deposition “film”. For example, Figures 5.20, 21
and 22 represent the formation of a mono-product and a di-product between the most
probable sites (lowest energy DBE sites) between VIM, MA and PA as well as the
higher order products. In making such predictions, it is assumed that all else is equal
(e.g. steric effects). However, it may be seen that the unpaired electron density is quite
extensive (and therefore quite available, perhaps circumventing steric effects to some
extent). In this regard, the significance of relative steric effects can also be assessed by
examining the energetics (e.g. relative strain and formation energies) of the postulated
products. However, this is beyond the scope of this thesis.
5.5 Conclusions
This chapter investigated the impact of plasma polymerization on the performance of
TFC membranes. In this study the surface charges were tuned accordingly to the nature
of the monomer used. There was also an assessment of the impact of membrane pre-
conditioning which improved the water flux at the same level as fresh control
membranes. Working with fresh control membranes preserved nascent membrane
structures (e.g. pores and PA nano-voids), which allowed an investigation of the real
impact of polymerization on desalination performance. Quantum chemical calculations
have been demonstrated to provide a powerful insight into the kinetics of the PP
process. For example, the MA polymerization results in more extended polymerized
structures than for the VIM monomer. Furthermore, intact maleic anhydride is not
favoured during plasma polymerization process. MA hydrolyses when exposed to air
and it is most likely that during plasma polymerization process the ring system could
Chapter 5
155
also open up with an input of energy. This result may be attributed to the steric
interaction of the MA ligand, both with other MA and the PA surface – via the cyclic
carbonyl moieties. Thus the computational chemical calculations have been
demonstrated to be consistent with the experimental outcomes and provided a
comparison of the structural and electronic features according to the most probable
calculated reaction sites between PA and monomers. In Chapter 6, there will be a
discussion about how VIM polymerization processes will impact the surface chemistry
and desalination performance via a higher energy input from gamma-rays.

156

Chapter 6
157
6. Gamma-ray irradiation induced grafting across
thin-film composite membranes
In this chapter, gamma-ray irradiation induced polymerization of VIM monomer,
solubilized in a methanol/water mixture solution, was performed for the first time to
enrich TFC membrane surfaces with amine functional group moieties. As opposed to
the plasma polymerisation process presented in Chapter 5, this grafting process was
operated at atmospheric pressure and the membranes were gently washed but not dried,
prior to being immersed in the monomer/solvent solutions. The impact of the degree of
grafting across the surface of the TFC membranes was systematically investigated with
different monomer concentrations (1, 10 and 35 v/v%) and for increasing irradiation
total dose (1, 10 and 100 kGy). The kinetics of polymerization across the surface was
assessed by analysing the membranes surface properties including their wettability and
streaming potential surface charge and correlated to the membranes performance against
series of benchmark samples. The objective of this chapter is to demonstrate feasibility
and the potential of the controlled grafting for functional thin-film membrane materials
with specific selectivity and custom-tailored performance.

Chapter 6
158
6.1 Performance of modified TFC membranes
Figure 6.1 presents the flux across the membranes, tested with NaCl feed solutions
against the material mass gain after irradiation-induced grafting. In Figure 6.1a the flux
of grafted membranes irradiated in 1 v/v% solutions was found to increase by up to 50
%, compared to the control membrane. The flux reached 70 L.m-2
.h-1
at 1 kGy of
irradiation and progressively was declined with increasing irradiation total dose to 48
L.m-2
.h-1
at 10 kGy and 19 L.m-2
.h-1
at 100 kGy. Similar trends were found for grafted
membranes in 10 and 35 v/v% solutions as shown in Figure 6.1b and 6.1c respectively.
The flux of grafted membranes in 10 v/v% solutions was initially increased by 17%
reaching 52.7 L.m-2
.h-1
and then was progressively declined by 50% at ~23 L.m-2
.h-1
for
both grafted membranes irradiated at 10 and 100 kGy. Furthermore, membranes in 35
v/v% solutions showed initial flux increase by 28% reaching irradiated at 1 kGy
irradiation total dose prior to dropping progressively by 20% and 50 % at 10 kGy and
100 kGy irradiation total doses respectively.
In Figure 6.1d the salt rejection capability of the membranes shows the evaluation of the
impact of both the solution compositions and the total irradiation dose on the materials
integrity. At low VIM concentrations, 1 v/v%, the selectivity of the membranes was
found to be similar to that of the control membranes at any irradiation dose. The salt
rejection across the grafted membrane with 1 v/v% of VIM concentration fluctuated
between 96.7% and 95.7% between 1 and 100 kGy, compared to 98% obtained for the
control membrane. Salt rejection values were however found to start declining upon
exposure to higher VIM concentrations. At 10 v/v% VIM concentration, the salt
rejection declined from 95 % to 92.5 % and 94.5% at 1, 10 and 100 kGy, while at 35 v/v
% of VIM concentration, salt rejection strongly declined from 92% to 84% between 1
and 100 kGy total dose respectively. These salt rejection results show that grafting of 10
v/v% VIM concentration onwards, appear to affect the salt rejection of the PA layer.

Chapter 6
159
Figure 6.1 shows the mass gains obtained with increasing monomer and irradiation total
doses. The mass gains were found to be limited with overall increases of only 0.52 to
1.1 wt% for grafted membranes irradiated in 1 v/v% monomer solution (Figure 6.1a).
However, the flux across the membranes progressively declined for higher irradiation
total doses, in line with the mass gains observed. At 10 v/v% of the monomer
concentration (Figure 6.1b), the mass gain was found to increase more rapidly from 0.6
to 3.5 wt%, while at 35 v/v% (Figure 6.1c), the mass gain increased from 2.8 to 14.4 wt
% between 1 and 100 kGy of irradiation total doses respectively. As expected, this trend
demonstrated that the kinetics of polymerization was favoured with increasing
monomer concentration and total irradiation dose. Furthermore, the increased mass
gains were well correlated to flux declines across the membranes. It was shown that
feasible degree of grafting was found at 1 kGy in all solutions concentrations. The flux
therefore, was shown to be physically dependent on the resultant coverage density.
As discussed in Chapters 4 and 5, salt rejection is governed by both surface charge
across the surface and free-volume distribution within the material [81]. Salt rejection in
these plasma modifications was attributed to loss of membrane integrity due to
excessive etching. Based on the previous findings for plasma, the causes for the salt
rejection decline may be attributed to several factors including (i) the formation of
defects or ruptures within the PA material due to the irradiation exposure, (ii) to
macromolecular network excessive swelling due to monomer molecules uptake and
polymerization thus affecting free-volume and (iii) to specific surface interactions and
crosslinking upon irradiation between the PA and the monomer or solvent molecules.
However, to confirm both the findings from plasma as well as with gamma-ray
irradiation, the impact to the membranes needs to be explored more closely to assess if
similar effects indeed did occur. The impact of the potential sources of degradation was
investigated with permeation tests performed on the series of control samples.
Desalination tests from the series of control samples are shown in Appendix 3 - Figure
A-6.1. The membrane series in MeOH/water mixture, without VIM monomer (0 v/v%),
was exposed to the same irradiation total doses (Appendix 3 - Figure A-6.1a) as used
for grafting.

Chapter 6
160
Figure 6.1: Flux and mass gain for irradiation-induced grafted TFC membranes with
VIM monomer; a) grafting with 1 v/v% concentration, b) 10 v/v% concentration, c) 35
v/v% concentration and d) salt rejection of grafted and control membranes with 0 v/v%
corresponding to MeOH/water solvent. Cross-flow desalination test conditions: 15 bar
inlet pressure and 2,000 ppm NaCl solution, pH 6.5 at 25oC. The error bars correspond
to standard deviations of the mean values.
These samples demonstrated that irradiation alone did not damage the PA layer. The
permeation across the irradiated membranes was maintained upon exposure with all
irradiation doses without affecting the flux and salt selectivity. Previous study on
gamma-ray irradiation of RO membranes immersed in saline solution showed that flux
and salt rejection was practically maintained when membranes were irradiated at 100
kGy due to PA resistance to irradiation and integrity of the amide groups [30]. On the
other hand, the performance of the membranes exposed to the monomer solutions with
no irradiation (0 kGy) as shown in Appendix 3 - Figure A-6.1b led to significant
permeation increases of ~50% at low VIM concentrations, between 1 and 10 v/v%, but

Chapter 6
161
at 35 v/v% of VIM concentration flux was increased to only 19%, compared to control
membrane (44.9 L.m-2
.h-1
). The flux enhancement suggests that the solvent molecules
not only can facilitate the VIM diffusion across the membrane layers but may also
slightly swell the macro-molecular network and cause alterations of the free-volume
distribution. Previous studies on free-volume alterations of TFC membranes, performed
positron annihilation lifetime spectroscopy (PALS) on membranes exposed to a
methanol solution. After 12 h of exposure the measured free-volume was significantly
increased by 19%. The free-volume increase contributed to double the permeability
however, salt rejection was affected and decreased by 5% in the reported work [213].
Here, the MeOH/water solvent system potentially caused free-volume alterations which
slightly increased water fluxes but no significant changes of salt selectivity were
observed for these control membranes suggesting, which could be attributed to the
presence of water in the system, limiting the action of methanol.
This trend indicates that the PA layer was significantly affected by exposure to the VIM
monomer molecules over 10 v/v% in concentration. The monomer solution likely
diffused and was adsorbed within the PA membrane material due to the long periods
(42 h) of exposure. A study on PA hollow fibers forward osmosis (FO) treated with N-
methyl pyrrolidone investigated the impact of oxidation post-treatment resistance [214].
The water flux of PA FO membranes with oxidation treatment increased, but the
separation performance of salt retention decreased significantly ~50% suggesting that
an oxidative degradation destroyed the molecular chains structure. Also, in Figure 6.1,
the mass gain confirms that for this series the monomer molecules were adsorbed and
mass values were found to increase with increasing monomer concentration from 0.4
wt%, for both 1 and 10 v/v% VIM concentrations, to 2.7 wt% for 35 v/v%. These
results indicate that the monomer solutions were taken up onto the membrane. The
exposure duration lasted for 42 h in order to simulate similar exposure duration for the
highest dose of 100 kGy performed in this study, as detailed in Chapter 3 Section
3.2.4.2. Therefore, the chemical and morphology surface properties must be addressed
in order to understand the impact of monomer solutions uptake.

Chapter 6
162
6.2 Characterization of surface properties of grafted layer
6.2.1 Morphology analysis of the grafted layer and PA surface integrity
The morphologies of the grafted functional layers formed by irradiation polymerization
were analyzed by SEM surface and cross-sections followed by AFM analysis. In Figure
6.2 SEM surface analysis and AFM (Appendix 3 - Figure A-6.2) were used to evaluate
the resultant morphological changes across the PA layer. As per the findings presented
in Chapters 4 and 5, the morphology of the control membrane materials was found to be
irregular and rough. However, after grafting, the membranes morphology was
significantly altered suggesting that grafted monomer was most likely to be deposited
into the valleys of the rough surface morphology which tended to flatten the natural
protusions across the PA layer with increasing monomer concentration and dosage. At
low irradiation doses, between 1 and 10 kGy, different levels of surface texturation were
also observed. However, significant reduction of the density of protusions at 35 v/v% of
monomer concentration suggests an intensified polymerization process which filled the
ridges within the rough PA surface. This hypothesis is supported by the fact that the
surface protrusions across the series of control membranes exposed to monomer
solutions without irradiation appeared only slightly flattened. The series of control
samples exposed and irradiated with only MeOH/water, the solvent system used to
prepare the VIM solutions (Figure 6.2), showed that this solvent system tended to
slightly flatten these protrusions generating a smoother layer, with however, no
significant variations between the series of irradiated samples.

Chapter 6
163
Figure 6.2: SEMs of control series and irradiation-induced grafted TFC membranes
with VIM monomer.
This flattening, which was also observed in the SEMs shown in Figures 6.2 could also
be related to the thickening of the top layer due to the monomer grafting or due to
swelling of the matrix upon solvent and monomer uptake. The same previously
mentioned study on the impact of oxidative reactions with N-methyl pyrrolidone in PA
hollow fibers also showed significant alterations in the morphology after the treatment
[214]. The SEM cross-section analysis showed surface texturization with defects and
bumps of the treated sample suggesting an oxidative reaction that caused the skin
membrane surface to shrink and the molecular structure to change. In this respect, the
PA material has been shown to be vulnerable in exposure to oxidative reagents and
therefore to potential degradation and chemical etching, which may have contributed to
the flattening of the surfaces.

Chapter 6
164
The levels of texturation were calculated from AFM maps by measuring the average
roughness (Ra) for the samples, as presented in Appendix 3 - Figure A-6.2. The surface
of the grafted membranes was smoothened and roughness values found to decrease with
increasing irradiation dose. At 1 kGy, the roughness was reduced compared to the
control membranes by over 50 % and found to plateau around 35.7 and 35.8 nm for the
samples grafted with VIM concentration solutions at 1 and 10 v/v% respectively. The
roughness of the materials was slightly increased, at 44.6 nm, for the 35 v/v% irradiated
VIM concentration solution, yet approximately 30% lower than the control membranes,
suggesting again excess build-up polymerization due to the prolonged irradiation
conditions. At 10 kGy, a similar plateau was found between 1 and 10 v/v% with
roughness around 44.1 and 42.4 nm respectively. However, at 35 v/v% concentration,
the roughness of the samples was significantly decreased to 24.5 nm. At 100 kGy,
increasing monomer concentration from 1 to 35 v/v% values reduced to 34.1 nm, 35.3
nm and 27 nm respectively. The calculated roughness values of the series of control
membranes exposed to monomer solutions without irradiation demonstrate that sole
contact with the VIM monomer smoothen the surface of the membranes (Appendix 3 -
Figure A-6.2). The roughness of the membranes exposed to 1, 10 and 35 v/v% of VIM
concentration decreased from 60.5 nm (control) down to 27.5 nm, 37.5 nm and 32 nm
respectively. In Chapter 5 - Section 5.2.2.1 similar trends were found with increasing
plasma polymerization duration with roughness decreased by 29% at 15 min treatment
duration.
Furthermore, SEM cross-Sections of the samples were prepared to evaluate the extent of
grafting across the PA and the Psf layers. At 1 kGy irradiation dose, the PA layer was
found to be denser and thicker with increased monomer concentration comparing with
controls. When irradiation is increased to 100 kGy as shown in Appendix 3 - Figure A-
6.3 and Figure A-6.4 the densification is also intensified specially with at 10 and 35
v/v% of VIM concentration (Appendix 3 - Figure A-6.5) compared to the control
membrane. Excessive polymerization was also found to occur across the pores of the
Psf layer and appeared to progressively obstruct the pores highlighting the overall effect
of the polymerization process on the entire membrane composite structure. Thus, the

Chapter 6
165
reduction of the pore volume distribution across the Psf layer was particularly visible at
10 v/v% and 100 kGy and all series of irradiated membranes in 35 v/v% of VIM
concentration which contributed to the water resistance increase. The series of grafted
membranes in 35 v/v% of monomer concentration showed that Psf layer was
significantly dense with the excessive monomer concentration which also compromised
the FIB cross-sectioning in these samples (Appendix 3 - Figure A-6.5). Similar impact
of coating thickness was previously reported with surface coating on commercial TFC
membrane in order to create smoother and hydrophilic membranes. In a recent work,
increasing monomer concentration led to increased thickness estimated ~300 nm which
in turn caused severe flux decline, decreasing by 81% [34]. The changes found in
grafted and control samples immersed in VIM solutions (no irradiation) suggested a
vulnerability of the PA structure to the VIM solutions and therefore further chemical
investigation is required.
6.2.2 Chemical analysis of grafted layer and PA surface integrity
The presence of the amine functional groups across the grafted surfaces was assessed by
XPS survey analysis. The survey analysis showed elemental nitrogen at% increase from
5.9 (35 v/v% VIM solution, 0 kGy) up to 19.4 at% for 35 v/v% irradiated at 100 kGy.
However, this increase was also detected across the control series exposed to the
monomer solution alone, without irradiation, which also confirms the impact of
monomer adsorption as detected with mass gain and morphology analysis. The N/C
ratio therefore was increased from 0.03 for the control membrane up to 0.26 for the
membranes irradiated at 35 v/v% and 100 kGy of total irradiation dose (Appendix 3 -
Table A-6.1). In terms of PA integrity, grafting of amine functionalities caused peaks
dissociations within the C1s main peak, which are attributed to changes across the amide
bonds present across the nascent PA as shown in Appendix 3 - Figure A-6.6. The peak
at 285.98 eV corresponding to C-N sites from amides, across the PA, was significantly
decreased after grafting, indicating consequent damage or reconfiguration of the PA
structure [151, 215]. Peaks appearance were found around 291 eV, corresponding to π-
π* - shake-up transitions of aromatic structures. Such peaks were found only for the

Chapter 6
166
grafted samples at 10 and 35 v/v% VIM concentrations. The presence of these peaks is
an indication of potential remaining monomer aromatic structures adsorbed across the
surface [159]. The π-π* shake-up transitions was therefore used as a reference to detect
residual imidazole rings [159] which should have been opened, due to low dissociation
energies, upon polymerization [216].
The XPS results were confirmed by Fourier transform infrared (FTIR) spectra analysis,
presented in Figure 6.3, demonstrating that new chemical bands, likely belonging to the
amine groups, appeared upon irradiation of the membranes in the VIM solutions. The
absorption of the band at 3330 cm-1
corresponding to N-H and/or O-H groups stretching
vibrations in the neighboring of the PA aromatic rings [172], significantly increased
after grafting suggesting an increase of the density of amine groups across the surface of
the membranes [217]. This broad absorption region at 3330 cm-1
, which is particularly
enhanced after grafting at 35 v/v% of VIM concentration and upon irradiation at 100
kGy, is here attributed to the presence of hydroxyl groups resulting from the presence of
remaining MeOH or water solvent molecules. Azole groups particularly, as present
across the VIM monomer molecules, were previously reported to have a very strong
affinity to adsorb water molecules and therefore led to the broad band effect [218]. The
presence of π-π* - shake-up transitions peaks, as discussed in the XPS Section, also
indicated residual unreacted VIM aromatic structures caused by an excess of monomer
molecules. Therefore, the broad 3300 cm-1
band is expected to be an indication of
residual aromatic structures from the VIM at high VIM concentration [219]. An extra
band at 3110 cm-1
appeared upon increased monomer concentration and irradiation dose
which was attributed to stretching vibrations of C=CH and N=CH bonds from the
imidazole ring [218].
In this regard, the imidazole groups were partially dissociated. The absorbance of the
bands in Figure 6.4 corresponds to functional groups in the vicinity of the aromatic
amide bands at 1663, 1609 and 1545 cm-1
which were also enhanced after irradiation
grafting suggesting attachments of amine groups from the grafting layer. However, such
bands for the 35 v/v% at 100 kGy show significant band enhancement suggesting
chemical degradation which explains significant declined salt rejection. Furthermore a

Chapter 6
167
new band at 1649 cm-1
was found to increase in intensity with monomer concentration,
which is here likely correlated to a direct and measurable increase of the primary amine
pendant groups surface density [173].
Figure 6.3: FTIR analysis of irradiation-induced grafted TFC membranes with VIM
monomer irradiated at 1, 10 and 100 kGy total doses. Studied band: 3330 cm-1
corresponding to N-H and/or O-H groups stretching vibrations
This increase was found to be more prominent after exposure at 35 v/v% of VIM
concentration on both irradiated and control membranes solely exposed to the monomer
molecules. This finding therefore demonstrates that in addition to being covalently
grafted to the surface, monomer molecules were also physically adsorbed and up-taken
within the PA material, corroborating the mass gain findings. The quantity of monomer
present within the free volume of the PA material is not possible to be estimated.
However, in this work it was not possible to access advanced techniques such as

Chapter 6
168
transmission electron microscopy (TEM) or positron annihilation spectroscopy (PALS)
that could investigate surface adsorption in Psf layer. The changes visible across the
control series however indicate that the quantity of free molecules is rather limited. In
addition, the enhanced intensity of the band at 918 cm-1
in Figure 6.5, was attributed to
C-H out-of–plane bending, is attributed to dissociated vinyl groups from the imidazole
ring, which was dissociated upon irradiation [217]. The irradiated MeOH/water control
membranes did not show chemical change within these specific bands which therefore
suggests, as expected, that no polymerization occurred without gamma ray irradiation,
and that up-take of the monomer was likely a purely physical-sorption phenomenon.
Figure 6.4: FTIR analysis of irradiation-induced grafted TFC membranes with VIM
monomer irradiated at 1, 10 and 100 kGy total doses. Studied bands: 1663, 1609 and
1545 cm-1
from aromatic amide bands.

Chapter 6
169
Figure 6.5: FTIR analysis of irradiation-induced grafted TFC membranes with VIM
monomer irradiated at 1, 10 and 100 kGy total doses. Studied band: 918 cm-1
attributed
to C-H out-of–plane bending.
Synchrotron FTIR analysis also performed in Chapter 5, Figure 5.8 and 5.13 is also
presented in Figure 6.6. The area of the band around 1666 cm-1
was also chosen as a
reference band as seen in order assess amine enrichment of irradiated grafted
membranes. The bands however, as presented in Figure 6.6 tended to be increased with
increasing dosage. However, thickness values as summarized in Table 7.3 in Chapter 7,
shows a broad range varying from 28 to 227 nm within all the series. The calculated
film thicknesses indicated that the aqueous membrane environment during grafting led
less chemical distributions which can be associated with saturation of high monomer
concentration solutions however, limitations on the FTIR analysis for quantitative
measurements may also be considered.

Chapter 6
170
Figure 6.6: The SIR-Map homogeneity analysis with integration of band from 1700 to
1650 cm-1
noted after of irradiation-induced grafted TFC membranes with VIM
monomer irradiated at 10 and 100 kGy total doses.
In terms of chemical distribution, irradiated membranes have led to overall lower
homogeneity compared PP (Figure 6.6). However, for the 1 v/v% VIM series
homogeneity was shown to increase with increasing dosage. The estimated film
thickness for the 1 v/v% VIM series was not possible to be calculated due to lower
absorbance in the FTIR analysis since there are limitations to consider regarding the
inherent heterogeneity of the PA material [88].
6.2.3 Analysis of surface charge and impact on membrane performance
Streaming potential results are shown in Figure 6.7. Results are shown for tests
performed on the 1 v/v% concentration series for increasing irradiation doses before and
after membrane permeation. The grafted membranes presented in Figure 6.7a were
shown to present an increasing density of surface amine functional groups which led to
a net increase of their surface positive charge. As a reference – as supplied membranes
typically exhibit a negative charge profile from almost zero to – 25 mV across pH range
of 3 to 8 respectively [172]. The grafted membranes presented highly positive net

Chapter 6
171
charge profiles across the full pH range. The IEP of the grafted membranes between the
1 and 10 kGy was shifted from approx. pH 6.5 to pH 6.8 reaching a net charge of +45
mV in the acidic pH range. In addition, the net charge profile in the alkaline pH range
above pH 8 was found to reach -5 mV, therefore nearly 5 times higher than that of the
reference membranes. At 100 kGy, the charge was always positive across the complete
pH range, reached maximum of +47 mV in the acid range and a minimum of +5 mV
within the alkaline range. These results are significant since they provide evidence that
TFC materials may be in-depth modified to offer highly tunable surface charges and
IEPs. Another study on grafting of amine functionalities amino groups improved
performance and heavy metals rejection of TFC membranes in order mimic the hollow
fiber membranes [220]. The surfaces not even became smoother but also highly
positively charged between pH 2.0 and 11.0 possibly due to the import of amine groups,
however the performance of the particular sample was not reported. On the other hand,
the control membranes exposed to a 1 v/v% of VIM concentration solution (Figure
6.7a), have taken up monomer molecules by adsorption, presented an IEP at pH 4.5 and
a positive net charge increased to +15 mV within the acidic pH range from pH 3 to 6.
The net difference with the reference untreated membranes was therefore largely
significant in that range. However, within the alkaline range, and particularly above pH
8, this control membrane exhibited a negative profile with a net charge around -15 mV,
within the same range to that of the control membranes, demonstrating more similarities
with the control membrane.
Furthermore, in order to further evaluate the stability of the grafted molecules, the
samples were also tested after permeation testing to assess for potential delamination or
desorption of functionalities which may occur within the module test due to the high
shear rate (2.4 m.s-1
) and the high pressure exerted across the thickness and top layer of
the membranes. Indeed in pressure driven separation, the resistance of the membrane is
largely concentrated upon the PA layer. After permeation (Figure 6.7b), all grafted
membranes had their IEP points shifted towards acidic range by approximately ± 1.0 pH
unit, while the reference membranes exposed only to a to 1 v/v% of VIM concentration
shifted by ± 0.5 pH unit. Although the positive charges were reduced for amine grafted

Chapter 6
172
membranes they still presented a high content of amines with charges reaching between
+30 and +45 mV. The extremely highly positively charged TFC membranes offer
tremendous potential for positively charged molecules removal such as proteins,
surfactants, metal transition or heavy metal ions. The control of the IEP position, by
tuning the materials amine functional groups density, is also promising for the
purification of extreme pH solutions, beyond that of water desalination [16]. The
solution pH has a significant effect on selectivity, because it dictates the charge on the
functional groups of the membrane material and of the molecules in solution [93]. The
charge of the material may also offer low-fouling properties and superior recovery
capabilities as previously demonstrated during fouling operation tests [102].
Figure 6.7: Streaming potential analysis of irradiation-induced grafted TFC membranes
with VIM monomer grafted with 1 v/v% monomer concentration with increasing
irradiation total dose, a) initial performance and b) performance after permeation.
Resultant chemical alterations affecting wettability were also accessed by water contact
angle measurements. Water contact angle is a sensitive tool that is strongly affected by
the surface charge and morphology. The shape of the water drop is directly correlated to
the water molecules orientation at the solid-liquid interface and thus to van der Walls
interactions while the presence of air trapped within the protrusion or the general
roughness of the material may strongly affect dynamic wettability [221]. For instance, a
positively charged surface with a high amine functional groups content would exhibit a
higher fraction of ionized species across a low pH ranging from pH 2 to pH 6 [222].
The protonated species on the surface of the materials would therefore enhance the net
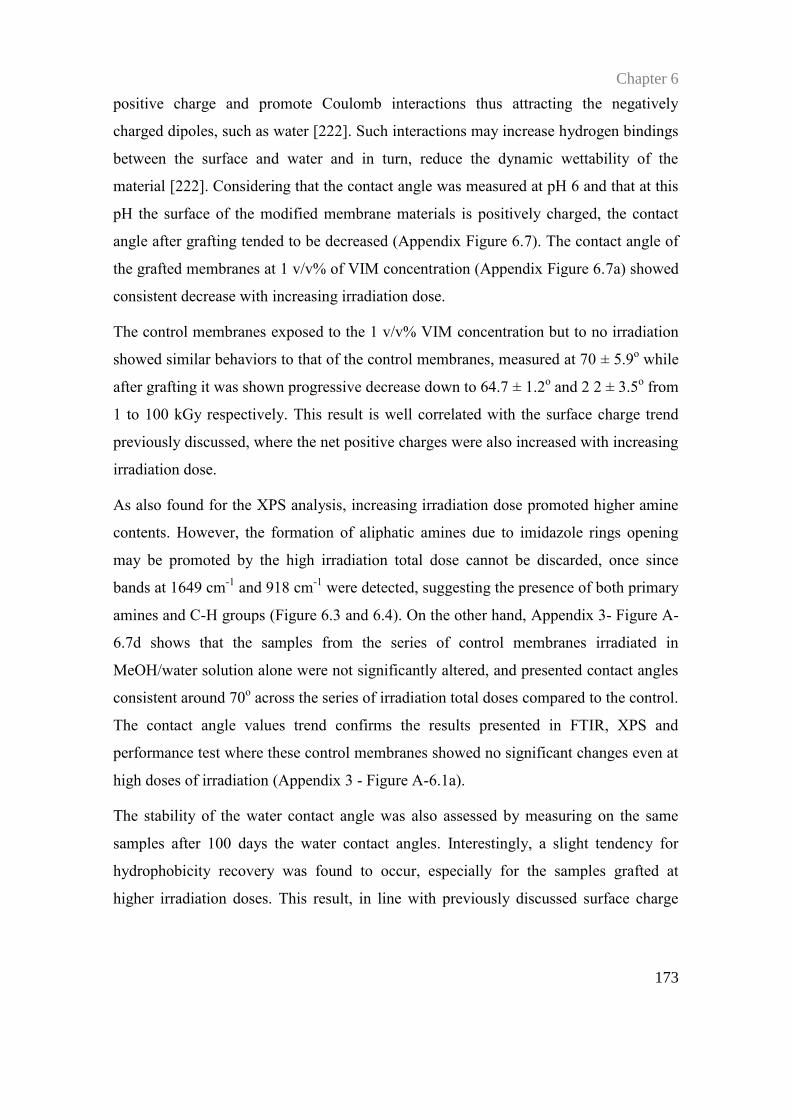
Chapter 6
173
positive charge and promote Coulomb interactions thus attracting the negatively
charged dipoles, such as water [222]. Such interactions may increase hydrogen bindings
between the surface and water and in turn, reduce the dynamic wettability of the
material [222]. Considering that the contact angle was measured at pH 6 and that at this
pH the surface of the modified membrane materials is positively charged, the contact
angle after grafting tended to be decreased (Appendix Figure 6.7). The contact angle of
the grafted membranes at 1 v/v% of VIM concentration (Appendix Figure 6.7a) showed
consistent decrease with increasing irradiation dose.
The control membranes exposed to the 1 v/v% VIM concentration but to no irradiation
showed similar behaviors to that of the control membranes, measured at 70 ± 5.9o while
after grafting it was shown progressive decrease down to 64.7 ± 1.2o and 2 2 ± 3.5
o from
1 to 100 kGy respectively. This result is well correlated with the surface charge trend
previously discussed, where the net positive charges were also increased with increasing
irradiation dose.
As also found for the XPS analysis, increasing irradiation dose promoted higher amine
contents. However, the formation of aliphatic amines due to imidazole rings opening
may be promoted by the high irradiation total dose cannot be discarded, once since
bands at 1649 cm-1
and 918 cm-1
were detected, suggesting the presence of both primary
amines and C-H groups (Figure 6.3 and 6.4). On the other hand, Appendix 3- Figure A-
6.7d shows that the samples from the series of control membranes irradiated in
MeOH/water solution alone were not significantly altered, and presented contact angles
consistent around 70o across the series of irradiation total doses compared to the control.
The contact angle values trend confirms the results presented in FTIR, XPS and
performance test where these control membranes showed no significant changes even at
high doses of irradiation (Appendix 3 - Figure A-6.1a).
The stability of the water contact angle was also assessed by measuring on the same
samples after 100 days the water contact angles. Interestingly, a slight tendency for
hydrophobicity recovery was found to occur, especially for the samples grafted at
higher irradiation doses. This result, in line with previously discussed surface charge

Chapter 6
174
IEP shifts suggesting that a portion of the amine functional groups may have suffered
aging process with molecular re-orientation [223] or desorbed materials.
In order to confirm the impact of the surface charge on the membrane performance,
tests were performed with divalent cations (Ca2+
) based solutions. The salt rejections
with the CaCl2 solutions were found to be significantly higher than those reported for
the NaCl solutions. The grafting series irradiated at 1 kGy with increasing monomer
concentration was chosen to demonstrate the effect of Donnan layer exclusion once this
series showed minimum declines of salt rejection values in NaCl desalination test. The
surface charge of membranes tested for desalination of CaCl2 at 1 kGy total dose and
for 1, 10 and 35 v/v% VIM concentrations, was also significantly altered and had the
IEP shifted towards pH 6.8 and overall net surface charge reaching up to +45 mV
(Appendix 3- Figure A-6.8a). The stability of the grafting was also evaluated by
assessing the surface charge after desalination tests (Appendix 3- Figure A-6.8b). The
IEPs shifted equally towards pH 5.8. The respective control series exposed to 1, 10 and
35 v/v% showed the effect of monomer adsorbing where IEP point was found at pH 4.5
(Appendix Figure A-6.8c), for 1 and 10 v/v% membrane at pH 6.5 and ~ 6.3 for 35
v/v% membrane. The net surface charged reached maximum of +20 mV with 10 v/v%
monomer concentration. Although monomer adsorption intrinsically affected the
surface charge, the irradiation grafting significantly contributed to the charge increase
and durability [224].
As previously discussed, NaCl rejection at 1 kGy of 96%, 95% and 92% and flux of 70,
68 and 55 L.m-2
.h-1
were obtained for the 1, 10 and 35% v/v% VIM concentration
solutions respectively. The salt rejection in RO membranes is primary driven by
Donnan layer exclusion than salt diffusion [225]. The same tested series of 1 kGy with
increasing VIM concentrations showed an increase of CaCl2 rejection as high as 99%
for flux values around 46.7 L.m-2
.h-1
. Considering that the free-volume of commercial
TFC PA membranes are typically reported in the range of ~0.259 to 0.289 nm [81], the
high selectivity presented indicates that strong electrostatic interactions occurred upon
separation once the ionic radius of Ca2+
and also Na+ ions is 0.99 Ǻ with diameter ~ 0.2
nm [226].

Chapter 6
175
This high salt rejection therefore, demonstrated the integrity and stability of the coatings
across the materials as well as the potential of the novel technique to alter commercial
materials towards high permeability materials.
6.3 Conclusions
Irradiation-induced grafting was systematically investigated and the altered surface
properties were critically correlated to TFC membrane performance. The nanoscale PA
network was shown to be a limiting factor to control the degree of grafting. Considering
the structural characteristic of PA ultrathin layer, grafting with low VIM concentration
of 1 v/v% at 1 kGy irradiation dose was demonstrated to be sufficient to alter the
negatively charged to positively charged membrane. Thus, with the same VIM
concentration was possible to produce a completely positively charged membrane with
increased dose up to 100 kGy. The selectivity with NaCl was maintained around 96.7%
while the rejection of CaCl2 was dramatically improved to 99% which was favoured by
improved electrostatic interactions. On the other hand, flux was likely to be
compromised upon densification of PA layer and grafting depth at the Psf layer. Such
effects tended to increase membrane resistance to water and were intensified at high
doses and VIM concentrations. However, these conditions were demonstrated not to be
required to produce a durable and effective positively charged surface confirmed with
streaming potential analysis. Therefore, further investigation could investigate the
grafting using lower VIM concentration (e.g. < 1%) at intermediate doses. Also, a
molecular level investigation including calculations of dissociation bonds energies
across PA and VIM molecular structures in order to be correlated to the findings and to
kinetic mechanisms involved.

176

Chapter 7
177
7. A comparative overview of plasma polymerization and
gamma irradiation techniques for TFC membranes surface
modification
This chapter provides an overview of comparative TFC surface modifications by plasma
polymerization (PP) and gamma-ray irradiation (GRI) techniques. The impact of both
techniques on actual membrane performance, in terms of relative flux and salt rejection,
has been summarized, as are the effects on surface charge. In addition, the deposition
characteristics for the monomers VIM and MA have been compared between the two
techniques and related to information provided by quantum chemical calculations
(QCC) (presented in Chapter 5, Section 5.4). Differences in the polymerization reaction
mechanisms and products, related to the fact that PP and GRI methods operate under
vacuum and atmospheric conditions, respectively, will be considered as part of this
analysis in order to isolate the effects in common from these novel irradiation based
surface modification strategies.

Chapter 7
178
7.1 Comparative effects on membrane performance
Table 7.1 presents a qualitative comparison of the effects of PP and GRI on the essential
functional desalination parameters (flux and the salt rejection), for the TFC membrane
as a function of PP exposure duration, VIM monomer concentration and total dose for
the GRI experiments. It can be seen that the flux decline is more dramatic for the GRI
technique than for PP for the VIM monomer. Details of these trends are discussed in
Chapters 5 and 6 and which were related to the different environments particular to each
technique. The salt rejection, in the case of the VIM monomer, tends to decline for both
techniques and, again, a more dramatic effect is observed for GRI.
Table 7.1: Qualitative comparison of the effects of PP and GRI on the flux and the salt
rejection for the TFC membrane as a function of PP exposure duration, VIM monomer
concentration (for GRI) and GRI dosage. This allows comparisons to be made between
the two techniques for the same monomer (VIM) – compare blue and green shadings;
and between the two monomers (VIM and MA) for a given technique (PP) - compare
blue and pink shadings.
Parameters
Plasma Polymerization
(PP)
Gamma-ray irradiation
(GRI)
VIM - Monomer MA - Monomer VIM - Monomer
Flux
(L.m-2
.h-1
)
Flux tends to
increase with
increasing polymer
polymerization
duration and returns
to original level at
highest duration,
Figure 5.11 a.
Flux decreases
significantly with
increasing plasma
polymerization
duration and starts to
increase at highest
duration but remains
significantly lower
that the control, Figure
5.11 b.
Flux significantly increases
upon introduction of the
monomer alone at all three
concentrations. The flux
subsequently significantly
declines with increasing
irradiation dosage, Figure
6.1 a – c. The minimum flux
occurs at the highest
concentration and
irradiation dosage.
Salt
Rejection
(%)
Salt rejection tends to
decline (from 98 to
96%) with increasing
polymerization
duration,
Figure 5.11 a.
Salt rejection tends to
decline (from 98 to
97%) with increasing
polymerization
duration, Figure 5.11
b.
Salt rejection tends, Figure 6.1
d, to decline with increasing
irradiation dosage and with
increasing concentration. The
decline is very pronounced for
the highest concentration.

Chapter 7
179
Overall the irradiation techniques have a tendency to alter flux, being either a significant
increase or decrease depending on the conditions. Someone interested to alter a
membrane by any technique would at least expect no change to flux, but an increase is
clearly beneficial and could justify the technique solely for harnessing desalinated water
with less energy (i.e. reduced pressure to achieve the same flux). It appears however
that regardless of the technique, there were no recorded cases of salt rejection increase
compared to the control, where instead some reduction would always be seen. Clearly
the practical advantage of this loss would need to be weighed up against the gained
benefit (flux or altered surface property). To put this in perspective, for a saline feed
from a brackish water desalination plant of 3,000 mg/L, a salt rejection drop from 98%
to 97% would lead to an increase in the permeate salinity from 60 mg/L to 90 mg/L, i.e.
a 50% increase in salinity. While the application may or may not be impacted by this
(for example the absolute value still meets requirement), the compromise in terms of
higher flux and/or reduced fouling will need to be considered. Regardless, this
preliminary assessment has found that the most ideal condition is one that minimises
this impact to the salt rejection as much as possible.
Analysing more specifically, from Figure 7.1 it can be seen that the results are more
diverse for the GRI technique. In this case the best outcomes (highest salt
rejection/highest flux) are seen to be for 1v/v% VIM at 1 and 10 kGy, respectively. The
worst outcome for this technique is seen for 35 v/v% at 100 kGy. Also of note is the
trend at 35 v/v% whereby both the salt rejection and flux decrease linearly with
increasing dosage, from 1 to 100 kGy. The change relative to the control can be seen for
all results shown. An “Acceptable improvement window” becomes evident if we define
the lower limit of salt rejection of 96% and do not accept any modification that gave
lower fluxes. Here we see that there are acceptable PP conditions at 5 min and 9 min,
which do not vary significantly from the control. These would be utilised for their other
functional changes (surface charge, hydrophilicity and morphology). Meanwhile the 1
v/v% GRI membranes at 1 kGy and 10 kGy doses not only achieved this modification,
but offer the benefit of a greatly increased flux.

Chapter 7
180
Figure 7.1: Salt rejection versus flux data distribution with respect to concentration and
exposure time for GRI, and duration time for PP. The monomer is VIM for both
techniques. Details are in Figure 5.11 (Chapter 5) and Figure 6.1 (Chapter 6).
Looking more deeply into the material changes, Figure 7.2 presents a qualitative
comparison of the effects of PP and GRI on the salt rejection and isoelectric point (IEP)
for the TFC membrane as a function of PP exposure time, VIM monomer concentration
(for GRI) and GRI dosage. Observing the “acceptable window” again, we see that the
salt rejection decline is more dramatic for the GRI technique than for PP for the VIM
monomer. Details of this are discussed in Chapters 5 and 6 and this is probably related
to the different membrane environments in each technique. The salt rejection in the case

Chapter 7
181
of the VIM monomer tends to decline for both techniques and, again, a more dramatic
effect is observed for GRI.
By plotting IEP on the independent axis, we see a possible trend of maintained salt
rejections for higher IEP values. For PP, the IEP is lowered by an extended duration
time. This could be explained by more steric shielding of the amine with higher
deposition. For GRI, a similar range of IEP variation is observed and notably the
highest concentration of 35 v/v% and lowest dosage of 1 kGy gives the lowest value of
the IEP and salt rejection. This could be due to the effect of the high monomer
concentration on the integrity of the membrane surface and size exclusion dominated
the salt rejection mechanisms (Figure 6.1d). The higher values of IEP correspond to the
lowest concentrations of 1 and 10 v/v% and lowest dosage of 1 kGy. The intermediate
value for the IEP corresponds to the lowest concentration of 1 v/v% and a higher dosage
of 10 kGy. The presented data suggests that for an optimal IEP, low duration/dosage
and low concentration is desirable. Interestingly the membrane treated with 1 v/v% at
100 kGy showed a complete positive charge across the whole range of pH and
simultaneously exhibited practical 96% salt rejection.
The adjustment of the IEP in RO membranes opens new avenues for different
applications where nanofiltration (NF) membranes are more commonly applied due to
low operational costs. For example in the mining industry, wastewater with highly
concentrated and charged contaminants has been treated by NF membranes. The IEP for
most of the commercial NF membranes can vary from pH 3 - 5 and the cation rejections
tend to decline with increasing pH because the surface of the membranes are pH
dependent and tend to become negatively charged. Therefore, to enable high cation
rejection, the feed solution must be maintained at as low pH as possible.

Chapter 7
182
Figure 7.2: Salt rejection versus IEP with respect to PP duration time and GRI dosage
and VIM monomer concentration. Rectangle shows the acceptable desalination
membrane performance window. More information is in Figure 6.7 and Appendix 3 -
Figure A-6.8.
Thus, the anions are also rejected because the inherent negatively charged surface tends
to maintain the electroneutrality [16]. However, the tightness of the free-volumes of the
membranes is also relevant given that commercial NF membranes that have similar IEP
provide differences in the cation rejection [227]. For example, a study on the influence
of the IEP for ion rejection of NF membranes compared the performance of a variety of
commercially available NF membranes which could be potentially applied in
wastewater treatment of mining industries [16]. The most promising result was obtained
with TS 80 NF membrane where the overall cation rejection was at a pH ~3 which
exhibited Na+ rejection of 87%. This is in comparison to the second best membrane that
exhibited only 50% of Na+ rejection. However, to compare this membrane with other
brands the same membrane was operated at 22 bar to achieve a flux of 33 L.m-2
.h-1
. This
6.3 6.4 6.5 6.6 6.7 6.8 6.9 7.091
92
93
94
95
96
97
98
PP-15 min
PP-5 minPP-9 min
10 v/v% 1 kGy
1v/v% 1 kGy
1v/v% 10 kGy
35 v/v% 1 kGy
PP
GRI
Salt R
eje
ction (
%)
IEP

Chapter 7
183
high applied pressure therefore suggests that this membrane had a tightened free-
volume than the others. The Na+ rejection for the same membrane tended to decline
with increasing pH and exhibited Na+ rejection of ~78% at pH ~6. In our work, the
modified RO membranes that were in the ”acceptable window” were operated at 15 bar
and showed significant high flux and salt rejection of 97.5% at pH 6 compared to the
best tested NF membrane TS 80. The modified membranes are highly positively
charged and therefore indicate a promising opportunity to provide a broader range of
working pH conditions.
7.2 Monomer deposition characteristics
7.2.1 The gamma-ray technique (GRI)
For GRI, Table 7.2 shows that for both concentrations of the VIM monomer, the rate of
deposition was highest at 1 kGy and decreased dramatically with increasing energy.
This could be related to more competing homopolymerization reactions at higher energy
levels [228], since more homolytic bond dissociations would be likely with respect to
the monomer with increasing energy, Chapter 5, Section 5.4. The minimum and
maximum thicknesses achieved were 28 and 227 nm, respectively at the 10% v/v
concentration. In these experiments the rate of deposition ranges from 1.6 to 504 nm/h
across all energies and across both concentrations.
Table 7.2: Comparison of film deposition rate from both 10 and 35 v/v% monomer
concentrations*
*The series for 1 v/v% monomer concentration is not considered for this discussion.
More details on this are in Chapter 6.
Total dose VIM-10 v/v%
film deposition rate
(nm/h)
VIM-35 v/v%
film deposition rate
(nm/h)
1 kGy 504 173
10 kGy 6.5 30
100 kGy 4.3 1.6

Chapter 7
184
Table 7.3 Minimum and maximum film thicknesses achieved.
Total dose*
Irradiation
duration
(h)
VIM-10 v/v%
Film thicknesses
(nm)
VIM-35 v/v%
Film thicknesses
(nm)
1 kGy 0.45 227 78
10 kGy 4.25 28 127
100 kGy 42.5 181 67
*Dose rate 2.35 kGy/h
7.2.2 Plasma polymerization technique (PP)
For the PP technique, the rate of deposition ranges from 193 to 553 nm/h across both
the VIM and MA monomers as shown in Table 7.4. However, the deposition rate for
MA is higher than the deposition rate for VIM. According to the results from modelling
studies Chapter 5, MA was shown to be less susceptible to homolytic bond dissociation
than VIM. However, as MA readily hydrolyses to maleic acid when in contact with air,
the deposition rate was subjected to the influence of formed maleic acid since the
thickness measurements were performed when samples were in contact with air. The
minimum and maximum thicknesses achieved were 29 and 62 nm for VIM, and 37 and
102 nm for MA. Under the same conditions, PP produces a thicker film for MA than for
VIM, Table 7.4
Table 7.4: Maximum film thickness achieved with plasma polymerization technique.
Plasma
polymerization
duration (h)
VIM-
film
thickness
(nm)
MA-film
thicknesses
(nm)
VIM-film
deposition rate
(nm/h)
MA-film
deposition
rate
(nm/h)
0.08 31 37 387 462
0.15 29 102 193 553
0.25 62 83 248 320

Chapter 7
185
7.2.3 Comparison between the techniques
Table 7.5 presents a comparison of the monomer deposition characteristics between the
PP and GRI techniques. Thus for GRI, there is more variation in the deposition rate,
possibly reflecting the differences in the environments between PP and GRI (i.e..
vacuum versus atmospheric; gas versus aqueous phase). These variations in deposition
rates suggest that the GRI technique could be more versatile with respect to controlling
the deposition rate and hence thickness. The upper limit of the deposition rate achieved
in these experiments appears to approach a value within the 504 nm/h from GRI (VIM,
Table 7.5) to 553 nm/h from PP (MA, Table 7.5) range (approximately) as highlighted
for both techniques. Notably the MA is higher and this is again consistent with our
modelling studies that show VIM to be more sterically restrictive than MA as a product
with PA (Chapter 5, Section 5.4).
Table 7.5: Comparison of the monomer deposition characteristics between the PP and
GRI techniques
Parameters
Plasma polymerization Gamma-ray irradiation
VIM
Monomer
MA
Monomer VIM
Deposition rate(nm/h) 193-387 320-553 1.6 - 504
Minimum thickness(nm) 29 37 28
Maximum thickness(nm) 62 102 227

Chapter 7
186
7.3 Concluding remarks
This chapter provides a comparative overview of the differences in the properties and
characteristics of TFC membranes modified via PP and GRI techniques. The impact of
both techniques on the actual membrane performance showed that the PA layer can be
compromised when subjected to sufficiently harsh conditions. However, under more
controlled conditions, a potential application for amine enriched membranes is
suggested given that such modified membranes become more permeable and become
highly positively charged with maintained salt rejection. Differences in the
environments between each technique have been shown to affect monomer deposition
rates and the broader range found for the GRI indicates that this technique could be
more versatile with respect to controlling the deposition process. The novel application
of quantum chemical calculations in delineating the mechanism and structural
characterization of the deposition process has been shown to be a promising and
potentially predictive method.
Suggestions for future work may be summarized as follows:
Challenge the practical benefit of the modification in real applications over
longer term: the modified membranes are operated under conditions that would
be challenging to the unmodified membrane types. For example to observe if the
functional modifications reduce fouling from proteins, or require less cleaning
when desalinating industrial waste water. Correlate the findings to tailored
chemical and/or morphological changes;
Measure the long term performance for higher flux membranes (operate at lower
pressure to achieve the same water productivity) to determine energy saving
potential;
Test with a wider range of salt mixtures to observe if the surface charge changes
will enable tailored ion partitioning in NF application, for example to mining
waste water treatment;

Chapter 7
187
The free-volume of modified membranes could be assessed using positron
annihilation lifetime spectroscopy (PALS). This will allow deeper investigation
into the impact of the irradiation techniques towards understanding if altered
flux is related to (for example) changed polymer free-volume, or simply reduced
effective area;
Other techniques to measure the film thicknesses could be explored such as X-
ray reflectometry (XRR) and elipsometry. Both would work on a flat surface and
we could have potentially cross-benched the results from the FTIR calculations
for the PP samples;
In gamma-rays, nuclear magnetic resonance (NMR) could investigate monomer
homopolymerization with increasing total doses’
Different parameters for plasma polymerization could be explored. Longer
durations tend to increase the amount of functional groups. However, another
possibility could explore high density of functionalities by increasing partial
pressures of the monomers at a fixed optimum duration such as 5 min;
A more in depth surface morphology investigation could be explored in plasma
polymerized membranes with VIM and MA monomers in order assess the
impact of different geometries predicted by the quantum chemical calculations;
A thicker PA layer could be synthesised in order to assess the impact of plasma
etching and grafting penetration via gamma-rays;
The stability of the plasma modified membranes could be assessed with
different storages conditions without presence of air;
In gamma-rays technique lower irradiation total doses below 1 kGy could be
investigated at high monomer concentrations; and
MA could also be irradiated in order to compare grafting with PP.

188
8. References
1. Aerts, S., A. Vanhulsel, A. Buekenhoudt, H. Weyten, S. Kuypers, H. Chen, M.
Bryjak, L.E.M. Gevers, I.F.J. Vankelecom, and P.A. Jacobs, Plasma-treated
PDMS-membranes in solvent resistant nanofiltration: Characterization and
study of transport mechanism. Journal of Membrane Science, 2006. 275(1-2): p.
212-219.
2. Organization, W.H., Progress on drinking-water and sanitation. 2014:
Switzerland.
3. Gasson, C., Market Profile: The Global Water Market, in A bright new future
for water? 2014, Global Water Intelligence.
4. Frenkel, V.S., Seawater Desalination: Trends and Technologies, Desalination,
M.S. (Ed.), Editor. 2011, InTech.
5. Karagiannis, I.C. and P.G. Soldatos, Water desalination cost literature: review
and assessment. Desalination, 2008. 223(1–3): p. 448-456.
6. Lee, K.P., T.C. Arnot, and D. Mattia, A review of reverse osmosis membrane
materials for desalination development to date and future potential. Journal of
Membrane Science, 2011. 370(1–2): p. 1-22.
7. Ang, W.S. and M. Elimelech, Protein (BSA) fouling of reverse osmosis
membranes: Implications for wastewater reclamation. J. Membr. Sci., 2007.
296(1–2): p. 83-92.

189
8. Rebhun, M. and J. Manka, Classification of organics in secondary effluents.
Environmental Science & Technology, 1971. 5(7): p. 606-609.
9. Manka, J., M. Rebhun, A. Mandelbaum, and A. Bortinger, Characterization of
organics in secondary effluents. Environmental Science & Technology, 1974.
8(12): p. 1017-1020.
10. Barker, D.J. and D.C. Stuckey, A review of soluble microbial products (SMP) in
wastewater treatment systems. Water Research, 1999. 33(14): p. 3063-3082.
11. Zhu, X. and M. Elimelech, Colloidal Fouling of Reverse Osmosis Membranes:
Measurements and Fouling Mechanisms. Environmental Science & Technology,
1997. 31(12): p. 3654-3662.
12. G.Amy;, Fundamental understanding of organic matter fouling of membranes.
Desalination, 2008. 231(1–3): p. 44-51.
13. Chesters, S.P., Pena,N., Gallego,S., Fazel,M., Armstrong,M.W., DelVigo, F.,
Results from 99 Seawater RO Membrane Autopsies, in IDA WorldCongress.
2011: Perth,WesternAustralia.
14. Lu, X., C. Boo, J. Ma, and M. Elimelech, Bidirectional Diffusion of Ammonium
and Sodium Cations in Forward Osmosis: Role of Membrane Active Layer
Surface Chemistry and Charge. Environmental Science & Technology, 2014.
48(24): p. 14369-14376.
15. Childress, A.E. and M. Elimelech, Effect of solution chemistry on the surface
charge of polymeric reverse osmosis and nanofiltration membranes. Journal of
Membrane Science, 1996. 119(2): p. 253-268.

190
16. Mullett, M., R. Fornarelli, and D. Ralph, Nanofiltration of Mine Water: Impact
of Feed pH and Membrane Charge on Resource Recovery and Water Discharge.
Membranes, 2014. 4(2): p. 163-180.
17. Löwenberg, J., J.A. Baum, Y.-S. Zimmermann, C. Groot, W. van den Broek,
and T. Wintgens, Comparison of pre-treatment technologies towards improving
reverse osmosis desalination of cooling tower blow down. Desalination, 2015.
357: p. 140-149.
18. Pontié, M., S. Rapenne, A. Thekkedath, J. Duchesne, V. Jacquemet, J. Leparc,
and H. Suty, Tools for membrane autopsies and antifouling strategies in
seawater feeds: a review. Desalination, 2005. 181(1): p. 75-90.
19. Shon, H.K., S. Vigneswaran, I.S. Kim, J. Cho, and H.H. Ngo, Effect of
pretreatment on the fouling of membranes: application in biologically treated
sewage effluent. Journal of Membrane Science, 2004. 234(1–2): p. 111-120.
20. Creber, S.A., J.S. Vrouwenvelder, M.C.M. van Loosdrecht, and M.L. Johns,
Chemical cleaning of biofouling in reverse osmosis membranes evaluated using
magnetic resonance imaging. Journal of Membrane Science, 2010. 362(1–2): p.
202-210.
21. Ang, W.S., S. Lee, and M. Elimelech, Chemical and physical aspects of
cleaning of organic-fouled reverse osmosis membranes. J. Membr.Sci., 2006.
272(1–2): p. 198-210.
22. Tang, C.Y., Y.-N. Kwon, and J.O. Leckie, The Role of Foulant–foulant
Electrostatic Interaction on Limiting Flux for RO and NF Membranes During
Humic Acid Fouling—Theoretical Basis, Experimental Evidence, and AFM
Interaction Force Measurement. J. Membr. Sci., 2009. 326(2): p. 526-532.

191
23. Bacchin, P., P. Aimar, and R.W. Field, Critical and sustainable fluxes: Theory,
experiments and applications. Journal of Membrane Science, 2006. 281(1-2): p.
42-69.
24. Cohen, R.D. and R.F. Probstein, Colloidal fouling of reverse osmosis
membranes. Journal of Colloid And Interface Science, 1986. 114(1): p. 194-207.
25. Widjaya, A., T. Hoang, G.W. Stevens, and S.E. Kentish, A comparison of
commercial reverse osmosis membrane characteristics and performance under
alginate fouling conditions. Separation and Purification Technology, 2012. 89:
p. 270-281.
26. Hoek, E.M.V. and M. Elimelech, Cake-Enhanced Concentration Polarization:
A New Fouling Mechanism for Salt-Rejecting Membranes. Environmental
Science & Technology, 2003. 37(24): p. 5581-5588.
27. Sioutopoulos, D.C., S.G. Yiantsios, and A.J. Karabelas, Relation between
fouling characteristics of RO and UF membranes in experiments with colloidal
organic and inorganic species. Journal of Membrane Science, 2010. 350(1–2):
p. 62-82.
28. Tiraferri, A., C.D. Vecitis, and M. Elimelech, Covalent Binding of Single-
Walled Carbon Nanotubes to Polyamide Membranes for Antimicrobial Surface
Properties. ACS Applied Materials & Interfaces, 2011. 3(8): p. 2869-2877.
29. Liu, L.-F., S.-C. Yu, L.-G. Wu, and C.-J. Gao, Study on a novel polyamide-urea
reverse osmosis composite membrane (ICIC-MPD): II. Analysis of membrane
antifouling performance. Journal of Membrane Science, 2006. 283(1–2): p. 133-
146.
30. Mansourpanah, Y., S.S. Madaeni, and A. Rahimpour, Fabrication and
development of interfacial polymerized thin-film composite nanofiltration

192
membrane using different surfactants in organic phase; study of morphology
and performance. Journal of Membrane Science, 2009. 343(1–2): p. 219-228.
31. Kong, C., M. Kanezashi, T. Yamomoto, T. Shintani, and T. Tsuru, Controlled
synthesis of high performance polyamide membrane with thin dense layer for
water desalination. Journal of Membrane Science, 2010. 362(1–2): p. 76-80.
32. Kang, G.-D., C.-J. Gao, W.-D. Chen, X.-M. Jie, Y.-M. Cao, and Q. Yuan, Study
on hypochlorite degradation of aromatic polyamide reverse osmosis membrane.
Journal of Membrane Science, 2007. 300(1–2): p. 165-171.
33. Zhang, T., C. Zhu, H. Ma, R. Li, B. Dong, Y. Liu, and S. Li, Surface
modification of APA-TFC membrane with quaternary ammonium cation and
salicylaldehyde to improve performance. Journal of Membrane Science, 2014.
457: p. 88-94.
34. Louie, J.S., I. Pinnau, I. Ciobanu, K.P. Ishida, A. Ng, and M. Reinhard, Effects
of polyether–polyamide block copolymer coating on performance and fouling of
reverse osmosis membranes. J. Membr. Sci., 2006. 280(1–2): p. 762-770.
35. Arena, J.T., B. McCloskey, B.D. Freeman, and J.R. McCutcheon, Surface
modification of thin film composite membrane support layers with
polydopamine: Enabling use of reverse osmosis membranes in pressure retarded
osmosis. Journal of Membrane Science, 2011. 375(1–2): p. 55-62.
36. Cao, Y.-x., G.-d. Zheng, J.-p. Xu, and J.-r. Shen, Effects of internal interface
modification on the performance of composite RO membranes -(I). Property and
characterization. Gaofenzi Cailiao Kexue Yu Gongcheng, 2004. 20(6): p. 138-
141.
37. Kim, E.-S., Y.J. Kim, Q. Yu, and B. Deng, Preparation and characterization of
polyamide thin-film composite (TFC) membranes on plasma-modified
193
polyvinylidene fluoride (PVDF). Journal of Membrane Science, 2009. 344(1–2):
p. 71-81.
38. Pan, K., P. Fang, and B. Cao, Novel composite membranes prepared by
interfacial polymerization on polypropylene fiber supports pretreated by ozone-
induced polymerization. Desalination, 2012. 294: p. 36-43.
39. Zhang, Y., C. Zhao, H. Yan, G. Pan, M. Guo, H. Na, and Y. Liu, Highly
chlorine-resistant multilayer reverse osmosis membranes based on sulfonated
poly(arylene ether sulfone) and poly(vinyl alcohol). Desalination, 2014. 336: p.
58-63.
40. Freger, V., J. Gilron, and S. Belfer, TFC polyamide membranes modified by
grafting of hydrophilic polymers: an FT-IR/AFM/TEM study. Journal of
Membrane Science, 2002. 209(1): p. 283-292.
41. Hatakeyama, E.S., H. Ju, C.J. Gabriel, J.L. Lohr, J.E. Bara, R.D. Noble, B.D.
Freeman, and D.L. Gin, New protein-resistant coatings for water filtration
membranes based on quaternary ammonium and phosphonium polymers.
Journal of Membrane Science, 2009. 330(1–2): p. 104-116.
42. Kang, G., H. Yu, Z. Liu, and Y. Cao, Surface Modification of a Commercial
Thin Film Composite Polyamide Reverse Osmosis Membrane by Carbodiimide-
Induced Grafting with Poly(ethylene glycol) Derivatives. Desalination, 2011.
275(1–3): p. 252-259.
43. Zhou, Y., S. Yu, C. Gao, and X. Feng, Surface modification of thin film
composite polyamide membranes by electrostatic self deposition of polycations
for improved fouling resistance. Separation and Purification Technology, 2009.
66(2): p. 287-294.

194
44. Kim, M.-m., N.H. Lin, G.T. Lewis, and Y. Cohen, Surface Nano-Structuring of
Reverse Osmosis Membranes Via Atmospheric Pressure Plasma-Induced Graft
Polymerization for Reduction of Mineral Scaling Propensity. J. Membr. Sci.,
2010. 354(1–2): p. 142-149.
45. Lin, N.H., M.-m. Kim, G.T. Lewis, and Y. Cohen, Polymer Surface Nano-
structuring of Reverse Osmosis Membranes for Fouling Resistance and
Improved Flux Performance. J. Mater. Chem., 2010. 20(22): p. 4642-4652.
46. Li, D. and H. Wang, Recent developments in reverse osmosis desalination
membranes. Journal of Materials Chemistry, 2010. 20(22): p. 4551-4566.
47. Bhattacharya, A., J.W. Rawlins, and P. Ray, Polymer grafting and crosslinking.
2009: Wiley Online Library.
48. Louie, J.S., I. Pinnau, and M. Reinhard, Effects of Surface Coating Process
Conditions on the Water Permeation and Salt Rejection Properties of Composite
Polyamide Reverse Osmosis Membranes. J. Membr. Sci., 2011. 367(1–2): p.
249-255.
49. Sarkar, A., P.I. Carver, T. Zhang, A. Merrington, K.J. Bruza, J.L. Rousseau, S.E.
Keinath, and P.R. Dvornic, Dendrimer-based Coatings for Surface Modification
of Polyamide Reverse Osmosis Membranes. J. Membr. Sci., 2010. 349(1–2): p.
421-428.
50. Yu, S., G. Yao, B. Dong, H. Zhu, X. Peng, J. Liu, M. Liu, and C. Gao,
Improving fouling resistance of thin-film composite polyamide reverse osmosis
membrane by coating natural hydrophilic polymer sericin. Separation and
Purification Technology, 2013. 118(0): p. 285-293.
51. Yu, S., Z. Lü, Z. Chen, X. Liu, M. Liu, and C. Gao, Surface modification of thin-
film composite polyamide reverse osmosis membranes by coating n-

195
isopropylacrylamide-co-acrylic acid copolymers for improved membrane
properties. J. Membr. Sci., 2011. 371: p. 293-306.
52. Gilron, J., S. Belfer, P. Vaisanen, and M. Nystrom, Effects of Surface
Modification on Antifouling and Performance Properties of Reverse Osmosis
Membranes. Desalination, 2001. 140(2): p. 167-179.
53. Louie, J.S., I. Pinnau, and M. Reinhard, Effects of surface coating process
conditions on the water permeation and salt rejection properties of composite
polyamide reverse osmosis membranes. Journal of Membrane Science, 2011.
367(1–2): p. 249-255.
54. Gürsel, S.A., C. Padeste, H.H. Solak, and G.G. Scherer, Microstructured
polymer films by X-ray lithographic exposure and grafting. Nuclear Instruments
and Methods in Physics Research Section B: Beam Interactions with Materials
and Atoms, 2005. 236(1–4): p. 449-455.
55. Li, R., G. Wu, and Y. Ye, In vitro hemocompatibility of sulfonated
polypropylene non-woven fabric prepared via a facile γ-ray pre-irradiation
grafting method. Applied Surface Science, 2015. 356: p. 1221-1228.
56. Dumée, L.F., C. Feng, L. He, F.-M. Allioux, Z. Yi, W. Gao, C. Banos, J.B.
Davies, and L. Kong, Tuning the grade of graphene: Gamma ray irradiation of
free-standing graphene oxide films in gaseous phase. Applied Surface Science,
2014. 322: p. 126-135.
57. Bazaka, K., M.V. Jacob, R.J. Crawford, and E.P. Ivanova, Review: Plasma-
assisted surface modification of organic biopolymers to prevent bacterial
attachment. Acta Biomaterialia, 2011. 7: p. 2015-2028.
58. Friedrich, J., The plasma chemistry of polymer surfaces advanced techniques for
surface design. 2012: Weinheim : Wiley-VCH.

196
59. Reis, R., L.F. Dumee, L. He, F. She, J.D. Orbell, B. Winther-Jensen, and M.C.
Duke, Amine enrichment of thin film composite membranes via low pressure
plasma polymerization for antimicrobial adhesion. ACS Appl Mater Interfaces,
2015. 7(27): p. 14644-53.
60. Dwivedi, N., R.J. Yeo, N. Satyanarayana, S. Kundu, S. Tripathy, and C.S.
Bhatia, Understanding the role of nitrogen in plasma-assisted surface
modification of magnetic recording media with and without ultrathin Carbon
Overcoats. Scientific Reports, 2015. 5: p. 7772.
61. Fridman, A., Plasma Chemistry. 2008, Cambridge University New York.
62. Norrman, K. and B. Winther-Jensen, Controlling the Plasma-polymerization
Process of N-Vinyl-2-pyrrolidone. Plasma Processes Polym., 2005. 2(5): p. 414-
423.
63. Lampert, C.M., Vacuum Deposition Coating Options for Finishers. Products
Finishing, 2013. 77(5): p. 48.
64. Juang, R.-S., C. Huang, and C.-L. Hsieh, Surface modification of PVDF
ultrafiltration membranes by remote argon/methane gas mixture plasma for
fouling reduction. J. Taiwan Inst. Chem. Eng., 2014. 45(5): p. 2176-2186.
65. Kull, K.R., M.L. Steen, and E.R. Fisher, Surface modification with nitrogen-
containing plasmas to produce hydrophilic, low-fouling membranes. Journal of
Membrane Science, 2005. 246(2): p. 203-215.
66. Saxena, N., C. Prabhavathy, S. De, and S. DasGupta, Flux enhancement by
argon–oxygen plasma treatment of polyethersulfone membranes. Separation and
Purification Technology, 2009. 70(2): p. 160-165.

197
67. Yasuda, H.K., Some Important Aspects of Plasma Polymerization. Plasma
Processes Polym., 2005. 2(4): p. 293-304.
68. Kochkodan, V., D.J. Johnson, and N. Hilal, Polymeric Membranes: Surface
Modification for Minimizing (bio)Colloidal Fouling. Adv. Colloid Interface Sci.,
2014. 206(0): p. 116-140.
69. Michelmore, A., P.M. Bryant, D.A. Steele, K. Vasilev, J.W. Bradley, and R.D.
Short, Role of positive ions in determining the deposition rate and film chemistry
of continuous wave hexamethyl disiloxane plasmas. Langmuir, 2011. 27(19): p.
11943-11950.
70. Tyszler, D., R.G. Zytner, A. Batsch, A. Brügger, S. Geissler, H. Zhou, D. Klee,
and T. Melin, Reduced fouling tendencies of ultrafiltration membranes in
wastewater treatment by plasma modification. Desalination, 2006. 189: p. 119-
129.
71. u, L., I. Vidalis, D. Steele, A. Michelmore, S.P. Low, and J.Q.J.C. Verberk,
Surface hydrophilic modification of RO membranes by plasma polymerization
for low organic fouling. Journal of Membrane Science, 2011. 369(1–2): p. 420-
428.
72. Albo, J., J. Wang, and T. Tsuru, Application of Interfacially Polymerized
Polyamide Composite Membranes to Isopropanol Dehydration: Effect of
Membrane Pre-treatment and Temperature. Journal of Membrane Science,
2014. 453(0): p. 384-393.
73. Porter, M.C., Handbook of industrial membrane technology. Noyes
Publications, New Jersey, 1989 pp-143.
74. Filmtec, D. Handling, Preservation and Storage: Re-wetting of Dried Out
Elements Home

198
Page.http://www.dowwaterandprocess.com/en/resources/reverse-osmosis-
technical-manual (accessed March, 2014). 2013.
75. Chapiro, A., General consideration of the radiation chemistry of polymers.
Nuclear Instruments and Methods in Physics Research Section B: Beam
Interactions with Materials and Atoms, 1995. 105(1–4): p. 5-7.
76. Bikit, I., Gamma Rays : Technology, Applications, and Health Implications.
2013, Hauppauge, New York: Nova Publishers.
77. Huang, C., C.-Y. Tsai, R.-S. Juang, and H.-C. Kao, Tailoring surface properties
of cellulose acetate membranes by low-pressure plasma processing. Journal of
Applied Polymer Science, 2010. 118(6): p. 3227-3235.
78. Cadotte, J.E., Petersen, R.J., Larson, R.E., Erickson, E.E. , A New Thin-film
Composite Seawater Reverse Osmosis Membrane. Desalination, 1980. 32: p. 25-
31.
79. Kim, E.-S. and B. Deng, Effect of NH3 plasma on thin film composite
membrane: relationship of membrane and plasma properties. Membrane Water
Treatment, 2013. 4(2): p. 109-126.
80. Duarte, A.P. and J.C. Bordado, 12 - Smart composite reverse-osmosis
membranes for energy generation and water desalination processes A2 -
Montemor, M.F, in Smart Composite Coatings and Membranes. 2016,
Woodhead Publishing. p. 329-350.
81. Fujioka, T., N. Oshima, R. Suzuki, S.J. Khan, A. Roux, Y. Poussade, J.E.
Drewes, and L.D. Nghiem, Rejection of small and uncharged chemicals of
emerging concern by reverse osmosis membranes: The role of free volume space
within the active skin layer. Separation and Purification Technology, 2013. 116:
p. 426-432.

199
82. Bellona, C., J.E. Drewes, P. Xu, and G. Amy, Factors affecting the rejection of
organic solutes during NF/RO treatment—a literature review. Water Research,
2004. 38(12): p. 2795-2809.
83. Lawler, W., Assessment of end-of-life opportunities for reverse osmosis
membranes (Doctoral dissertation), in School of Chemical Engineering and
Faculty of Engineering. 2015, University of New South Wales.
84. Lee, J., A. Hill, and S. Kentish, Formation of a thick aromatic polyamide
membrane by interfacial polymerisation. Separation and Purification
Technology, 2013. 104: p. 276-283.
85. Gao, W., F. She, J. Zhang, L.F. Dumée, L. He, P.D. Hodgson, and L. Kong,
Understanding water and ion transport behaviour and permeability through
poly(amide) thin film composite membrane. Journal of Membrane Science,
2015. 487(0): p. 32-39.
86. Lee, K.P., T.C. Arnot, and D. Mattia, A review of reverse osmosis membrane
materials for desalination—Development to date and future potential. Journal of
Membrane Science, 2011. 370(1–2): p. 1-22.
87. Singh, P.S., S.V. Joshi, J.J. Trivedi, C.V. Devmurari, A.P. Rao, and P.K. Ghosh,
Probing the structural variations of thin-film composite RO membranes
obtained by coating polyamide over polysulfone membranes of different pore
dimensions. J. Membr. Sci., 2006. 278(1–2): p. 19-25.
88. Al-Jeshi, S. and A. Neville, An investigation into the relationship between flux
and roughness on RO membranes using scanning probe microscopy.
Desalination, 2006. 189(1–3): p. 221-228.

200
89. Childress, A.E. and S.S. Deshmukh, Effect of humic substances and anionic
surfactants on the surface charge and performance of reverse osmosis
membranes. Desalination, 1998. 118(1–3): p. 167-174.
90. Roh, I.J., Influence of rupture strength of interfacially polymerized thin-film
structure on the performance of polyamide composite membranes. Journal of
Membrane Science, 2002. 198(1): p. 63-74.
91. Hirose, M., H. Ito, and Y. Kamiyama, Effect of skin layer surface structures on
the flux behaviour of RO membranes. J. Membr. Sci. , 1996. 121(2): p. 209-215.
92. Kimura, K., G. Amy, J.E. Drewes, T. Heberer, T.-U. Kim, and Y. Watanabe,
Rejection of organic micropollutants (disinfection by-products, endocrine
disrupting compounds, and pharmaceutically active compounds) by NF/RO
membranes. Journal of Membrane Science, 2003. 227(1–2): p. 113-121.
93. Childress, A.E. and M. Elimelech, Relating Nanofiltration Membrane
Performance to Membrane Charge (Electrokinetic) Characteristics. Environ.
Sci. Technol., 2000. 34(17): p. 3710-3716.
94. Elimelech, M., X. Zhu, A.E. Childress, and S. Hong, Role of membrane surface
morphology in colloidal fouling of cellulose acetate and composite aromatic
polyamide reverse osmosis membranes. Journal of Membrane Science, 1997.
127(1): p. 101-109.
95. Khulbe, K.C., C. Feng, and T. Matsuura, The art of surface modification of
synthetic polymeric membranes. Journal of Applied Polymer Science, 2010.
115(2): p. 855-895.
96. Zhang, Q., C. Zhang, J. Xu, Y. Nie, S. Li, and S. Zhang, Effect of poly(vinyl
alcohol) coating process conditions on the properties and performance of
polyamide reverse osmosis membranes. Desalination, 2016. 379: p. 42-52.

201
97. Bandini, S. and D. Vezzani, Nanofiltration modeling: the role of dielectric
exclusion in membrane characterization. Chemical Engineering Science, 2003.
58(15): p. 3303-3326.
98. Kwak, S.-Y. and D. Woo Ihm, Use of atomic force microscopy and solid-state
NMR spectroscopy to characterize structure-property-performance correlation
in high-flux reverse osmosis (RO) membranes. Journal of Membrane Science,
1999. 158: p. 143-153.
99. Karan, S., Z. Jiang, and A.G. Livingston, Sub–10 nm polyamide nanofilms with
ultrafast solvent transport for molecular separation. Science, 2015. 348(6241):
p. 1347-1351.
100. Lin, L., R. Lopez, G.Z. Ramon, and O. Coronell, Investigating the void structure
of the polyamide active layers of thin-film composite membranes. Journal of
Membrane Science, 2016. 497: p. 365-376.
101. Seidel, A., J.J. Waypa, and M. Elimelech, Role of Charge (Donnan) Exclusion
in Removal of Arsenic from Water by a Negatively Charged Porous
Nanofiltration Membrane. Environmental Engineering Science, 2001. 18(2): p.
105-113.
102. Xu, J., Z. Wang, J. Wang, and S. Wang, Positively charged aromatic polyamide
reverse osmosis membrane with high anti-fouling property prepared by
polyethylenimine grafting. Desalination, 2015. 365: p. 398-406.
103. Zhang, Y., B. Van der Bruggen, G.X. Chen, L. Braeken, and C. Vandecasteele,
Removal of pesticides by nanofiltration: effect of the water matrix. Separation
and Purification Technology, 2004. 38(2): p. 163-172.
104. Zhong, P.S., N. Widjojo, T.-S. Chung, M. Weber, and C. Maletzko, Positively
charged nanofiltration (NF) membranes via UV grafting on sulfonated

202
polyphenylenesulfone (sPPSU) for effective removal of textile dyes from
wastewater. Journal of Membrane Science, 2012. 417–418: p. 52-60.
105. Mauter, M.S., Y. Wang, K.C. Okemgbo, C.O. Osuji, E.P. Giannelis, and M.
Elimelech, Antifouling Ultrafiltration Membranes via Post-Fabrication Grafting
of Biocidal Nanomaterials. ACS Applied Materials & Interfaces, 2011. 3(8): p.
2861-2868.
106. Carvalho, A.L., F. Maugeri, P. Prádanos, V. Silva, and A. Hernández,
Separation of potassium clavulanate and potassium chloride by nanofiltration:
Transport and evaluation of membranes. Separation and Purification
Technology, 2011. 83: p. 23-30.
107. Farid, O., F. Mansour, M. Habib, J. Robinson, and S. Tarleton, Investigating the
sorption influence of poly(vinyl alcohol) (PVA) at different crosslinking content.
Journal of Environmental Chemical Engineering, 2016. 4(1): p. 293-298.
108. Belfer, S., Y. Purinson, and O. Kedem, Surface modification of commercial
polyamide reverse osmosis membranes by radical grafting: An ATR-FTIR study.
Acta Polymerica, 1998. 49(10-11): p. 574-582.
109. Belfer, S., J. Gilron, Y. Purinson, R. Fainshtain, N. Daltrophe, M. Priel, B.
Tenzer, and A. Toma, Effect of surface modification in preventing fouling of
commercial SWRO membranes at the Eilat seawater desalination pilot plant.
Desalination, 2001. 139(1-3): p. 169-176.
110. Belfer, S., Y. Purinson, and O. Kedem, Reducing fouling of RO membranes by
redox-initiated graft polymerization. Desalination, 1998. 119(1-3): p. 189.
111. Bernstein, R., S. Belfer, and V. Freger, Surface Modification of Dense
Membranes Using Radical Graft Polymerization Enhanced by Monomer
Filtration. Langmuir, 2010. 26(14): p. 12358-12365.

203
112. Bernstein, R., S. Belfer, and V. Freger, Bacterial Attachment to RO Membranes
Surface-Modified by Concentration-Polarization-Enhanced Graft
Polymerization. Environ. Sci. Technol., 2011. 45(14): p. 5973-5980.
113. Zhang, J., C.Q. Cui, T.B. Lim, E.-T. Kang, K.G. Neoh, S.L. Lim, and K.L. Tan,
Chemical Modification of Silicon (100) Surface via UV-Induced Graft
Polymerization. Chem. Mater., 1999. 11(4): p. 1061-1068.
114. Blok, A.J., R. Chhasatia, J. Dilag, and A.V. Ellis, Surface Initiated
Polydopamine Grafted Poly([2-(methacryoyloxy)ethyl]trimethylammonium
chloride) Coatings to Produce Reverse Osmosis Desalination Membranes with
Anti-Biofouling Properties. J. Membr. Sci., 2014. 468(0): p. 216-223.
115. Cheng, Q., Y. Zheng, S. Yu, H. Zhu, X. Peng, J. Liu, J. Liu, M. Liu, and C. Gao,
Surface modification of a commercial thin-film composite polyamide reverse
osmosis membrane through graft polymerization of N-isopropylacrylamide
followed by acrylic acid. J. Membr. Sci., 2013. 447: p. 236-245.
116. Wang, J., Z. Wang, J. Wang, and S. Wang, Improving the water flux and bio-
fouling resistance of reverse osmosis (RO) membrane through surface
modification by zwitterionic polymer. Journal of Membrane Science, 2015. 493:
p. 188-199.
117. Jaleh Mansouri, S.H., Vicki Chen, Strategies for Biofouling in Membrane
Filtration Systems: Challenges and Opportinities. J. Mater. Chem., 2010. 20: p.
4567-4567.
118. Karamdoust, S., B. Yu, C.V. Bonduelle, Y. Liu, G. Davidson, G. Stojcevic, J.
Yang, W.M. Lau, and E.R. Gillies, Preparation of Antibacterial Surfaces by
Hyperthermal Hydrogen Induced Cross-Linking of Polymer Thin Films. J.
Mater. Chem., 2012. 22(11): p. 4881-4889.

204
119. Franks, R., M. Wilf, and C. Bartels, Advances in Membrane Performance.
120. Yoon, K., B.S. Hsiao, and B. Chu, High flux ultrafiltration nanofibrous
membranes based on polyacrylonitrile electrospun scaffolds and crosslinked
polyvinyl alcohol coating. Journal of Membrane Science, 2009. 338(1): p. 145-
152.
121. Wang, X., D. Fang, K. Yoon, B.S. Hsiao, and B. Chu, High performance
ultrafiltration composite membranes based on poly (vinyl alcohol) hydrogel
coating on crosslinked nanofibrous poly (vinyl alcohol) scaffold. Journal of
Membrane Science, 2006. 278(1): p. 261-268.
122. Nikkola, J., X. Liu, Y. Li, M. Raulio, H.-L. Alakomi, J. Wei, and C.Y. Tang,
Surface modification of thin film composite RO membrane for enhanced anti-
biofouling performance. J. Membr. Sci., 2013. 444: p. 192-200.
123. Azari, S. and L. Zou, Using zwitterionic amino acid l-DOPA to modify the
surface of thin film composite polyamide reverse osmosis membranes to
increase their fouling resistance. Journal of Membrane Science, 2012. 401–402:
p. 68-75.
124. Yasuda, H., Plasma polymerization 1985, Orlando, Florida 32887: Academic
Press, INC.
125. Fitzpatrick, R., Plasma physics : an introduction. 2015: Boca Raton : CRC
Press, [2015].
126. Os, M.T., Surface modification by plasma polymerization: film deposition,
tailoring of surface properties and biocompatibility. 2000: Universiteit Twente.
127. Chan, C.M., T.M. Ko, and H. Hiraoka, Polymer surface modification by plasmas
and photons. Surface Science Reports, 1996. 24(1–2): p. 1-54.

205
128. Kaufman and Robinson, Inc. (KRI®) engineers and manufactures broad beam
ion and plasma products. Home page:
http://www.ionsources.com/applications.htm (accessed in January,2016). 2015.
129. Marchant, R.E., D. Yu, and C. Khoo, Preparation and characterization of
plasma-polymerized N-vinyl-2-pyrrolidone films. Journal of Polymer Science
Part A: Polymer Chemistry, 1989. 27(3): p. 881-895.
130. Pethrick, R.A., Plasma surface modification of polymers: relevance to adhesion.
Polymer International. Vol. 39. 1996: John Wiley & Sons. 79-79.
131. Buonomenna, M.G., L.C. Lopez, M. Davoli, P. Favia, R. d’ Agostino, and E.
Drioli, Polymeric membranes modified via plasma for nanofiltration of aqueous
solution containing organic compounds. Microporous and Mesoporous
Materials, 2009. 120(1–2): p. 147-153.
132. Wu, S., J. Xing, C. Zheng, G. Xu, G. Zheng, and J. Xu, Plasma modification of
aromatic polyamide reverse osmosis composite membrane surface. Journal of
Applied Polymer Science, 1997. 64(10): p. 1923-1926.
133. Kim, E.-S., Q. Yu, and B. Deng, Plasma Surface Modification of Nanofiltration
(NF) Thin-Film Composite (TFC) Membranes to Improve Anti Organic Fouling.
Appl. Surf. Sci., 2011. 257(23): p. 9863-9871.
134. Juang, R.-S., C. Huang, and C.-L. Hsieh, Surface modification of PVDF
ultrafiltration membranes by remote argon/methane gas mixture plasma for
fouling reduction. Journal of the Taiwan Institute of Chemical Engineers, 2014.
45(5): p. 2176-2186.
135. Steen, M.L., L. Hymas, E.D. Havey, N.E. Capps, D.G. Castner, and E.R. Fisher,
Low temperature plasma treatment of asymmetric polysulfone membranes for

206
permanent hydrophilic surface modification. Journal of Membrane Science,
2001. 188(1): p. 97-114.
136. Tyszler, D., R.G. Zytner, A. Batsch, A. Brügger, S. Geissler, H. Zhou, D. Klee,
and T. Melin, Reduced fouling tendencies of ultrafiltration membranes in
wastewater treatment by plasma modification. Desalination, 2006. 189(1–3): p.
119-129.
137. Tompkins, B.D., J.M. Dennison, and E.R. Fisher, H2O plasma modification of
track-etched polymer membranes for increased wettability and improved
performance. Journal of Membrane Science, 2013. 428: p. 576-588.
138. Steen, M.L., A.C. Jordan, and E.R. Fisher, Hydrophilic modification of
polymeric membranes by low temperature H 2 O plasma treatment. Journal of
Membrane Science, 2002. 204(1): p. 341-357.
139. Chen, H. and G. Belfort, Surface modification of poly(ether sulfone)
ultrafiltration membranes by low-temperature plasma-induced graft
polymerization. Journal of Applied Polymer Science, 1999. 72(13): p. 1699-
1711.
140. Ulbricht, M. and G. Belfort, Surface modification of ultrafiltration membranes
by low temperature plasma II. Graft polymerization onto polyacrylonitrile and
polysulfone. Journal of Membrane Science, 1996. 111(2): p. 193-215.
141. Gao, W., F. She, J. Zhang, L.F. Dumée, L. He, P.D. Hodgson, and L. Kong,
Understanding water and ion transport behaviour and permeability through
poly(amide) thin film composite membrane. Journal of Membrane Science,
2015. 487: p. 32-39.
142. Švorčík, V., K. Kolářová, P. Slepička, A. Macková, M. Novotná, and V.
Hnatowicz, Modification of surface properties of high and low density

207
polyethylene by Ar plasma discharge. Polymer Degradation Stability, 2006.
91(6): p. 1219-1225.
143. Oehrlein, G.S., R.J. Phaneuf, and D.B. Graves, Plasma-polymer interactions: A
review of progress in understanding polymer resist mask durability during
plasma etching for nanoscale fabrication. Journal of Vacuum Science &
Technology: Part B-Nanotechnology & Microelectronics, 2011. 29(1): p.
010801.
144. Barton, D., J.W. Bradley, K.J. Gibson, D.A. Steele, and R.D. Short, An In Situ
Comparison between VUV photon and ion energy fluxes to polymer surfaces
immersed in an rf plasma. The Journal of Physical Chemistry B, 2000. 104(30):
p. 7150-7153.
145. D'Agostino, R., Advanced plasma technology. 2008: Weinheim ; Chichester :
Wiley-VCH.
146. Borcia, C., G. Borcia, and N. Dumitrascu, Relating plasma surface modification
to polymer characteristics. Appl. Phys. A: Mater. Sci. Process., 2008. 90(3): p.
507-515.
147. Sadiqali Cheruthazhekatt, M.C., Pavel Slavicek, Josef Havel, Gas plasmas and
plasma modified materials in medicine. J. Appl. Biomed., 2010. 8: p. 55-66.
148. Reis, R., L.F. Dumée, A. Merenda, J.D. Orbell, J.A. Schütz, and M.C. Duke,
Plasma-induced physicochemical effects on a poly(amide) thin-film composite
membrane. Desalination.
149. Reis, R., L.F. Dumée, B.L. Tardy, R. Dagastine, J.D. Orbell, J.A. Schutz, and
M.C. Duke, Towards Enhanced Performance Thin-film Composite Membranes
via Surface Plasma Modification. Scientific Reports, 2016. 6: p. 29206.

208
150. Combernoux, N., V. Labed, L. Schrive, Y. Wyart, E. Carretier, and P. Moulin,
Effect of gamma irradiation at intermediate doses on the performance of reverse
osmosis membranes. Radiation Physics and Chemistry.
151. Combernoux, N., L. Schrive, V. Labed, Y. Wyart, E. Carretier, A. Benony-
Rhodier, and P. Moulin, Study of polyamide composite reverse osmosis
membrane degradation in water under gamma rays. Journal of Membrane
Science, 2015. 480(0): p. 64-73.
152. Masuelli, M.A., M. Grasselli, J. Marchese, and N.A. Ochoa, Preparation,
structural and functional characterization of modified porous PVDF membranes
by γ-irradiation. Journal of Membrane Science, 2012. 389: p. 91-98.
153. Chauhan, G.S., B. Singh, S. Chauhan, S.K. Dhiman, and D. Kumar, A study of
the synthesis, kinetics, and characterization of reactive graft copolymers of
poly(vinyl imidazole) and cellulose for use as supports in enzyme immobilization
and metal ion uptake. Journal of Applied Polymer Science, 2006. 100(2): p.
1522-1530.
154. Ajji, Z. and A.M. Ali, Preparation of poly (vinyl alcohol) membranes grafted
with N-vinyl imidazole/acrylic acid binary monomers. Nuclear Instruments and
Methods in Physics Research Section B: Beam Interactions with Materials and
Atoms, 2005. 236(1): p. 580-586.
155. Park, S.Y., S.G. Kim, J.H. Chun, B.-H. Chun, and S.H. Kim, Fabrication and
characterization of the chlorine-tolerant disulfonated poly(arylene ether
sulfone)/hyperbranched aromatic polyamide-grafted silica composite reverse
osmosis membrane. Desalination and Water Treatment, 2012. 43(1-3): p. 221-
229.

209
156. Shim, J.K., H.S. Na, Y.M. Lee, H. Huh, and Y.C. Nho, Surface modification of
polypropylene membranes by γ-ray induced graft copolymerization and their
solute permeation characteristics. Journal of Membrane Science, 2001. 190(2):
p. 215-226.
157. Delgado, A.V., F. González-Caballero, R.J. Hunter, L.K. Koopal, and J.
Lyklema, Measurement and interpretation of electrokinetic phenomena. Journal
of Colloid and Interface Science, 2007. 309(2): p. 194-224.
158. Zdeňka, K., M. Zuzana, K. Kateřina, S. Nikola Kasálková, T. Simona, Ř. Alena,
S. Jakub, and Š. Václav, Electrokinetic Potential and Other Surface Properties
of Polymer Foils and Their Modifications. 2013.
159. Vandencasteele, N. and F. Reniers, Plasma-modified polymer surfaces:
characterization using XPS. Journal of Electron Spectroscopy and Related
Phenomena, 2010. 178–179(0): p. 394-408.
160. Dumee, L.F., L. He, P.C. King, M.L. Moing, I. Guller, M. Duke, P.D. Hodgson,
S. Gray, A.J. Poole, and L. Kong, Towards Integrated Anti-microbial
Capabilities: Novel Bio-Fouling Resistant Membranes by High Velocity
Embedment of Silver Particles. J. Membr. Sci., 2015. 475: p. 552-561.
161. Reis, R., L.F. Dumée, B.L. Tardy, R. Dagastine, J.D. Orbell, J.A. Schutz, and
M.C. Duke, Towards Enhanced Performance Thin-film Composite Membranes
via Surface Plasma Modification. Scientific reports, 2016. 6.
162. Filmtec, D. Reverse osmosis membranes, technical manual:
http://msdssearch.dow.com/PublishedLiteratureDOWCOM/dh_0042/0901b8038
0042dd2.pdf?filepath=liquidseps/pdfs/noreg/609-02002.pdf (accessed in July
2015).

210
163. Kwak, S.-Y., Relationship of relaxation property to reverse osmosis
permeability in aromatic polyamide thin-film-composite membranes. Polymer,
1999. 40(23): p. 6361-6368.
164. Azari, S., L. Zou, and E. Cornelissen, Assessing the effect of surface
modification of polyamide RO membrane by L-DOPA on the short range
physiochemical interactions with biopolymer fouling on the membrane. Colloids
Surf., B, 2014. 120: p. 222-228.
165. Mondal, S. and S.R. Wickramasinghe, Photo-induced graft polymerization of N-
isopropyl acrylamide on thin film composite membrane: Produced water
treatment and antifouling properties. Sep. Purif. Technol., 2012. 90: p. 231-238.
166. Pal, S., S.K. Ghatak, S. De, and S. DasGupta, Characterization of CO2 plasma
treated polymeric membranes and quantification of flux enhancement. Journal of
Membrane Science, 2008. 323(1): p. 1-10.
167. Park, Y.W. and N. Inagaki, Surface modification of poly(vinylidene fluoride)
film by remote Ar, H2, and O2 plasmas. Polymer, 2003. 44(5): p. 1569-1575.
168. Andrew Lee, S., G.W. Stevens, and S.E. Kentish, Facilitated transport behavior
of humidified gases through thin-film composite polyamide membranes for
carbon dioxide capture. Journal of Membrane Science, 2013. 429(0): p. 349-
354.
169. Lawler, W., Assessment of end-of-life opportunities for reverse osmosis
membranes, in School of Chemical Engineering and Faculty of Engineering.
2015, University of New South Wales.
170. Wavhal, D.S. and E.R. Fisher, Modification of porous poly(ether sulfone)
membranes by low-temperature CO2-plasma treatment. Journal of Polymer
Science Part B: Polymer Physics, 2002. 40(21): p. 2473-2488.

211
171. Tang, C.Y., Y.-N. Kwon, and J.O. Leckie, Effect of membranes chemistry and
coating layer on physiochemical properties of thin film composite polyamide ro
and nf membranes: II membrane physiochemical properties and their
dependence on polyamide and coating layers. Desalination, 2009. 242(1–3): p.
168-182.
172. Tang, C.Y., Y.-N. Kwon, and J.O. Leckie, Probing the nano and micro-scales of
reverse osmosis membranes - a comprehensive characterization of
physiochemical properties of uncoated and coated membranes by XPS, TEM,
ATR-FTIR, and streaming potential measurements. Journal of Membrane
Science, 2007. 287(1): p. 146-156.
173. Coates, J., Interpretation of Infrared Spectra, A Practical Approach, in
Encyclopedia of Analytical Chemistry. 2006, John Wiley & Sons, Ltd.
174. Tse, K.C.C., F.M.F. Ng, and K.N. Yu, Photo-degradation of PADC by UV
radiation at various wavelengths. Polymer Degradation and Stability, 2006.
91(10): p. 2380-2388.
175. Yasuda, H., H.C. Marsh, E.S. Brandt, and C.N. Reilley, ESCA study of polymer
surfaces treated by plasma. J. Polym. Sci., Part A: Polym. Chem., 1977. 15(4):
p. 991-1019.
176. Dufour, T., J. Hubert, N. Vandencasteele, and F. Reniers, Chemical mechanisms
inducing a dc current measured in the flowing post-discharge of an RF He-O 2
plasma torch. Plasma Sources Sci. Technol., 2012. 21(4).
177. Wavhal, D.S. and E.R. Fisher, Hydrophilic modification of polyethersulfone
membranes by low temperature plasma-induced graft polymerization. Journal of
Membrane Science, 2002. 209(1): p. 255-269.

212
178. Prohaska, G.W., E.D. Johnson, and J.F. Evans, Preparation and
characterization of plasma-polymerized styrene thin films. Journal of Polymer
Science: Polymer Chemistry Edition, 1984. 22(11): p. 2953-2972.
179. Kubiak, K., M. Wilson, T. Mathia, and P. Carval, Wettability Versus Roughness
of Engineering Surfaces. Wear, 2011. 271(3): p. 523-528.
180. Holmes-Farley, S.R., C.D. Bain, and G.M. Whitesides, Wetting of functionalized
polyethylene film having ionizable organic acids and bases at the polymer-water
interface: relations between functional group polarity, extent of ionization, and
contact angle with water. Langmuir, 1988. 4(4): p. 921-937.
181. Elimelech, M., Z. Xiaohua, A.E. Childress, and H. Seungkwan, Role of
membrane surface morphology in colloidal fouling of cellulose acetate and
composite aromatic polyamide reverse osmosis membranes. J. Membr. Sci.,
1997. 127(1): p. 101-109.
182. Misdan, N., W.J. Lau, and A.F. Ismail, Seawater reverse osmosis (SWRO)
desalination by thin-film composite membrane - current development,
challenges and future prospects. Desalination, 2012. 287: p. 228-237.
183. Friedrich, J., Interaction between Plasma and Polymers, in The Plasma
Chemistry of Polymer Surfaces. 2012, Wiley-VCH Verlag GmbH & Co. KGaA.
p. 11-33.
184. Van Wagner, E.M., A.C. Sagle, M.M. Sharma, Y.-H. La, and B.D. Freeman,
Surface modification of commercial polyamide desalination membranes using
poly(ethylene glycol) diglycidyl ether to enhance membrane fouling resistance.
Journal of Membrane Science, 2011. 367(1–2): p. 273-287.

213
185. Kochkodan, V., D.J. Johnson, and N. Hilal, Polymeric membranes: Surface
modification for minimizing (bio)colloidal fouling. Advances in Colloid and
Interface Science, 2014. 206: p. 116-140.
186. Fahmy, A. and J. Friedrich, Degradation behavior of thin polystyrene films on
exposure to Ar plasma and its emitted radiation. Journal of Adhesion Science &
Technology, 2013. 27(3): p. 324-338.
187. Hegemann, D., H. Brunner, and C. Oehr, Plasma treatment of polymers for
surface and adhesion improvement. Nuclear Instruments and Methods in
Physics Research Section B: Beam Interactions with Materials and Atoms, 2003.
208(0): p. 281-286.
188. F. La Terra, S.B., J. Ardini, R. Price, A. Preobrajenski, H. M. Colquhoun, G.
Held, Conformation of the pyromellitic diimide macrocycle (PM) adsorbed on
Au{111} studied by STM and NEXAFS, R.s. radiation, Editor. 2013: Sweden.
189. Friedrich, J., Bulk, Ablative, and Side Reactions, in The Plasma Chemistry of
Polymer Surfaces. 2012, Wiley-VCH Verlag GmbH & Co. KGaA. p. 145-195.
190. Grundke, K., M. Stamm, and H.-J. Adler, Characterization of polymer surfaces
and thin films. Progress in colloid and polymer science: v. 132. 2006: Berlin :
Springer.
191. Řezníčková, A., Z. Kolská, V. Hnatowicz, P. Stopka, and V. Švorčík,
Comparison of glow argon plasma-induced surface changes of thermoplastic
polymers. Nuclear Instruments and Methods in Physics Research Section B:
Beam Interactions with Materials and Atoms, 2011. 269(2): p. 83-88.
192. Kulkarni, A., D. Mukherjee, and W.N. Gill, Flux enhancement by
hydrophilization of thin film composite reverse osmosis membranes. Journal of
Membrane Science 1996. 114(1): p. 39-50.

214
193. Hsieh, Y.L. and M. Wu, Residual reactivity for surface grafting of acrylic acid
on argon glow‐discharged poly (ethylene terephthalate)(PET) films. Journal of
applied polymer science, 1991. 43(11): p. 2067-2082.
194. Gupta, B., J. Hilborn, C. Hollenstein, C.J.G. Plummer, R. Houriet, and N.
Xanthopoulos, Surface modification of polyester films by RF plasma. Journal of
Applied Polymer Science, 2000. 78(5): p. 1083-1091.
195. Gonzalez-Gago, C., J. Pisonero, R. Sandin, J.F. Fuertes, A. Sanz-Medel, and N.
Bordel, Analytical potential of rf-PGD-TOFMS for depth profiling of an
oxidized thin film composite. Journal of Analytical Atomic Spectrometry, 2015.
196. Freger, V., Outperforming nature's membranes. Science, 2015. 348(6241): p.
1317-1318.
197. Reiter, G., M. Hamieh, P. Damman, S. Sclavons, S. Gabriele, T. Vilmin, and E.
Raphael, Residual stresses in thin polymer films cause rupture and dominate
early stages of dewetting. Nat Mater, 2005. 4(10): p. 754-758.
198. Filmtec, D. Desalination Technologies and Filtration Processes Home Page on
the Web. http://www.dowwaterandprocess.com/en/resources/reverse-osmosis-
technical-manual (accessed Jan, 2013). Form No. 609-02002-504].
199. Wu, S., G. Zheng, H. Lian, J. Xing, and L. Shen, Chlorination and Oxidation of
Aromatic Polyamides. I. Synthesis and Characterization of Some Aromatic
Polyamides. J. Appl. Polym. Sci., 1996. 61(3): p. 415-420.
200. Tang, C.Y., Y.-N. Kwon, and J.O. Leckie, Effect of membrane chemistry and
coating layer on physiochemical properties of thin film composite polyamide RO
and NF membranes: I. FTIR and XPS characterization of polyamide and
coating layer chemistry. Desalination, 2009. 242(1–3): p. 149-167.

215
201. Haris, P.I., F. Severcan, and I.O.S. Press, Vibrational Spectroscopy in Diagnosis
and Screening. Adv. Biomed. Spectrosc. 2012, Amsterdam: IOS Press.
202. Fu, Y., G. Li, M. Tian, X. Wang, L. Zhang, and W. Wang, Preparation of Silver
Nanoparticle Immobilized Fibrillar Silicate by Poly(dopamine) Surface
Functionalization. Journal of Applied Polymer Science, 2014. 131(3): p. n/a-n/a.
203. Welles, A.E., Silver Nanoparticles : Properties, Characterization and
Applications. 2010, Hauppauge, NY, USA: Nova Science Publishers, Inc.
204. Rizzello, L. and P.P. Pompa, Nanosilver-based Antibacterial Drugs and
Devices: Mechanisms, Methodological Drawbacks, and Guidelines. Chemical
Society Reviews, 2014. 43(5): p. 1501-1518.
205. Wang, X., Z. Ji, C.H. Chang, H. Zhang, M. Wang, Y.-P. Liao, S. Lin, H. Meng,
R. Li, B. Sun, L.V. Winkle, K.E. Pinkerton, J.I. Zink, T. Xia, and A.E. Nel, Use
of Coated Silver Nanoparticles to Understand the Relationship of Particle
Dissolution and Bioavailability to Cell and Lung Toxicological Potential. Small,
2014. 10(2): p. 385-398.
206. Mitrano, D., J.F. Ranville, C. Stephan, and C. Shelton, Quantitative Evaluation
of Nanoparticle Dissolution Kinetics Using Single Particle ICP-MS: A Case
Study with Silver Nanoparticles.
207. Liu, J., D.A. Sonshine, S. Shervani, and R.H. Hurt, Controlled Release of
Biologically Active Silver from Nanosilver Surfaces. ACS Nano, 2010. 4(11): p.
6903-6913.
208. Yin, J., Y. Yang, Z. Hu, and B. Deng, Attachment of silver nanoparticles
(AgNPs) onto thin-film composite (TFC) membranes through covalent bonding
to reduce membrane biofouling. Journal of Membrane Science, 2013. 441(0): p.
73-82.

216
209. Ademovic, Z., J. Wei, B. Winther-Jensen, X. Hou, and P. Kingshott, Surface
Modification of PET Films Using Pulsed AC Plasma Polymerisation Aimed at
Preventing Protein Adsorption. Plasma Processes and Polymers, 2005. 2(1): p.
53-63.
210. Ershov, S., R. Snyders, F. Khelifa, Y. Habibi, P. Dubois, V. Lemaur, J. Cornil,
and D. Cossement, Free radical generation and concentration in a plasma
polymer: The effect of aromaticity. ACS Applied Materials and Interfaces, 2014.
6(15): p. 12395-12405.
211. Hansen, R.H. and H. Schonhorn, A new technique for preparing low surface
energy polymers for adhesive bonding. Journal of Polymer Science Part B:
Polymer Letters, 1966. 4(3): p. 203-209.
212. Wright, J.S., E.R. Johnson, and G.A. DiLabio, Predicting the Activity of
Phenolic Antioxidants: Theoretical Method, Analysis of Substituent Effects, and
Application to Major Families of Antioxidants. Journal of the American
Chemical Society, 2001. 123(6): p. 1173-1183.
213. Li, X., T.-S. Chung, and T.-S. Chung, Effects of free volume in thin-film
composite membranes on osmotic power generation. AIChE Journal, 2013.
59(12): p. 4749-4761.
214. Jia, Q., Y. Xu, J. Shen, H. Yang, and L. Zhou, Effects of hydrophilic solvent and
oxidation resistance post surface treatment on molecular structure and forward
osmosis performance of polyamide thin-film composite (TFC) membranes.
Applied Surface Science, 2015. 356: p. 1105-1116.
215. Cui, Y., Z.-K. Yao, K. Zheng, S.-Y. Du, B.-K. Zhu, L.-P. Zhu, and C.-H. Du,
Positively-charged nanofiltration membrane formed by quaternization and

217
cross-linking of blend PVC/P(DMA-co-MMA) precursors. Journal of Membrane
Science, 2015. 492: p. 187-196.
216. Yasuda, H., Plasma polymerization, pp-337-338. 1985, Orlando, Florida 32887:
Academic Press, INC.
217. Pretsch, E., P. Bühlmann, and M. Badertscher, IR Spectroscopy, in Structure
Determination of Organic Compounds. 2009, Springer Berlin Heidelberg. p. 1-
67.
218. Hansen, J.E., B.I. Rickett, J.H. Payer, and H. Ishida, A study of the enhanced
oxidation of poly-N-vinylimidazole films on copper. Journal of Polymer Science
Part B: Polymer Physics, 1996. 34(4): p. 611-621.
219. Nasef, M.M., A.A. Aly, H. Saidi, and A. Ahmad, Optimization of Reaction
Parameters of Radiation Induced Grafting of 1-Vinylimidazole onto
Poly(ethylene-co-tetraflouroethene) Using Response Surface Method. Radiat.
Phys. Chem., 2011. 80(11): p. 1222-1227.
220. Zhu, W.-P., J. Gao, S.-P. Sun, S. Zhang, and T.-S. Chung, Poly(amidoamine)
dendrimer (PAMAM) grafted on thin film composite (TFC) nanofiltration (NF)
hollow fiber membranes for heavy metal removal. Journal of Membrane
Science, 2015. 487: p. 117-126.
221. Ponter, A.B. and M. Yekta-Fard, Contact angle variation on polymer surfaces.
Journal of Colloid and Interface Science, 1984. 101(1): p. 282-284.
222. Wamser, C.C. and M.I. Gilbert, Detection of surface functional group
asymmetry in interfacially-polymerized films by contact angle titrations.
Langmuir, 1992. 8(6): p. 1608-1614.

218
223. Allara, D.L., Aging of polymers. Environmental health perspectives, 1975. 11: p.
29.
224. El-Sayed Hegazy, A., Controlling of Degradation Effects in Radiation
Processing of Polymers. 2006.
225. Cañas, A., M.J. Ariza, and J. Benavente, Characterization of active and porous
sublayers of a composite reverse osmosis membrane by impedance
spectroscopy, streaming and membrane potentials, salt diffusion and X-ray
photoelectron spectroscopy measurements. Journal of Membrane Science, 2001.
183(1): p. 135-146.
226. Theodore L.Brown, H.E.L., Jr., Bruce E. Bursten, Chemistry, the central
science. 8th ed. 2000, New Jersey: Prentice-Hall, Inc.
227. Ferreira Esmi, C., L. Schrive, Y. Barre, J. Palmeri, and A. Deratani, Using
nanofiltration in a “zero-rejection” process: the removal of Ni2+ and Co2+
from salty wastewater. Desalination and Water Treatment, 2013. 51(1-3): p.
476-484.
228. Mehta, I.K., S. Kumar, G.S. Chauhan, and B.N. Misra, Grafting onto isotactic
polypropylene. III. Gamma rays induced graft copolymerization of water soluble
vinyl monomers. Journal of Applied Polymer Science, 1990. 41(5-6): p. 1171-
1180.

219
9. Appendices
Appendix 1
Figure A-4.1: Surface roughness measured by AFM analysis for argon plasma treated
membranes with no pre-condition step. The plasma conditions include excitation power at
10, 50 and 80 W and 1, 5, 15 and 30 min of treatment duration. The AFM maps show peak
heights coded into a range of dark to light colours.

220
Figure A-4.2: Height distributions calculated from AFM scans. The profiles are
characterized by FWHM, integrated area under the curve and peak value as a function
of plasma power and treatment time.

221
Table A-4.1: Elemental XPS analysis from water plasma treated membranes with
increasing N/C ratio for water plasma treated membranes [171].
Table A-4.2: Elemental XPS analysis from helium plasma treated membranes.
Power
density Membranes
C
(at%)
N
(at%)
O
(at%) N/C O/C
10W
Control 77.5 2.2 20.3 0.03 0.3
Water 1min 80.6 3.3 16.1 0.04 0.2
Water 2min 84.9 2.1 13.0 0.02 0.4
80W
Water 5 min 72.5 8.1 19.4 0.1 0.3
Water 1min 79.1 5.0 15.9 0.1 0.2
Water 2min 74.6 6.9 18.5 0.1 0.2
Water 5 min 72.6 8.8 18.6 0.1 0.2
Power
density Membranes C (at%) N (at%) O (at%) N/C O/C
10W
Control 77.5 2.2 20.3 0.03 0.3
He 2min
73.3
6.7
20.0
0.1
0.3
80 W
He 5 min 73.8 6.3 19.9 0.1 0.3

222
Table A-4.3: Elemental analysis of argon plasma modified membranes
Membranes C 1s
(at %)
N1s
(at %)
O1s
(at %)
S2p
(at %)
Control 76.5±0.5 5.5±0.2 18.2±0.3 0.09±0.03
1 min 10 W 75.9±0.8 4.4±1.8 19.6±2.4 0.08±0.05
5 min 10 W 75.7±0.9 5.7±0.3 18.7±0.9 0.08±0.04
15 min 10 W 76.4±0.4 6.7±0.2 16.8±0.3 0.10±0.06
30 min 10W 73.7±0.5 7.1±0.4 18.8±0.1 0.36±0.05
1 min 50 W 73.4±1.4 5.8±0.3 20.5±1.2 0.08±0.04
5 min 50 W 79.5±0.8 3.4±1.7 17.3±1.3 0.05±0.04
15 min 50 W 79.5±1.6 3.5±1.6 17.8±1.6 0.08±0.03
30 min 50W 69.9±1.2 6.5±1.4 22.7±1.5 0.83±0.02
1 min 80 W 75.4±0.8 5.5±0.4 18.9±0.7 0.04±0.02
5 min 80 W 74.4±1.6 6.8±0.5 17.8±1.1 0.08±0.01
15 min 80 W 70.6±2.0 8.3±0.2 20.4±0.5 0.61±0.01
30 min 80W 72.4±1.5 6.3±0.7 20.4±0.6 0.86±0.05

223
Appendix 2
Figure A-5.1: EDS spectra with silver peak at 3.0 keV for TFC-15 and silver contents
of weight 6 % and atomic 1%.

224
Figure A-5.2: Bacteria assessment with increased inhibition zone distance associated
amine rich and Ag NPs attached on membrane surfaces: a) TFC-control, b) TFC-VIm-
5Ag, c) TFC-VIm-9Ag and d) TFC-VIm-15Ag.
Figure A-5.3: SEMs of the fresh control membrane and fresh VIM plasma polymerized
membranes using an AC plasma reactor and process durations of 5, 9 and 15 min.

225
Figure A-5.4: SEMs of the fresh control membrane and fresh MA plasma polymerized
membranes using an AC plasma reactor and process durations of 5, 9 and 15 min.

226
Table A-5.1: XPS contents from pre-conditioned plasma polymerized membranes and
Ag NPs attachment
Table A-5.2: XPS contents from fresh plasma polymerized membranes with VIM and
MA monomers. The errors correspond to standard deviations from 3 measurements in
each sample
Membranes C (at%) N (at%) O (at%) S (at%) Ag (at%)
Control-Ag 78.9 3.2 17.8 0.2 0.1
5 min 72.7 11.5 15.1 0.4 0.3
9 min 70.9 13.8 14.3 0.6 0.4
15 min 70.1 12.6 15.6 1.2 0.5
Membranes C (at%) N (at%) O (at%) S (at%) N/C O/C
Control 76.5 ± 0.5 5.5 ± 0.2 18.2 ± 0.3 0 0.07 0.2
VIM-5 min 75.5 ± 3.5 11 ± 2.5 13 ± 0.9 0.5 ± 0.1 0.1 0.2
VIM-9 min 73.1 ± 0.9 13.3 ± 0.8 13.2 ± 0.1 0.4 ± 0.1 0.2 0.2
VIM-15 min 75 ± 0.4 11.2 ± 0.8 13.6 ± 0.2 0.3 ± 0.1 0.1 0.2
MA-5 min 77.2 ± 2 3.2 ± 0.3 19.3 ± 2 0.3 ± 0.1 0.04 0.2
MA-9 min 80.2 ± 1.3 2.6 ± 0.6 16.7 ± 0.8 0.5 ± 0.1 0.03 0.2
MA-15 min 63.0 ± 0.6 1.9 ± 0.1 30.7 ± 0.8 2.3 ± 0.1 0.03 0.5

227
Table A-5.3: Relative BDEs were computed using the Density Functional Theory
(DFT) facilities of Sparan’06 software (Wavefunction, Inc.) on a standard PC. Each
energy was a single point calculation based on a semi-empirical equilibrium structure
from an equilibrium conformer starting structure - namely, B3LYP/6-
31+G*/AM1/MMFF.
E parent E radical EH. BDE
-514936.836
-514525.873
-313.926
97.040
-514508.297 114.613
-514503.451 119.459
-514498.483 114.427
-514507.730 115.180
-514505.521 117.389
-514505.460 117.450
-514504.379 118.531
-514505.460 117.450
-514505.532 117.388
-514512.232 110.678

228
Appendix 3
Figure A-6.1: Series of control membranes a) membranes exposed to MeOH/water
solution and increasing irradiation doses and b) membranes exposed to monomer
solutions (1, 10 and 35 v/v%). The error bars correspond to standard deviations of the
mean values.

229
Figure A-6.2: Surface roughness of irradiation-induced grafted TFC membranes with
VIM monomer measured by AFM with 5 x 5 µm scan size.

230
Figure A-6.3: SEM cross-sections of irradiation-induced grafted TFC membranes with
1 v/v% VIM monomer concentration and increasing irradiation total doses: 1, 10 and
100 kGy. The Psf layer from for the sample irradiated at 1 kGy was potentially
subjected to FIB artifacts caused by FIB cross-sectioning.

231
Figure A-6.4: SEM cross-sections of irradiation-induced grafted TFC membranes with
10 v/v% VIM monomer concentration.
Figure A-6.5: SEM cross-section of irradiation-induced grafted TFC membranes with
35 v/v% VIM concentration. The Psf layer from this series was compromised by to FIB
cross-sectioning.

232
Figure A-6.6: XPS analysis: C1s deconvolution of irradiation-induced grafted TFC
membranes with VIM monomer.

233
Figure A-6.7: Water contact angle of grated and control membranes a) in 1 v/v% VIM
solution, b) in 10 v/v% VIM solution, c) in 35 v/v% VIM solution and d) membranes in
MeOH/water. Error bars corresponds to standard deviations.

234
Table A-6.1: XPS elemental analysis of control membranes and irradiation-induced
grafted TFC membranes with VIM monomer. Error bars corresponds to standard
deviations
Sample C at% O at% N at% N/C O/C
O kGy
MeOH/water 82.1 14.3 3.6 0.04 0.17
1 v/v%-VIM 74.7 20.4 4.9 0.06 0.27
10 v/v%-VIM 75.0 17.8 7.2 0.09 0.23
35 v/v%-VIM 76.4 17.6 5.9 0.08 0.23
1 kGy
MeOH/water 79.9 14.5 5.6 0.07 0.18
1 v/v%-VIM 73.6 17.8 8.6 0.12 0.24
10 v/v%-VIM 80.7 13.7 5.6 0.07 0.17
35 v/v%-VIM 72.9 20.4 6.8 0.09 0.28
10 kGy
MeOH/water 78.1 18.7 2.8 0.03 0.24
1 v/v%-VIM 82.4 14.1 3.5 0.04 0.17
10 v/v%-VIM 80.7 13.7 5.4 0.07 0.17
35 v/v%-VIM 77.6 14.2 5.3 0.07 0.18
100 kGy
MeOH/water 75.7 21.7 2.6 0.03 0.29
1 v/v%-VIM 74.1 12.6 13.2 0.18 0.17
10 v/v%-VIM 72.1 11.4 16.6 0.23 0.16
35 v/v%-VIM 74.1 6.6 19.4 0.26 0.09

235
Figure A-6.8: Streaming potential analyses of irradiation-induced grafted TFC
membranes with VIM monomer grafted at 1 kGy total dose with increasing monomer
concentration, a) initial performance and b) after permeation and c) series of control
samples immersed in 1, 10 and 35 v/v% solution (no irradiation).

236
Appendix 4
Erratum
I. The reagent maleic acid was replaced by maleic anhydride in the following:
Page 2 line 17:
Original “The second involved [...] maleic acid (MA) to increase […].”
Corrected “The second involved [...] maleic anhydride (MA) to increase […].”
Page 20 line 29:
Original “Plasma polymerization process utilized monomers such as 1-
vinyl(imidazole) (VIM) and maleic acid (MA) […].”
Corrected “Plasma polymerization process utilized monomers such as 1-
vinyl(imidazole) and maleic anhydride (MA) […].”
Page 31 line 21:
Original “In this thesis […] amines (1-vinyl (imidazole) -VIM) and carboxylic
groups (maleic acid -MA).”
Corrected “In this thesis […] amines (1-vinyl (imidazole) -VIM) and carboxylic
groups (maleic anhydride -MA).”
Page 56 line 15:
Original “The reagents used […] and maleic acid that was used only in plasma
polymerization.”
Corrected “The reagents used […] and maleic anhydride that was used only in
plasma polymerization.”

237
Page 116 line 7:
Original “The monomer 1-vinyl(imidazole) (VIM) was employed to deliver
positive charges while the maleic acid (MA) […].”
Corrected “The monomer 1-vinyl(imidazole) (VIM) was employed to deliver
positive charges while the maleic anhydride (MA) […].”
II. Maleic acid structure was replaced by maleic anhydride in the following
Figures:
Page 136 Figure 5.13
Page 139 Figure 5.14 b
Page 149 Figure 5.19
Page 151 Figure 5.21
Page 152 Figure 5.22b
III. Computational calculations were recalculated based on maleic anhydride
molecule and replaced in Chapter 5, Section 5.4. Corrections were also made in
Chapter 7:
Page 149 Figure 5.19:
Original a) Both C–H bonds are equivalent and have the same BDE of 93
kcal/mol. Note that this is substantially lower (by 25 kcal/mol) than the
lowest BDE of 118 kcal/mol for the VIM monomer. b) The most […] by
25 kcal/mol - from 93 to 118 kcal/mol.
Corrected a) Both C–H bonds are equivalent and have the same BDE of 123.8
kcal/mol. Note that this is higher (by 5.8 kcal/mol) than the lowest BDE
of 118 kcal/mol for the VIM monomer. b) The most […] by 5.8 kcal/mol
- from 123.8 to 118 kcal/mol.
Page 151, Figure 5.21:
Original […] Note that the computed BDE for the vinyl hydrogen on the mono-
product itself (107 kcal/mol) reveals […]. It is also notable that the
calculated BDE for the vinyl hydrogen on the second attached MA
molecule is a relatively low 89 kcal/mol - suggesting a high degree of
activation for subsequent polymerization to occur.

238
Corrected […] Note that the computed BDE for the vinyl hydrogen on the mono-
product itself (125 kcal/mol) reveals […]. It is notable that, unlike with
VIM, the PA model is severely distorted in both of these adducts that
would suggest considerable steric hindrance of MA interacting with an
extended PA surface. This, together with the relatively higher BDE of
MA (123.8 kcal/mol) compared to VIM (118 kcal/mol), would suggest a
lower reaction rate of MA as compared to VIM, at least for the formation
of the mono-adducts. However, once formed the MA adducts could
produce a more extensive layer and more surface disruption, Fig 5.22
Page 154 line 24:
Original For example, the MA polymerization rate was theoretically shown to be
potentially higher than for the VIM monomer due to the relatively lower
BDE of the former, which influences the kinetics of product formation
during polymerization. These results provided significant evidence of the
potential differences in polymer growth which impacted on different film
thicknesses for each monomer
Corrected For example, the MA polymerization results in more extended
polymerized structures rate was theoretically shown to be potentially
higher than for the VIM monomer and results suggests that the intact
maleic anhydride is not favoured for surface attachment. MA hydrolyses
when exposed to air and it is most likely that during plasma
polymerization process the ring system could also open up with an input
of energy. This result may be due attributed to the steric interaction of the
MA ligand, both with other MA and the PA surface – via the ecocyclic
carbonyl moieties.
Page 183, line 6
Original However, the deposition rate […]. This is consistent with the results from
modelling studies Chapter 5, where MA was shown to be much more
susceptible to homolytic bond dissociation than VIM and is also expected
to form less sterically restrictive products with the PA.
Corrected However, the deposition rate […]. According to the results from
modelling studies Chapter 5, MA was shown to be less susceptible to
homolytic bond dissociation than VIM. However, as MA readily
hydrolyses to maleic acid when in contact with air, the deposition rate
was subjected to the influence of formed maleic acid since the thickness
measurements were performed when samples were in contact with air.

239