Embed Size (px)
Citation preview

Surface Modification of Polymer Membranes for Direct Methanol Fuel Cells
Thesis for the Master of Science Degree
Oskar Tynelius Department of Chemistry, Polymer & Materials Chemistry
Lund University, Sweden Examiner: Prof. Patric Jannasch
Thesis Work Performed at the Danish Technological Institute,
Høje-Taastrup, Denmark, 2010-2011 Supervisor: Dr. Yihua Yu

ii
PREFACE This thesis aims to report the works conducted on developing an improved polymer electrolyte membrane
for a direct methanol fuel cell. The work was carried out at the division for micro technology and surface
analysis at Teknologisk Institut in Copenhagen, during a time span of ten months, and was part of a project
called MicroPower, aimed at creating a fuel cell in the size range of a small battery. This thesis focuses on
methanol permeability reduction of the commercially available and widely used Nafion membrane, by
surface modification.
Vital additions to the work were done by a number of colleagues at the division. I would like to thank my
supervisor Dr. Yihua Yu for answering my avalanche of questions regarding general chemistry, Katherine
Bjørneboe and Erik Wisæus for excellent SEM imaging, Christian Kallesøe for IV-curve measurements and
participation in conductivity measurements, Lillemor Hansson for continuous feedback and support relating
to the Quartz Crystal Microbalance measurements, Anne-Charlotte Johansson for general electrochemistry
feedback, Klaus Krogsgaard for electronics tutoring, Torsten Lund-Olesen for general discussions on
membrane electrode assembly, Kenneth Brian Haugshøj for XPS characterisation and Jan Hales for
discussions on the whole fuel cell project.
ABSTRACT Two methods for surface modifying Nafion membranes for utilisation in Direct Methanol Fuel Cells (DMFC)
are investigated. In situ polymerisation of dopamine-melanin is used as a simple yet effective way of
reducing methanol permeability of Nafion by almost 70%. The polymerised layer is found to be stable in
operating conditions. The fabrications method is however inflexible and the conductive ability of the Nafion
is impaired. Layer-by-layer deposition of polyionic polymers is found to decrease the methanol permeability
with number of bilayers added, to an experimental minimum of 39% of that of pristine Nafion. The
conductivity was reduced, but found to be independent of number of layers added. The reaction
conditions are likely suboptimal, which rendered a very uneven surface coverage. The inhomogeneous
nature of the layer was confirmed using X-ray photoelectron spectroscopy (XPS). Methanol permeability
was measured using Quartz Crystal Microbalance (QCM) and conductivity was measured using
Electrochemical Impedance Spectroscopy (EIS).
SAMMANFATTNING Två olika metoder användes för att ytmodifiera Nafionmembran i syfte att använda dessa i bränsleceller.
Den ena metoden var in-situ-polymerisation av dopamin på Nafions yta, så att dopamin-melanin bildas.
Detta resulterade i en sänkning av metanolpermeabiliteten med nästan 70%. Lagret visade sig också vara
kemiskt motståndskraftigt. Metoden visade sig också vara inflexibel. I den andra metoden, layer-by-layer
deposition, tillfördes alternerande lager av polykatjoniska och polyanjoniska polymerer från lösning till ett
Nafionmembran. Den minimala metanolpermeabiliteten som uppnåddes med denna metod vad 39% av
obehandlat Nafions permeabilitet. Protonkonduktiviteten gick ner, men fanns vara oberoende av antalet
tillförda lager polymer. Lagerformationen var väldigt ojämn, och troligen suboptimal.

iii
Metanolpermeabiliteten mättes m.h.a. Quartz Crystal Microbalance (QCM) och konduktiviteten m.h.a.
Electrochemical Impedance Spectroscopy (EIS).

iv
CONTENTS
1. INTRODUCTION .............................................................................................................................. 1
1.1. Background ................................................................................................................................................... 1
1.2. The aim and outline of the thesis .................................................................................................................. 2
2. THEORY ............................................................................................................................................. 3
2.1. Orientation ................................................................................................................................................... 3
2.2. Fuel Cells fundamentals ................................................................................................................................ 5
2.2.1. Introduction ...................................................................................................................................................... 5
2.2.2. Direct Methanol Fuel Cell ................................................................................................................................. 5
2.2.3. Proton Conductivity .......................................................................................................................................... 6
2.2.4. Methanol permeability ..................................................................................................................................... 6
2.2.5. DMFC membrane characteristics ..................................................................................................................... 7
2.3. Nafion membrane ......................................................................................................................................... 8
2.4. Approach specific theory .............................................................................................................................. 9
2.4.1. Dopamine self-polymerising nano layer ........................................................................................................... 9
2.4.2. Layer-by-layer deposition ............................................................................................................................... 10
2.5. Risk assessment .......................................................................................................................................... 12
3. METHOD ......................................................................................................................................... 12
3.1. Measurement methods and materials ........................................................................................................ 12
3.1.1. Methanol permeability ................................................................................................................................... 12
3.1.2. Proton conductivity ........................................................................................................................................ 15
3.1.3. Polarization Curve Reference Measurement ................................................................................................. 17
3.1.4. SEM imaging ................................................................................................................................................... 18
3.1.5. Preparation and treatment of Nafion membranes ........................................................................................ 18
3.1.6. Dimensional swelling in water........................................................................................................................ 18
3.1.7. X-ray photoelectron spectroscopy ................................................................................................................. 18
3.2. Approach specific method .......................................................................................................................... 19
3.2.1. Self-polymerising dopamine-melanin ............................................................................................................ 19
3.2.2. Layer-by-layer deposition ............................................................................................................................... 20
4. RESULTS & DISCUSSION ............................................................................................................ 20
4.1. Dimensional swelling in water .................................................................................................................... 20
4.2. Optical appearance ..................................................................................................................................... 21
4.2.1. Dopamine-melanin ......................................................................................................................................... 21
4.2.2. Layer by layer deposition ............................................................................................................................... 21
4.3. SEM imaging ............................................................................................................................................... 21
4.3.1. Dopamine-melanin ......................................................................................................................................... 21

v
4.3.2. Layer by layer deposition ............................................................................................................................... 22
4.4. QCM measurements ................................................................................................................................... 25
4.4.1. Dopamine-melanin ......................................................................................................................................... 25
4.4.2. Layer by layer deposition ............................................................................................................................... 26
4.4.3. QCM measurement limitations ...................................................................................................................... 28
4.5. Conductivity ............................................................................................................................................... 28
4.5.1. Conductivity measurement limitations .......................................................................................................... 29
4.6. Selectivity ................................................................................................................................................... 30
4.7. Polarisation Curve Measurements .............................................................................................................. 30
4.7.1. Dopamine-melanin ......................................................................................................................................... 30
4.7.2. Layer-by-layer deposition ............................................................................................................................... 31
4.7.3. PCRM measurement limitations..................................................................................................................... 32
4.8. Resistance to methanol for Dopamine-melanin and Layer-by-layer deposition .......................................... 32
4.9. Dopamine-melanin resistance to alkaline environment .............................................................................. 32
4.10. XPS results for layer by layer deposition ..................................................................................................... 33
5. CONCLUSIONS ............................................................................................................................... 34
5.1. Major conclusions for Dopamine-melanin and LbL ..................................................................................... 34
5.2. Dopamine-melanin ..................................................................................................................................... 34
5.3. Layer-by-layer deposition ........................................................................................................................... 35
5.4. Suggestions for improvements ................................................................................................................... 35
5.5. Future research........................................................................................................................................... 36
6. REFERENCES ................................................................................................................................. 38
7. APPENDICES .................................................................................................................................. 40
7.1. MATLAB code example ............................................................................................................................... 40
7.2. Mathematical model used for permeability calculations ............................................................................ 42
7.3. Conductivity setup resistances and example of measurement curve .......................................................... 43
7.4. XPS results .................................................................................................................................................. 43

1
1. INTRODUCTION
1.1. Background The effort to create a commercially available fuel cell design has been on-going for decades. Since the
invention of fuel cells in 1838, the development has been severely hampered not only by technological
hinders. Likely the extensive use of fossil fuels have also been of great importance, as it offers a source of
energy so cheap that it still is far out of reach for most other sources of energy in terms of price per unit of
produced energy. Fuel cells do however have advantages and since the 1960s they have been used in the
NASA’s space shuttle program, where costs are less of an obstacle. The fuel cell principle can be applied in a
number of different designs, and can run on a wide variety of fuels. This has led to a somewhat diverse
research effort, where the hydrogen fuel cell is given a big share of the attention due to its possibilities in
the technically very important automotive industry. Since fuel cells do not give off any dangerous or
poisonous exhausts during operation, it sometimes is promoted as a “green” source of energy. The validity
of this argument is however very dependent on how the fuel is produced, an aspect that is not always
taken into consideration. One strong advantage of fuel cells is however that it is possible to choose where
to deploy the fuel production, and thus where the exhausts will be produced. In this way use of fuel cells
can lead to improvements in the local climate, as well as extending the amount of places where fuel
conversion can take place in a safe way. Examples of fuel cells can be seen in Figure 1.
Figure 1. Examples of different applications of fuel cells. A) DTI early prototype housing. Size ~ 10 mm. B) TOYOTA hydrogen fuel cell bus. C) Type 212 German submarine partly driven by a hydrogen fuel cell.
One sector where fuel cells seem likely to reach a commercial breakthrough is in consumer electronics.
Here the fuel cell performance is not matched against the combustion engine, but against batteries. In this
sector size, weight and recharging/replenishing are key characteristics and several of the fuel cell’s
advantages lie in these areas. Several consumer electronics giants, such as Toshiba and Fujitsu, have made
efforts in developing Direct Methanol Fuel Cells for use in for example laptops. 1
In later years, DMFCs have been given a lot of attention by the military industry, for example due to the
possibility of DMFC to provide additional electric power to soldiers in the field at a much reduced weight
compared to batteries. This might favour the position of DMFC applications at present, as the military
industry tends to put emphasis on performance, rather than price.
B C A

2
It might be in the above mentioned sector, as a “range extender” that the DMFC has its strongest appeal. In
symbiosis with a small battery which handles peak loads, the DMFC can continuously recharge a battery,
which works as intermediate energy storage between the fuel cell and the application.
1.2. The aim and outline of the thesis The aim of this thesis is to present the development and characterisation of Nafion based Polymer
Electrolyte Membranes (PEM) for a miniaturised DMFC. At Denmark’s Technological Institute (DTI), the
MicroPower project aims to achieve an effective DMFC of the size range of a small battery. The choice of a
DMFC for this purpose is due to the relatively simple design, which requires no pre-treatment of the fuel
inside the cell. Methanol also has a high energy density (MJ/L). This kind of fuel cell can be operated at low
temperatures, which is demanded. One of the essential components of a DMFC system is a well-designed
PEM.
At DTI the focus of the MicroPower project is to produce high performing DMFCs according to certain
design requirements. Since these are yet to be finally decided, general DMFC performance will be used for
evaluation. It is beyond the scope of this thesis to discuss commercial considerations such as price and
scalability of the production process. At present one major problem of the DMFC is the so called methanol
crossover. In this process, which is explained later in this report, methanol escapes from the fuel chamber
through the PEM to the cathode, where it reacts or evaporates. In this way a large proportion of the fuel in
the fuel container can be lost. This leads to both decreased service time, and decreased electric potential.
For this reason, the core focus of the work reported herein is to decrease the methanol permeability
of the membrane used in the DMFC, while maintaining proton conductivity and mechanical properties.
The objective of this report is to describe improvements of the performance of PEM according to the
criteria mentioned above. The evaluation of the membranes will be done through methanol permeability
tests and other methods. Hopefully this will demonstrate the applicability of some approaches for lowering
the methanol crossover in DMFCs.
Figure 2. Schematic structure of the factual membrane approaches followed.

3
In most aspects, this report follows standard notation and structure. Since several approaches have been
used in this thesis, it might still be of benefit to the reader to get a short introduction to the structure of it
(Figure 2). To try and address the problem of high methanol permeability in PEMs, two distinctively
different approaches were followed:
1. Surface modification of commercially available Nafion membrane through self-polymerisation of
dopamine, a small naturally occurring organic molecule.
2. Surface modification of commercially available Nafion membrane through Layer-by-Layer
deposition (LbL) of cationic and ionic polymers in alternating layers.
2. THEORY
2.1. Orientation The field of fuel cell research is very big and diverse. This also holds true for the research on DMFC. Thus,
an attempt to overview the whole field of DMFCs will not made. Instead an effort to present this thesis in
its context will be made.
As of the beginning of 2011, there is no clear alternative to Nafion membranes (by DuPont), which have
been around for several decades. Instead there is a large and diversified research effort to find suitable
membrane materials that surpass Nafion performance or certain properties of Nafion. New membranes for
DMFCs are intensively investigated, and therefore there are a great number of previous results to consider
before conducting own experiments.
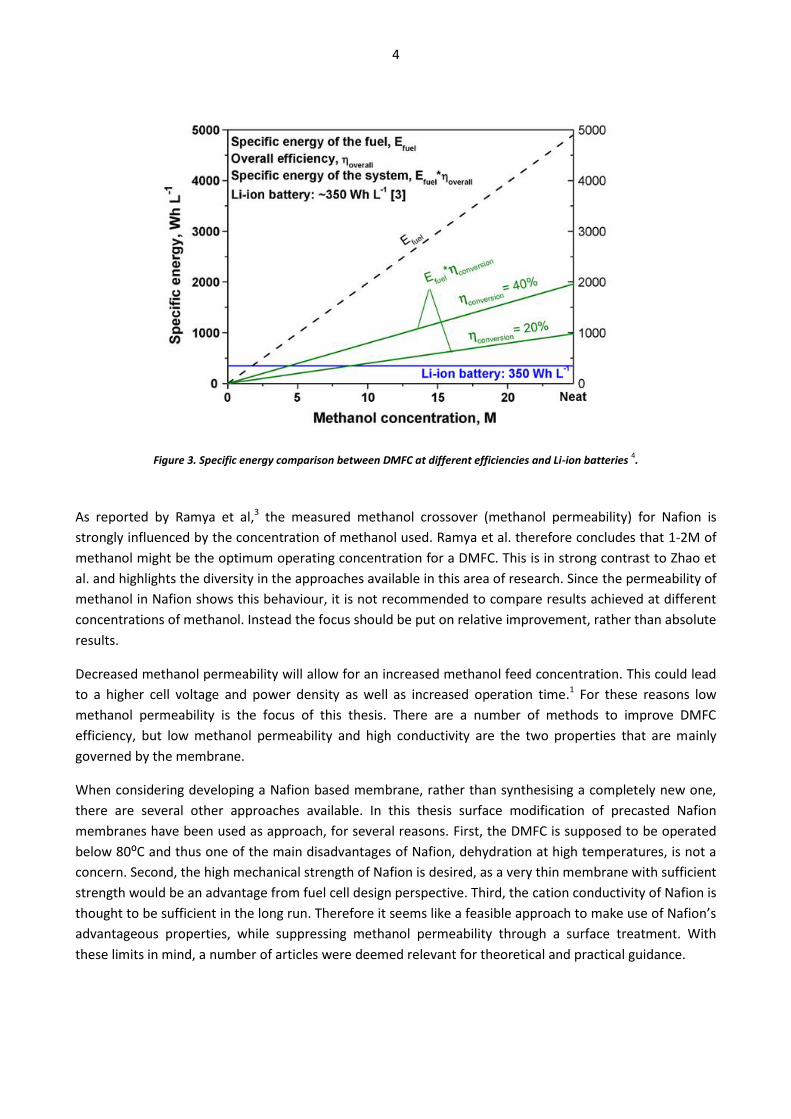
The possible gains of operating a DMFC with highly concentrated methanol as fuel are outlined by Zhao et
al.2 The specific energy of DMFCs compared to Lithium-ion batteries is represented in Figure 3. The higher
efficiency of the fuel cell and the higher fuel concentration, the better the DMFC compares to the lithium-
ion battery that currently is standard for some consumer electronics applications that might be powered by
a small fuel cell. Operating at high concentrations therefore seems essential in order to provide a
competitive technological alternative.
4
Figure 3. Specific energy comparison between DMFC at different efficiencies and Li-ion batteries 4.
As reported by Ramya et al,3 the measured methanol crossover (methanol permeability) for Nafion is
strongly influenced by the concentration of methanol used. Ramya et al. therefore concludes that 1-2M of
methanol might be the optimum operating concentration for a DMFC. This is in strong contrast to Zhao et
al. and highlights the diversity in the approaches available in this area of research. Since the permeability of
methanol in Nafion shows this behaviour, it is not recommended to compare results achieved at different
concentrations of methanol. Instead the focus should be put on relative improvement, rather than absolute
results.
Decreased methanol permeability will allow for an increased methanol feed concentration. This could lead
to a higher cell voltage and power density as well as increased operation time.1 For these reasons low
methanol permeability is the focus of this thesis. There are a number of methods to improve DMFC
efficiency, but low methanol permeability and high conductivity are the two properties that are mainly
governed by the membrane.
When considering developing a Nafion based membrane, rather than synthesising a completely new one,
there are several other approaches available. In this thesis surface modification of precasted Nafion
membranes have been used as approach, for several reasons. First, the DMFC is supposed to be operated
below 80⁰C and thus one of the main disadvantages of Nafion, dehydration at high temperatures, is not a
concern. Second, the high mechanical strength of Nafion is desired, as a very thin membrane with sufficient
strength would be an advantage from fuel cell design perspective. Third, the cation conductivity of Nafion is
thought to be sufficient in the long run. Therefore it seems like a feasible approach to make use of Nafion’s
advantageous properties, while suppressing methanol permeability through a surface treatment. With
these limits in mind, a number of articles were deemed relevant for theoretical and practical guidance.

5
2.2. Fuel cell fundamentals
2.2.1. Introduction
The fundamental function of a fuel cell is to convert chemical potential into electrical current. In practise
this can be achieved in a number of ways, but the core process stays the same. In Figure 4 the DMFC
process is overviewed, but the principle is similar to that of other fuel cell types. On the anode side of the
cell the fuel is split up into cations and electrons with the aid of a catalyst. While the cations travel to the
cathode side through a PEM, the electrons are directed through an external load before they reach the
cathode. The movement of the electrons is driven by the excess positive charge present at the cathode. At
the cathode the cations and electrons combine to form the end product, which varies depending on the
type of fuel cell. Unfortunately this idealised function of the fuel cell is not realistic, and losses in different
fuel cell parts lowers the efficiency of the cell.
Figure 4. Sketch of the fundamental fuel cell operation for a DMFC.
2.2.2. Direct Methanol Fuel Cell
The DMFC uses liquid methanol as fuel (often diluted with water), and this is fed to the anode side either
actively with pumps, or passively through diffusion from a fuel chamber. At the catalyst, the methanol is
split into its components, and these later recombine at the cathode together with oxygen to form water.
The electrode reactions:

6
As shown in Figure 4, the fundamental fuel cell principle is quite simple. Fuel cell operation can however
require a number of auxiliary systems. These can include, but are not restricted to, pumps for replenishing
reactants at the anode, pumps for removing products from the cathode, as well as other equipment that
cooperates in order to achieve high efficiency. These systems require energy and add to the complexity of
the complete fuel cell. DMFCs are however well suited to be designed without most of these support
systems. In this way both energy and space can be saved, and DMFCs are thus well suited to be built in
small sizes, one of the goals of the MicroPower project.
2.2.3. Proton Conductivity
The proton conductivity of the membrane is one of the fundamental properties that govern the
performance of the membrane. Conduction of protons is generally believed to take place in a combination
of two ways.4
The vehicle mechanism conveys protons by transporting hydronium ions ((H2O)nH+) through the membrane.
Increasing proportions of hydrophilic domains in a membrane increases the probability of this type of
conduction.
The Grotthuss mechanism, also known as the hopping or jump mechanism, means that stationary possibly
ionic molecules are protonated, and then give away excess protons/cations to other nearby molecules
which can accept them. In this way molecules within proximity of each other work like a conveyor belt. A
certain minimum density of conducting sites are required.
Both the vehicle mechanism and the Grotthuss mechanism work in the opposite direction of an ion
concentration gradient. That is, they will transport ions from an area with high ion concentration to an area
with a low ion concentration.
A general approach for achieving high proton conductivity is to have a lot of water within the membrane.
This is achieved by synthesising a membrane which is highly hydrophilic. High hydrophilicity does however
potentially lead to other problems, such as high methanol permeability and low mechanical strength.
2.2.4. Methanol permeability
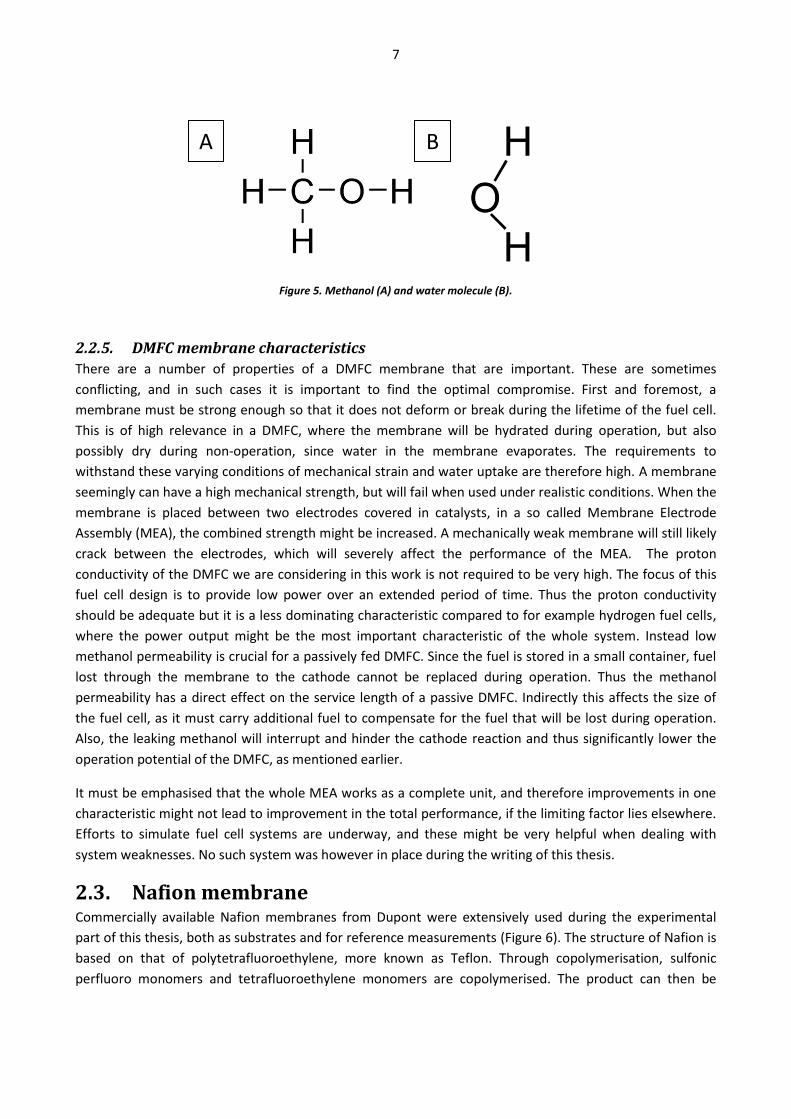
The methanol molecule is in its size and polarity similar to the water molecule, and therefore behaves in a
similar way in some circumstances (see Figure 5). The methanol fuel for a DMFC is commonly diluted with a
amount of water. In a DMFC the cathode is exposed to air, and therefore it is a flow of water molecules
from the diluted methanol fuel at the anode to the cathode where the liquid evaporates. This water
migration can drag along methanol molecules. In this way a fuel cell can experience a severe loss of fuel,
and thus a corresponding loss of both power life time. This is a large weakness in current DMFC designs, as
sufficient proton conductivity can be achieved in a number of ways, but with a high degree of methanol
crossover as well.1 If methanol reaches the cathode it lowers the reaction potential, so called cathode
poisoning.
7
Figure 5. Methanol (A) and water molecule (B).
2.2.5. DMFC membrane characteristics
There are a number of properties of a DMFC membrane that are important. These are sometimes
conflicting, and in such cases it is important to find the optimal compromise. First and foremost, a
membrane must be strong enough so that it does not deform or break during the lifetime of the fuel cell.
This is of high relevance in a DMFC, where the membrane will be hydrated during operation, but also
possibly dry during non-operation, since water in the membrane evaporates. The requirements to
withstand these varying conditions of mechanical strain and water uptake are therefore high. A membrane
seemingly can have a high mechanical strength, but will fail when used under realistic conditions. When the
membrane is placed between two electrodes covered in catalysts, in a so called Membrane Electrode
Assembly (MEA), the combined strength might be increased. A mechanically weak membrane will still likely
crack between the electrodes, which will severely affect the performance of the MEA. The proton
conductivity of the DMFC we are considering in this work is not required to be very high. The focus of this
fuel cell design is to provide low power over an extended period of time. Thus the proton conductivity
should be adequate but it is a less dominating characteristic compared to for example hydrogen fuel cells,
where the power output might be the most important characteristic of the whole system. Instead low
methanol permeability is crucial for a passively fed DMFC. Since the fuel is stored in a small container, fuel
lost through the membrane to the cathode cannot be replaced during operation. Thus the methanol
permeability has a direct effect on the service length of a passive DMFC. Indirectly this affects the size of
the fuel cell, as it must carry additional fuel to compensate for the fuel that will be lost during operation.
Also, the leaking methanol will interrupt and hinder the cathode reaction and thus significantly lower the
operation potential of the DMFC, as mentioned earlier.
It must be emphasised that the whole MEA works as a complete unit, and therefore improvements in one
characteristic might not lead to improvement in the total performance, if the limiting factor lies elsewhere.
Efforts to simulate fuel cell systems are underway, and these might be very helpful when dealing with
system weaknesses. No such system was however in place during the writing of this thesis.
2.3. Nafion membrane Commercially available Nafion membranes from Dupont were extensively used during the experimental
part of this thesis, both as substrates and for reference measurements (Figure 6). The structure of Nafion is
based on that of polytetrafluoroethylene, more known as Teflon. Through copolymerisation, sulfonic
perfluoro monomers and tetrafluoroethylene monomers are copolymerised. The product can then be
B A
8
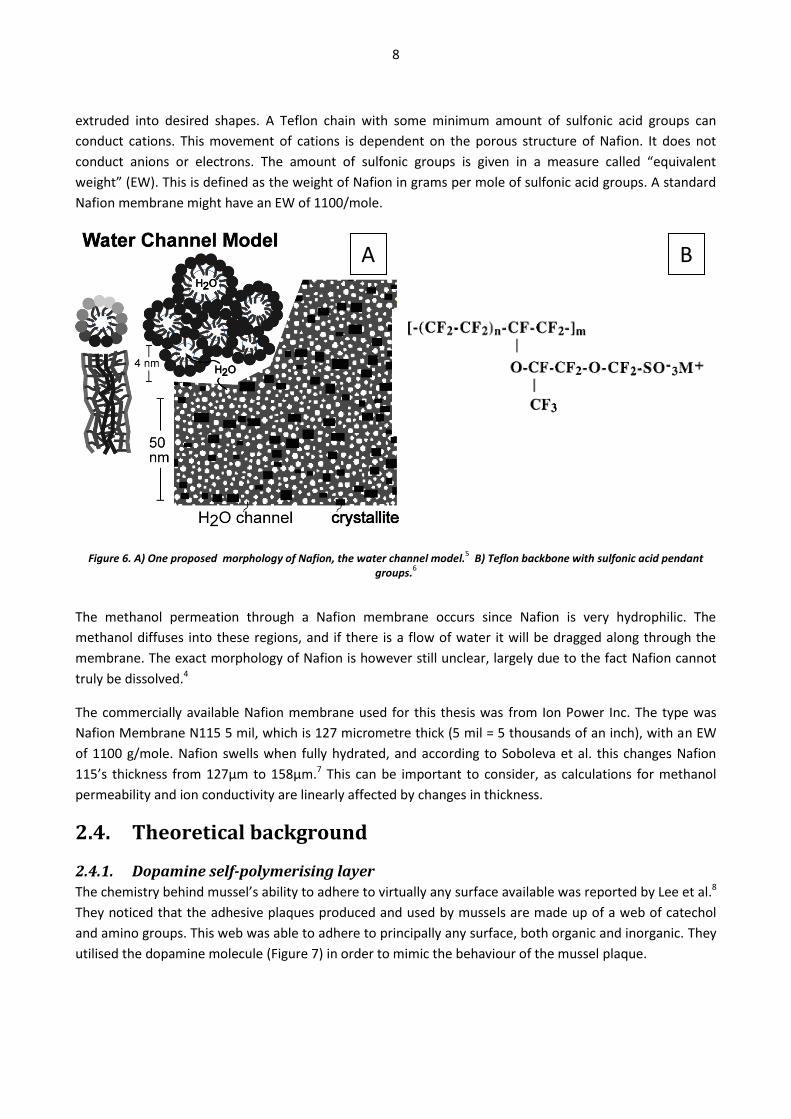
extruded into desired shapes. A Teflon chain with some minimum amount of sulfonic acid groups can
conduct cations. This movement of cations is dependent on the porous structure of Nafion. It does not
conduct anions or electrons. The amount of sulfonic groups is given in a measure called “equivalent
weight” (EW). This is defined as the weight of Nafion in grams per mole of sulfonic acid groups. A standard
Nafion membrane might have an EW of 1100/mole.
Figure 6. A) One proposed morphology of Nafion, the water channel model.5 B) Teflon backbone with sulfonic acid pendant
groups.6
The methanol permeation through a Nafion membrane occurs since Nafion is very hydrophilic. The
methanol diffuses into these regions, and if there is a flow of water it will be dragged along through the
membrane. The exact morphology of Nafion is however still unclear, largely due to the fact Nafion cannot
truly be dissolved.4
The commercially available Nafion membrane used for this thesis was from Ion Power Inc. The type was
Nafion Membrane N115 5 mil, which is 127 micrometre thick (5 mil = 5 thousands of an inch), with an EW
of 1100 g/mole. Nafion swells when fully hydrated, and according to Soboleva et al. this changes Nafion
115’s thickness from 127µm to 158µm.7 This can be important to consider, as calculations for methanol
permeability and ion conductivity are linearly affected by changes in thickness.
2.4. Theoretical background
2.4.1. Dopamine self-polymerising layer
The chemistry behind mussel’s ability to adhere to virtually any surface available was reported by Lee et al.8
They noticed that the adhesive plaques produced and used by mussels are made up of a web of catechol
and amino groups. This web was able to adhere to principally any surface, both organic and inorganic. They
utilised the dopamine molecule (Figure 7) in order to mimic the behaviour of the mussel plaque.
B A

9
Figure 7. Dopamine molecule, with catechol group on the left and amino group on the right.
In alkaline conditions the dopamine molecule self-polymerised onto a surface as a thin layer, approximately
50nm, after 20-25 hours. Longer reaction time did not increase the thickness. No exact reaction mechanism
was given but since dopamine is a well-researched substance, due to its presence and importance in the
human body, likely reaction paths have been proposed.
Wang et al.9 reported drastic decreases in methanol permeability in Nafion membranes treated with
dopamine. In this work they investigate a number of different parameters, such as reaction pH, immersion
time and dopamine concentration. In all, they achieved a selectivity increase three times that of pristine
Nafion at 12M methanol concentration, owing to a sharp decrease in methanol permeability but only a
small decrease in proton conductivity. In general their observations correspond well to those of Lee et al.8
Li et al.10 reported that two dopamine treatments of a microporous substrate led to an additional layer of
“polydopamine” being formed on top of the other. Positron Annihilation Lifetime Spectroscopy (PALS)
revealed that the layer became denser after the second treatment. No measurements were however
conducted to investigate how this increased density might affect methanol permeability.
Agreeing on the factual formation of a polydopamine layer, the explanations as to why the growth stops
after some time differs. Wang et al. speculated that the sulfonate groups on the surface of the Nafion
substrate facilitate the deprotonation, and therefore the polymerisation, of the dopamine. When the layer
becomes thicker the sulfonic groups become more distant, and instead the dopamine gathers in clusters on
the surface of the already polymerised layer, to minimise surface tension.
Bernsmann et al. on the other hand, focus on the consumption of oxygen in the reaction
↔
and emphasises that lack of oxygen can severely inhibit the reaction.11 They also point out that the reaction
seems to be purely solution-interface driven. Polymerisation on the surface of substrates only occurs if
there is contact between mono- and oligomers of dopamine, but not between longer chains. These must be
formed on the substrate in order to adhere. If the polymerisation takes place in the solution these
polymers will not later add to the layer at the substrate. They also conclude the final product to be a form
of dopamine-melanin, whose proposed reaction pathway can be seen in Figure 8 below. There also seems

10
to be a saturation concentration of the dopamine solution at ≈1 mg/ml, above which the growth rate of
dopamine-melanin does not increase. The dopamine-melanin is according to Bernsmann et al. stable at pH
< 13, above which the degradation of dopamine-melanin rapidly increases.
Figure 8. Reaction scheme proposed by Li et al.12
5,6-indolequinone is the fundamental unit of melanin.13
2.4.2. Layer-by-layer deposition
LbL deposition refers to a thin film technique where layers of two alternating substances can be added to a
surface stepwise, instead of through continuous growth. This can be done if these substances are chosen so
that they have properties that attract and potentially bind the other substance. A typical example would be
a cationic and an anionic substance. These substances are added to a substrate from solution, which
facilitates for the dissolved molecules to self-arrange at binding sites. By repeating this process a growing
number of layers can be added, and therefore LbL gives a very precise control over surface properties as
the thickness added can be strictly controlled. A sketch of the end product can be seen in Figure 9. The
possible materials to be added in this way can be any of inorganic clusters, clay particles, proteins, organic
molecules or polymers.14
If LbL modifying a membrane for DMFC usage, it is likely that ionic substances must be used in order to
achieve any considerable amount of conductivity. In such a combination the fundamental attractive forces
between the substances would be the electrostatic attraction between opposite charges, and possibly also
hydrogen bonding. This combined bonding is strong and can alter the properties of the combined substrate
and added film considerably.

11
Figure 9. Sketch of possible LbL deposition on a Nafion substrate.
A suitable method and suitable substances are suggested by Argun et al.15 The two polyions used with the
most promising results were sulfonated poly(2,6-dimethyl 1,4-phenylene oxide) (sPPO) and poly(diallyl
dimethyl ammonium chloride) (PDAC). In this thesis sPPO will be replaced with sulfonated PEEK (poly(ether
ether ketone), victrex 150PF) (sPEEK), due to its resemblance (see Figure 10). PEEK is also known to be a
mechanically strong polymer.16
Figure 10. A) PPO. B) sPEEK.
2.5. Risk assessment The use of dopamine, and eventually melanin, is associated with some risks if handled inappropriate. The
cause for concern regarding dopamine is mainly because it acts as a neurotransmitter and hormone in the
brain. Dopamine in itself cannot cross the blood-brain barrier, but it is sometimes given intravenous to
patients to affect the sympathetic nervous system. The maximum amount of dopamine dissolved at any
time during this thesis was 100mg. Considering this, and its inability to self-diffuse into the brain, it is still
without doubt so that the waste material must be treated with care. Melanin also has numerous functions
in different biological systems, and is therefore treated with similar care as the dopamine.
B A

12
3. METHOD
3.1. Measurement methods and materials This thesis focuses on reducing methanol permeability, and therefore it is of great importance to measure
this correctly. Beyond this, the general performance of the membrane is also important to evaluate,
including the trade-off between permeability and conductivity. The materials used are in general chemicals
that are easily accessible from major chemical vendors. During handling of the chemicals appropriate safety
measures were taken.
3.1.1. Methanol permeability
3.1.1.1. Quartz Crystal Microbalance principles
The Quartz Crystal Microbalance with Dissipation (QCM-D) is a piece of equipment able to measure very
small mass changes. The core of the device is a small (approx. 10 mm in diameter) circular quartz crystal
with gold electrodes. Onto this crystal, a constant current of a solution is driven using a pump. The crystal is
sensitive to its closest surroundings (approx. 250 nm in pure water at 20⁰C).
The behaviour is affected by the properties of the solution.17 This can affect two fundamental properties of
the crystal. The crystal is supplied with an oscillating movement in-plane, and the over-frequencies of this
oscillation are mass dependant according to the Sauerbrey equation below. This equation is however best
suited for stiff materials.
Depending on the density of the layer of solution closest to the crystal, these frequencies will be damped in
a varying degree. This dampening is called dissipation, and can be calculated using the equation
When measuring methanol concentrations with a QCM-D, we are utilising the fact that changes in viscosity
of the solution affect the frequency and dissipation response. No methanol molecules bind to the quartz
crystal. Water has higher viscosity than methanol and therefore we can measure the change.18 By
measuring the response of the crystal to a known methanol concentration of a solution, it is possible to first
calibrate the crystal used, and then at a later stage to measure unknown concentrations.

13
Figure 11. A) QCM equipment setup. B) Dual chamber with membrane sample.
3.1.1.2. Measurement setup
The methanol permeability of the investigated membranes was measured with a two-chamber cell
connected to the Q-Sense QCM equipment. The measurement setup and dual chamber with lid are
depicted in Figure 11. Chamber 2 was initially filled with Millipore water (18,2MΩ/cm) and Chamber 1 was
filled with 12M methanol solution (sketch can be found in Figure 12). Both chambers were continuously
stirred and the concentration in each chamber was assumed to be homogenous. The concentration of
methanol in Chamber 2 was measured over time with a QSense E1 equipment. This consists of QE 401
Electronics unit and a QCP 101 Chamber platform. The standard measurements time was five hours.
Figure 12. Diffusion cell sketch.
Prior to the measurements the equipment was run with Millipore water for several hours in order to
observe a stable baseline. The data was recorded with QSoft401 2.0.0.275, manipulated with QTools
3.0.5.198, exported to Excel 2007/2010 and finally used for calculations in MATLAB 7. The input data used
was the third, fifth and seventh overtone of the supplied oscillation frequency (F3, F5 & F7) and the third,
fifth and seventh overtone of the dissipation (D3, D5 & D7). From this, two separate values for P was
obtained, one from the F-data and one from the D-data. For further explanation of the QCM-D principle,
B A

14
the homepage of Q-Sense is highly recommended.19 A semi-empirical formula was then used to calculate
the methanol permeability. This can be found in the appendices.
3.1.1.3. Partial molar volume
When two volumes of methanol and water are mixed, the combined volume is smaller than the two
original volumes added to each other. This is due to a phenomenon called partial molar volume, where
methanol molecules and water molecules interact and pack more densely than in pure concentrated
solutions. Therefore mixing of methanol at different concentrations must be done with care, and for these
reasons molar concentration (mole/L) is used, rather than for example volume percentage. The reference
concentration used in all methanol permeability measurements was chosen to be 12M. This concentration
was used in several articles referred to in this thesis, and therefore gave possibilities for comparison. Also, a
high concentration was suitable for the measurements, as it would correspond better to the conditions
under which we expect a future DMFC to operate under.
3.1.2. Proton conductivity
The ionic conductivity of the membranes was measured by Electrochemical Impedance Spectroscopy (EIS).
The method and settings used in this thesis is mainly adapted from Sobolova et al.7 but a brief overview will
be given here. Information not present in this text can be found in the referred article.
Figure 13. A) Theoretical shape of the acquired Nyquist plot from an EIS measurement of a Nafion membrane, using an extremely high frequency interval.
7 B) Example of experimentally collected data plot with slope fitting.
7 C) Equivalent circuit used with the
Gamry software.
B A
C

15
In EIS an alternating voltage is applied across the membrane, to determine the resistance of the membrane
over a frequency interval. The EIS was carried out using a Gamry Reference 600 Potentiostat/Galvanostat,
Gamry Instrument framework software for acquisition and Gamry Echem Analyst for data modification and
analysis. The membrane was sandwiched in the measurement cell seen in Figure 13Figure 14 A. The
frequency range was 100KHz – 1MHz, and the AC voltage was 10 mV rms (root mean square), which
corresponds to 28.3 mV peak-to-peak amplitude. The temperature of the ionised water was 21⁰C at all
times. The parallel resistance of the system was measured by open-circuit, and the serial resistance was
measured by short-circuit. Each measurement was carried out ten times, in order to observe a stable
average value, which was later subtracted from the membrane measurements using the Gamry software. It
should be noted that the parallel resistance is expected to be very high, but has a very small influence on
the measurements. The serial resistance is small, but has a more significant influence.
Figure 14. A) EIS sample cell. B) Measurement setup. C)Sketch over the estimate of the x-axis intercept from the measurement data acquired in EIS.
B A
C

16
The electrodes were of copper and the connecting wires were soldered directly on the copper before gold
was evaporated onto the whole electrode. The measurement cell was immersed in water. The resistance of
the measurement setup was measured after both short-circuiting and open-circuiting the cell. These values
were later subtracted, in series and parallel respectively, from the measurement data.
The slope of the linear low frequency region corresponds to the bulk resistance according to
( ) (
)
( )
( ( ))
Calculations of the slope in the low frequency region can yield the x-axis intercept, and thereby the bulk
resistance when the imaginary part of the impedance is zero. This was done using the built in Simplex
model feature of the Gamry Echem Analyst. These results were controlled using linear fit tools.
The bulk resistance was then used in the equation below together with membrane thickness (L, cm) and
active membrane area (A, cm²) to find the conductivity (σ, S/cm).
3.1.3. Polarization Curve Measurement
For a quick feedback on the general trends in the performance, a polarization curve measurement was
conducted. This is a quick measurement of voltage and current generated in a MEA during a sample
operation. The mechanisms that govern the shape of the IV-curve obtained in these measurements were
complex. However as long as all other variables was kept constant, it could still give an interesting insight
into the behaviour of the membranes tested. Measurements were always compared to a reference
measurement conducted at the same occasion, using the same electrodes. Thus it was possible to
determine general trends in the performance of a new membrane. It was not reasonable to use the
voltages and currents measured for any calculations, but the values were always compared to the known
performance of the reference. The reference used was pre-treated Nafion 115. By using these kinds of
measurements it was easy to evaluate the effects of changes in membrane fabrication under realistic
conditions. This gave fast feedback in a way which otherwise would not have been possible. The
measurement cell is seen in Figure 15.

17
Figure 15. MEA setup with attached electrodes before measurement.
3.1.4. SEM imaging
Two different microscopes were used to characterise the membranes. A Carl Zeiss G34-1540 XB SEM/FIB
was used for the pictures of LbL, and FEG-SEM Ultra55 from Zeiss was used for pictures of dopamine
modified Nafion membranes. The preparation process for the SEM/FIB samples was:
Plunge freezing of sample in liquid nitrogen
Transfer to vacuums in the preparation chamber
Sublimation for 5 minutes at -90⁰C
Sputter coating with Platinum to an estimated thickness of 3-4 nm
Transfer to the main chamber and kept at -120⁰C
Imaging And for the FEG-SEM samples it was
Plunge freezing in liquid nitrogen
Fracturing
Vacuum in microscope chamber
Imaging
3.1.5. Preparation and treatment of Nafion membranes
All Nafion-based membranes were pre-treated in the same way.
30 min in deionised water at 80⁰C
30 min in 3% at 80⁰C
30 min in deionised water at 80⁰C
30 min in 1M at 80⁰C
30 min in deionised water at 80⁰C
These steps were taken in order to clean the membrane, and then charge it with as many protons as
possible, in order to increase proton conductivity. Before each methanol permeability measurement, the

18
membranes were put in Millipore water for several hours in order to fully hydrate it using the water as in
the measurement itself. Thereby a stable QCM baseline was more easily established.
3.1.6. Dimensional swelling in water
The through-plane (transversal) hydrated thickness of Nafion 115 and Nafion 115 modified with either
dopamine-melanin or 30 bilayers LbL was measured using SEM.
3.1.7. X-ray photoelectron spectroscopy
X-ray Photoelectron Spectroscopy (XPS) was used to investigate the chemical composition of the LbL
treated Nafion membranes. By irradiating a sample with X-rays, electron emission from the surface of the
sample is initiated. The energy of these electrons is then measured to find the relative intensities of
different chemical bonds in the sample surface. Through this it is possible to calculate chemical
composition, empirical formula etc.
For measurements in this thesis, a K-Alpha from Thermo Scientific was used, with depth profiling. Three
different spot measurements were done in different areas of the same LbL 15 bilayer sample.
3.2. Approach specific method
3.2.1. Self-polymerising dopamine-melanin
The procedure for the formation of a self-polymerising dopamine-melanin layer on Nafion substrates was
adapted primarily from Wang et al.9 but many variations were tried. The dopamine hydrochloride was
acquired from Sigma-Aldrich (CAS: 62-31-7). The standard procedure was:
1. Pre-treatment of Nafion membrane pieces, approximately 2*3 cm in size, according to section
3.1.5.
2. Dissolution of dopamine hydrochloride in either 20 ml or 50 ml Millipore water or deionised water
3. Addition of Tris (hydroxymethyl)aminomethane (Tris, Sigma-Aldrich CAS: 77-86-1) during stirring
until pH 8,5 was reached.
4. Immediate immersion of substrate membrane.
5. Storage on vibration table during the reaction time.
6. Removal from dopamine solution and cleaning in deionised water or Millipore water.
7. Ultrasonic cleaning 5+5 minutes.
8. Storage in deionised water or Millipore water.
Above is given the general case for 1 dopamine treatment. Variations on this method included:
Concentration 1-4mg/ml
Reaction time 1 to 48 h
Number of consecutive treatments
Solution access to air during reaction
3.2.1.1. Chemical resistance of dopamine-melanin
To investigate the chemical resistance of the dopamine-layer, two experiments were conducted. First, a
dopamine-melanin covered piece of Nafion was partly submerged at pH 13 for 24 hours, and the change in
the optical appearance was observed. Then another piece of dopamine-melanin covered Nafion was

19
prepared, and cut in into small pieces. The methanol permeability of the first piece, Piece A, was measured
while piece B was immersed at pH 13 for 24 hours, before measuring the permeability.
3.2.1.2. Methanol resistance of dopamine-melanin
The resistance to methanol was investigated, because of its relevance for the service length of a dopamine-
melanin covered membrane in a functioning DMFC. It could not be ruled out beforehand that methanol
could not dissolve the dopamine layer. To test this, a piece of Dopamine-melanin covered Nafion 115
repeatedly had its methanol permeability measured.
3.2.2. Layer-by-layer deposition
Immersion of a pre-treated Nafion 115 piece into a cationic solution of 1/10 monomole (one mole of the
monomer unit of the polymer) poly(diallyl dimethyl ammonium chloride) (PDAC) during 20 minutes was
followed by rinsing in deionised water for 10 min. After that the sample was immersed into an anionic
solution of DMF (dimethylformamide) and sulfonated poly(ether ether ketone) (sPEEK) followed by another
rinsing. This procedure corresponds to one treatment (= one bilayer), and the whole process was repeated
for as many times as desired. During processing, the modified membranes were stored in Millipure water.
Figure 16. A) PDAC repeat unit. B) PEEK repeat unit, unsulfonated.
The PDAC was purchased from Sigma Aldrich (CAS 26062-79-3) and the sPEEK had already been synthesised
from PEEK using the method described by Wootthikanokkhan et al. by Dr. Yihua Yu.16 The repeat units can
be seen in Figure 16. The samples with 0, 5, 7, 9 and 15 bilayers were produced from the same Nafion
sample, where pieces were continuously taken and processed. The sample for 30 bilayers however had to
be produced from a separate sample.
Efforts were made to dissolve the sPEEK in water, base and strong acid without success. Therefore, sPEEK
was dissolved in DMF and used in LbL deposition.
4. RESULTS & DISCUSSION The results for each characterisation method are presented together in the same subsection.
4.1. Dimensional swelling in water The dimensional swelling in water was found to be between 140µm and 160µm, independent of surface
modification. Since the variation in thickness from the same sample thickness in the dry state was that
B A

20
large, the dry state thickness was used for calculations of e.g. methanol permeability. In this way the
absolute values in the results are comparable to other modifications of the same type of substrate.
Approximately 127µm dry thickness of Nafion 115 could be confirmed by SEM and this value was
subsequently used for calculations. These results are similar to those reported in literature, but with a
considerable larger variation in the measured thickness. The freezing prior to SEM imaging could be the
source of the large variation in thickness. However, in theory it should not. Another measurement
technique could have been employed in order to verify the thickness.
4.2. Optical appearance
4.2.1. Dopamine-melanin
The polymerisation of dopamine on a Nafion 115 substrate made the originally colourless and transparent
membrane to become brownish in appearance, which increased in intensity with increased reaction time
(Figure 17). In this way it was easy and fast to confirm that polymerisation had taken place, even before
measurements and SEM characterisation.
Figure 17. A) Pristine Nafion 115 membrane. B) Nafion membrane polymerised in dopamine during 24 hours.
4.2.2. Layer by layer deposition
The optical appearance of the sPEEK/PDAC LbL modified Nafion membrane was slightly changed in relation
to pristine Nafion. After 15 bilayers there was a tendency towards a whitish colour change on the surface of
the Nafion membrane. This was however not uniform and varyied in strength over the surface of the
membrane.
4.3. SEM imaging
4.3.1. Dopamine-melanin
Figure 18 shows the appearance of a dopamine-melanin covered Nafion membrane after two treatments.
As can be seen from the cross sectional picture B) a dense, approximately 90 nm thick, layer have formed
on the surface. From both A) and B) it looks to be uniform and provide 100% coverage of the substrate. On
top of this layer there are plenty of lumps of a similar substance. This is likely excess dopamine-melanin
that has formed in clusters to minimise surface tension.9
B A

21
Figure 18. A) The excess DA formed on the surface of the layer. B) 90 nm dopamine layer seen in cross section where the excess formations are also noticeable.
There does not seem to be any clear signs of a second dopamine-treatment in Figure 19, where a single
treated and double treated membrane is compared.
Figure 19. Single (A) and double (B) treatment comparison of the same original piece of membrane. No apparent difference in layer thickness is visible (90-100nm).
4.3.2. Layer by layer deposition
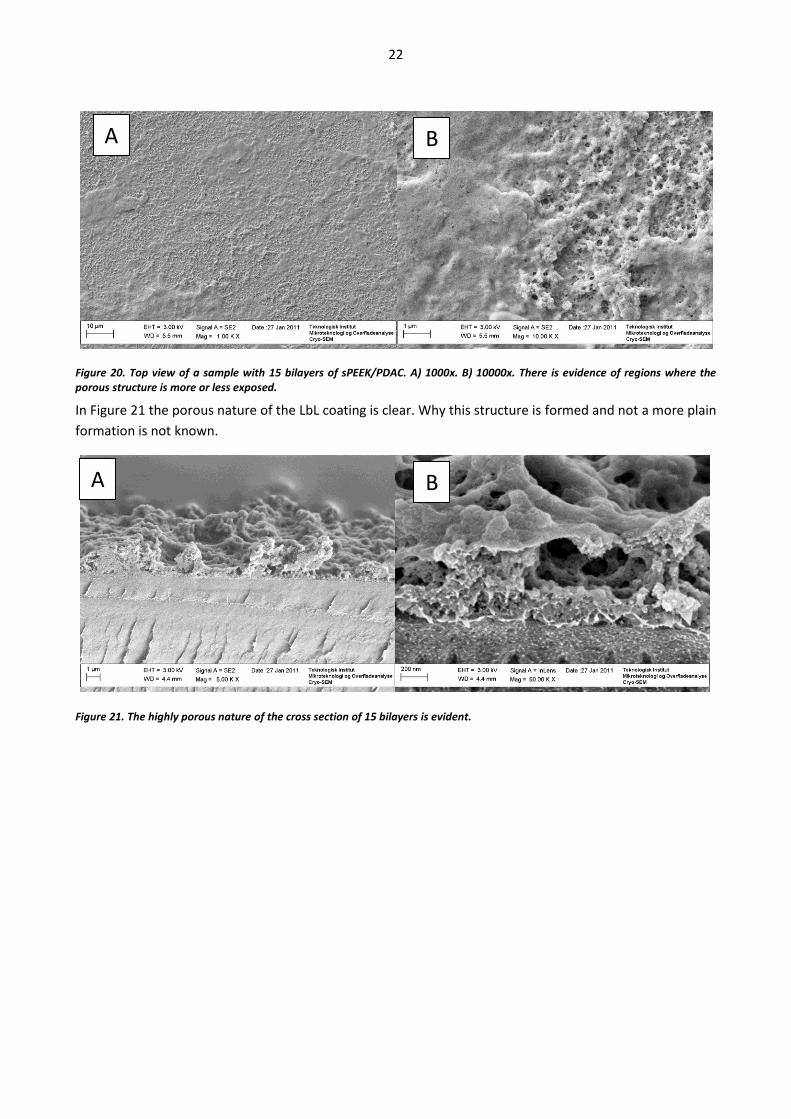
Investigations using SEM revealed what seemed to be a non-uniform coverage of the membrane surface.
There was coverage of the substrate in all regions investigated, but the character of this coverage varied
from smooth to highly porous, as seen in Figure 20.
B A
B A
22
Figure 20. Top view of a sample with 15 bilayers of sPEEK/PDAC. A) 1000x. B) 10000x. There is evidence of regions where the porous structure is more or less exposed.
In Figure 21 the porous nature of the LbL coating is clear. Why this structure is formed and not a more plain
formation is not known.
Figure 21. The highly porous nature of the cross section of 15 bilayers is evident.
B A
B A

23
One possible explanation is that the polymer chains are not oriented along the surface of the membrane
during treatment, but instead a proportion of the reacting molecules arrange themselves in “heaps”. This
might eventually lead to formations of the type that can be seen in Figure 22.
Figure 22. A) PDAC/sPEEK LbL modified Nafion membrane. B) Accumulation of LbL material shows the deviation from the neat layers proposed in the theory section (equal magnification as A).
Another possibility is that every time the hydrated membrane was immersed into the sPEEK/DMF solution,
it would locally dilute the DMF with water, and thereby forcing a minor precipitation of sPEEK in the region
close to the membrane. This might cause precipitated polymer to form the type of lumps on the surface of
the substrate as seen in the SEM pictures above.
Figure 23. LbL 30 bilayers.A) Delamination of the LbL from the Nafion substrade in a region subjected to fracture. B) Increasingly asymetric and porous formations compared to the sample with 15 bilayers.
In Figure 23 some peculiar characteristics of the 30 bilayer LbL treated Nafion 115 at 2.5 K X magnification
is shown. An odd feature is seen in Figure 23 A, where the whole surface layer is wrinkled. This is due to
external forces, since this phenomenon is only seen close to the fracture of the membrane. It indicates that
B A
B A

24
the cohesion within the 30 bilayer coating is much stronger than the adhesion between the coating and the
substrate. In B) we can see the very irregular formation of the LbL coating. Given this uneven distribution of
polymer material, it seems reasonable that improvements in methanol permeability are not directly
proportional with the added amount of polymer, at least not once an initial layer has been formed.
4.4. QCM measurements
4.4.1. Dopamine-melanin
The methanol permeability of dopamine modified Nafion membrane can be found in Table 4.1. As seen,
relatively little differs between the different treatments when it comes to methanol permeability. The best
sample, New DA, was achieved after fresh dopamine had been purchased. Recommended storage
conditions had not been followed for the first batch of dopamine, and thus degradation is a possible reason
why the initial results were not improved until fresh dopamine was used again.
Table 4-1. All membranes dopamine modified at pH 8,5..
DA conc. (mg/ml)
No. of treatments
Immersion time (h)
P for D3-D7 (cm
2/s)*
P for F3-F7 (cm
2/s)*
P
(%)
Comments
- - - 2,3*10-6
2,4*10-6
100 Value is an average from three
different measurements.
2 1 24 9,5*10-7
9,3*10-7
39 2 2 24 1,0*10
-6 1,1*10
-6 45
4 2 24 1,1*10-6
1,1*10-6
47 2 1 24 8,1*10
-7 8,3*10
-7 34 Fresh DA purchased
2 1 24 - 8,5*10-7
31 Membrane saturated with DA prior to treatment
2 1 1 8,7*10-7
8,6*10-7
36 Reaction time only 1 hour * These permeability values are calculated from the third, fifth and seventh overtone of the frequency (F) and dissipation (D) respectively.
The reference value for pre-treated Nafion 115 was averaged after several measurements. Variation of the
reference value was at most 0,2*10-6 cm2/s. The QCM is in itself a very precise measuring device. The
auxiliary equipment used includes pumps and dual chamber apparatus, which might introduce
uncertainties into the measurement. Also, it cannot be ruled out that Nafion in itself have a varying
performance
Returning to the values in Table 4.1, it is difficult to find evidence that varying concentration and number of
immersions had any significant impact on the results. This is in line with the results from SEM, where no
difference was evident between single and double treatments. The results did not improve with doubled
concentration, which might be explained by Bernsmann et al. investigations where concentrations above 1
mg/ml was deemed saturated and thus did not impact the growth rate of the dopamine-melanin layer.11
The immersion time was kept at 24 hours for most measurements. This was because there was no effective
method to make our own measurements of thickness over time. According to Bernsmann et al. the growth

25
rate reached zero after 15-20 minutes, while Lee et al. claim 15-20 hours before growth has ended. Wang et
al. support the view taken by Bernsmann et al., as they report no significant change in permeability after 1
hour of treatment, 1 hour being the first measurement interval. Li et al. on the other hand reports
continuous growth over 24 hours.10
It is of note to realise that Li et al. and Wang et al. does not necessarily contradict each other. A growth for
24 hours might be consistent with no change in permeability after one hour, as increasing thickness of the
layer does not necessarily decrease the permeability. A situation where growing thickness is not affecting
the permeability is possible. Bernsmann et al. does even discuss this difference between their own and the
results of Lee, without being able to provide any definitive explanation. From these reports it was initially
not possible to draw a definitive conclusion on the suitable reaction time. Therefore 24 hours was used as a
standard.
One important question is, why have not a second layer of dopamine been formed after a second
treatment? The method by Li et al. have been followed in detail. Yet the thickness of samples treated
several times still corresponds very well to the thickness Li et al. report for single treatments after 24 hours,
100-110 nm, as well as the results of the present study for single treatments. Bernsmann et al. polymerises
considerably thinner layers, and with the corresponding growth per treatment, a 100 nm layer would be
formed after 40 or more treatments. With a corresponding method, there is no result reported where
considerably thicker layer of dopamine-melanin are formed, indicating that there might be a maximum
thickness in the region of 100-150 nm. With the exception of Wang’s theory, where sulphur catalyses the
reaction at the Nafion interface, no theoretical ground for a maximum thickness hypothesis can be found.9
Of note here is that Li et al. and Bernsmann et al, among others, use substrates lacking sulphur at the
surface. Thereby evidence are shown that presence of sulphur is not a necessity to grow >100 nm thick
layers of dopamine-melanin.
4.4.2. Layer by layer deposition
The QCM results for PDAC/sPEEK based LbL treated Nafion substrates can be found in Table 4-2. Of
immediate concern is the 5 layer treatment, which does not seem to have led to any change in permeability
at all (1% is well within both the error margin and the normal variation of the substrate). Long polymer
chains might not arrange together as densely as smaller molecules such as dopamine, and therefore
require many more layers before a complete surface cover is achieved. As could be seen in the SEM results
section, 15 bilayers formed a complete coverage of the membrane, although with a varying quality. This
trend was also possible to see for the sample with 30 bilayers.
Table 4-2. Methanol permeability results for various Layer-by-Layer modified Nafion membranes
No. of bilayers
Anion Conc.* Cation Conc.* MeOH perm. (cm²/s) D-series
MeOH perm. (cm²/s) F-series
% of ref.
Nafion ref. - - - - 2.5*10-6 2.6*10-6
100
5 PDAC 1/10 sPEEK 1/10 2.5*10-6 2.5*10-6 99 7 PDAC 1/10 sPEEK 1/10 2.0*10-6 2.1*10-6 80 9 PDAC 1/10 sPEEK 1/10 1.9*10-6 1.9*10-6 73 15 PDAC 1/10 sPEEK 1/10 1.3*10-6 1.2*10-6 43 30 PDAC 1/10 sPEEK 1/10 1.0*10-6 9.8*10-7 39 *Concentration in monomole.

26
A plot of the results in Table 4-2 can be seen in Figure 24, where the correlation between methanol
permeability and number of bilayers is shown. Note that when the sample with 30 bilayers was assembled,
it was not the previous sample with 15 bilayers that had another 15 bilayers added onto it. Instead a new
sample had to be produced.
Figure 24. Correlation between number of bilayers of sPEEK/PDAC and methanol permeability. Note the absence of permeability reduction for five bilayers, and the small decrease between 15 and 30 bilayers.
4.4.3. QCM measurement limitations
Within the method used for the measurement of permeability are limitations. The process of diffusion from
chamber B (12M methanol compartment) to chamber A (the water compartment) can lead to a significant
change in the volume of both chambers. In the mathematical model used, these volumes are assumed to
be constant. During a five hours special test, with Nafion 115 as membrane, the change in volume was 0.6
ml. Nafion is the worst membrane in this aspect utilised in this thesis, and thus this volume should be the
maximal volume change present in any of the herein presented measurements. From the equations used in
1.1, we can calculate that this means a modification of the result of less than 1%. The choice to use the
mathematical model, was largely based on stability and positive previous experience of this model,
together with the equipment used.
27
If the dual chamber failed to hold tight around the inserted membrane, an abnormal amount of methanol
might be able to leak over to the measurement cell. There were sometimes problems with applying even
pressure on the membrane sealing, as some of the four screws used for this did not function properly.
Another possible problem is that Nafion swells to a higher degree in several organic solvents, compared to
water.4 Nafion side chains and the backbone are affected differently by water and methanol. Therefore it is
possible that the membrane, clamped between the dual chambers in the measurement apparatus, would
deform when it became exposed to methanol. This would make the effective membrane area to deviate
from the value used for calculations, causing the final permeability value to change. But since the effect
should be similar for all samples and measurements, as we always used the same concentration of
methanol, this would not alter the ratio of permeability between the reference membrane and other
membranes measured.
The QCM equipment is very sensitive to bubbles in the tubing of the pump and the measurement cell.
These might arise from a number of sources. For example, in the methanol solution used or due to
turbulence at the inlet of the tube. Also, physical interaction with the table on which the equipment stood
on might have affected the measurements. All these sources of errors are however easily recognised and a
quick evaluation of the shape of the QCM curves revealed abnormal behaviour. Thereby the numbers of
potential errors affecting the end results are decreased.
Of note to the reader is that during the progress of this thesis, both the Nafion substrate and the QCM
crystal were changed. The QCM crystal initially used broke half way through just after finalising the
dopamine-melanin related measurements. New crystals purchased from Q-Sense are expected to have very
small variations in quality. When calibrating the new crystal, the calibration curve achieved was very similar
to the one previously used. In the case of Nafion, a new sheet had to be purchased. The new Nafion should
be identical to the first one. With a new crystal and new Nafion, a slight difference in the reference value
for methanol permeability in Nafion was however recorded. For this reason measurement results from
dopamine-melanin and from LbL should be seen as completely separate. They should not be compared
directly, but rather through their respective performance compared to their own reference value.
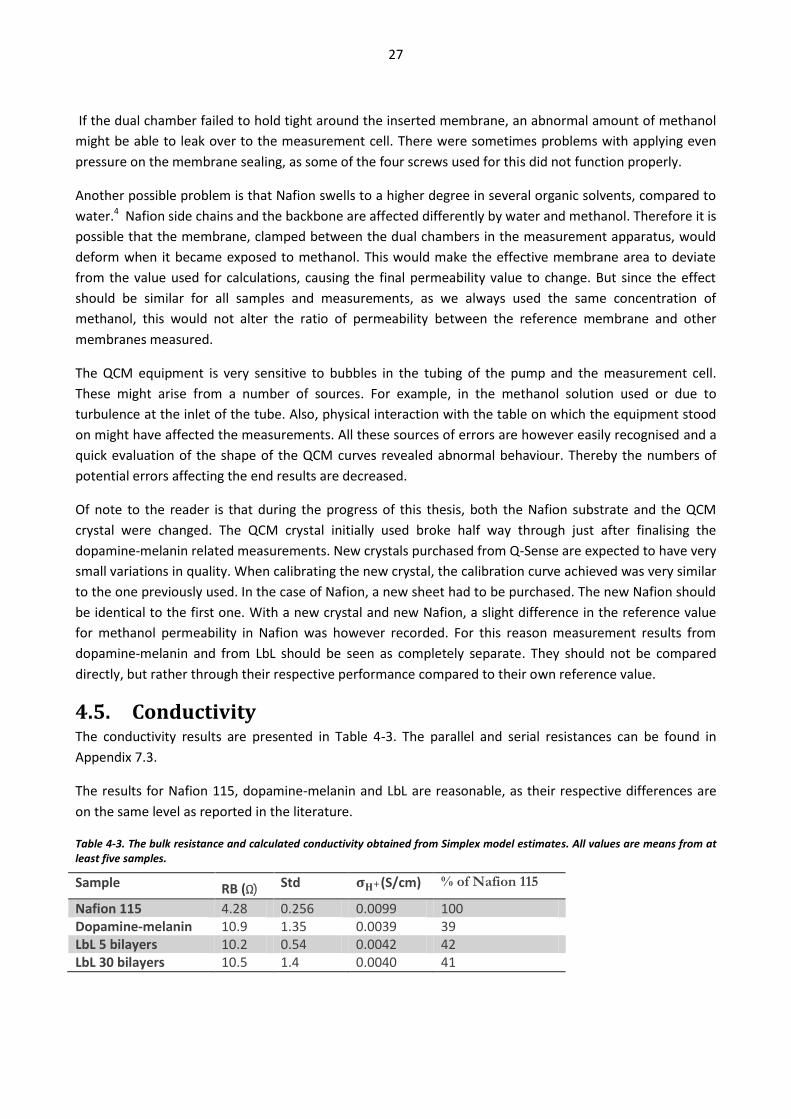
4.5. Conductivity The conductivity results are presented in Table 4-3. The parallel and serial resistances can be found in
Appendix 7.3.
The results for Nafion 115, dopamine-melanin and LbL are reasonable, as their respective differences are
on the same level as reported in the literature.
Table 4-3. The bulk resistance and calculated conductivity obtained from Simplex model estimates. All values are means from at least five samples.
Sample RB (Ω) Std (S/cm) % of Nafion 115
Nafion 115 4.28 0.256 0.0099 100 Dopamine-melanin 10.9 1.35 0.0039 39 LbL 5 bilayers 10.2 0.54 0.0042 42 LbL 30 bilayers 10.5 1.4 0.0040 41

28
Here it is interesting to note two different findings. First, the dopamine-melanin is less conductive
compared to the Nafion reference, than stated by Wang et al.9 This might be due to some difference in the
preparation of the sample, or due to differences in the conductivity measurement. Secondly, the decrease
in conductivity between 5 and 30 bilayers is hardly noticeable, indicating that the conductive behaviour is
not related to the layer thickness. Further investigations with more measurements will have to be carried
out before any definite conclusions can be drawn.
4.5.1. Conductivity measurement limitations
There are several inherent deficiencies in the measurement method employed. First, a through plane
measurement will render a very thickness sensitive result. Compared to an in-plane measurement, which
measures the conductivity along the plane, the error will be much higher. Also, the thickness is possibly
altered by the high pressure from the sandwich construction of the measurement cell.
Second, a so-called two-probe measurement utilised in this work has a disadvantage in that there is
significant polarisation at the electrodes. This is partly accounted for by subtracting contact resistance etc.
It is instead suggested to use a four-prove measurement, where the polarisation problems are nullified.
Such a measurement is however more complicated and requires a more complex measurement cell.
Third, the model and equivalent circuit used was the simplest possible. In general one should always use
the simplest possible equivalent circuit to fit the data. However, since it was not possible to supply a high
enough frequency, it is difficult to evaluate the suitability of the equivalent circuit used. This might lead to
systematic errors in the calculated conductivity.
The gold that was evaporated onto the copper slowly degraded, and had to be re-evaporated onto the
electrodes. A more solid gold coverage, or even better platinum electrodes, would have increased the
precision of the measurements.
Another issue of significance is the operator’s experience and knowledge of the setup and equipment used,
and how different settings alter the results. It was the first time a measurement like this was carried out on
the equipment at hand. A significant improvement is expected with increased usage and experience.
4.6. Selectivity The selectivity is given by the ratio
and is a measure used for comparing membrane properties. Some examples from earlier results are here
presented in Table 4-4.

29
Table 4-4. Selectivity of some samples.
Sample MeOH perm. (cm²/s) Conductivity (S/cm) Selectivity (S×s/cm3)
% of reference
Nafion 2.5*10-6 0.0099 3960 100 Dopamine-melanin
8,1*10-7 0.0039 4815 122
LbL 5 bilayers 2.5*10-6 0.0042 1680 42 LbL 30 bilayers 1.0*10-6 0.0041 4100 104
Of interest here is that the selectivity of both dopamine-melanin and LbL 30 bilayers benefits from its
decreased methanol permeability. Again, the importance of such values can be questioned, but it may
nevertheless be a promising observation.
4.7. Polarisation Curve Measurements
4.7.1. Dopamine-melanin
In experiments with dopamine-melanin, there was a large variation of how much current it was possible to
draw from the cell, which possibly was related to the amount of excess dopamine-melanin. In Figure 26 we
can see one example of an IV-curve. The Open Circuit Potential (OCP) is increased, probably due to the
decreased methanol permeability.
Figure 25. Example of polarisation curve of dopamine-melanin covered Nafion membrane compared to Nafion 115.
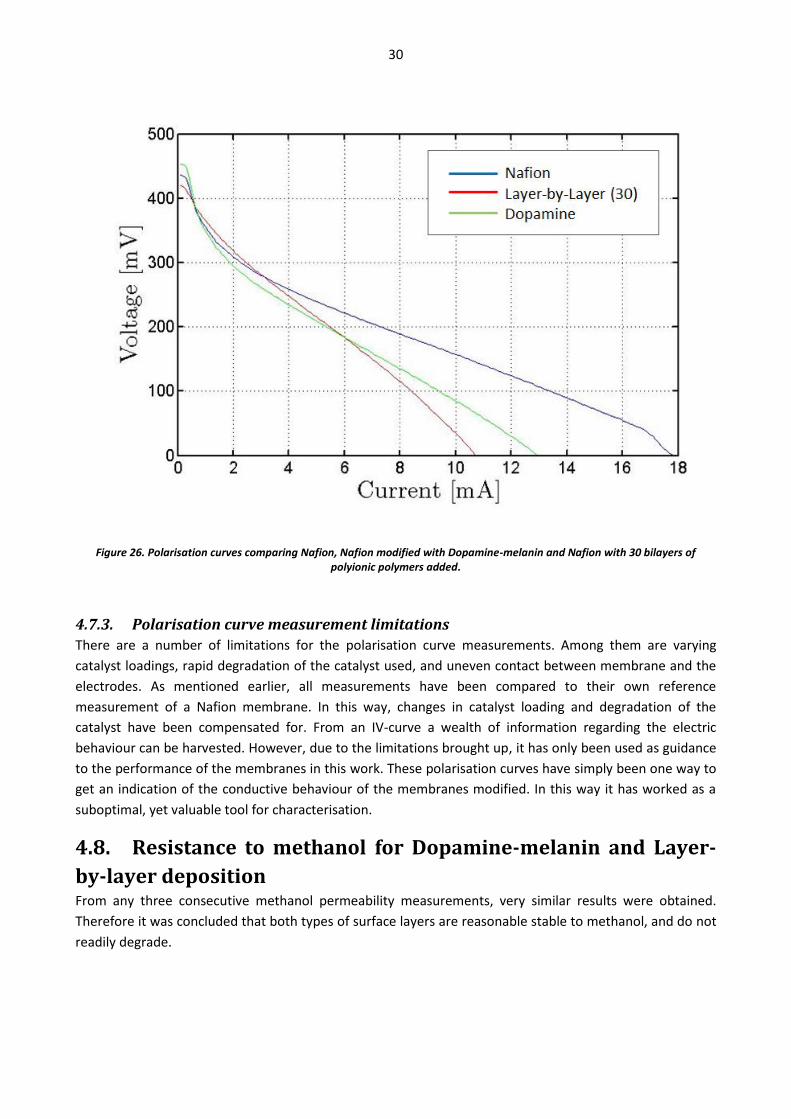
4.7.2. Layer-by-layer deposition
From Figure 26 some general points can be seen. LbL modification of Nafion seems to lead to a similar
reduction in maximum current as Dopamine-melanin. This is in agreement with the conductivity results
from EIS.
30
Figure 26. Polarisation curves comparing Nafion, Nafion modified with Dopamine-melanin and Nafion with 30 bilayers of polyionic polymers added.
4.7.3. Polarisation curve measurement limitations
There are a number of limitations for the polarisation curve measurements. Among them are varying
catalyst loadings, rapid degradation of the catalyst used, and uneven contact between membrane and the
electrodes. As mentioned earlier, all measurements have been compared to their own reference
measurement of a Nafion membrane. In this way, changes in catalyst loading and degradation of the
catalyst have been compensated for. From an IV-curve a wealth of information regarding the electric
behaviour can be harvested. However, due to the limitations brought up, it has only been used as guidance
to the performance of the membranes in this work. These polarisation curves have simply been one way to
get an indication of the conductive behaviour of the membranes modified. In this way it has worked as a
suboptimal, yet valuable tool for characterisation.
4.8. Resistance to methanol for Dopamine-melanin and Layer-
by-layer deposition From any three consecutive methanol permeability measurements, very similar results were obtained.
Therefore it was concluded that both types of surface layers are reasonable stable to methanol, and do not
readily degrade.
31
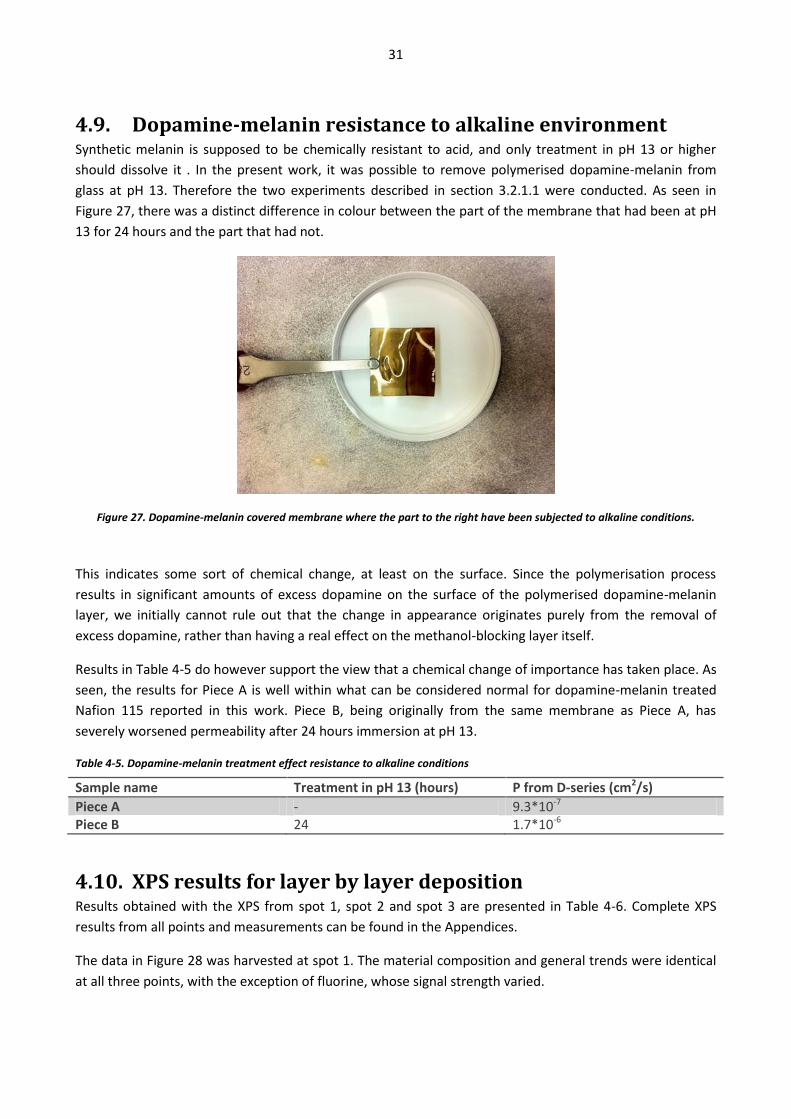
4.9. Dopamine-melanin resistance to alkaline environment Synthetic melanin is supposed to be chemically resistant to acid, and only treatment in pH 13 or higher
should dissolve it . In the present work, it was possible to remove polymerised dopamine-melanin from
glass at pH 13. Therefore the two experiments described in section 3.2.1.1 were conducted. As seen in
Figure 27, there was a distinct difference in colour between the part of the membrane that had been at pH
13 for 24 hours and the part that had not.
Figure 27. Dopamine-melanin covered membrane where the part to the right have been subjected to alkaline conditions.
This indicates some sort of chemical change, at least on the surface. Since the polymerisation process
results in significant amounts of excess dopamine on the surface of the polymerised dopamine-melanin
layer, we initially cannot rule out that the change in appearance originates purely from the removal of
excess dopamine, rather than having a real effect on the methanol-blocking layer itself.
Results in Table 4-5 do however support the view that a chemical change of importance has taken place. As
seen, the results for Piece A is well within what can be considered normal for dopamine-melanin treated
Nafion 115 reported in this work. Piece B, being originally from the same membrane as Piece A, has
severely worsened permeability after 24 hours immersion at pH 13.
Table 4-5. Dopamine-melanin treatment effect resistance to alkaline conditions
Sample name Treatment in pH 13 (hours) P from D-series (cm2/s)
Piece A - 9.3*10-7 Piece B 24 1.7*10-6
4.10. XPS results for layer by layer deposition Results obtained with the XPS from spot 1, spot 2 and spot 3 are presented in Table 4-6. Complete XPS
results from all points and measurements can be found in the Appendices.
The data in Figure 28 was harvested at spot 1. The material composition and general trends were identical
at all three points, with the exception of fluorine, whose signal strength varied.

32
From Figure 28 we can see that the amount of nitrogen is highest at low etching time, i.e. closest to the
surface. This is probably explained by the fact that the last layer to be added in the LbL treatment before
XPS characterisation was made of the nitrogen containing polymer PDAC.
Figure 28. Atomic percent profile for spot 1. The general trends were similar or identical at all three points.
In Table 4-6 the ratio of nitrogen to sulphur is presented, together with the fluorine atomic percentage. The
nitrogen/sulphur ratio is not changing much, which indicates similar chemical composition with respect to
the polyionic polymers at all points. Since the fluorine signal is changing nevertheless, this is likely not due
to the chemical composition of the LbL, but due to some sort of inhomogeneity of the surface. This might
be the sheer bulk amount of polymer present at the different spot, as this in fact was an obvious feature
when examining the sample with optical microscope as well as electron microscope.
Table 4-6. Ratio between N1s and S2p at spot 1, spot 2 and spot 3.
Name At.% spot 1 At.% spot 2 At.% spot 3
F1s 2.2 0.2 5.3 N1s 3.7 3.7 3.3 S2p 2.2 2.2 2.2 Ratio N1s/S2p 1.7 1.7 1.5
The fluorine is only present in the backbone of the Nafion substrate, and thus the varying signal strength at
the surface can either be attributed to varying layer thickness at point 1, point 2 and point 3, or a varying
porosity at these points. From SEM pictures, for example Figure 22, we know that the layer is of different
0,1
1
10
100
0 500 1000 1500 2000 2500 3000 3500 4000
Ato
mic
per
cen
t (%
)
Etch time (s)
Atomic percent profile
C1s
O1s
S2p
N1s
F1s
33
thickness. This does however not exclude the possibility that the porosity is varying. The measurement
spot size of the XPS was 400µm. Compared to the individual formation size seen for example in Figure 20,
Figure 21, Figure 22 and Figure 23, this is relatively big. Therefore the differences present must be to a
more general variation between the measurement regions, rather than single deviations from the norm.
Figure 22 A) and B) might be examples of this, showing a clear variation of the overall topography of the LbL
coating. The origin of this difference is unknown. It cannot be ruled out that there is a structural difference
present, even at similar chemical compositions.
5. CONCLUSIONS
5.1. Major conclusions for Dopamine-melanin and LbL Both dopamine-melanin modified Nafion and Layer-by-Layer modified Nafion has shown promise in
applications as the DMFC considered in this report, for several reasons. They have both been shown to
have more than 50% decreased methanol permeability, while relevant amounts of proton conductivity
remained. This was also shown with polarisation curve measurements, where similar amounts of currents
compared to Nafion could be drawn for some voltages. Decreased methanol permeability should result in
increased operation time of a fuel cell with limited fuel, which is important for the DMFC considered
herein. A further gain is that the decreased methanol permeability should allow higher concentrations of
fuel to be used in the DMFC, without the methanol cross over increasing to unacceptable levels.
5.2. Dopamine-melanin The decrease in methanol permeability after polymerisation of dopamine onto the Nafion surface is very
substantial, almost 70% as most. Given the ease of preparation, and that a 60% reduction of the
permeability was reached after the first effort, the results are promising. Herein lies also the limitation of a
dopamine-melanin cover, the method is very inflexible. As shown in this thesis as well as others , few
parameters, if any, seem to be able to significantly change the final properties. Thus it is much depending
on the requirements of the fuel cell to determine if this is a suitable method to be employed in a DMFC.
Given the resemblance of the dopamine-melanin produced in this thesis and that reported elsewhere,
there are doubts concerning the conductivity results reported in this thesis. These might have to be
confirmed with a different measurement setup. From experiments with dopamine-melanin treated
membranes at pH 13, we can draw the conclusion that the methanol resistant layer formed can be partly
dissolved at very alkaline conditions. Results indicate that a significantly reduced reaction time, and thereby
a further simplified preparation procedure, has no negative effect on the performance of the dopamine-
melanin modified Nafion membrane. Given its properties and the ease of preparation, polymerisation of
dopamine-like molecules should find use for fuel cells and elsewhere.
5.3. Layer-by-layer deposition The LbL deposited layer showed a correlation between decreased methanol permeability and number of
bilayers added. This relationship levelled out after 15-30 bilayers. XPS results shows that the properties of
the layers are inhomogeneous on a scale of hundreds of micrometres. The uneven thickness and irregular
shape of the surface layer is confirmed by SEM images, and shows that a large proportion of the polymer
material is not arranged in a planar bilayer structure. The layer formed is resistant to methanol at high

34
concentrations. The conductivity of the bilayers is significantly lower than for Nafion, but an increased
selectivity indicates that this trade-off might be favourable.
LbL deposition is a very versatile method to deposit polymer material (amongst other materials available
for this method) but further research into the mechanisms and variables that govern the layer formation
must be undertaken to reach a high level of control over the end result.
5.4. Suggestions for improvements The conclusions of this thesis could have been improved by a more accurate measurement of the
conductivity of the modified membranes. Therefore it is suggested that a four-probe measurement
cell should be constructed in order to improve the quality of the data. It might also be a good idea
to test different electrode materials to further reduce the electrode-membrane interface
resistance.
The dual chamber measurement cell used for methanol permeability measurements should be
redesigned so that the volume and concentration changes are reduced. This could be achieved by
increasing the chamber volumes while keeping the effective diffusion area constant. The QCM-D
should still be able to determine changes in concentration with an acceptable precision.
The degree of sulfonation of the PEEK was not known, but only assumed based on the preparation
method used. The degree of sulfonation should be measured directly, for example using titration.
Deviation between the assumed and true degree of sulfonation of the PEEK backbone should affect
the LbL formation. Mismatch between the concentration of ionic groups in the polyionic polymers
used could potentially lead to a reduced binding ability.
An effort to carry out the LbL process using the same solvent for both anion and cation would have
ruled out or explained some of the questions regarding the lump formation on the substrate.
PDAC is completely ionised in water, but sPEEK might not be in DMF. By changing solvent for sPEEK
the degree of ionisation might be improved. Efforts were made to dissolve sPEEK in acidic
conditions, without success. However some other solvent might be more suitable. Utilising sodium
chloride as proposed by Argun et al.15 and Yilmazturk et al.20 among others, might also improve the
solubility or conductivity.
5.5. Future research The dopamine-melanin forming process might ultimately be governed by the molecule used in the reaction,
rather than reaction conditions. Therefore it could be of interest to self-polymerise some of the many
existing similar molecules, for example norepinephrine or L-DOPA (see Figure 29). Another possibility is to
use a molecule which includes OH-groups, amino groups and a conductive group such as SO3-.

35
Figure 29. A) Norepinephrine. B) 3,4.dihydroxy-L-phenylalanin (also known as L-DOPA and Levodopa).
Of immediate interest in the LbL process would be to investigate how the immersion time could be
reduced, perhaps through increased reaction temperature. With the method employed in this thesis, the
formation of one bilayer takes a full hour. This time could be significantly reduced, which in the short run
would greatly reduce the effort of non-robot assisted development of various LbL coatings. In the long run
this might be required for the method to be viable for production. In general, the importance of a number
of reaction conditions and their effect on porosity, conductivity etc. should be investigated.
It could also be of interest to investigate the properties of this, or similar, LbL coatings on a substrate other
than Nafion. In a first step this should be a water permeable polymer membrane without conductive
groups. In the end this might remove the use of a separate substrate altogether.
The importance of the ionic concentration of the polymers could be investigated, as this may severely limit
the amount of polymers possible to use in LbL processes.
The importance of water management in a high fuel concentration DMFC (a so-called HC-DMFC) has been
pointed out by Li et al.21 amongst others. However, this is not often mentioned in articles on fuel cell
membrane formation. When approaching 100% pure methanol fuel, it is important to consider this aspect.
Therefore future investigations should include characterisation of water permeability as a separate issue, in
parallel with methanol permeability.
B A

36
6. REFERENCES
1. DeLuca, N.W. & Elabd, Y.A. Polymer electrolyte membranes for the direct methanol fuel
cell: a review. Journal of Polymer Science Part B: Polymer Physics 44, 2201–2225(2006).
2. Zhao, T.S. et al. Towards operating direct methanol fuel cells with highly concentrated fuel.
Journal of Power Sources 195, 3451-3462(2010).
3. Ramya, K. & Dhathathreyan, K.S. Direct methanol fuel cells: determination of fuel crossover
in a polymer electrolyte membrane. Journal of Electroanalytical Chemistry 542, 109-
115(2003).
4. Mauritz, K.A. & Moore, R.B. State of Understanding of Nafion. Chemical Reviews 104,
4535-4586(2004).
5. Chen, S.-R.& Nafion water channel model. Nature Materials 7, 75(2008).
6. Heitner-Wirguin, C. Recent advances in perfluorinated ionomer membranes: structure,
properties and applications. Journal of Membrane Science 120, 1-33(1996).
7. Soboleva, T. et al. Investigation of the through-plane impedance technique for evaluation of
anisotropy of proton conducting polymer membranes. Journal of Electroanalytical
Chemistry 622, 145-152(2008).
8. Lee, H. et al. Mussel-inspired surface chemistry for multifunctional coatings. Science (New
York, N.Y.) 318, 426-30(2007).
9. Wang, J. et al. A facile surface modification of Nafion membrane by the formation of self-
polymerized dopamine nano-layer to enhance the methanol barrier property. Journal of
Power Sources 192, 336-343(2009).
10. Li, B., Liu, W. & Jiang, Z. Ultrathin and Stable Active Layer of Dense Composite Membrane
Enabled by Poly(dopamine). Langmuir 25, 7368-7375(2009).
11. Bernsmann, F. et al. Characterization of Dopamine−Melanin Growth on Silicon Oxide. The
Journal of Physical Chemistry C 113, 8234-8242(2009).
12. Li, Y. et al. Electrochemical quartz crystal microbalance study on growth and property of the
polymer deposit at gold electrodes during oxidation of dopamine in aqueous solutions. Thin
Solid Films 497, 270-278(2006).
13. Zajac, G. et al. The fundamental unit of synthetic melanin: a verification by tunneling
microscopy of X-ray scattering results. Biochimica et Biophysica Acta (BBA)-General
Subjects 1199, 271–278(1994).

37
14. Decher, G. Fuzzy Nanoassemblies: Toward Layered Polymeric Multicomposites. Science
277, 1232-1237(1997).
15. Argun, A. a, Ashcraft, J.N. & Hammond, P.T. Highly Conductive, Methanol Resistant
Polyelectrolyte Multilayers. Advanced Materials 20, 1539-1543(2008).
16. Wootthikanokkhan, J. & Seeponkai, N. Methanol permeability and properties of DMFC
membranes based on sulfonated PEEK/PVDF blends. Journal of Applied Polymer Science
102, 5941-5947(2006).
17. Hansson, L. Molecularly imprinted polymer integrated with a QCM.D as a melamine sensor
(Lunds University). (2009).
18. (Editor), W.M.H. Handbook of physics and chemistry 91st edition. CRC Press.
ISBN:9781439820773. (CRC Press: ).
19. Q-Sense. at <http://www.q-sense.com/qcm-d-technology>
20. Yılmaztürk, S. et al. A novel approach for highly proton conductive electrolyte membranes
with improved methanol barrier properties: Layer-by-Layer assembly of salt containing
polyelectrolytes. Journal of Membrane Science 343, 137-146(2009).
21. Li, X., Faghri, A. & Xu, C. Water management of the DMFC passively fed with a high-
concentration methanol solution. International Journal of Hydrogen Energy 35, 8690-
8698(2010).
22. Effective diffusivity in porous media. at <http://en.wikipedia.org/wiki/Mass_diffusivity>

38
7. APPENDICES
7.1. MATLAB code example The purpose of this code is to calculate the methanol permeability using the data file from the QCM.
clear all; %Constants V1 = 7; %ml V2 = 7; %ml C0 = 12344; %concentration at time=0 in mM d = 137; %membrane thickness in micrometer Dgluc = 6.73e-6; %cm²/s A = 0.785; %area of exposed membrane in cm² convMatrix = xlsread('Y:\Organization\OTS\Samples\calibrationmatrix.xls','A3:B8'); matrix = xlsread('Avni9layers20110126.xls','D2:I65536'); timeRow = xlsread('Avni9layers20110126.xls','A2:A65536'); nbrOfHours = 5; %number of hours to include in calculation startT = 0; %number of minutes from start of measurement until MeOH put into container ts = (1:1:nbrOfHours)*3600; %if nbrOfHours > (matrix(65535,1)/3600) % nbrOfHours = round(timeRow(65535,1)/3600); %end for i=1:nbrOfHours [min_difference,array_position] = min(abs(timeRow(:,1)-3600*i)); places(i)=array_position; end for j=1:6 placeMatrix(:,j)=matrix(places,j); end for k=1:6 molarConv(:,k) = (placeMatrix(:,k)-convMatrix(k,2))/convMatrix(k,1); end %determining through D-series mMolarD(:,1)=((molarConv(:,2)+molarConv(:,4)+molarConv(:,6))/3).*1e3; C1d = C0-mMolarD*V2/V1; reld = log((C1d-mMolarD)/C0);

39
%above is understood, below is not pd = polyfit(ts',reld,1); clf plot(ts,reld,'diamond'), hold on, grid on x = linspace(0,ts(nbrOfHours)); yd = polyval(pd,x); plot(x,yd) porosityd = (abs(pd(1))*d*0.0001)/(A*Dgluc*(1/V1+1/V2)); permD = porosityd*Dgluc %determining through F-series mMolarF(:,1)=((molarConv(:,1)+molarConv(:,3)+molarConv(:,5))/3).*1e3; C1f = C0-mMolarF*V2/V1; relf = log((C1d-mMolarF)/C0);
%above is understood, below is not pf = polyfit(ts',relf,1); plot(ts,relf,'square'), hold on, grid on x = linspace(0,ts(nbrOfHours)); yf = polyval(pf,x); plot(x,yf,'green') porosityf = (abs(pf(1))*d*0.0001)/(A*Dgluc*(1/V1+1/V2)); permF = porosityf*Dgluc

40
7.2. Mathematical model used for permeability calculations In Cell 1, the initial concentration C1(t=0) of methanol is C0, and in Cell 2, C2 (t=0) = 0.
( )
( )
( ) ( ) ( )
( )
( ( ) ( ))
Making use of several assumptions, as well as Laplace and inverse Laplace transform, we arrive at
In general it is given that the permeability can be expressed as the product of the diffusion coefficient
and the so called partition coefficient
The partition coefficient can be assumed K = 1 for Nafion , and the effective diffusivity is related to the
diffusion coefficient of the material through (“Effective diffusivity in porous media,”)
From earlier we know that
| |
By making use of some empirical relationships and assumptions regarding the porosity, we can calculate
P from this
| |
| |
(
)

41
7.3. Conductivity setup resistances and example of
measurement curve
Table over EIS measurements setup resistances
Mean Standard deviation
Parallel resistance x-intercept 29.4 (kΩ) 6.3 (kΩ)
Serial resistance x-intercept 99.8 (mΩ) 11.0 (mΩ)
Example of curve fitting for Nafion membrane.
7.4. XPS results Experiment Descriptions Table
15 bilayers\X-Ray015 400um - FG ON\Point 1 - before depth profiling
PDAC/SPEEK
Common Acquisition Parameters Table
Parameter
Total acq. time 5 mins 40.3 secs
No. Scans 5
Source Type Al K Alpha
Spot Size 400 µm
Lens Mode Standard
Analyser Mode CAE : Pass Energy 200.0 eV
Energy Step Size 1.000 eV
No. of Energy Steps 1361

42
Elemental ID and Quantification
Name Peak BE
Height CPS
FWHM eV
Area (P) CPS.eV
Area (N) KE^0.6
At. % SF Al Scof
Backgnd
C1s 285.08 261718.83 3.15 909525.58 12910.99 74.08 1.000 Smart
O1s 531.99 137831.19 3.72 537808.70 2991.18 17.16 2.930 Smart
F1s 688.74 24875.65 3.14 94082.61 385.41 2.21 4.430 Smart
N1s 400.79 15184.19 4.82 76303.72 639.44 3.67 1.800 Smart
S2p 167.74 13900.52 2.93 47072.85 378.37 2.17 1.670 Smart
Si2p ??? 102.09 2208.80 3.07 7714.85 123.12 0.71 0.817 Smart
??? = Lower confidence assignment

Experiment Descriptions Table
15 bilayers\X-Ray015 400um - FG ON\Point 2 - before depth profiling
PDAC/SPEEK
Common Acquisition Parameters Table
Parameter
Total acq. time 5 mins 40.3 secs
No. Scans 5
Source Type Al K Alpha
Spot Size 400 µm
Lens Mode Standard
Analyser Mode CAE : Pass Energy 200.0 eV
Energy Step Size 1.000 eV
No. of Energy Steps 1361
Elemental ID and Quantification
Name Peak BE
Height CPS
FWHM eV
Area (P) CPS.eV
Area (N) KE^0.6
At. % SF Al Scof
Backgnd
N1s 400.52 17605.33 3.25 86690.65 726.38 3.66 1.800 Smart
C1s 285.16 300452.97 3.22 1059521.90 15040.82 75.72 1.000 Smart
O1s 532.06 169678.33 3.68 652317.83 3628.22 18.27 2.930 Smart
S2p 167.81 15617.86 2.96 52819.58 424.58 2.14 1.670 Smart
F1s 689.06 3393.29 3.56 10594.05 43.41 0.22 4.430 Smart
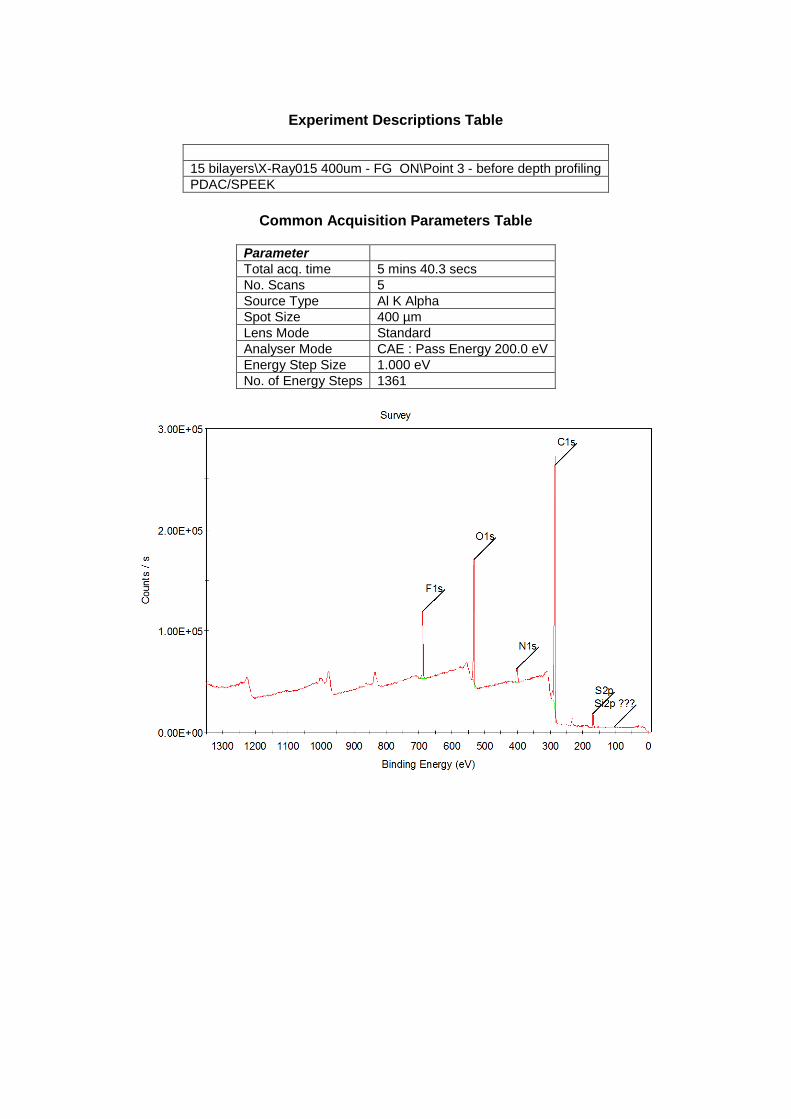
Experiment Descriptions Table
15 bilayers\X-Ray015 400um - FG ON\Point 3 - before depth profiling
PDAC/SPEEK
Common Acquisition Parameters Table
Parameter
Total acq. time 5 mins 40.3 secs
No. Scans 5
Source Type Al K Alpha
Spot Size 400 µm
Lens Mode Standard
Analyser Mode CAE : Pass Energy 200.0 eV
Energy Step Size 1.000 eV
No. of Energy Steps 1361

Elemental ID and Quantification
Name Peak BE
Height CPS
FWHM eV
Area (P) CPS.eV
Area (N) KE^0.6
At. % SF Al Scof
Backgnd
C1s 285.23 233170.82 3.21 847537.16 12031.93 72.26 1.000 Smart
O1s 532.21 124305.41 3.70 493659.67 2746.01 16.49 2.930 Smart
F1s 688.99 62446.19 3.09 215214.02 881.79 5.30 4.430 Smart
N1s 401.63 13175.53 3.20 66289.23 555.78 3.34 1.800 Smart
S2p 168.01 13691.07 3.00 45501.19 365.78 2.20 1.670 Smart
Si2p ??? 101.88 1474.61 2.60 4413.80 70.43 0.42 0.817 Smart
??? = Lower confidence assignment
Complete data files can be supplied upon requiest.