Embed Size (px)
Citation preview

This study was commissioned by
SUPPORTING THE EFFECTIVE TEACHING OF PRIMARY SCIENCE AND TECHNOLOGYA Discrete Choice Experiment ApproachDECEMBER 2017

RESEARCH TEAM
University of Technology Sydney: Associate Professor Paul F. Burke, Professor Peter Aubusson, Professor Sandra Schuck, Associate Professor Wan Ng, Dr Kimberley Pressick-Kilborn and Dr Tracey-Ann Palmer.
ACKNOWLEDGMENTS
This report was commissioned by the Association of Independent Schools of New South Wales (AISNSW) and prepared by researchers from the University of Technology Sydney (UTS). The assistance of members of UTS Centre for the Study of Choice (CenSoC) is acknowledged.
SUGGESTED CITATION
Burke, P.F., Schuck, S., A ubusson, P., Wei, E. & Palmer, T.A. (2017). Supporting the effective teaching of primary science and technology: A discrete choice experiment approach. Sydney: Association of Independent Schools of NSW. Available at: http://ow.ly/Ypht30c7gxh
© The Association of Independent Schools of NSW Ltd. December 2017

Supporting the Effective Teaching of Primary Science and Technology 1
TABLE OF CONTENTS
Table 1: Attributes and Levels Used in Choice Experiment ........................................................... 10
Table 2: Commitment to the Profession and Their School among Teachers ............................................... 17
Table 3: Full List of Model Estimates ............................................ 20
Figure 1: Setting the Context for a Primary Science and Technology Lesson ...................................................... 9
Figure 2: Example of the DCE Task .............................................. 12
Figure 3: Location of School .......................................................... 14
Figure 4: Number of Students at School ..................................... 14
Figure 5: Perceived School Capabilities ....................................... 15
Figure 6: Number of Students in Typical Primary Science and Technology Class ........................................ 16
Figure 7: Level of Schooling Taught ............................................. 17
Figure 8: Enthusiasm and Enjoyment in Teaching Primary Science and Technology ................................. 18
Figure 9: Confidence and Knowledge in Primary Science and Technology among Teachers .................... 19
Figure 10: Perceived Effectiveness in Teaching Primary Science and Technology ................................. 19
Figure 11: Relative Importance of Each Attribute in DCE in Percentage Terms .......................................... 22
Figure 12: Impact of Collaboration in Time Allocated to Plan ............................................................... 23
Figure 13: Impact of Strategies for Idea Generation in Sequence of Lessons .................................... 23
Figure 14: Discussing Ideas for the Lesson Sequence ............... 24
Figure 15: Collaboration in Teaching ........................................... 25
Figure 16: Supportive Feedback ................................................... 25
Figure 17: Classroom Facilities and Areas for Science and Technology Teaching ...................................................................... 26
Figure 18: Space to Store Resources and Materials .................. 27
Figure 19: Space to Store Work in Progress................................ 27
Figure 20: Timetabling for Science and Technology .................. 28
Figure 21: Differences between Latent Classes in Preferences for Collaboration ..................................... 30
Figure 22: Preferences for Supportive Classroom Facilities (Differences by Latent Classes) ..................................... 33
Figure 23: Preferences for Timetabling (Differences by Latent Classes) ..................................................... 34
Figure 24: Attitudes to Science and Technology (Differences by Latent Class) ......................................................... 35
Figure 25: Perceptions of School Capabilities in Science and Technology Teaching ............................................ 36
EXECUTIVE SUMMARY . . . . . . . . . . . . . . . . . . . . . . . . . . . . 2
INTRODUCTION . . . . . . . . . . . . . . . . . . . . . . . . . . . . . . . . . 4
PRECEDING RESEARCH: BARRIERS TO THE EFFECTIVE TEACHING OF PRIMARY SCIENCE AND TECHNOLOGY STUDY . . . . . . . . . . . . . . . . . . . . . . . . .5
BACKGROUND TO DISCRETE CHOICE EXPERIMENTS (DCE) AND RELATED DISCRETE CHOICE MODELS . . . . . . . . . . . . . . . . . . . . . . . . 7
THE SURVEY INSTRUMENT AND DCE TASK . . . . . . . . . . 9
RESPONDENTS . . . . . . . . . . . . . . . . . . . . . . . . . . . . . . . . .13
School Characteristics and Capabilities . . . . . . . . . . . . . . . . 14
Perceptions of Colleagues and School Capabilities
in Science and Technology Teaching . . . . . . . . . . . . . . . . . . 15
Classroom Characteristics . . . . . . . . . . . . . . . . . . . . . . . . . . .16
Teacher Characteristics . . . . . . . . . . . . . . . . . . . . . . . . . . . . . .17
Teacher Efficacy and Attitudes to Primary Science
and Technology Teaching . . . . . . . . . . . . . . . . . . . . . . . . . . . .18
DISCRETE CHOICE EXPERIMENT RESULTS . . . . . . . . . . 20
Time Allocated to Plan for Science and Technology . . . . . . 23
Coming Up with Ideas for the Sequence of Lessons . . . . . 23
Discussing Ideas for the Lesson Sequence . . . . . . . . . . . . . 24
Collaboration in Teaching . . . . . . . . . . . . . . . . . . . . . . . . . . . .24
Supportive Feedback on Planning . . . . . . . . . . . . . . . . . . . . . 25
Classroom Facilities and Special Areas
for Science and Technology . . . . . . . . . . . . . . . . . . . . . . . . . .26
Space to Store Resources and Work in Progress (WIP) . . . 27
Timetabling Science and Technology . . . . . . . . . . . . . . . . . . 28
ACCOUNTING FOR DIFFERENCES IN TEACHERS: LATENT CLASS ANALYSIS . . . . . . . . . . . . . . . . . . . . . . . .29
Differences in Preferences for Collaboration . . . . . . . . . . . 29
Differences in Preferences for
Classroom Facilities and Storage . . . . . . . . . . . . . . . . . . . . . .32
Differences in Preference for Timetabling . . . . . . . . . . . . . . 34
Differences in Segment Profiles . . . . . . . . . . . . . . . . . . . . . . 34
DISCUSSIONS AND CONCLUSIONS . . . . . . . . . . . . . . . .37
REFERENCES . . . . . . . . . . . . . . . . . . . . . . . . . . . . . . . . . . .40
TABLES AND FIGURES

Supporting the Effective Teaching of Primary Science and Technology2
• space to store resources/materials
• space to store work in progress (WIP)
• timetabling for science and technology
• collaboration in teaching
• receiving ongoing supportive feedback on planning.
An online survey containing the choice experiment task was completed by 260 teachers working in NSW independent schools who had taught primary science and technology during the last five years.
The vast majority of participating teachers are enthusiastic and confident in their knowledge of, and ability to teach primary science and technology effectively. Less than half of them agree they work at schools that are well resourced for teaching this subject. Likewise, less than half of the participating teachers agree that they work at schools where their colleagues have adequate knowledge of the subject to be effective teachers.
The DCE results indicate that teachers prefer opportunities that allow them to work and plan with other teachers. They also significantly value ongoing supportive feedback. Co-teaching opportunities are considered the least valued form of collaboration when compared to other mechanisms that support effective teaching. The results also suggest that teachers prefer online resources for generating ideas, especially those that are relevant to the syllabus.
Teachers consider various ways of resourcing and managing their classrooms for effective teaching. They are concerned with finding solutions to issues related to storing and managing resources, materials and students’ work in progress. Teachers welcome shared storage solutions, both inside and outside the classroom. With respect to facilities for teaching, many express a preference for dedicated science and technology spaces as a means to improving teaching effectiveness. They are also in favour of flexible classrooms as a way of facilitating effective science and technology teaching (for example, moveable furniture).
EXECUTIVE SUMMARY
This report presents findings of a study that examines how to best provide an environment that supports and promotes the effective teaching of primary science and technology in NSW independent schools. Utilising a discrete choice experiment (DCE) and related choice modelling approaches, the study aims to explore how several factors interact or work together to impact teaching. Since combinations of factors have the potential to impact teacher practice in various ways, the study identifies the factors and combinations of these that are perceived by teachers to be most conducive to their teaching.
This study is the final component of a larger research project guided by the broad research question: What characterises quality learning and teaching in primary science and technology?
The other three components of this project include:
• Quality learning and teaching in primary science and technology literature review (Aubusson, Schuck, Ng, Burke, Pressick-Kilborn, & Palmer, 2015)
• Case study report: Quality learning and teaching in primary science and technology (Aubusson, Schuck, Ng, Burke, Pressick-Kilborn, & Palmer, 2016)
• Barriers to the effective teaching of primary science and technology (Burke, Aubusson, Schuck, Palmer, Pressick-Kilborn, & Ng, 2016).
The choice experiment involves teachers indicating their preferences for teaching science and technology in a number of hypothetical schools that vary by nine discrete factors. These factors have been identified in preceding research, particularly the Barriers to the effective teaching of primary science and technology, as most likely to impact effective teaching in this subject area and include:
• collaboration for planning the science and technology program
• sourcing ideas for the sequence of lessons
• discussing ideas for lesson sequence
• classroom facilities
Supporting the Effective Teaching of Primary Science and Technology 3
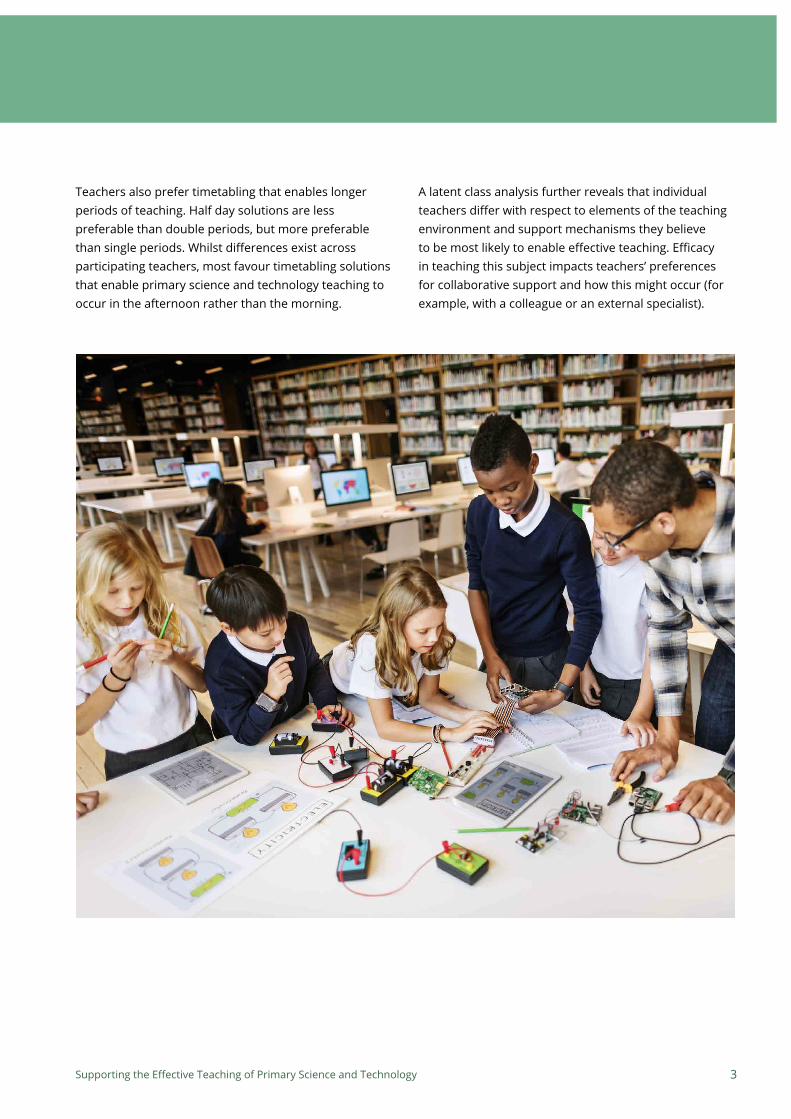
A latent class analysis further reveals that individual teachers differ with respect to elements of the teaching environment and support mechanisms they believe to be most likely to enable effective teaching. Efficacy in teaching this subject impacts teachers’ preferences for collaborative support and how this might occur (for example, with a colleague or an external specialist).
Teachers also prefer timetabling that enables longer periods of teaching. Half day solutions are less preferable than double periods, but more preferable than single periods. Whilst differences exist across participating teachers, most favour timetabling solutions that enable primary science and technology teaching to occur in the afternoon rather than the morning.

Supporting the Effective Teaching of Primary Science and Technology4
INTRODUCTION
The quality of primary science and technology education varies widely based on numerous factors, both teacher and school derived. Using a survey methodology called discrete choice experiment (DCE), this study aims to explore how these factors interact, or work together, to impact on effective teaching. Since combinations of factors have the potential to impact teacher practice in various ways, the study identifies the factors and combinations of these that are perceived by teachers to be most conducive to their effective teaching. Data obtained from this approach are used to estimate a series of discrete choice models (DCM) to reveal which combination of factors teachers prefer, in relative terms, with respect to promoting effective teaching.
This research is part of a larger, comprehensive project guided by the following overarching research question: What characterises quality learning and teaching in primary science and technology?
The following research components address this overarching question:
1. Quality learning and teaching in primary science and technology literature review (Aubusson et al., 2015): identifies the factors that influence and characterise quality learning and teaching in primary science and technology
2. Case study report: Quality learning and teaching in primary science and technology (Aubusson et al., 2016): illustrates exemplary practices of six teachers working in NSW independent schools, and identifies barriers to quality learning and teaching in primary science and technology
3. Barriers to the effective teaching of primary science and technology (Burke et al., 2016): identifies and quantifies the relative impact of factors that influence most significantly on teachers’ effective teaching in this subject area
4. Supporting the effective teaching of primary science and technology: A discrete choice experiment approach: the current study.
Ethics approval for all components of the larger project is granted by the University of Technology Sydney’s (UTS) Human Research Ethics Committee, reference number UTS HREC 2015000220.

Supporting the Effective Teaching of Primary Science and Technology 5
PRECEDING RESEARCH: BARRIERS TO THE EFFECTIVE TEACHING OF PRIMARY SCIENCE AND TECHNOLOGY STUDY
The focus of the current study is to determine what combination of factors support teachers in teaching science and technology well. Well is broadly defined as referring to various approaches to teaching, including those where:
• science and technology activities are embedded in contexts that are relevant and important to students
• students engage in collaborative inquiry and solve problems
• students conduct hands-on investigations to gather evidence to test ideas
• students design and make products
• students develop capabilities, knowledge and positive science and technology dispositions.
While such practices are encouraged and present an ideal, in reality several factors appear to prevent teachers from enacting them. A number of factors consistently emerged and were identified as barriers in the Barriers to the effective teaching of primary science and technology study (hereinafter, the BWS) — the research component preceding and directly informing the current one.
The BWS quantified the relative impact of factors nominated by teachers as being instrumental in influencing their effective teaching of primary science and technology (Burke et al., 2016). For example, it showed that insufficient time to prepare is a major inhibitor. Issues around time were also identified as contributing to other important barriers, such as those relating to having sufficient opportunities to collaborate with colleagues, and managing activities within the constraint of a crowded or disjointed timetable. The study also revealed that teachers were concerned about issues related to space, such as being able to maintain students’ work in progress, store materials, and keep track of shared resources.
In the Case study report: Quality learning and teaching in primary science and technology and the focus groups,
some teachers nominated issues around confidence in answering student questions, or undertaking science and technology activities as barriers to effective teaching. Others suggested that an inability to control the class or activities being too messy might be barriers in this regard. However, the BWS revealed that these were less likely to be nominated by teachers as barriers when considered against other issues, such as those relating to time in the classroom, time to prepare, or concerns regarding space.
In addition, the BWS considered variation across participating teachers by identifying groups of those who may be more or less confident, or those who teach at schools that may be more or less supportive of teaching science and technology. Taken together, the study suggested that some barriers required more attention than others. It also recognised that some schools had already employed strategies to address the barriers their teachers may be experiencing.
During the course of the present study, teachers also nominated solutions to minimise the impact of the identified barriers. However, it was unclear from discussions whether these approaches would be more preferred amongst the wider population of teachers relative to other courses of action. For example, teachers had nominated that time in the classroom was a significant barrier to effective teaching. In particular, some felt that a limited period of time allocated to teaching science and technology prevented certain activities from being undertaken effectively because these were perceived to require significant time to set up or clean up. Overall, many teachers felt that whilst some activities would provide a valuable learning experience, they were compromised by time constraints and could not be undertaken in ways that made them worthwhile. As a result, some teachers proposed having longer lesson periods in order to teach science and technology effectively. However, others did not think that this would be effective, and some believed that the effectiveness of this solution would depend on the timing of the teaching activities (that is, to occur in the morning or afternoon).

Supporting the Effective Teaching of Primary Science and Technology6
With regards to idea generation, some teachers suggested that they would benefit from accessing a variety of resources or opportunities to discuss ideas. For example, some suggested that online forums provided a valuable platform, whilst others were wary of these as they are not linked to the curriculum. Several teachers indicated that whilst there were extensive resources available, they had to spend a significant amount of time filtering these to identify those most suited to their context. In some cases, this appeared to compromise the time available for conversations with colleagues, which was considered to be more fruitful.
In summary, the BWS revealed numerous barriers to the effective teaching of primary science and technology. It also offered possible solutions to these barriers – some of which may be more attractive to teachers than others. The next step was to identify which solutions teachers would perceive as more effective and how these would compare to the investment of resources in other areas. As a result, a discrete choice experiment approach was chosen to generate these insights.

Supporting the Effective Teaching of Primary Science and Technology 7
A discrete choice experiment is a method used to understand how decision makers make trade-offs between various features or attributes of options about which they must make a choice. For example, consumers may consider various features of a given product such as those relating to key ingredients, size, weight, branding, perceived quality and price. In most instances, consumers must make trade-offs. For instance, they might consider whether to pay more in order to obtain a product perceived to be of better quality. In other cases, consumers may pay less attention to certain features of a product than to others. For example, they may make decisions about which second-hand car they want to purchase based entirely on how many kilometres it has travelled, or make and model, but be entirely indifferent about colour. In other words, some attributes are more important to decision makers than others.
A choice experiment is used to quantify which features of an option are more or less attractive to decision makers, or whether such features are ignored entirely when other features are in play. To do so, a choice experiment involves observing choices among alternatives when features of the alternatives are systematically altered. For example, if a decision maker consistently chooses a red car over a blue car or a yellow car regardless of the car’s price, we learn that colour is important to this decision maker, more so than price. We also learn that the decision maker prefers red cars to ones that are blue or yellow.
In the current study, the focus is on understanding which mechanisms are more attractive to teachers than others in terms of their usefulness in addressing barriers to the effective teaching of primary science and technology. For example, if we observe that teachers consistently choose an environment that allows more time to plan teaching with others regardless of the storage facilities that may differ across the proposed alternative environments, we can conclude that solutions around collaboration are more important to them than those relating to storage. We can also learn about preferences within these various attributes,
such as the person(s) they value more in terms of collaborative planning opportunities — for example, a consultant or a teaching colleague.
Whilst data describing a person’s choices and inputs into those choices can be gathered from many settings, an experimental setting provides opportunities to present options that are entirely hypothetical and may not occur in a person’s environment of study. It also helps control and minimise impact of various factors, particularly those that are highly correlated with each other. For example, a teacher reporting on their own teaching environment may reveal experiences such as whether they have the opportunity to work in a dedicated science and technology room, or whether they have undertaken collaborative teaching.
The current research goes beyond the teacher’s experience and is interested in their preferences in a different environment, where some of these elements can be removed or introduced, including those that are entirely new or seldom realised (for example, providing an entire afternoon dedicated to science and technology teaching). Likewise, if teachers are asked whether they would like to see certain initiatives undertaken to support their teaching, most would provide supportive responses if these initiatives are presented to them in isolation. For example, if teachers are asked whether they would like to work at a school with a dedicated science and technology lab, many would overwhelmingly agree (for example, when using a Likert scale). A choice experiment instead asks respondents to consider an environment where they must trade off various solutions thereby revealing which solution component is more valued relative to another.
With respect to scholarly works, the earliest account of choice experiments can be traced as far back as research undertaken by Thurston (1927) who was interested in describing how decision makers undertake pairwise comparisons (namely, selecting one option out of a pair of options). Similarly, work by Luce (1959) in mathematical psychology and McFadden (1974) in economics are seminal in these respective areas. The
BACKGROUND TO DISCRETE CHOICE EXPERIMENTS (DCE) AND RELATED DISCRETE CHOICE MODELS

Supporting the Effective Teaching of Primary Science and Technology8
in education has been introduced by researchers at the University of Technology Sydney in areas such as teacher retention, technology adoption and student learning (see, for example, Aubusson, Burke, Schuck, Kearney, & Frischknecht, 2014; Burke, Aubusson, Schuck, Buchanan, & Prescott, 2015; Burke et al., 2013; Schuck et al., 2011).
field of choice modelling and choice experiments gained traction when applications began to appear in transport and marketing (for example, Ben-Akiva & Lerman, 1985; Louviere & Hensher, 1982; Louviere & Woodworth, 1983). Since then, other fields including health economics have benefited (for example, Train, 2009). To date, much of the work using choice experiments

Supporting the Effective Teaching of Primary Science and Technology 9
differently depending on the psychological distance an individual perceives he or she is from the object under evaluation. In this survey, the intention was for teachers to consider concrete factors relating to their everyday teaching, instead of a more abstract consideration about challenges that they might face in teaching more broadly. As such, a primer was developed to establish a teaching context by asking teachers to imagine the following situation:
“Your school’s scope and sequence includes a focus on the Material World content strand. You have identified relevant BOSTES Syllabus outcomes in Material World, Products, Working Scientifically and Working Technologically.”
A particular context was provided with teachers being told that “The idea for the lesson sequence is based on two authentic contexts: a) a Teddy Bears’ picnic, and, b) concerns about student safety in school.” Pictures of teddy bears also accompanied the text to further increase the realism of the task.
Teachers were asked to consider how the lesson sequence could be enacted in an effective manner (see Figure 1). The text was based on the previous Quality learning and teaching in primary science and technology literature review that summarised effective approaches to primary science and technology teaching.
A discrete choice experiment was used to understand how teachers make trade-offs among a variety of approaches to operationalising support, to address important factors identified in the BWS as barriers to the effective teaching of primary science and technology.
Following a series of screening questions, a description of effective teaching was provided to teachers using the following text:
“By ‘effective’ we mean that science and technology are embedded in contexts that are relevant and important to students. Students engage in collaborative inquiry and solve problems. They conduct hands-on investigations to gather evidence to test ideas. They design and produce things. They develop capabilities, knowledge and positive science and technology dispositions.”
The description was developed based on the Quality learning and teaching in primary science and technology literature review and from exemplary practices that were observed and reported in the Case study report: Quality learning and teaching in primary science and technology.
In addition, the choice experiment was preceded by a series of screens used to prime teachers to think about science and technology teaching in an everyday context. This was motivated by research examining priming, such as that of Trope and Liberman (2010). The authors suggested that decision makers may respond
THE SURVEY INSTRUMENT AND DCE TASK
Figure 1: Setting the Context for a Primary Science and Technology Lesson

Supporting the Effective Teaching of Primary Science and Technology10
Physical World unit. Following this, teachers completed the tasks relating to the choice experiment.
The choice experiment involved respondents evaluating three hypothetical schools. Each school was described by nine factors (attributes), such as the people teachers would have opportunities to undertake planning activities with, space to store materials, and the timetabling of the science and technology lessons. These attributes and levels are listed in Table 1.
Teachers were then asked to think about how they would develop and teach a unit on the Physical World using a similar approach to the Teddy Bear lesson sequence. In particular, they were asked to consider a scenario in which students would learn about everyday situations including how friction affects the movement of objects on different surfaces. Teachers were then asked to consider three different schools, and based upon the description of each of these schools, to choose the one where they would most prefer to teach the
Attribute 1: Time allocated to plan
1.2.3.4.5.
On your ownWith other year level teachersWith other year level teachers and curriculum coordinatorWith year level teachers and education consultantWith teachers in the same stage
Attribute 2: Coming up with ideas
1.2.3.4.5.6.
By yourselfBrainstorming with another teacherUsing web based resources not linked to Australian curriculum (for example, NASA)Using web based resources clearly linked to the curriculumObservation of colleagues giving same lesson during your face-to-face reliefA physical resource (for example, Science in a Box)
Attribute 3: Discussing the ideas
1.2.3.4.5.6.
No additional discussionInformal face-to-face discussions with colleaguesFace-to-face just-in-time support from an expert on staffJust-in-time support from an expert via a science and technology teacher helpline (phone)Support via a social media platform for science and technology teachersOnline support from an science and technology discussion forum
Attribute 4: Facilities in the classroom
1.2.3.4.5.6.
No special area set aside for science and technologyA portable heat sourceA wet areaEasily movable furnitureA purpose built for science and technologyShared access to a purpose built science and technology room
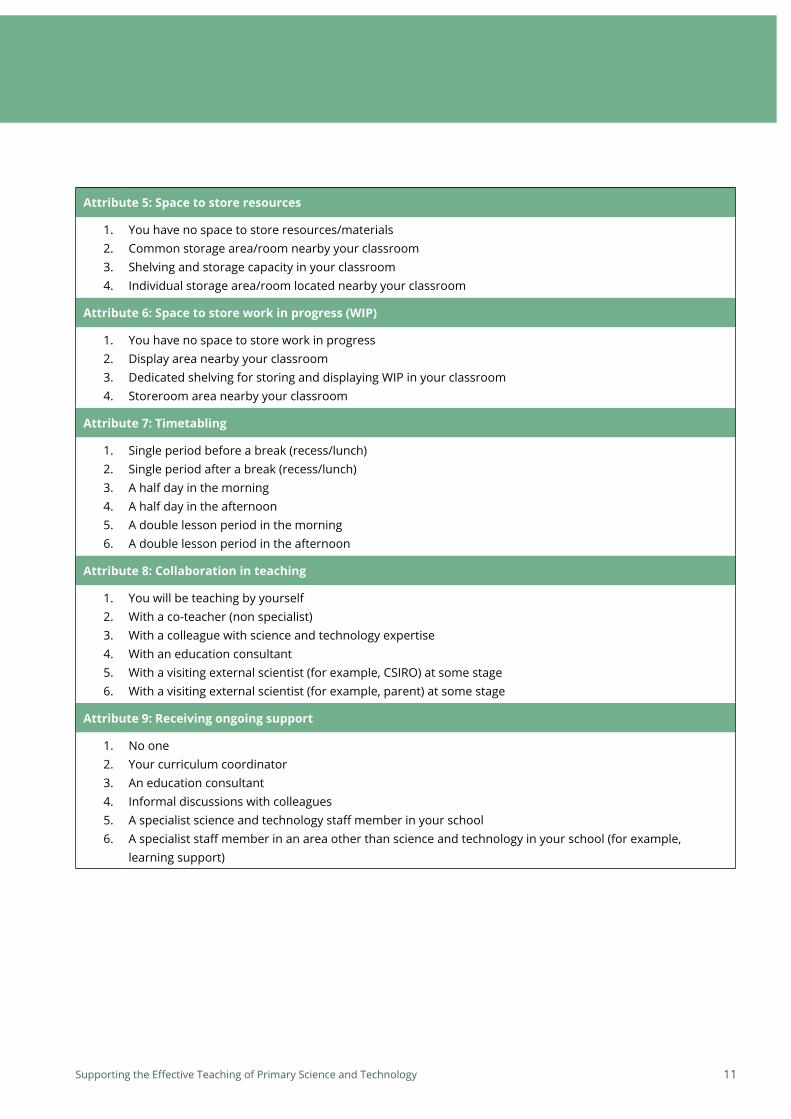
Table 1: Attributes and Levels Used in Choice Experiment
Supporting the Effective Teaching of Primary Science and Technology 11
Attribute 5: Space to store resources
1.2.3.4.
You have no space to store resources/materialsCommon storage area/room nearby your classroomShelving and storage capacity in your classroomIndividual storage area/room located nearby your classroom
Attribute 6: Space to store work in progress (WIP)
1.2.3.4.
You have no space to store work in progressDisplay area nearby your classroomDedicated shelving for storing and displaying WIP in your classroomStoreroom area nearby your classroom
Attribute 7: Timetabling
1.2.3.4.5.6.
Single period before a break (recess/lunch)Single period after a break (recess/lunch)A half day in the morningA half day in the afternoonA double lesson period in the morningA double lesson period in the afternoon
Attribute 8: Collaboration in teaching
1.2.3.4.5.6.
You will be teaching by yourselfWith a co-teacher (non specialist)With a colleague with science and technology expertiseWith an education consultantWith a visiting external scientist (for example, CSIRO) at some stageWith a visiting external scientist (for example, parent) at some stage
Attribute 9: Receiving ongoing support
1.2.3.4.5.6.
No oneYour curriculum coordinatorAn education consultantInformal discussions with colleaguesA specialist science and technology staff member in your schoolA specialist staff member in an area other than science and technology in your school (for example, learning support)

Supporting the Effective Teaching of Primary Science and Technology12
Figure 2: Example of the DCE Task
Participating teachers were asked to indicate their most and least preferred school setting out of the ones shown to them. After indicating which one they would most like to work at in order to teach science and technology effectively, teachers were moved to a new screen with an updated set of three choice alternatives (namely, a choice set). In total, each participating teacher completed six choice tasks (see Figure 2 for an example).
In addition to the choice experiment, a number of questions were asked to filter respondents and learn more about their teaching environment and experiences. As a result, only teachers who had taught primary science and technology in the last five years
qualified to complete the survey. Teachers were also asked about a number of other aspects, including:
• the size, type and location of their school
• details about the classrooms in which they taught
• support and capabilities of the school in terms of supporting effective science and technology teaching
• whether they work full-time or part-time
• length of service
• year levels taught
• own efficacy and knowledge in teaching science and technology, along with demographic and education information.

Supporting the Effective Teaching of Primary Science and Technology 13
RESPONDENTS
Data Division, which was then sent to principals of independent schools in NSW. Principals were invited to forward participation details onto their primary teachers and leaders. Additional recruitment was undertaken via the AISNSW Twitter account.
A total of 432 teachers accessed the survey, with 378 qualifying based on screening questions. Of the 378 teachers who qualified, 260 completed the survey in full, resulting in a 69% rate of completion.
To qualify for the survey, respondents must have been teaching primary science and technology at a school located in New South Wales at any time within the last five years. This allowed the survey to be inclusive of teachers with relevant experience but who had subsequently moved into a different role (for example, principal). This approach was also inclusive of teachers no longer in the profession, or those currently on extended leave (for example, parental leave).
An email invitation was prepared by UTS researchers in conjunction with the AISNSW Research and

Supporting the Effective Teaching of Primary Science and Technology14
Figure 3: Location of School
Teachers undertaking the survey were all working in NSW independent schools. Among these, five per cent nominated that they were working in Independent Catholic schools. The majority of teachers were working in the capital city (57.3%), with the remaining teachers working in larger cities located on the coast (11.5%), in the country (13.8%), in a smaller coastal city/town (6.9%), or in a small country city/town (8.8%) (see Figure 3).
On average, schools had approximately 394 students enrolled, with a median enrolment between 300 and 400 students. The majority of teachers were working at co-educational schools (82%), with 12% of teachers working at single sex girls schools, and 7% at single sex boys schools.
SCHOOL CHARACTERISTICS AND CAPABILITIES
Figure 4: Number of Students at School
Capital city, 57.3%
Large coastal city/town, 11.5%
Large country city/town, 13.8%
Small coastal city/town, 6.9%
Small country city/town, 8.8%
Other, 1.5%
0% 5% 10% 15% 20% 25%
Fewer than 50 students
50 to 100 students
101 to 200 students
201 to 300 students
301 to 400 students
401 to 500 students
501 to 600 students
601 to 700 students
701 to 800 students
801 to 900 students
901 to 1000 students
More than 1000 students

Supporting the Effective Teaching of Primary Science and Technology 15
Respondents were asked a series of questions to provide a description regarding their school capabilities and teacher attitudes to the teaching of primary science and technology. Around two in three teachers worked at schools where they agreed that other teachers had positive attitudes to the teaching of this subject (67%). Whilst 60% of participating teachers agreed that their colleagues had a good understanding of the primary science and technology syllabus, fewer agreed that the same teachers had a sound level of knowledge to be effective teachers (50%), or the confidence and skills to teach in this area competently (52.7%).
PERCEPTIONS OF COLLEAGUES AND SCHOOL CAPABILITIES IN SCIENCE AND TECHNOLOGY TEACHING
Similarly, findings related to the perceived levels of support and capabilities of schools for teaching primary science and technology were mixed. Less than half of teachers agreed that the schools at which they taught were well resourced in this area (46%). Just over half agreed that their school placed an emphasis on primary science and technology (54%). On the other hand, 59% of teachers agreed that teachers at their school were given opportunities for professional learning in this area.
Figure 5: Perceived School Capabilities
8.1%
27.0%
17.7%
16.2%
17.7%
18.9%
26.9%
18.9%
13.9%
61.2%
24.6%
26.9%
23.8%
30.0%
29.6%
36.9%
19.2%
31.5%
26.2%
17.3%
67.3%
46.1%
58.5%
53.8%
52.7%
44.2%
53.8%
49.6%
60.0%
21.5%
0% 20% 40% 60% 80% 100%
Disagree Neutral Agree
Teachers in my school think technology in science and technology is only about ICT.
Teachers at my school have a good understanding of the primary science and technology syllabus.
Teachers at this school have a sound knowledge of strategiesknown to be effective for the teaching of science and technology.
Time is a major factor inhibiting primary scienceand technology program delivery at my school.Teachers at my school have a good background
knowledge in primary science and technology.
Teachers at my school have the confidence and skillsto teach primary science and technology competently.
My school places a strong emphasison primary science and technology.
Teachers at my school have the opportunity to receive ongoing professional learning in primary science and technology.
My school is well resourced for the teaching of primary science and technology.
Teachers at my school have a positive attitude tothe teaching of primary science and technology.

Supporting the Effective Teaching of Primary Science and Technology16
Generally primary science and technology classes had between 20 and 24 students (44%). Around a quarter (27%) of teachers taught between 25 and 29 students. Only three teachers had classes with fewer than 10 students, whilst 4% taught in rooms with 45 or more students (see Figure 6). On average, 100.2 minutes of school per week were devoted to teaching this subject.
Most teachers delivered science and technology classes without the help of colleagues (73%). Others had opportunities to co-teach with another primary teacher
CLASSROOM CHARACTERISTICS
(24%), a specialist science and technology teacher (5%), or with the support of a teacher’s aide (4%).
The overwhelming majority taught in rooms in which other subjects were taught (92%). A small number of rooms had areas set aside for science and technology (3.8%). Only 6% of teachers predominantly taught in a designated science and technology room. Seven per cent worked in schools which had separate areas for storing and preparing materials for teaching this subject.
Figure 6: Number of Students in Typical Primary Science and Technology Class
0% 5% 10% 15% 20% 25% 30% 35% 40% 45% 50%
Fewer than 10 students
10 to 14 students
15 to 19 students
20 to 24 students
25 to 29 students
30 to 34 students
35 to 39 students
40 to 44 students
45 or more students
Supporting the Effective Teaching of Primary Science and Technology 17
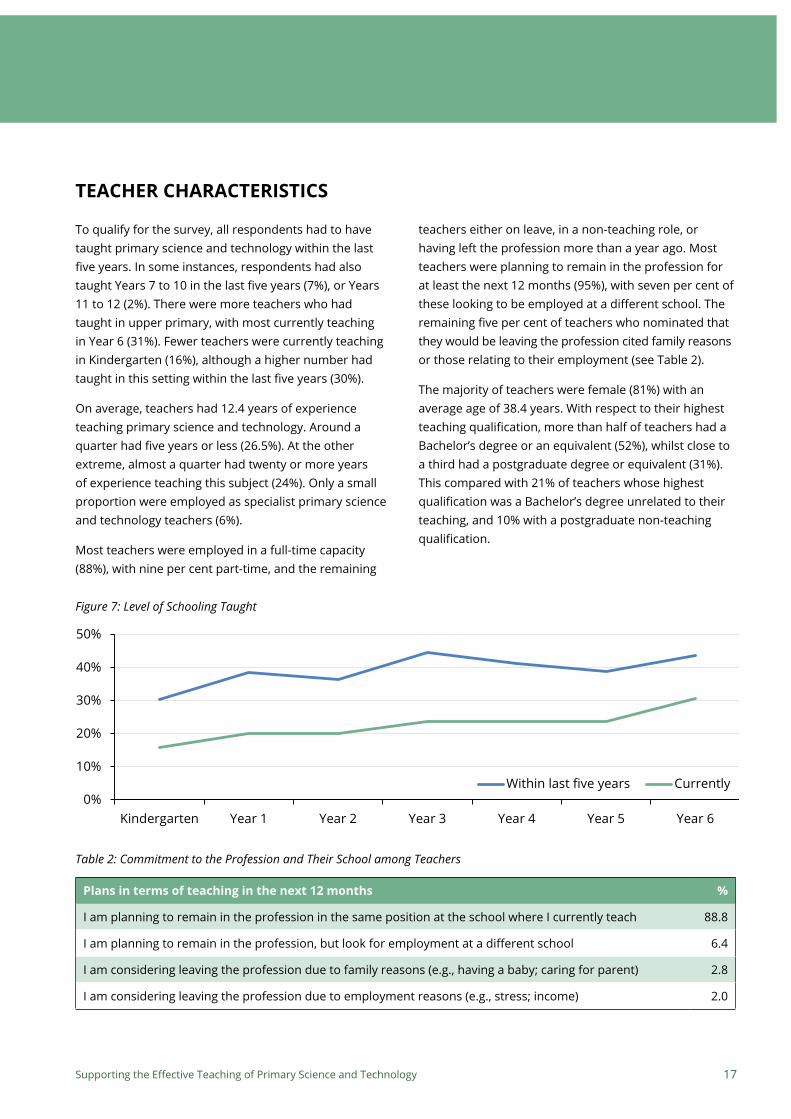
teachers either on leave, in a non-teaching role, or having left the profession more than a year ago. Most teachers were planning to remain in the profession for at least the next 12 months (95%), with seven per cent of these looking to be employed at a different school. The remaining five per cent of teachers who nominated that they would be leaving the profession cited family reasons or those relating to their employment (see Table 2).
The majority of teachers were female (81%) with an average age of 38.4 years. With respect to their highest teaching qualification, more than half of teachers had a Bachelor’s degree or an equivalent (52%), whilst close to a third had a postgraduate degree or equivalent (31%). This compared with 21% of teachers whose highest qualification was a Bachelor’s degree unrelated to their teaching, and 10% with a postgraduate non-teaching qualification.
To qualify for the survey, all respondents had to have taught primary science and technology within the last five years. In some instances, respondents had also taught Years 7 to 10 in the last five years (7%), or Years 11 to 12 (2%). There were more teachers who had taught in upper primary, with most currently teaching in Year 6 (31%). Fewer teachers were currently teaching in Kindergarten (16%), although a higher number had taught in this setting within the last five years (30%).
On average, teachers had 12.4 years of experience teaching primary science and technology. Around a quarter had five years or less (26.5%). At the other extreme, almost a quarter had twenty or more years of experience teaching this subject (24%). Only a small proportion were employed as specialist primary science and technology teachers (6%).
Most teachers were employed in a full-time capacity (88%), with nine per cent part-time, and the remaining
TEACHER CHARACTERISTICS
Plans in terms of teaching in the next 12 months %
I am planning to remain in the profession in the same position at the school where I currently teach 88.8
I am planning to remain in the profession, but look for employment at a different school 6.4
I am considering leaving the profession due to family reasons (e.g., having a baby; caring for parent) 2.8
I am considering leaving the profession due to employment reasons (e.g., stress; income) 2.0
Table 2: Commitment to the Profession and Their School among Teachers
Figure 7: Level of Schooling Taught
0%
10%
20%
30%
40%
50%
Kindergarten Year 1 Year 2 Year 3 Year 4 Year 5 Year 6
Within last five years Currently

Supporting the Effective Teaching of Primary Science and Technology18
Teachers were asked about the extent to which they were enthusiastic about teaching science and technology, and also about indicators of efficacy regarding the subject. Whilst the two components of the subject (science as separated from technology) are combined with respect to the syllabus, questions were broken down in terms of these two components to identify whether teachers perceived any differences in terms of their abilities or enthusiasm for each.
In general, the vast majority of teachers were enthusiastic about science and technology as subjects, with a slightly higher number of teachers agreeing on this being an accurate description of their attitudes.
Whilst 91% agreed that they enjoyed teaching science, 87% agreed this to be the case for teaching technology.
Whilst enthusiasm levels were relatively high, measures of confidence and knowledge scored slightly lower among participating teachers for both science and technology. Over 12% of teachers indicated that they did not agree they had sufficient knowledge of science to teach it well, whilst 13% indicated they were unable to deal with questions from students on the subject. Overall, 86% of teachers agreed that they had a sufficient command of the material to be able to support children well in investigating in science.
Figure 8: Enthusiasm and Enjoyment in Teaching Primary Science and Technology
TEACHER EFFICACY AND ATTITUDES TO PRIMARY SCIENCE AND TECHNOLOGY TEACHING
0 %
5 %
10 %
15 %
20 %
25 %
30 %
35 %
40 %
Totallydisagree
2 3 4 5 6 7 8 9 Totallyagree
I am enthusiastic about the subject of science (93.4% agree).
I find science exciting and try to convey my enthusiasm to the students (93.7% agree).
I teach science with great enthusiasm (96.1% agree).
I really enjoy teaching science (91.1% agree).
I am enthusiastic about the subject of technology (89.6% agree).
I find technology exciting and try to convey my enthusiasm to the students (89.2% agree).
I teach technology with great enthusiasm (90.2% agree).
I really enjoy teaching technology (86.6% agree).

Supporting the Effective Teaching of Primary Science and Technology 19
Figure 9: Confidence and Knowledge in Primary Science and Technology among Teachers
The differences in command of the material across teachers were more pronounced in relation to technology. Specifically, 18% felt that they did not have enough knowledge of technology to teach the subject well. One in five teachers (20%) disagreed that they were able to deal with questions from students, and the same number of teachers indicated that they did not have a sufficient command of the field to be able to support children well in designing and making. In general, it appears that levels of confidence in teaching technology are lower relative to that of science.
With respect to effective teaching, 97% agreed that they attempted to teach science and technology well. About 93% agreed that their actual teaching outcome resembled the survey’s description of effective teaching. A similar number agreed that they were effective science and technology teachers (91.5%). Around 8.5% of teachers did not agree that they were effective in teaching this subject.
0%
5%
10%
15%
20%
25%
30%
Totallydisagree
2 3 4 5 6 7 8 9 Totallyagree
I have enough knowledge of the concepts of science to teach these subjects well in primary school (87.6% agree).
I am well able to deal with questions from students about science (86.9% agree).
I have a sufficient command of the material to be able to support children well in investigating (86.1% agree).
I have enough knowledge of the concepts of technology to teach these subjects well in primary school (81.8% agree).
I am well able to deal with questions from students about technology (80.0% agree).
I have a sufficient command of the material to be able to support children well in designing and making (78.5% agree).
Figure 10: Perceived Effectiveness in Teaching Primary Science and Technology
14.6 %
21.9 %
27.7 %
38.8 %
45.8 %
43.8 %
43.8 %
25.0 %
20.0 %
Strongly disagree Moderately disagree Slightly disagree Slightly agree Moderately agree Strongly agree
I would describe myself as an effective science and technology teacher (91.5%).
In general, my teaching of science and technology often looks similar to the description (92.7% agree).
In general, I try as much as possible to teach science and technology as it has been described above (97.2% agree).
I would describe myself as an effective science and technology teacher (91.5%).
In general, my teaching of science and technology often looks similar to the description (92.7% agree).
In general, I try as much as possible to teach science and technology as it has been described above (97.2% agree). 14.6 %
21.9 %
27.7 %
38.8 %
45.8 %
43.8 %
43.8 %
25.0 %
20.0 %
Strongly disagree Moderately disagree Slightly disagree Slightly agree Moderately agree Strongly agree
I would describe myself as an effective science and technology teacher (91.5%).
In general, my teaching of science and technology often looks similar to the description (92.7% agree).
In general, I try as much as possible to teach science and technology as it has been described above (97.2% agree).
Supporting the Effective Teaching of Primary Science and Technology20
DISCRETE CHOICE EXPERIMENT RESULTS
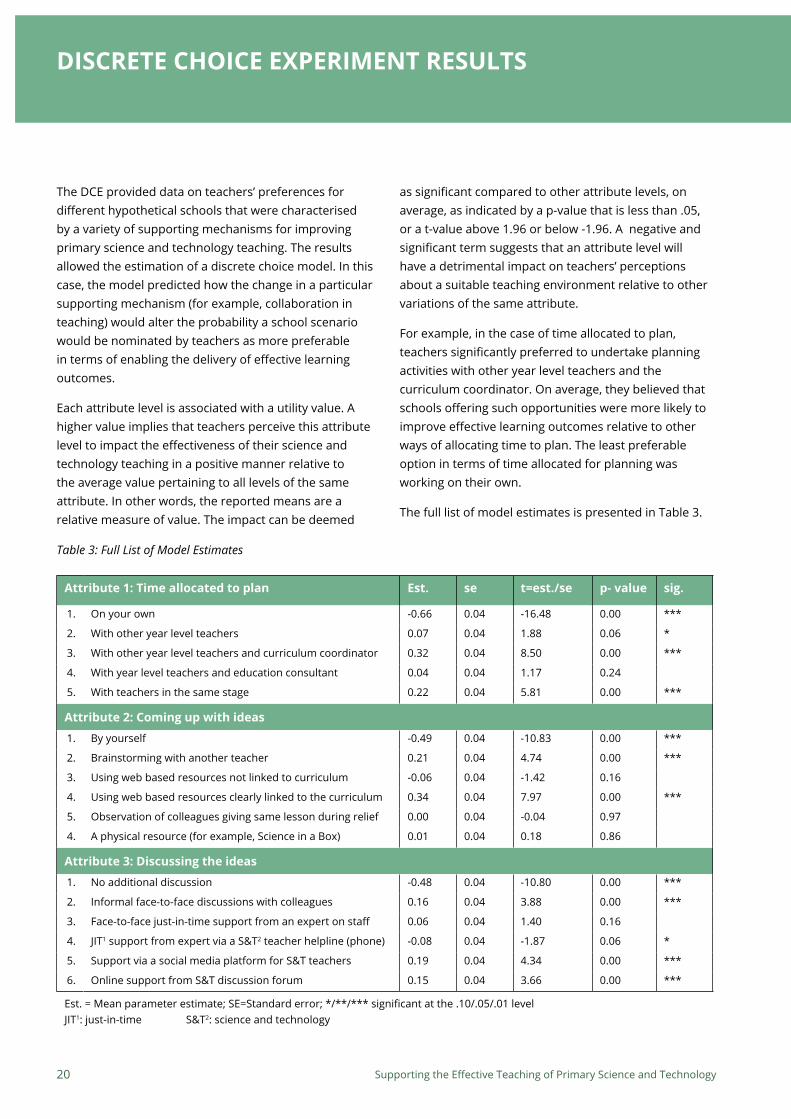
as significant compared to other attribute levels, on average, as indicated by a p-value that is less than .05, or a t-value above 1.96 or below -1.96. A negative and significant term suggests that an attribute level will have a detrimental impact on teachers’ perceptions about a suitable teaching environment relative to other variations of the same attribute.
For example, in the case of time allocated to plan, teachers significantly preferred to undertake planning activities with other year level teachers and the curriculum coordinator. On average, they believed that schools offering such opportunities were more likely to improve effective learning outcomes relative to other ways of allocating time to plan. The least preferable option in terms of time allocated for planning was working on their own.
The full list of model estimates is presented in Table 3.
The DCE provided data on teachers’ preferences for different hypothetical schools that were characterised by a variety of supporting mechanisms for improving primary science and technology teaching. The results allowed the estimation of a discrete choice model. In this case, the model predicted how the change in a particular supporting mechanism (for example, collaboration in teaching) would alter the probability a school scenario would be nominated by teachers as more preferable in terms of enabling the delivery of effective learning outcomes.
Each attribute level is associated with a utility value. A higher value implies that teachers perceive this attribute level to impact the effectiveness of their science and technology teaching in a positive manner relative to the average value pertaining to all levels of the same attribute. In other words, the reported means are a relative measure of value. The impact can be deemed
Attribute 1: Time allocated to plan Est. se t=est./se p- value sig.
1. On your own -0.66 0.04 -16.48 0.00 ***
2. With other year level teachers 0.07 0.04 1.88 0.06 *
3. With other year level teachers and curriculum coordinator 0.32 0.04 8.50 0.00 ***
4. With year level teachers and education consultant 0.04 0.04 1.17 0.24
5. With teachers in the same stage 0.22 0.04 5.81 0.00 ***
Attribute 2: Coming up with ideas
1. By yourself -0.49 0.04 -10.83 0.00 ***
2. Brainstorming with another teacher 0.21 0.04 4.74 0.00 ***
3. Using web based resources not linked to curriculum -0.06 0.04 -1.42 0.16
4. Using web based resources clearly linked to the curriculum 0.34 0.04 7.97 0.00 ***
5. Observation of colleagues giving same lesson during relief 0.00 0.04 -0.04 0.97
4. A physical resource (for example, Science in a Box) 0.01 0.04 0.18 0.86
Attribute 3: Discussing the ideas
1. No additional discussion -0.48 0.04 -10.80 0.00 ***
2. Informal face-to-face discussions with colleagues 0.16 0.04 3.88 0.00 ***
3. Face-to-face just-in-time support from an expert on staff 0.06 0.04 1.40 0.16
4. JIT1 support from expert via a S&T2 teacher helpline (phone) -0.08 0.04 -1.87 0.06 *
5. Support via a social media platform for S&T teachers 0.19 0.04 4.34 0.00 ***
6. Online support from S&T discussion forum 0.15 0.04 3.66 0.00 ***
Est. = Mean parameter estimate; SE=Standard error; */**/*** significant at the .10/.05/.01 levelJIT1: just-in-time S&T2: science and technology
Table 3: Full List of Model Estimates

Supporting the Effective Teaching of Primary Science and Technology 21
Attribute 4: Facilities in the classroom Est. se t=est./se p- value sig.
1. No special area set aside for science and technology -0.43 0.04 -9.68 0.00 ***
2. A portable heat source -0.22 0.04 -5.02 0.00 ***
3. A wet area -0.02 0.04 -0.45 0.65
4. Easily movable furniture 0.17 0.04 3.90 0.00 ***
5. A purpose built area for science and technology 0.28 0.04 6.91 0.00 ***
6. Shared access to a purpose built S&T room 0.21 0.04 5.12 0.00 ***
Attribute 5: Space to store resources
1. You have no space to store resources/materials -0.29 0.03 -8.42 0.00 ***
2. Common storage area/room nearby your classroom 0.06 0.03 1.93 0.05 *
3. Shelving and storage capacity in your classroom 0.14 0.03 4.09 0.00 ***
4. Individual storage area/room located nearby your classroom 0.09 0.03 2.59 0.01 ***
Attribute 6: Space to store work in progress (WIP)
1. You have no space to store work in progress -0.33 0.03 -9.66 0.00 ***
2. Display area nearby your classroom 0.07 0.03 2.17 0.03 **
3. Dedicated shelving for storing /displaying WIP in classroom 0.20 0.03 5.90 0.00 ***
4. Storeroom area nearby your classroom 0.06 0.03 1.96 0.05 *
Attribute 7: Timetabling
1. Single period before a break (recess/lunch) -0.39 0.04 -8.69 0.00 ***
2. Single period after a break (recess/lunch) -0.33 0.04 -7.53 0.00 ***
3. A half day in the morning -0.02 0.04 -0.42 0.67
4. A half day in the afternoon 0.26 0.04 6.42 0.00 ***
5. A double lesson period in the morning 0.11 0.04 2.41 0.02 **
6. A double lesson period in the afternoon 0.36 0.04 8.51 0.00 ***
Attribute 8: Collaboration in teaching
1. You will be teaching by yourself -0.26 0.04 -6.01 0.00 ***
2. With a co-teacher (non specialist) -0.06 0.04 -1.39 0.17
3. With a colleague with science and technology expertise 0.08 0.04 1.91 0.06 *
4. With an education consultant 0.03 0.04 0.60 0.55
5. With a visiting external scientist (for example, CSIRO) at some stage
0.18 0.04 4.20 0.00 ***
6. With a visiting external scientist (for example, parent) at some stage
0.03 0.04 0.82 0.41
Attribute 9: Receiving ongoing support
1. No one -0.70 0.05 -14.69 0.00 ***
2. Your curriculum coordinator 0.26 0.04 6.08 0.00 ***
3. An education consultant 0.05 0.04 1.17 0.24
4. Informal discussions with colleagues 0.03 0.04 0.60 0.55
5. Specialist S&T staff member in your school 0.35 0.04 8.23 0.00 ***
6. A specialist staff member not in S&T (for example, learning support)
0.01 0.04 0.21 0.83
Est. = Mean parameter estimate; SE=Standard error; */**/*** significant at the .10/.05/.01 level

Supporting the Effective Teaching of Primary Science and Technology22
have opportunities to work with someone else or a set of individuals (attribute 1). In contrast, teachers’ decisions were least affected by opportunities for variation in collaborative teaching in the classroom (attribute 8). However, variation in this attribute still had a significant impact on teachers’ preferences as can be seen by a preference for working with an external scientist (for example, from CSIRO) at some stage relative to other collaborative opportunities. The results pertaining to each attribute are now reviewed in more detail.
Each attribute can be considered in terms of its contribution to changing teachers’ choices. That is, an entire attribute can be considered in terms of the manner by which it explains teachers’ choices in the DCE relative to when it is excluded from the predictive choice model. Figure 11 shows this in percentage terms for each attribute relative to each of the nine attributes overall. It suggests that teachers’ decision-making was largely explained by changes in options presented, in terms of whether a teacher would plan on their own or
Figure 11: Relative Importance of Each Attribute in DCE in Percentage Terms
0 5 10 15 20 25
Att1 - Time allocated to plan
Att9 - Receiving ongoing support
Att7 - Timetabling
Att2 - Coming up with ideas
Att4 - Classroom facilities
Att6 - Space to store work in progress
Att3 - Discussing the ideas
Att5 - Space to store resources
Att8 - Collaboration in teaching

Supporting the Effective Teaching of Primary Science and Technology 23
7.97
4.74
0.18
-0.04-1.42
-10.83
-15
-10
-5
0
5
10
15
8.55.81
1.88 1.17
-16.48-20
-15
-10
-5
0
5
10
15
20
Time allocated to plan was one of the most important considerations among teachers in terms of preferences for selecting schools for effective teaching. Planning activities undertaken in isolation was least preferred while collaborative planning involving other year level
teachers and the curriculum coordinator was highly sought after. Within this combination, the curriculum coordinator was significantly valued relative to occasions where collaboration occurred only with other year level teachers.
TIME ALLOCATED TO PLAN FOR SCIENCE AND TECHNOLOGY
Figure 12: Impact of Collaboration in Time Allocated to Plan
Note: */**/*** significant at .10/.05/.01 level.
Time allocated to plan the science and technology program
t-st
atis
tic
Findings of the BWS indicated that coming up with ideas was a source of concern among teachers in terms of realising effective teaching. Results of the DCE confirmed this: teachers valued online materials, but in particular, those that were related to the curriculum were of
COMING UP WITH IDEAS FOR THE SEQUENCE OF LESSONS
significant value. Brainstorming with other teachers was also a favoured method for generating ideas for lesson sequences. This was valued more than simply observing another teacher teach a similar lesson.
With other year level teachers
and curriculum coordinator***
With teachers in the same stage***
With other year level teachers*
With year level teachers and
education consultant
On your own***
Figure 13: Impact of Strategies for Idea Generation in Sequence of Lessons
Note: */**/*** significant at .10/.05/.01 level.
Coming up with ideas for the sequence of lesson
t-st
atis
tic
Using web based resources clearly
linked to the curriculum***
Brainstorming with another teacher***
A physical resource (for
example, Science in a Box)
Observation of colleagues giving
same lesson during your face-
to-face relief
By yourself***
Using web based resources
not linked to Australian
curriculum (for example, NASA)

Supporting the Effective Teaching of Primary Science and Technology24
4.34 3.88 3.661.4
-1.87
-10.8-15
-10
-5
0
5
10
15
The DCE task also asked teachers to consider supportive environments in terms of opportunities to discuss ideas for the lesson sequence. This was slightly different to coming up with ideas, where an idea may come from any source (and therefore, might not be clearly connected to the curriculum). Instead, teachers often sought input into the suitability or enactment of the idea in practice. Responses indicated that environments with isolated approaches to discussing ideas were significantly opposed. However, the effect was not as strong as those relating to isolation in planning.
There was a clear preference for undertaking discussions in various forums. In particular, online support in the form of social media was valued, including such support where the platform involved other science and technology teachers. Informal face-to-face discussions with colleagues were equally valued alongside online forums. This result differed slightly from the effects observed in relation to sourcing ideas. A suggestion for a science and technology telephone helpline was valued more than environments with no opportunities for discussions, but as a concept, it was an initiative of significantly less value relative to other forms of discussion.
DISCUSSING IDEAS FOR THE LESSON SEQUENCE
Figure 14: Discussing Ideas for the Lesson Sequence
Note: */**/*** significant at .10/.05/.01 level.
t-st
atis
tic
The research revealed a clear distinction in terms of how teachers wished to be supported inside and outside of the classroom. In the DCE, the absence of support occurring when teachers worked by themselves was less concerning to them than any other attribute considered. For many teachers, planning activities, the sourcing of ideas, and the discussion of ideas were invaluable, yet many others expressed a relatively strong reluctance
COLLABORATION IN TEACHING
to collaborate with a co-teacher (non-specialist) in their teaching. As such, relative to other attributes, teachers were found to be less attracted to opportunities to improve their teaching through collaboration with others whether this be with a visitor or colleague. This attribute was the least important in terms of impacting teacher’s decisions about their most preferred environment.
Support via a social media platform for science and
technology teachers***
Informal face-to-face discussions
with colleagues***
Online support from a science and technology
discussion forum***
Face-to face just-in-time
support from an expert on
staff
No additional discussion***
Just-in-time support from an expert via a science and
technology teacher helpline
(phone)*

Supporting the Effective Teaching of Primary Science and Technology 25
8.236.08
1.17 0.6 0.21
-14.69-20
-15
-10
-5
0
5
10
15
20
4.21.91
0.82 0.6
-1.39
-6.01
-10
-5
0
5
10
Figure 15: Collaboration in Teaching
Note: */**/*** significant at .10/.05/.01 level.
t-st
atis
tic
With a visiting external scientist
(for example, CSIRO) at some
stage***
With a colleague with science
and technology expertise*
With a visiting external scientist
(for example, parent) at some
stage
With an education consultant
You will be teaching by yourself***With a co-teacher
(non specialist)
SUPPORTIVE FEEDBACK ON PLANNING
Whilst many teachers discussed the value of planning and idea generation, many others also expressed the desire to know via ongoing feedback whether practices they adopted were being implemented effectively or improved upon. In this regard, the DCE sought to understand the value that teachers placed on ongoing supportive feedback relative to other forms of support. The DCE revealed this to be the second most important attribute in terms of how variation in this attribute affected teachers’ preferences. Again, this was largely driven by a preference away from receiving no ongoing supportive feedback. However, the effect was also
driven by a strong preference to receive feedback from a specialist science and technology staff member at the teacher’s school relative to feedback from other individuals. Likewise, the curriculum coordinator was also seen as an invaluable individual who could be utilised to support effective teaching by providing meaningful feedback to teachers. As such, whilst teachers did suggest that anyone offering supportive feedback would be valued more than receiving no feedback at all, there was a clear distinction between the source of feedback.
Figure 16: Supportive Feedback
Note: */**/*** significant at .10/.05/.01 level.
Receiving ongoing supportive feedback on your planning from...
t-st
atis
tic
A specialist science and technology staff member in your school***
Your curriculum coordinator***
An education consultant
Informal discussions
with colleagues
No one***A specialist staff member
in an area other then science
and technology in your school (for example,
learning support)

Supporting the Effective Teaching of Primary Science and Technology26
6.915.12
3.9
-0.45
-5.02
-9.68-10-8-6-4-202468
10
In the BWS, physical layout and flexibility of classrooms for teaching science and technology were found to be an important consideration among teachers in posing barriers to effective teaching. The DCE sought to determine whether certain elements of classroom facilities would be viewed as more valuable in terms of enabling effective teaching. Findings indicated a preference for some form of area designated for science and technology teaching. Whilst a purpose built area or room was valued, teachers suggested flexibility in
CLASSROOM FACILITIES AND SPECIAL AREAS FOR SCIENCE AND TECHNOLOGY
classroom spaces (for example, easily movable furniture) as a viable way to create spaces to teach effectively. Teachers in previous discussions had suggested a source of water for cleaning and conducting activities was valuable, especially if this was conveniently located in the classroom. Teachers had also suggested that a portable heat source was important in many activities. The DCE, however, indicated that teachers placed significantly greater value on a wet area over that of a portable heat source.
Figure 17: Classroom Facilities and Areas for Science and Technology Teaching
Note: */**/*** significant at .10/.05/.01 level.
Your new classroom has...
t-st
atis
tic
A purpose built area for science
and technology***
Shared access to a purpose built science
and technology room***
Easily movable furniture***
A wet area No special area set aside for science and
technology***
A portable heat source***
Supporting the Effective Teaching of Primary Science and Technology 27
5.9
2.17 1.96
-9.66-10
-8
-6
-4
-2
0
2
4
6
8
10
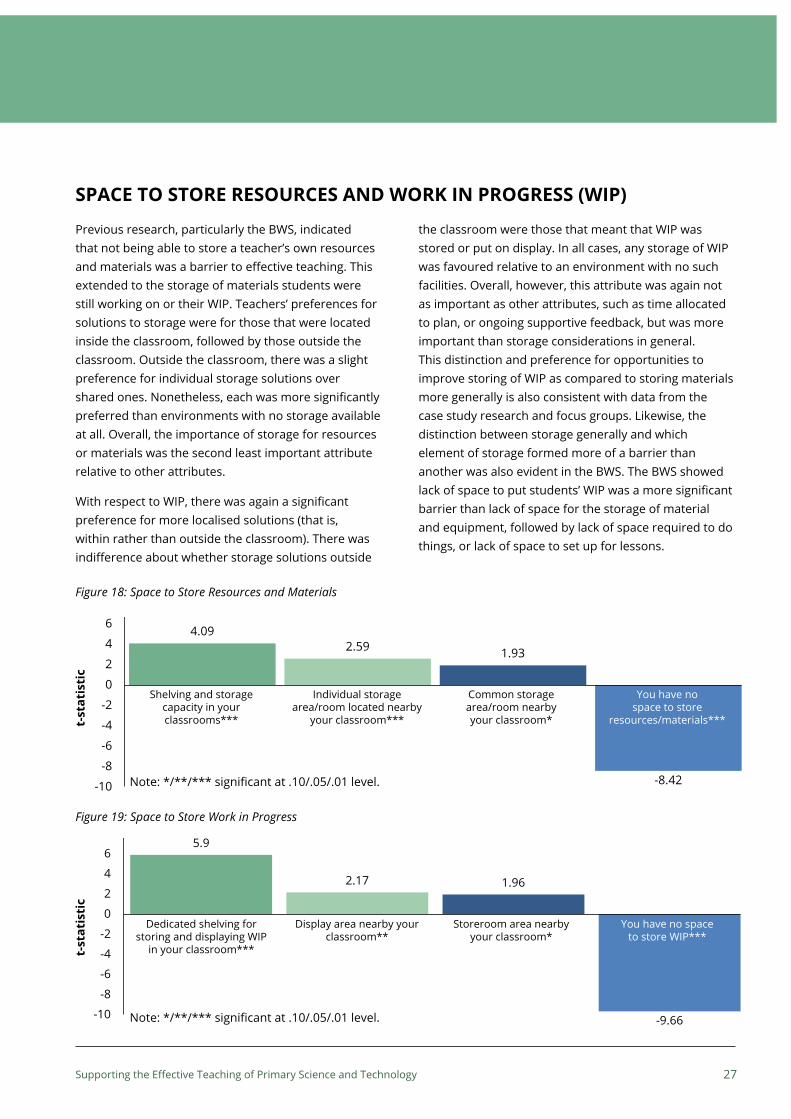
Previous research, particularly the BWS, indicated that not being able to store a teacher’s own resources and materials was a barrier to effective teaching. This extended to the storage of materials students were still working on or their WIP. Teachers’ preferences for solutions to storage were for those that were located inside the classroom, followed by those outside the classroom. Outside the classroom, there was a slight preference for individual storage solutions over shared ones. Nonetheless, each was more significantly preferred than environments with no storage available at all. Overall, the importance of storage for resources or materials was the second least important attribute relative to other attributes.
With respect to WIP, there was again a significant preference for more localised solutions (that is, within rather than outside the classroom). There was indifference about whether storage solutions outside
SPACE TO STORE RESOURCES AND WORK IN PROGRESS (WIP)
the classroom were those that meant that WIP was stored or put on display. In all cases, any storage of WIP was favoured relative to an environment with no such facilities. Overall, however, this attribute was again not as important as other attributes, such as time allocated to plan, or ongoing supportive feedback, but was more important than storage considerations in general. This distinction and preference for opportunities to improve storing of WIP as compared to storing materials more generally is also consistent with data from the case study research and focus groups. Likewise, the distinction between storage generally and which element of storage formed more of a barrier than another was also evident in the BWS. The BWS showed lack of space to put students’ WIP was a more significant barrier than lack of space for the storage of material and equipment, followed by lack of space required to do things, or lack of space to set up for lessons.
4.092.59 1.93
-8.42-10
-8
-6
-4
-2
0
2
4
6
8
10Figure 18: Space to Store Resources and Materials
Note: */**/*** significant at .10/.05/.01 level.
t-st
atis
tic
Shelving and storage capacity in your classrooms***
Individual storage area/room located nearby
your classroom***
Common storage area/room nearby your classroom*
You have no space to store
resources/materials***
Figure 19: Space to Store Work in Progress
Note: */**/*** significant at .10/.05/.01 level.
t-st
atis
tic
Dedicated shelving for storing and displaying WIP
in your classroom***
Display area nearby your classroom**
Storeroom area nearby your classroom*
You have no space to store WIP***

Supporting the Effective Teaching of Primary Science and Technology28
Time to conduct science and technology activities emerged as a barrier to effective teaching during the case study research and focus groups. This was later confirmed in the BWS which quantified that teachers had particular concerns about time in the classroom. Teachers suggested that the timetable was too fragmented (teaching blocks were too short), that it was difficult for them to fit science and technology in with everything else that needed to be taught, and that other subjects had to be prioritised.
It was suggested that these concerns might potentially be mitigated by how time is arranged in the school setting more generally, with reference to the disruption caused by timetabling and inadequate blocking. The DCE sought to investigate whether solutions related to timetabling were valued among teachers relative to preferences for solutions in other areas. Findings of the DCE revealed that teachers preferred environments
where extended blocks in the timetable were provided. There was also a preference to teach science and technology in the afternoon rather than the morning. Anecdotally, teachers reported this preference because students are more responsive and attentive in the morning, so this time is better suited to other prioritised subject areas, such as maths and English. Some teachers also suggested that the lunch period provides greater opportunity to prepare for a science and technology lesson relative to time during recess or before school.
In any case, the overall impact of changes in the timetable represented the third strongest effect in terms of altering preferences for an effective teaching environment. The previous results relating to concerns around storing WIP may also be mitigated by a more continuous schedule, particularly in settings where classrooms are shared.
TIMETABLING SCIENCE AND TECHNOLOGY
8.51
6.42
2.41
-0.42
-7.53-8.69-10
-8
-6
-4
-2
0
2
4
6
8
10
Figure 20: Timetabling for Science and Technology
Note: */**/*** significant at .10/.05/.01 level.
t-st
atis
tic
A double lesson period in the afternoon***
A half day in the afternoon***
A double lesson period in the morning**
A half day in the morning
Single period after a break (recess/
lunch)***
Single period before a break
(recess/lunch)***

Supporting the Effective Teaching of Primary Science and Technology 29
ACCOUNTING FOR DIFFERENCES IN TEACHERS: LATENT CLASS ANALYSIS
As with any evaluation, individuals can differ with respect to what they prefer relative to another individual. In the current context, it was anticipated that teachers would differ in terms of their level of agreement about what constitutes a suitable supportive environment for their effective teaching. A latent class analysis was used to identify different segments of teachers who share similar views to each other, but significantly differ from other segments identifiable in the data. The latent class analysis identified three such segments, including groups of teachers who were either seeking:
1. collaboration (representing 43% of teachers)
2. external support and shared resourcing (approximately 37% of teachers)
3. curriculum-linked web based resources and flexible classroom solutions (around 21% of teachers) .
These differences are now discussed with reference to three areas, namely collaboration, classroom facilities, and timetabling.
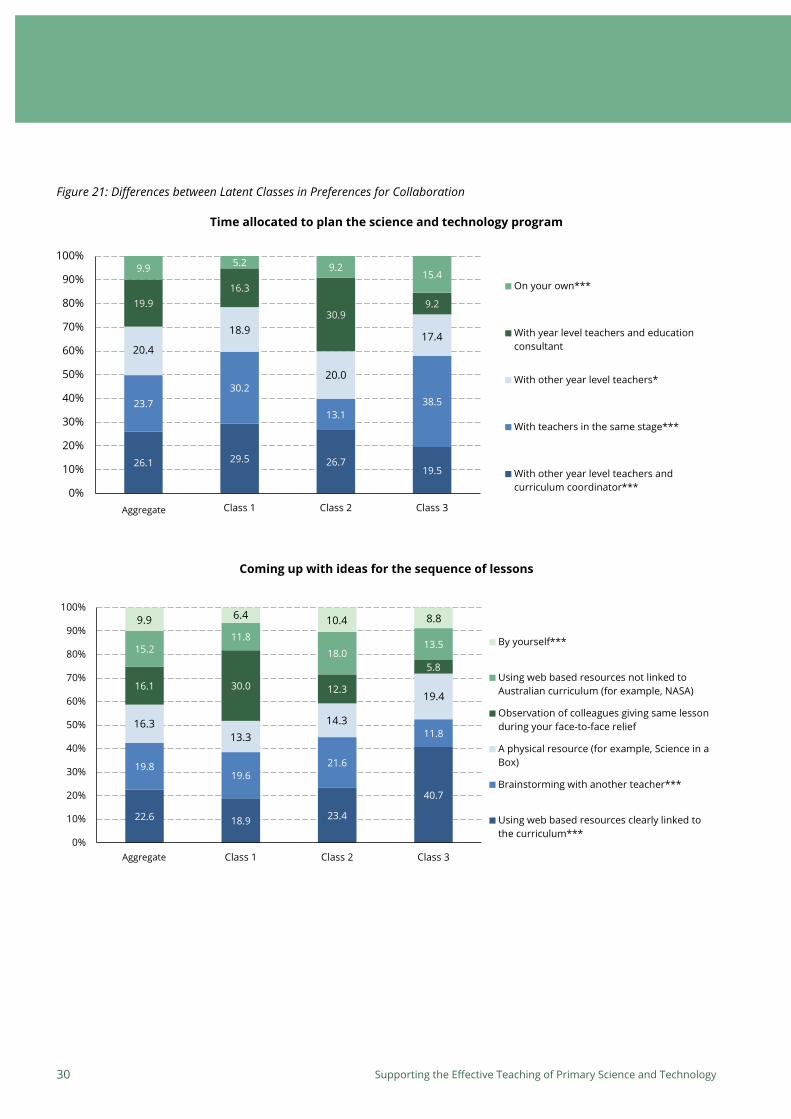
DIFFERENCES IN PREFERENCES FOR COLLABORATION
Some segments of teachers were unique in the extent to which they consistently sought environments involving collaboration with other teachers in activities such as planning, idea generation, support and teaching. This was particularly true for segment 1 and somewhat true for segment 2. Whilst all teachers preferred environments where they did not have to work in isolation, segment 3 appeared to be relatively less concerned about having time to plan on their own, to teach on their own, or to receive ongoing support.
The results can be considered in terms of the predicted marginal probabilities associated with each attribute level and the differences observed across the three segments. For example, in the case of time allocated to
plan science and technology programs, teachers were asked to consider five different aspects of the proposed school environments. Therefore, the propensity to randomly select a school with any one level would be one in five or 20%. If all five of these predicted marginal probabilities are close to 20%, it implies that variation in the attribute was entirely ignored by respondents and not very salient as a factor in their choices. However, if the predicted marginal probabilities of any one type of support is higher than 20%, it suggests that schools with this type of support would be more likely to be chosen relative to teachers choosing schools randomly. Likewise, a marginal probability for an attribute level that is significantly lower than 20% indicates that teachers would be significantly less likely to choose a school offering this type of support, all else being equal.
In the case of time allocated to plan, the value that was placed on working with other year level teachers and curriculum coordinators suggested that schools offering this type of support relative to any of the other four levels was significantly more likely to be selected. When schools offer an environment where teachers must work on their own to plan science and technology programs, the probability of teachers choosing such a school falls. The results relating to time allocated to plan show that the predicted probability of teachers who selected schools in which they would have to work on their own was much lower amongst those in segments 1 and 2, and relatively higher amongst those in segment 3. The source of collaboration for segment 2, however, was skewed higher towards working with year level teachers and an education consultant. This preference among teachers in segment 2 for working with an education consultant was identifiable with respect to time allocated for planning, as well as collaboration in teaching and receiving ongoing feedback for planning. Such a preference was in contrast to those teachers in segment 3 who were consistently less open to the presence of an education consultant and who were much less likely to welcome observations from colleagues while teaching.
Supporting the Effective Teaching of Primary Science and Technology30
Figure 21: Differences between Latent Classes in Preferences for Collaboration
26.1 29.5 26.719.5
23.730.2
13.138.5
19.916.3
30.99.2
9.9 5.2 9.215.4
0%
10%
20%
30%
40%
50%
60%
70%
80%
90%
100%
Agg Class 1 Class 2 Class 3
On your own***
With year level teachers and educationconsultant
With other year level teachers*
With teachers in the same stage***
With other year level teachers andcurriculum coordinator***
Time allocated to plan the science and technology program
20.4
18.9
20.0
17.4
Aggregate
22.6 18.9 23.4
40.7
19.819.6
21.6
11.8
16.1 30.0 12.3
5.8
15.211.8
18.013.5
0%
10%
20%
30%
40%
50%
60%
70%
80%
90%
100%
Agg Class 1 Class 2 Class 3
Coming up with ideas for the sequence of lessons
By yourself***
Using web based resources not linked toAustralian curriculum (for example, NASA)
Observation of colleagues giving same lessonduring your face-to-face relief
A physical resource (for example, Science in aBox)
Brainstorming with another teacher***
Using web based resources clearly linked tothe curriculum***
Coming up with ideas for the sequence of lessons
16.313.3
14.3
19.4
9.9 6.4 10.4 8.8
Aggregate

Supporting the Effective Teaching of Primary Science and Technology 31
Figure 21: continued
19.6 17.3 18.428.5
19.215.4
24.916.5
17.325.4
10.7 14.6
15.011.0
18.2 19.2
0%
10%
20%
30%
40%
50%
60%
70%
80%
90%
100%
Agg Class 1 Class 2 Class 3
No additional discussion***
Just-in-time support from an expert via ascience and technology teacher helpline(phone)*Face-to-face just-in-time support from anexpert on staff
Online support from a science andtechnology discussion forum***
Informal face-to-face discussions withcolleagues***
Support via a social media platform forscience and technology teachers***
Discussing the ideas for the sequence of lesssons
18.9 23.917.6 11.6
10.1 7.0 10.2 9.6
Aggregate
19.8 19.9 25.012.8
17.9 15.816.5
19.7
16.921.8
22.4 5.2
15.613.1 12.5
20.9
0%
10%
20%
30%
40%
50%
60%
70%
80%
90%
100%
Agg Class 1 Class 2 Class 3
You will be teaching by yourself***
With a co-teacher (non specialist)
With an education consultant
With a visiting external scientist (for example,parent) at some stage
With a colleague with science and technologyexpertise*
With a visiting external scientist (for example,CSIRO) at some stage***
Collaboration in teaching
17.1 19.8 11.0 26.2
12.7 9.6 12.6 15.2
Aggregate

Supporting the Effective Teaching of Primary Science and Technology32
DIFFERENCES IN PREFERENCES FOR CLASSROOM FACILITIES AND STORAGE
classroom based solutions for effective teaching, segment 3 showed a strong preference for flexible classroom solutions, such as moveable furniture or a portable heat source more than a specialised room (with or without shared access). Segment 3 was also distinguished as being less open to displaying student work near their classrooms, but more open to solutions for common storage nearby, or storage/display solutions in the classroom.
The latent segment analysis also revealed how teachers differed in the importance they placed on classroom facilities and resources, and the types of supportive solutions they felt would lead to more effective outcomes. In particular, whilst segment 3 was less concerned about collaborative opportunities relative to the other two segments, their preference for having some form of tangible solution with respect to having a specialised area and storage was evident. Regarding
Note: */**/*** significant at .10/.05/.01 level.
22.4 22.2 23.8 19.4
20.7 22.3 20.5 24.8
16.316.6
14.017.6
16.0 20.314.9
12.2
0%
10%
20%
30%
40%
50%
60%
70%
80%
90%
100%
Agg Class 1 Class 2 Class 3
No one***
A specialist staff member in an area otherthan science and technology in your school(for example, learning support)
Informal discussions with colleagues
An education consultant
Your curriculum coordinator***
A specialist science and technology staffmember in your school***
Figure 21: continued
Receiving ongoing supportive feedback on your planning from …
16.7 12.021.2
14.2
7.9 6.6 5.611.9
Aggregate

Supporting the Effective Teaching of Primary Science and Technology 33
Space to store work in progress (WIP)
Space to store resources/materials
Figure 22: Preferences for Supportive Classroom Facilities (Differences by Latent Classes)
Note: */**/*** significant at .10/.05/.01 level.
21.5 25.0 22.114.3
20.0 17.830.8
12.7
15.915.7
14.6
12.0
12.9813.31
6.6225.29
0%
10%
20%
30%
40%
50%
60%
70%
80%
90%
100%
Agg Class 1 Class 2 Class 3
No special area set aside for science and technology***
A portable heat source***
A wet area
Easily movable furniture***
Shared access to a purpose built science and technologyroom***
A purpose built area for science and technology***
Your new classroom has...
19.1
10.5
14.7
13.3
17.8
8.0
31.3
4.4No special area set aside for science and technology***
Aggregate
28.3 27.1 31.324.2
26.9 29.0 25.5
22.4
26.3 22.028.9
35.9
18.6 22.014.4 17.5
0%
10%
20%
30%
40%
50%
60%
70%
80%
90%
100%
Agg Class 1 Class 2 Class 3
You have no space to store resources/materials***
Common storage area/room nearby your classroom*
Individual storage area/room located nearby yourclassroom***
Shelving and storage capacity in your classroom***
Aggregate
29.9 33.826.2
36.3
26.428.4
29.9 13.7
26.220.9 30.1
26.9
17.6 16.9 13.823.1
0%
10%
20%
30%
40%
50%
60%
70%
80%
90%
100%
Agg Class 1 Class 2 Class 3
You have no space to store WIP***
Storeroom area nearby your classroom*
Display area nearby your classroom**
Dedicated shelving for storing and displaying WIP in yourclassroom***
Aggregate

Supporting the Effective Teaching of Primary Science and Technology34
DIFFERENCES IN PREFERENCE FOR TIMETABLING
the three latent segments, there were several variations to these preferences. Segment 1 was most open to longer periods in the morning. Segment 3 was strongly in favour of a double lesson period in the afternoon. Segment 2, however, was more in favour of either a half day or double period in the afternoon. In general, there was consensus regarding a preference away from a single period before a break (recess/lunch) across all three segments.
DIFFERENCES IN SEGMENT PROFILES
resourcing and space allocated to teaching. Segment 3 included teachers who were more open to environments where isolation occurred and preferred environments where issues around storage, particularly WIP, could be addressed. This group was also in favour of extending periods for primary science and technology teaching, and, similarly to segment 2, to scheduling this teaching to occur in the afternoon.
The aggregate results discussed previously indicated that teachers’ decisions about which school environments were more conducive for effective teaching were influenced significantly by variations in timetabling of this subject. For instance, it appeared that teachers preferred moderately longer periods (such as a double lesson) rather than shorter ones, or those that were more extensive (namely, a half day). It was also evident that, on average, teachers preferred these to occur in the afternoon rather than the morning. Across
The results suggested there were three different types of teachers in the data in terms of preferences regarding the nine factors and their levels evaluated in the DCE. Segment 1 appeared most driven in their choices by finding opportunities for collaboration in planning, developing ideas and feedback. Segment 2, however, was more open to external consultation in this area, but was also characterised by shared solutions in
23.016.9
23.5
42.3
20.9
19.8
23.8
15.1
15.8 27.77.5
15.011.6
7.0
16.8
10.2
0%
10%
20%
30%
40%
50%
60%
70%
80%
90%
100%
Agg Class 1 Class 2 Class 3
Single period before a break (recess/lunch)***
Single period after a break (recess/lunch)***
A half day in the morning
A double lesson period in the morning**
A half day in the afternoon***
A double lesson period in the afternoon***
Figure 23: Preferences for Timetabling (Differences by Latent Classes)
Timetabling for science and technology
Note: */**/*** significant at .10/.05/.01 level.
17.83
10.9
19.65
8.9
14.97
13.5
13.21
4.2
Aggregate

Supporting the Effective Teaching of Primary Science and Technology 35
7.41
7.26
7.27
7.12
7.01
6.95
7.15
7.36
7.19
7.09
7.23
6.92
8.06
7.94
8.09
7.54
7.39
7.52
Class 1 Class 2 Class 3
I have enough knowledge of the concepts of scienceto teach these subjects well in primary school.
I am well able to deal with questionsfrom students about science.
I have a sufficient command of the material to beable to support children well in investigating.
I have enough knowledge of the concepts oftechnology to teach these subjects well in primary school.
I am well able to deal with questionsfrom students about technology.
I have a sufficient command of the material to beable to support children well in designing and making.
Figure 24: Attitudes to Science and Technology (Differences by Latent Class)
Several questions were asked outside the DCE about demographic indicators, teachers’ and their colleagues’ experiences, attitudes and school capabilities with respect to primary science and technology. The three latent classes were further considered with respect to whether they differed on any of these indicators in an attempt to profile the type of teacher who was more likely to be characterised by the preferences discussed above.
There were significant differences with respect to self-efficacy relating to subject knowledge and the ability to deal with questions across the three segments. Segment 3 was more likely to include teachers who self-reported high levels of knowledge, greater ability to deal with questions, and possessed sufficient confidence in teaching science and technology. These differences were stronger in relation to questions about science than about technology. The levels of enthusiasm for teaching primary science and technology were similarly high across all three segments. Whilst not significantly different, average levels of enthusiasm were lowest among teachers in segment 1. In other words, teachers in segment 3 were
most enthusiastic and confident in teaching primary science and technology, particularly science.
Whilst not significantly different, teachers in segment 3 evaluated themselves more highly in terms of their effectiveness in being primary science and technology teachers than those in segment 1.
Teachers also reported on their school’s capabilities for teaching primary science and technology. The most significant differences across the three latent classes occurred in relation to perceptions about colleagues, their understanding of the syllabus, confidence and skillset for competent teaching. In this regard, teachers in segment 1 — those who were most open to collaborative experiences in teaching and planning — were much more likely to endorse their teaching colleagues. In contrast, those in segment 3 were more likely to nominate their school as placing less emphasis on primary science and technology. There was little difference on other indicators relating to positive attitudes among teachers or resourcing.

Supporting the Effective Teaching of Primary Science and Technology36
In addition, teachers in segment 1 were found to be more likely to work in environments where collaborative teaching already occurred. They were much more likely to have taught with a specialist science and technology co-teacher. They were also less likely to be teaching by themselves (66%) which was in contrast to both segment 2 (79%) and segment 3 (78%). Segment 1 was found to be more likely to include teachers who were teaching in Stages 2 and 3 (Years 3 to 6), or who had done so in the last five years. They were also found to have experiences in teaching in high school, particularly years 7 to 10. Segment 1 included a lower proportion of teachers working full-time (87%) relative to segment 2 (90%), or segment 3 (95%).
Segment 2 was represented by a larger proportion of teachers who had a postgraduate teaching qualification (39%) relative to segment 1 (26%) and segment 3 (28%). Similarly, segment 2 was more likely to have completed tertiary education and obtained a Bachelor degree in a non-teaching capacity (25%) relative to the two other segments (19%). Segment 2 was more likely to hold a Bachelor degree as their highest teaching qualification (59%) compared to segment 2 (48%) and segment 3
(50%). Segment 2 was also most committed to their current position and the profession more generally. Specifically, this segment was more likely to declare that their plans in the next year were to remain in the profession at the same school (92%), 10% higher than that of the other two segments.
Several other variables showed no significant differences across the three segments. For example, there was no significant difference in terms of school location, the number of years of experience teaching primary science and technology, or the age of the teacher. It should be noted, however, that this does not imply that differences among such groups may not be present. A latent class approach concentrates on identifying differences in preferences for support among teachers, without reference to any particular indicator (for example, sociodemographics, school capabilities, attitudes) (Burke et al., 2013). In this manner, the previous discussion regarding these indicators and differences across the latent segments is a post-hoc consideration of whether differences in these segments of teachers can be related to various indicator variables.
Figure 25: Perceptions of School Capabilities in Science and Technology Teaching
Note: */**/*** significant at .10/.05/.01 level.
3.70
3.32
3.64
3.63
3.52
3.38
3.41
3.44
3.74
2.43
3.68
3.17
3.51
3.48
3.34
3.23
3.34
3.33
3.37
2.45
3.57
3.28
3.28
3.20
3.20
3.11
3.52
3.19
3.28
2.31
Class 1 Class 2 Class 3
Teachers at my school have a positive attitude to the teaching of primary science and technology.
My school is well resourced for the teaching of primary science and technology.
Teachers at my school have the opportunity to receive ongoing professional learning in primary science and technology.*
My school places a strong emphasis on primary science and technology.**
Teachers at my school have the confidence and skills to teach primary science and technology competently.*
Teachers at my school have a good background knowledge in primary science and technology.
Time is a major factor inhibiting primary science and technology program delivery at my school.
Teachers at this school have a sound knowledge of strategies known to be effective for the teaching of science and technology.
Teachers at my school have a good understanding of the primary science and technology syllabus.***
Teachers in my school think technology in science and technology is only about ICT.

Supporting the Effective Teaching of Primary Science and Technology 37
DISCUSSIONS AND CONCLUSIONS
Supporting the effective teaching of primary science and technology is an important priority in education. In recognition of this, the current study aims to explore how to best provide an environment and mechanisms of support that promote the effective teaching of this subject. In this study, effective primary science and technology teaching:
• incorporates activities that are embedded in contexts that are relevant and important to students
• engages students in collaborative inquiry and solving problems
• involves students in conducting hands-on investigations to gather evidence to test ideas and supports students to design and produce things
• aims to develop students in terms of their capabilities, knowledge and positive science and technology dispositions.
Findings of the study indicate that teachers at independent schools in NSW appear to be enthusiastic and committed to teaching science and technology effectively. A majority of them self-report a high level of confidence in their abilities to do so.
While resources for supporting teachers can be directed to many areas, this research seeks to gather insights from teachers about their perceptions and preferences for where resources will be better deployed. To do so, teachers are placed in an environment where they have to make trade-offs amongst attributes describing a supportive environment in order to reveal what they perceive as relatively more important. The discrete choice experiment (DCE) allows the estimation of a model that predicts the attributes teachers are more likely to nominate as contributing to effective primary science and technology teaching.
In a similar vein to the BWS, aspects related to time are perceived by teachers to be important barriers to effective teaching. Once again, time appears to be multi-faceted. In this regard, time to collaborate
in planning is the most important factor in driving preferences. Time is also considered in terms of the opportunities for conducting lessons over extended sessions. Here, teachers reveal strong preferences for teaching in extended blocks of time rather than single lessons. On average, teachers are also more open to the scheduling that places primary science and technology in the afternoon rather than the morning. Teachers who are less confident in teaching this subject indicate a preference towards a half-day period in the morning. Those who exhibit greater self-efficacy, on average, prefer a double period in the afternoon.
Prior research suggests that student learning in extended blocks of time is possible if the environment stimulates mobility with adequate furnishing, and involves students in an overarching visual, tactile and kinaesthetic experience (Dunn & Dunn, 1987). Research on time of day and performance has reported mixed findings, and is complicated by the inaccurate generalisation of studies that have examined students in high school rather than primary school (Dunn & Dunn, 1987; Dunn, Beaudry, & Klavas, 2002). It is also reported that teachers’ preference for morning lessons is driven by common perceptions that students tend to have higher attention in the morning (for example, King, Shumow, & Lietz, 2001). On the other hand, there is a suggestion that the effectiveness of teaching is driven by the preferences of teachers themselves, rather than only a consideration of what is preferable among students. For example, a 1983 study reported that US elementary (primary) teachers implemented innovative instructional techniques significantly more often (as reported by their supervisors’ evaluations) when teachers themselves taught during their most preferred hours (see, Dunn et al., 2002).
Collaboration also emerges as an important theme in the research. There is a clear preference away from environments with no collaboration in planning, discussion, delivery and feedback. This preference is stronger in some groups of teachers than others. The largest of the three teacher groups is predominantly

Supporting the Effective Teaching of Primary Science and Technology38
focused on seeking collaborative experiences. Sources of collaboration also differ. That is, some teachers are more welcoming of working with teachers from the same school, whilst others prefer outside assistance. It appears that there is some reservation among a minority of teachers about the value of external resources, or face-to-face observation of their teaching.
The current research also indicates that collaboration that occurs outside the classroom is much more valued in creating effective teaching outcomes relative to when teachers seek support in the form of co-teaching. This is consistent with findings of Burke et al.’s (2015) study that focused on Australian early career teachers in the secondary setting. Burke et al. found that teachers preferred to work with more experienced teachers in cooperative planning, but were mixed in their response to co-teaching and collaborative observation. The present research also finds that teachers who are more committed to the profession welcome collaborative observation from experienced teachers, whilst those with intentions to leave the profession significantly prefer support in the form of co-teaching with experienced teachers. Both groups, however, are significantly opposed to not having any such opportunities to work with experienced teachers (Burke et al., 2015). As such, these findings reinforce the literature that points to the value of building a supportive culture around teachers by minimising isolation and maximising formal and informal interactions with colleagues (for example, Aubusson et al., 2015; Burke et al., 2013; Burke et al., 2015; Ewing & Manuel, 2005; Schuck et al., 2011).
The current research also points to the strength of resources that are clearly linked to the syllabus and curriculum. Teachers show a clear preference for online resources, particularly in sourcing ideas for teaching and discussing ideas. However, with respect to idea generation, this is entirely dominated by preferences for those sources clearly linked to the syllabus. This appears to reinforce findings of the case study and focus groups
which suggest that teachers are frustrated by resources that offer an overwhelming array of assistance, but are not clearly linked to lesson and syllabus outcomes. In the present research, around 14 to 19% of teachers indicate their concerns with respect to their confidence and knowledge in teaching primary science and technology. Greater concerns in effective teaching and lower levels of enthusiasm are also higher in regards to technology relative to science.
Avenues for online interactions with other teachers also appear to be valued. This is consistent with some existing research which suggests that online communities are increasingly used by teachers for professional support, guidance and inspiration. In other research, more formal programs in building professional learning communities have been shown to be effective during teacher induction and for mentoring activities (Hutchinson & Colwell, 2012).
The emphasis on quality collaboration reflects that teachers value this as it contributes to the effectiveness of their teaching. It is clear from the current study that, on average, teachers prefer to have higher order discussions with the curriculum coordinator. The presence of the curriculum coordinator appears to complement the value of collegial discussions with other year level teachers for planning and idea generation. Preference for collaborations with the curriculum coordinator, however, is not evident across all segments. Nevertheless, there is agreement across all three segments regarding the value of feedback by a specialist teacher in the area of science and technology.
Teachers had previously reported the extent to which effective teaching could be supported by an environment that has suitable facilities. The current study finds that many teachers are focused on the storage of materials, particularly WIP. For some, the storing of WIP is more important than displaying it. Some teachers are also more open to common storage areas to address concerns in this regard.
Supporting the Effective Teaching of Primary Science and Technology 39
Providing separate areas for teaching is evaluated as a possible option to improve the effectiveness of teaching. Not surprisingly, teachers nominate such areas as being more likely to improve outcomes. However, teachers also indicate that flexible classrooms with easily movable furniture are just as valuable in terms of supporting effective primary science and technology teaching.
Teachers’ responses are also considered in terms of heterogeneity among them. The DCE study examines if teachers could be grouped into different segments where their preferences among attributes are relatively homogenous within each of these. Three segments are identified from the data. These are characterised by different levels of importance teachers place on collaboration, resourcing and timetabling solutions for effective teaching. The segments are also characterised by their confidence and knowledge in teaching science and technology. In particular, those least confident are most likely to seek collaboration to support effective teaching. On the other hand, those more confident are more focused on resources, but still acknowledge the value of working with others, particularly in planning, idea generation and feedback. In some instances, segments differ in terms of whom they are more open to interacting with and the ways that this might occur. As is evident in the case study and focus groups, some teachers are reticent about collaboration that involves having their teaching observed, particularly if by an external person.
Overall, the enthusiasm, confidence and self-perceived level of effectiveness in teaching primary science and technology suggest that there are many instances where positive outcomes and suitably supportive environments are present. The findings also suggest that less than 10% of participating teachers indicate their teaching is currently ineffective, and an even smaller number suggests that they have been attempting to approach teaching in an effective manner but have not always been able to realise this.
However, there appears to be a higher proportion of surveyed teachers who report concerns about their colleagues’ capabilities in teaching science and technology. Whilst less than 10% of teachers report that they do not work in schools where attitudes to primary science and technology teaching are positive, closer to 18% do not believe their colleagues are confident and skilful enough to teach the subject competently, or have sound knowledge to be effective science and technology teachers. The same number reports that they work at a school where teachers do not have adequate opportunities to receive ongoing professional learning in primary science and technology. Around 14% of teachers indicate that their colleagues do not have a good understanding of the syllabus.
With respect to school capabilities, 73% of teachers agree that their schools are well resourced for the teaching of primary science and technology. In addition, more than half of the surveyed teachers (54%) report that time is a major factor inhibiting primary science and technology program delivery at their schools.
This report suggests strategies that could support effective science and technology teaching in primary schools. Findings highlight solutions relating to storage, flexible and/or specialised classrooms, and timetabling of lessons. Collaborative approaches to planning as well as idea generation, and locating suitable teaching resources that are well linked to the syllabus may warrant attention by schools. The study also indicates that there is significant variation among primary school teachers in terms of preferences for the kinds of support that could enable them to teach this subject effectively. This implies the need to recognise and consider the particular needs of individual teachers. One way to do this may involve consulting with teachers about which strategies best serve their needs in order to ensure these are met.

Supporting the Effective Teaching of Primary Science and Technology40
REFERENCES
Aubusson, P., Schuck, S., Ng, W., Burke, P.F., Pressick-Kilborn, K., & Palmer, T.A. (2016). Case study report: Quality learning and teaching in primary science and technology. Sydney: Association of Independent Schools of New South Wales. Available at: http://ow.ly/Qxxe30c7gvN
Aubusson, P., Schuck, S., Ng, W., Burke, P.F., Pressick-Kilborn, K. & Palmer, T.A. (2015). Quality learning and teaching in primary science and technology literature review. Sydney: Association of Independent Schools New South Wales. Available at: http://ow.ly/cf8c30c7guU
Aubusson, P., Burke, P.F., Schuck, S., Kearney, M., & Frischknecht, B. (2014). Teachers choosing rich tasks: The moderating impact of technology on student learning, enjoyment, and preparation. Educational Researcher, 43(5), 219-229.
Ben-Akiva, M. E., & Lerman, S. R. (1985). Discrete choice analysis: Theory and application to travel demand (Vol. 9). MIT Press.
Burke, P. F., Aubusson, P., Schuck, S., Palmer, T., Pressick-Kilborn, K & Ng, W. (2016). Barriers to the effective teaching of primary science and technology. Sydney: Association of Independent Schools of NSW. Available at: http://ow.ly/cVWI30c7gwj
Burke, P. F., Aubusson, P. J., Schuck, S. R., Buchanan, J. D., & Prescott, A. E. (2015). How do early career teachers value different types of support? A scale-adjusted latent class choice model. Teaching and Teacher Education, 47, 241-253.
Burke, P. F., Schuck, S., Aubusson, P., Buchanan, J., Louviere, J. J., & Prescott, A. (2013). Why do early career teachers choose to remain in the profession? The use of best-worst scaling to quantify key factors. International Journal of Educational Research, 62, 259-268.
Dunn, R., Beaudry, J. S. & Klavas, A. (2002). Survey of research on learning styles. California Journal of Science Education, 2(2), 75-98.
Dunn, K., & Dunn, R. (1987). Dispelling outmoded beliefs about student learning. Educational Leadership, 44(6), 55-63.
Ewing, R., & Manuel, J. (2005). Retaining quality early career teachers in the profession: New teacher narratives. Change: Transformation in Education, 8(1), 1-16.
Hutchison, A. & Colwell, J. (2012). Using a wiki to facilitate an online professional learning community for induction and mentoring teachers. Education and Information Technologies, 17(3), 273-289.
King, K., Shumow, L. & Lietz, L. (2001). Science education in an urban elementary school: Case studies of teacher beliefs and classroom practices. Science Education, 85(2), 89-110.
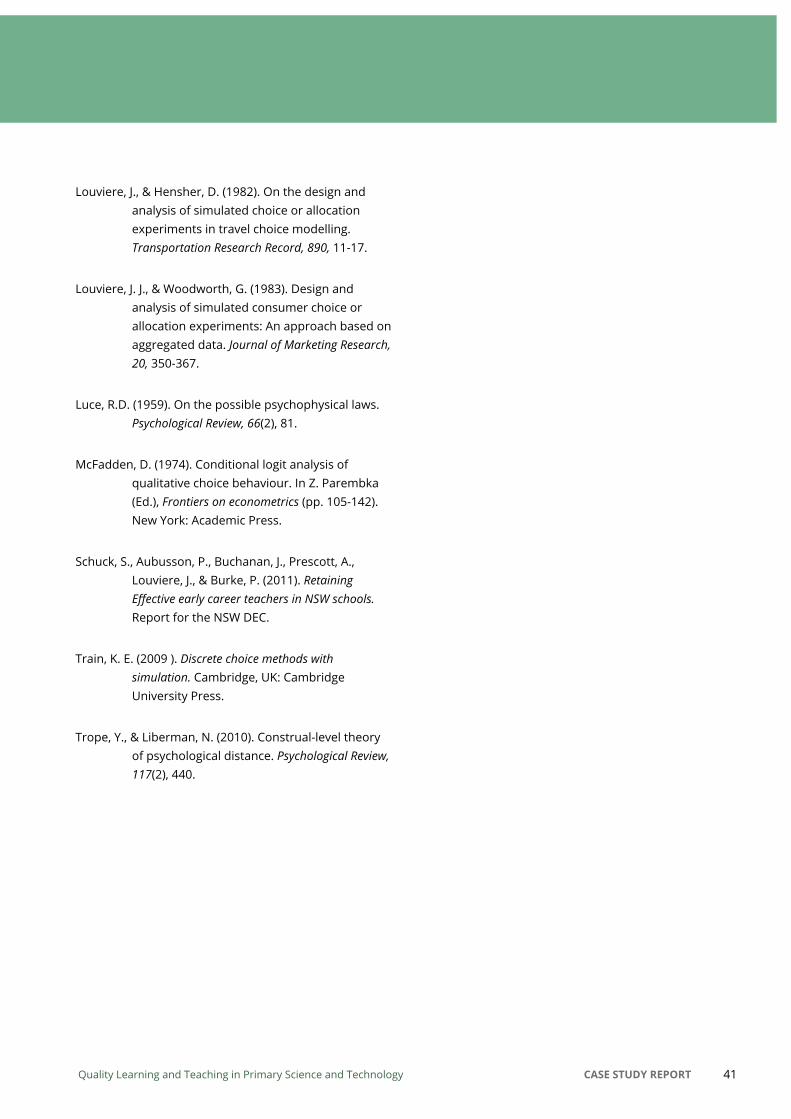
Louviere, J., & Hensher, D. (1982). On the design and analysis of simulated choice or allocation experiments in travel choice modelling. Transportation Research Record, 890, 11-17.
Louviere, J. J., & Woodworth, G. (1983). Design and analysis of simulated consumer choice or allocation experiments: An approach based on aggregated data. Journal of Marketing Research, 20, 350-367.
Luce, R.D. (1959). On the possible psychophysical laws. Psychological Review, 66(2), 81.
McFadden, D. (1974). Conditional logit analysis of qualitative choice behaviour. In Z. Parembka (Ed.), Frontiers on econometrics (pp. 105-142). New York: Academic Press.
Schuck, S., Aubusson, P., Buchanan, J., Prescott, A., Louviere, J., & Burke, P. (2011). Retaining Effective early career teachers in NSW schools. Report for the NSW DEC.
Train, K. E. (2009 ). Discrete choice methods with simulation. Cambridge, UK: Cambridge University Press.
Trope, Y., & Liberman, N. (2010). Construal-level theory of psychological distance. Psychological Review, 117(2), 440.
Quality Learning and Teaching in Primary Science and Technology CASE STUDY REPORT 41

The Association of Independent Schools of NSW Level 12, 99 York Street, Sydney NSW 2000Phone (02) 9299 2845 Fax (02) 9290 2274
Web www.aisnsw.edu.au Email [email protected] 96 003 509 073