Embed Size (px)
Citation preview

Supporting Information
Preparation of compressible polymer monoliths that contain
mesopores capable of rapid oil–water separation
Ji Ae Chae,a Yuree Oh,a Hea Ji Kim,a Go Bong Choi,a Kyoung Min Lee,a,b
Doyoung Jung,a Yoong Ahm Kim,a and Hyungwoo Kim*a
a School of Polymer Science and Engineering & Alan G. MacDiarmid Energy Research
Institute, Chonnam National University, 77 Yongbong-ro, Buk-gu, Gwangju 61186, Korea b Department of Materials Science and Engineering, Seoul National University, 1 Gwanak-
ro, Gwanak-gu, Seoul 08826, Korea
*Corresponding author e-mail: [email protected]
Electronic Supplementary Material (ESI) for Polymer Chemistry.This journal is © The Royal Society of Chemistry 2019

S–1
Contents
Contents ................................................................................................................................................... S–1
General Experimental .......................................................................................................................... S–1
Instrumentation ...................................................................................................................................... S–1
Synthetic Procedures............................................................................................................................ S–3
Mechanical Properties of 9 ................................................................................................................ S–8
SEM Measurement ............................................................................................................................... S–9
Measurement of Porosity of Materials ........................................................................................... S–9
Fiber Growth Measurement ............................................................................................................. S–10
Mechanical Properties of Carbonized 3 ....................................................................................... S–11
Optical Properties of 3 ....................................................................................................................... S–12
Contact Angle Measurement ........................................................................................................... S–12
Absorption Properties of Materials ................................................................................................ S–13
References ............................................................................................................................................. S–18
NMR Spectra........................................................................................................................................ S–19
General Experimental
All reactions were performed in flame-dried glassware under a positive pressure of nitrogen
unless otherwise noted. 1,3,5-Triethynylbenzene (1) was synthesized following the
previous method.S1
Instrumentation
Proton nuclear magnetic resonance (1H NMR) spectra were recorded using Bruker 400
MHz NMR spectrometers at 25 °C. Proton chemical shift are expressed in part per million
(ppm, δ scale) and are referenced to tetramethylsilane ((CH3)4Si 0.00 ppm) or to residual
protium in the solvent (CDCl3, δ 7.26 ppm).
Solid-state 13C CP/MAS NMR spectrum was recorded on a 500 MHz Bruker
Avance III HD spectrometer (125 MHz) equipped with a CP‐MAS probe.
Nitrogen adsorption–desorption isotherms were measured at 77 K by using a
Belsorp‐Max (BEL Japan, Inc.) apparatus. Samples were degassed at 150 °C under vacuum

S–2
for at least 12 h before measurements, and ultra‐high purity grade nitrogen gas was used for
all measurements. The specific surface area was calculated by Brunauer–Emmett–Teller (BET)
method and the pore size distribution was estimated according to the nonlocal density function
theory (NLDFT) with a slit model. Total pore volumes were calculated at a relative pressure of
P/P0 = 0.990.
Uniaxial compressive tests were performed using a universal testing machine
(UTM) (MCT-2150, A&D, Japan) with a 500-N load cell at 25 °C in air. The cylindrical
samples were compressed at a rate of 10 mm min-1 and triplicated during the measurement.
Then, stress–strain curves were recorded. Young's modulus was obtained from the initial
slope of the stress-strain curve in the strain range of 0–10%.
Micromorphology of dried hydrogels was observed using a Carl Zeiss SUPRA
55VP scanning electron microscope (SEM) at an accelerating voltage of 2 kV. Before the
measurement, the sample was dried in vacuum and coated with a thin platinum layer.
Photoluminescence spectra were measured using a Shimadzu RF-5301PC
spectrofluorometer.
Attenuated total reflectance Fourier-transform infrared spectroscopy (ATR-FTIR)
was performed using IFS66/S (Bruker) was used to observe absorption spectra of hydrogels.
Water Contact angle measurements were conducted using a SurfaceTech GSA-X
goniometer at 25 °C in air. The contact angle measurement was performed on a flat surface.
The angles were measured immediately after dripping a water droplet on the surface of
sample.

S–3
Synthetic Procedures
Synthesis of (Z)-2,3-bis(4-iodophenyl)acrylonitrile (2):
Scheme S1. Synthetic procedures for 2.
A solution of NaOH (49.6 mg, 1.24 mmol, 0.12 equiv) in ethanol (30 mL) was added
dropwise to the mixture of 4-iodophenylacetonitrile (2.43 g, 10 mmol, 1 equiv) and 4-
iodobenzaldehyde (2.32 g, 10 mmol, 1 equiv) in ethanol (50 mL). The reaction mixture
was stirred at rt for 1.5 h under nitrogen atmosphere. The resulting solid was filtered and
sufficiently washed with cold ethanol. The desired product 2 was obtained as a white solid
(4.08 g, 8.93 mmol, 89.3%). 1H NMR (CDCl3, 400 MHz): δ 7.39 (d, J = 8 Hz, 2 H), 7.44
(s, 1 H), 7.60 (d, J = 4 Hz, 2 H), 7.78 (d, J = 4 Hz, 2 H), 7.81 (d, J = 8 Hz, 2 H). The
spectrum (Figure S17) matched with the reported data in S2.
Synthesis of (Z)-2,3-bis(4-bromophenyl)acrylonitrile (4):
Scheme S2. Synthetic procedures for 4.
A solution of NaOH (2.45 mg, 0.061 mmol, 0.12 equiv) in ethanol (1.5 mL) was added
dropwise to the mixture of 4-bromophenylacetonitrile (100 mg, 0.51 mmol, 1 equiv) and
4-bromobenzaldehyde (94.38 mg, 0.51 mmol, 1 equiv) in ethanol (2.5 mL). The reaction
mixture was stirred at rt for 1.5 h in nitrogen atmosphere. The solid was filtered and

S–4
sufficiently washed with cold ethanol. The desired product 4 was obtained as a white solid
(100.3 mg, 0.28 mmol, 54.2%). 1H NMR (CDCl3, 400 MHz): δ 7.53 (d, J = 8 Hz, 2 H),
7.45 (s, 1 H), 7.58 (d, J = 8 Hz, 2 H), 7.60 (d, J = 8 Hz, 2 H), 7.74 (d, J = 12 Hz, 2 H). The
spectrum (Figure S18) matched with the reported data in S3.
Synthesis of 7:
Scheme S3. Synthetic procedures for 7.
Non-agitated reaction: To a solution of 1,3,5-triethynylbenzene (24.7 mg, 0.16 mmol, 1.0
equiv), (Z)-2,3-bis(4-bromophenyl)acrylonitrile (59.7 mg, 0.16 mmol, 1.0 equiv), and
bis(triphenylphosphine)palladium(II) dichloride (3.46 mg, 4.9 μmol, 0.03 equiv) in toluene
(1 mL) was added a solution of copper(I) iodide (0.94 mg, 4.9 μmol, 0.03 equiv) in
triethylamine (0.5 mL). After storing at rt for 24 h without agitation, the resulting powder
was filtered and washed with MeOH, THF, and acetone consecutively. The obtained
product was further purified by gentle stirring in MeOH for 24 h and dried under vacuum
at rt to afford 7 as a brown powder (8.52 mg, 10.1%). IR (cm-1): 2970, 2155, 2109, 1739,
1577, 1435, 1367, 1217, 1095.
Agitated reaction: To a solution of 1,3,5-triethynylbenzene (74.0 mg, 0.49 mmol, 1.0
equiv), (Z)-2,3-bis(4-bromophenyl)acrylonitrile (178.8 mg, 0.49 mmol, 1.0 equiv), and
bis(triphenylphosphine)palladium(II) dichloride (10.4 mg, 0.01 mmol, 0.03 equiv) in
toluene (3 mL) was added a solution of copper(I) iodide (2.81 mg, 0.0148 mmol, 0.03 equiv)

S–5
in triethylamine (1.5 mL). After stirring at rt for 24 h, the resulting powder was filtered and
washed with MeOH, THF, and acetone consecutively. The product was further purified by
gentle stirring in MeOH for 24 h and dried under vacuum at rt to afford 7 as a brown
powder (78.61 mg, 31.1 %).
Synthesis of 8:
Scheme S4. Synthetic procedures for 8.
1,3,5-Triethynylbenzene (49.4 mg, 0.33 mmol, 1.0 equiv), 4,4’-diiodo-trans-stilbene (0.14
g, 0.33 mmol, 1.0 equiv), and bis(triphenylphosphine)palladium(II) dichloride (6.92 mg,
0.0099 mmol, 0.03 equiv) were dissolved in 1:1 toluene–DMF (4 mL, v/v) after sonication.
To the reaction mixture was added a solution of copper(I) iodide (1.88 mg, 9.9 μmol, 0.03
equiv) in triethylamine (1 mL). After storing at 85℃ for 24 h without agitation, the
resulting product was taken out and washed with MeOH, THF, and acetone consecutively.
The product was further purified by gentle stirring in MeOH for 24 h and dried under
vacuum at rt to afford 8 as a dark brown powder (158.8 mg, 83%). IR (cm–1): 3045, 2220,
1580, 1486, 1405, 1360, 1064, 1005.

S–6
Synthesis of 9:
Scheme S5. Synthetic procedures for 9.
1,3,5-Triethynylbenzene (24.7 mg, 0.16 mmol, 1.0 equiv), 4,4’-diiodobiphenyl (66.7 mg,
0.16 mmol, 1.0 equiv), and bis(triphenylphosphine)palladium(II) dichloride (3.46 mg,
0.0049 mmol, 0.03 equiv) were dissolved in toluene (1 mL) after sonication. Then, a
solution of copper(I) iodide (0.94 mg, 4.9 μmol, 0.03 equiv) in triethylamine (0.5 mL) was
added to the reaction mixture. After storing at 75℃ for 24 h without agitation, the resulting
polymer was filtered and washed with MeOH, THF, and acetone consecutively. The
product was further purified by gentle stirring in MeOH for 24 h and dried under vacuum
at rt to afford 9 as a yellow powder (72.2 mg, 79%). IR (cm–1): 2207, 1578, 1493, 1414,
1107, 1064, 1002. The resulting material 9 was obtained as a monolith but not compressible
as shown in Figure S1.
Figure S1. Photographs of the network 9 that was obtained as a monolith (a) but destroyed after (b) loading
and (c) unloading external force.
a b c

S–7
Synthesis of 10:
Scheme S6. Synthetic procedures for 10.
Microporous polymer network 10 was prepared by following the reported procedure using
1,4-diiodobenzene instead of 2.S1 Quantities of monomers and reagents for 10: 1,3,5-
Triethynylbenzene (50 mg, 0.33 mmol, 1.0 equiv), 1,4-diiodobenzene (109.83 mg, 0.33
mmol, 1.0 equiv), bis(triphenylphosphine)palladium(II) dichloride (7.0 mg, 0.01 mmol,
0.03 equiv), and copper(I) iodide (2.0 mg, 0.01 mmol, 0.03 equiv). The product was
obtained as a compressible, yellow monolith.

S–8
Mechanical Properties of 9
0 10 20 30 40 50 60
0.0
0.1
0.2
0.3co
mp
ressiv
e s
tre
ss (
MP
a)
strain (%)
Figure S2. Compressive stress–strain curve obtained from 9. The network was destroyed over a strain of
40%.

S–9
SEM Measurement
Figure S3. SEM image of the cross section of fiber in the network 3.
Figure S4. SEM images of fibrous structure in 3 (a) before and (b) after ten consecutive loading–unloading
cycles.
Figure S5. SEM image of fibrous structure of a commercial melamine foam.
Measurement of Porosity of Materials
Table S1. Summarized specific surface areas and total pore volumes of the polymer networks.
polymer network specific surface area (m2 g–1)a total pore volume (cm3 g–1)b
3 53 0.10
7 331 0.26
8 487 0.25
9 441 0.22 a specific surface areas were calculated by the BET method from N2 adsorption isotherms at 77 K. b total pore volume were determined at P/P0 = 0.995.
200 μm 200 μm
a b
20 μm
500 nm
S–10
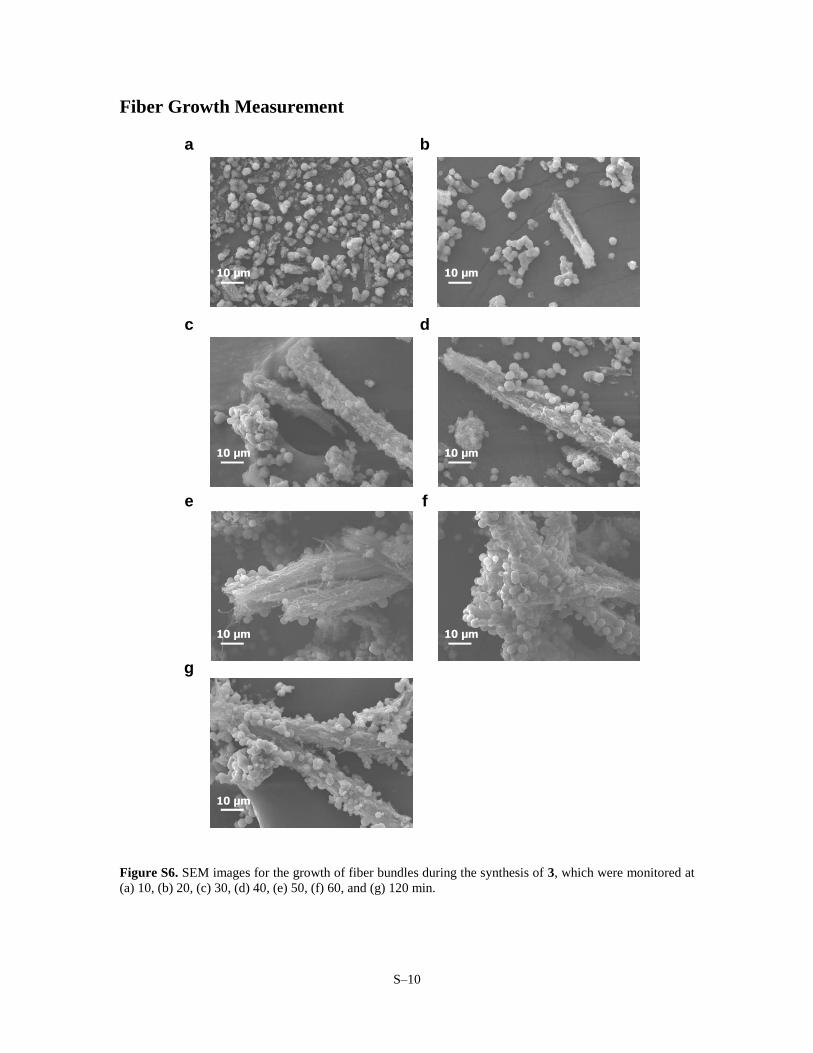
Fiber Growth Measurement
Figure S6. SEM images for the growth of fiber bundles during the synthesis of 3, which were monitored at
(a) 10, (b) 20, (c) 30, (d) 40, (e) 50, (f) 60, and (g) 120 min.
10 μm
10 μm 10 μm
10 μm
10 μm
10 μm
10 μm
a b
c d
e f
g

S–11
Mechanical Properties of Carbonized 3
The monolith 3 was carbonized following the conditions as follows. The material was
heated up to 800 °C at a rate of 2 °C min–1 under nitrogen atmosphere. Then, the material
was further stored at the same temperature for 1 h to complete the thermal carbonization
(char yield, 80%).
0 5 10 15 20 25
0.00
0.01
0.02
0.03
0.04
0.05
com
pre
ssiv
e s
tress (
MP
a)
strain (%)
Figure S7. Compressive stress–strain curve obtained from the carbonized 3. The network was destroyed over
a strain of 15%.
Figure S8. Photographs of the carbonized 3 that maintained the monolithic structure (a) but destroyed during
(b) loading and (c) unloading cycle.
a b c

S–12
Optical Properties of 3
Figure S9. The fluorescence emission spectrum of 3 when excited at 365 nm (yellow). The inset shows
photographs of 3 before and after 365-nm irradiation using a conventional UV hand lamp.
Contact Angle Measurement
Figure S10. Representative photographs of a water droplet on polymer network 3 (a) before and (b) after ten
consecutive loading–unloading cycles.
Table S2. Contact angles measured from polymer network 3.
Compound Trial 1 Trial 2 Trial 2 Avg. Std.
3 107.82 101.94 93.18 100.98 7.37
3 after compressive test
108.49 111.34 106.93 108.92 2.24
420 450 480 510 540 570 600 630 6600
15
30
45
60
PL inte
nsity (
a.u
.)
wavelength (nm)
365 nm
a b

S–13
Absorption Properties of Materials
Each dried sample was soaked in each solvent. Then the weight of samples was monitored
at each time interval.
Figure S11. (a) Expanded view of the initial region of the absorption behavior of mesoporous 3. The
absorption almost completed before 10 min. (b) Comparison of the initial absorption behavior of 3 before
(closed circles) and after compression until a strain of 80% (open circles) when immersed in n-dodecane.
Figure S12. Nitrogen adsorption–desorption isotherms of (a) the network 10 and (b) melamine foam
measured at 77 K. Open circles depict adsorption curves; closed circles, desorption curves. Pore size
distribution of large pores in the melamine foam estimated by the Barrett–Joyner–Halenda (BJH) method is
shown in the inset.
0 1 2 3 4 5 6 7 8 9 10
0
5
10
15
20
25
30
n-hexane
toluene
water
chloroform
ethanol
silicone oil
n-dodecane
absorp
tion c
apacity (
mg/m
g)
time (min)
a
0 1 2 3 4 5 6 7 8 9 10
0
3
6
9
12
absorp
tion c
apacity (
mg/m
g)
time (min)
before compression
after compression
b
0.0 0.2 0.4 0.6 0.8 1.0
0
50
100
150
200
adsorption
desorptionab
so
rbe
d N
2 a
mo
un
t (c
m3 g
-1)
relative pressure (P/P0)
0.0 0.2 0.4 0.6 0.8 1.0
0
10
20
30
absorb
ed N
2 a
mount (c
m3 g
-1)
relative pressure (P/P0)
adsorption
desorption
0 50 100 150 200
0.000
0.002
0.004
0.006
0.008
dV
p (cm
3 g
-1)
pore diameter (nm)
a b

S–14
Figure S13. (a) Absorption behavior of microporous 10 when immersed in various solvents as a function of
time. (b) Comparison of absorption capacity of 10 versus density of solvents.
Figure S14. (a) Absorption behavior of melamine foam when immersed in various solvents as a function of
time. (b) Comparison of absorption capacity of melamine foam versus density of solvents.
0 200 400 600 800 1000
0
5
10
15
20
25
30
chloroform
ethanol
silicone oil
n-dodecane
ab
so
rptio
n c
ap
acity (
mg
/mg
)
time (min)
n-hexane
toluene
water
0.6 0.8 1.0 1.2 1.4 1.60
500
1000
1500
2000
2500
3000
ab
so
rptio
n c
ap
acity(w
t%)
density(g/mL)
chloroform
ethanol
silicone oiltoluene
water
n-dodecane
n-hexane
a b
0 200 400 600 800 1000
0
30
60
90
120
150
180
n-hexane
toluene
water
absorp
tion c
apacity (
mg/m
g)
time (min)
chloroform
ethanol
silicone oil
n-dodecane
b
0.6 0.8 1.0 1.2 1.4 1.6
5000
10000
15000
20000
absorp
tion c
apacity(w
t%)
density(g/mL)
chloroform
ethanol
silicone oil
toluenewater
n-dodecane
n-hexane
a

S–15
Figure S15. Linear correlation of t/qt vs. time and obtained corresponding function for each solvent,
measured with 3: (a) n-dodecane, (b) ethanol, (c) silicone oil, (d) chloroform, (e) n-hexane, and (f) toluene.
0 500 1000 1500 2000 2500
0
50
100
150
200
250t/q
t (m
in g
g-1)
t (min)
y = 0.1024x + 0.13635
=0.9999
0 500 1000 1500 2000 2500
0
50
100
150
t/q
t (m
in g
g-1)
t (min)
y = 0.05561x + 0.60832
=0.9992
0 500 1000 1500 2000 2500
0
50
100
150
200
t/q
t (m
in g
g-1)
t (min)
y = 0.07708x + 0.58087
=0.9996
0 500 1000 1500 2000 2500
0
20
40
60
80
t/q
t (m
in g
g-1)
t (min)
y = 0.02987x + 0.33151
=0.999
0 500 1000 1500 2000 2500
0
100
200
300
400
500
600
t/q
t (m
in g
g-1)
t (min)
y = 0.2259x + 1.25212
=0.9996
0 500 1000 1500 2000 2500
0
100
200
300
400
t/q
t (m
in g
g-1)
t (min)
y = 0.15552x + 0.36509
=0.9999
a b c
d e f

S–16
Figure S16. Linear correlation of t/qt vs. time and obtained corresponding function for each solvent,
measured with 10: (a) n-dodecane, (b) ethanol, (c) silicone oil, (d) chloroform, (e) n-hexane, (f) toluene, and
(g) water.
0 200 400 600 800 1000
0
15
30
45
60
75
t/q
t (m
in g
g-1)
t (min)
0 200 400 600 800 1000
0
10
20
30
40
50
60
t/q
t (m
in g
g-1)
t (min)
0 200 400 600 800 1000
0
10
20
30
40
50
60
t/q
t (m
in g
g-1)
t (min)
a b c
d e f
y = 0.0616x + 0.09872
=0.9995
y = 0.06216x + 0.02434
=0.9999
0 200 400 600 800 1000
0
10
20
30
40
50
60
t/q
t (m
in g
g-1)
t (min)
y = 0.05836x + 0.07847
=0.9999
0 200 400 600 800 1000
0
10
20
30
40
t/q
t (m
in g
g-1)
t (min)
y = 0.03551x + 0.0243
=0.9999
y = 0.07431x + 0.05509
=0.9999
0 200 400 600 800 1000
0
10
20
30
40
50
60
70
t/q
t (m
in g
g-1)
t (min)
y = 0.0671x + 0.0278
=0.9999
g
0 200 400 600 800 1000
0
50
100
150
200
250
300
t/q
t (m
in g
g-1)
t (min)
y = 0.27168x + 2.52588
=0.9980

S–17
Figure S17. Linear correlation of t/qt vs. time and obtained corresponding function for each solvent,
measured with melamine foam: (a) n-dodecane, (b) ethanol, (c) silicone oil, (d) chloroform, (e) n-hexane, (f)
toluene, and (g) water.
a b c
d e f
g
0 200 400 600 800 1000
0
2
4
6
8
t/q
t (m
in g
g-1)
t (min)
y = 0.0078x + 0.15064
=0.9960
0 200 400 600 800 10000
2
4
6
8
10
12
t/q
t (m
in g
g-1)
t (min)
y = 0.0106x + 0.00582
=0.9999
0 200 400 600 800 1000
0
2
4
6
8
10
12
t/q
t (m
in g
g-1)
t (min)
y = 0.01283x + 0.00873
=0.9999
0 200 400 600 800 1000
0
2
4
6
8
10
t/q
t (m
in g
g-1)
t (min)
y = 0.00928x + 0.00349 =0.9999
0 200 400 600 800 1000
0
2
4
6
8
10
12
t/q
t (m
in g
g-1)
t (min)
y = 0.01102x + 0.00111
=0.9999
0 200 400 600 800 1000
0
2
4
6
8
t/q
t (m
in g
g-1)
t (min)
y = 0.00797x + 0.00274
=0.9999
0 200 400 600 800 1000
0
1
2
3
4
5
6
t/q
t (m
in g
g-1)
t (min)
y = 0.00571x + 0.00221
=0.9999

S–18
References
S1. Lee, K. M.; Kim, H. J.; Kang, C.-S.; Tojo, T.; Chae, J. A.; Oh, Y.; Cha, M. C.;
Yang, K. S.; Kim, Y. A.; Kim, H. Preparation of carbon-containing, compressible,
microporous, polymeric monoliths that regulate macroscopic conductivity. Polym.
Chem. 2019, 10, 852–859.
S2. Chen, C.-H.; Lee, S.-L.; Lim, T.-S.; Chen, C.-h.; Luh, T.-Y. Influence of polymer
conformations on the aggregation behaviour of alternating dialkylsilylene-[4,4′-
divinyl(cyanostilbene)] copolymers. Polym. Chem. 2011, 2, 2850–2856.
S3. Upamali, K. A. N.; Estrada, L. A.; De, P. K.; Cai, X.; Krause, J. A.; Neckers, D. C.
Carbazole-Based Cyano-Stilbene Highly Fluorescent Microcrystals. Langmuir
2011, 27, 1573–1580.

S–19
NMR Spectra
Figure S18. 1H NMR spectrum of 2.
Figure S19. 1H NMR spectrum of 4.


![[CH{(CH CN-2,6-iPr C H GeSeP(C H ], (2). · (CH. Me. 2), 21.7 (NC. Me). 31. P{1. H} NMR (161.72 MHz, CDCl. 3, 303K): δ 0.7. 77. Se NMR (76.19 MHz, CDCl. 3, 303K): δ −91 (d, J](https://img.dokumen.tips/doc/110x75/5fa206c227a0493a9e62fe33/chch-cn-26-ipr-c-h-gesepc-h-2-ch-me-2-217-nc-me-31-p1-h.jpg)

![OH H CH H NMR (400 MHz, CDClS14 13C NMR (100 MHz, CDCl 3) CH3 H H3C H OH OH 4 200 150 100 50 0 [ppm] [rel] 0 5 10 15 20 "Lythgoe Diol" 3 1 C:\Users\hovseps\nmr-data](https://img.dokumen.tips/doc/110x75/5e5b3773baf0484464418a49/oh-h-ch-h-nmr-400-mhz-s14-13c-nmr-100-mhz-cdcl-3-ch3-h-h3c-h-oh-oh-4-200-150.jpg)