Embed Size (px)
Citation preview

Supporting Information Taygerly, Miller, Yee and Peterson
Page 1
Figure 4. Green Chromatography Solvent Selection Guide. Starting from the appropriate DCM/MeOH concentration, compare vertically across the barchart to identify greener solvent mixtures of similar eluting ability. For example, if a compound suitably elutes in 5% DCM/MeOH in the absence of anadditive, the “Neutral Compounds” bar chart predicts that 60% 3:1 EtOAc:EtOH in heptanes or 40% of i-PrOH in heptanes would be suitable startingpoints to evaluate greener solvent alternatives.
Electronic Supplementary Material (ESI) for Green ChemistryThis journal is © The Royal Society of Chemistry 2012
Supporting Information Taygerly, Miller, Yee and Peterson
Page 2
A Convenient Guide for the Selection of Green Chromatography Solvents
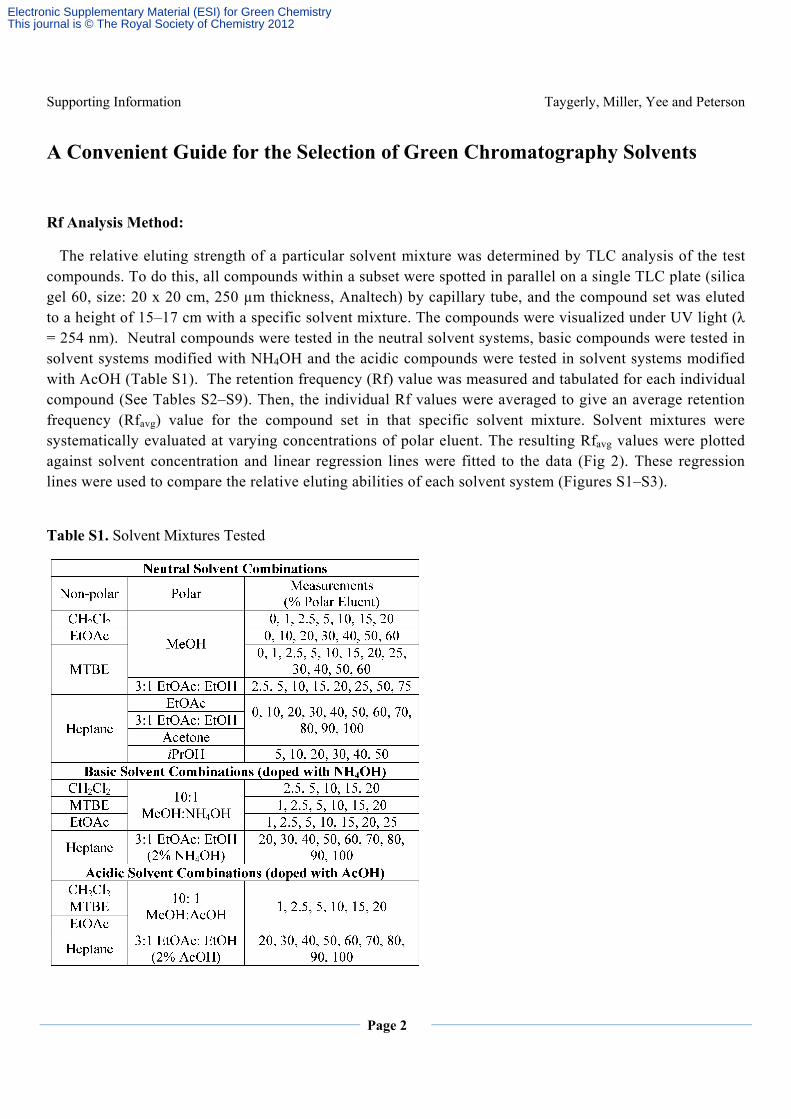
Rf Analysis Method:
The relative eluting strength of a particular solvent mixture was determined by TLC analysis of the test compounds. To do this, all compounds within a subset were spotted in parallel on a single TLC plate (silica gel 60, size: 20 x 20 cm, 250 µm thickness, Analtech) by capillary tube, and the compound set was eluted to a height of 15–17 cm with a specific solvent mixture. The compounds were visualized under UV light (λ = 254 nm). Neutral compounds were tested in the neutral solvent systems, basic compounds were tested in solvent systems modified with NH4OH and the acidic compounds were tested in solvent systems modified with AcOH (Table S1). The retention frequency (Rf) value was measured and tabulated for each individual compound (See Tables S2–S9). Then, the individual Rf values were averaged to give an average retention frequency (Rfavg) value for the compound set in that specific solvent mixture. Solvent mixtures were systematically evaluated at varying concentrations of polar eluent. The resulting Rfavg values were plotted against solvent concentration and linear regression lines were fitted to the data (Fig 2). These regression lines were used to compare the relative eluting abilities of each solvent system (Figures S1–S3).
Table S1. Solvent Mixtures Tested
Electronic Supplementary Material (ESI) for Green ChemistryThis journal is © The Royal Society of Chemistry 2012

Supporting Information Taygerly, Miller, Yee and Peterson
Page 3
Figure S1. Rfavg values for the neutral compound set tested in neutral solvent systems at increasing concentrations of polar eluent. Linear regression lines can be used to compare relative solvent eluting strength at different solvent concentrations.
Electronic Supplementary Material (ESI) for Green ChemistryThis journal is © The Royal Society of Chemistry 2012
Supporting Information Taygerly, Miller, Yee and Peterson
Page 4
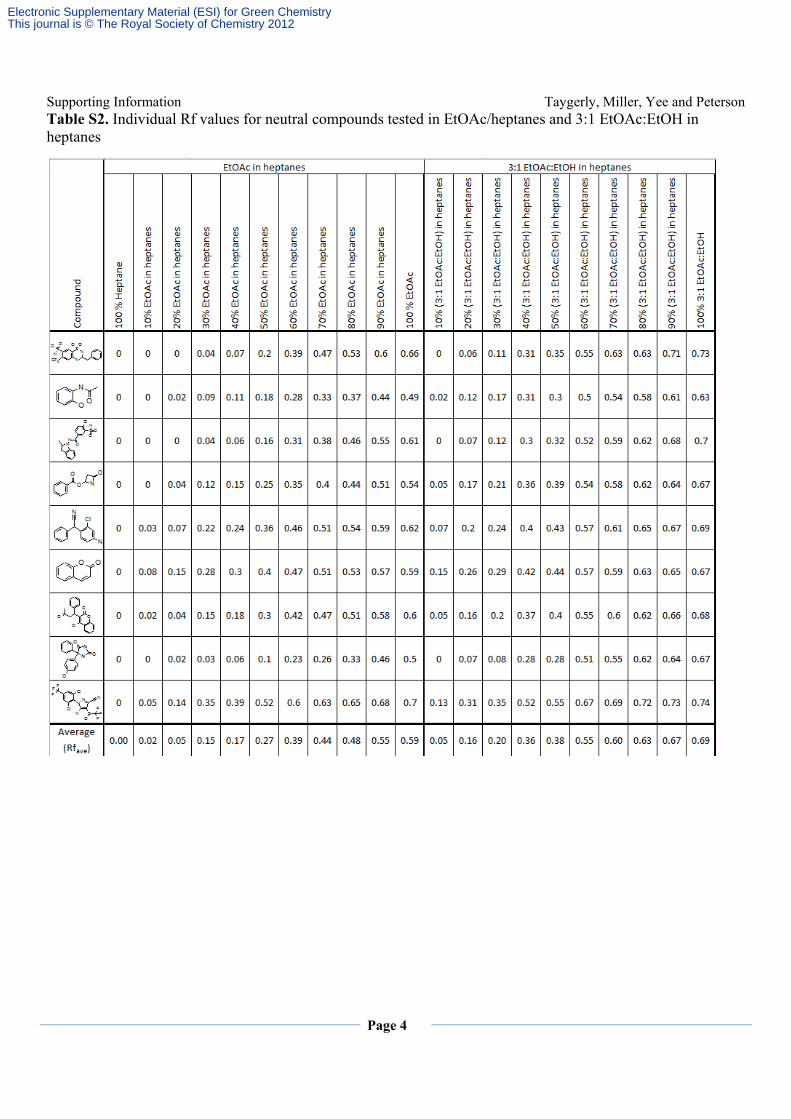
Table S2. Individual Rf values for neutral compounds tested in EtOAc/heptanes and 3:1 EtOAc:EtOH in heptanes
Electronic Supplementary Material (ESI) for Green ChemistryThis journal is © The Royal Society of Chemistry 2012
Supporting Information Taygerly, Miller, Yee and Peterson
Page 5
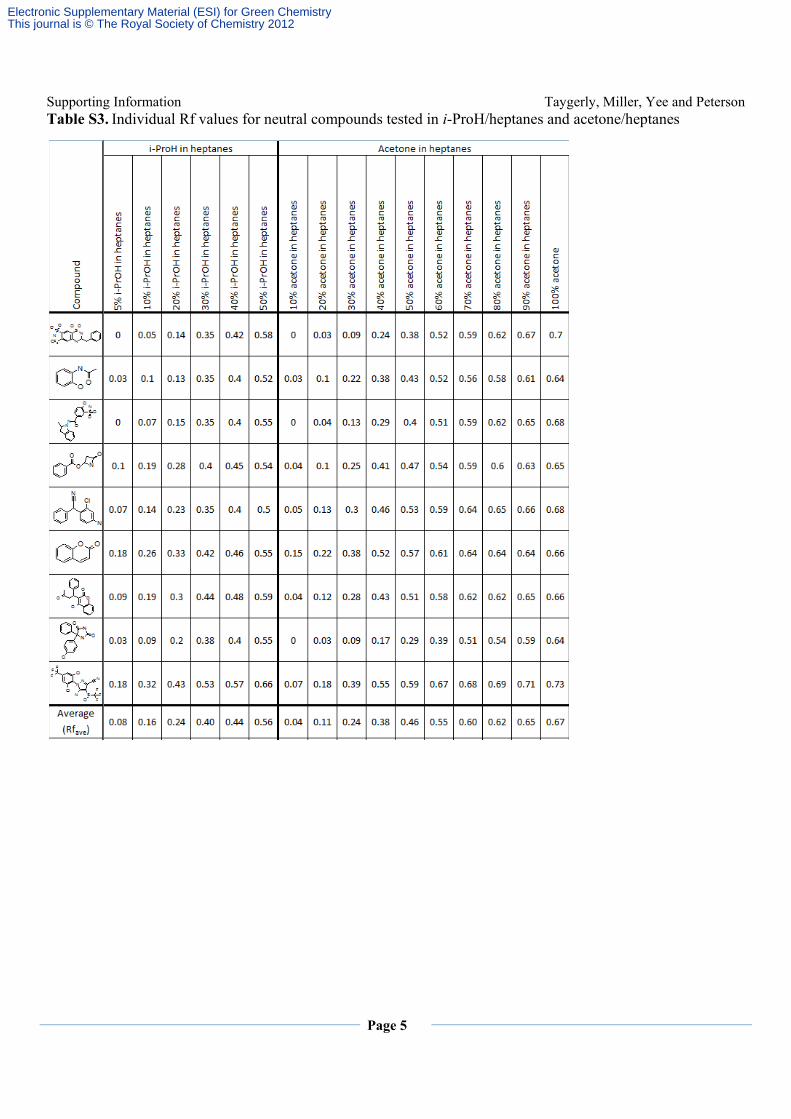
Table S3. Individual Rf values for neutral compounds tested in i-ProH/heptanes and acetone/heptanes
Electronic Supplementary Material (ESI) for Green ChemistryThis journal is © The Royal Society of Chemistry 2012
Supporting Information Taygerly, Miller, Yee and Peterson
Page 6
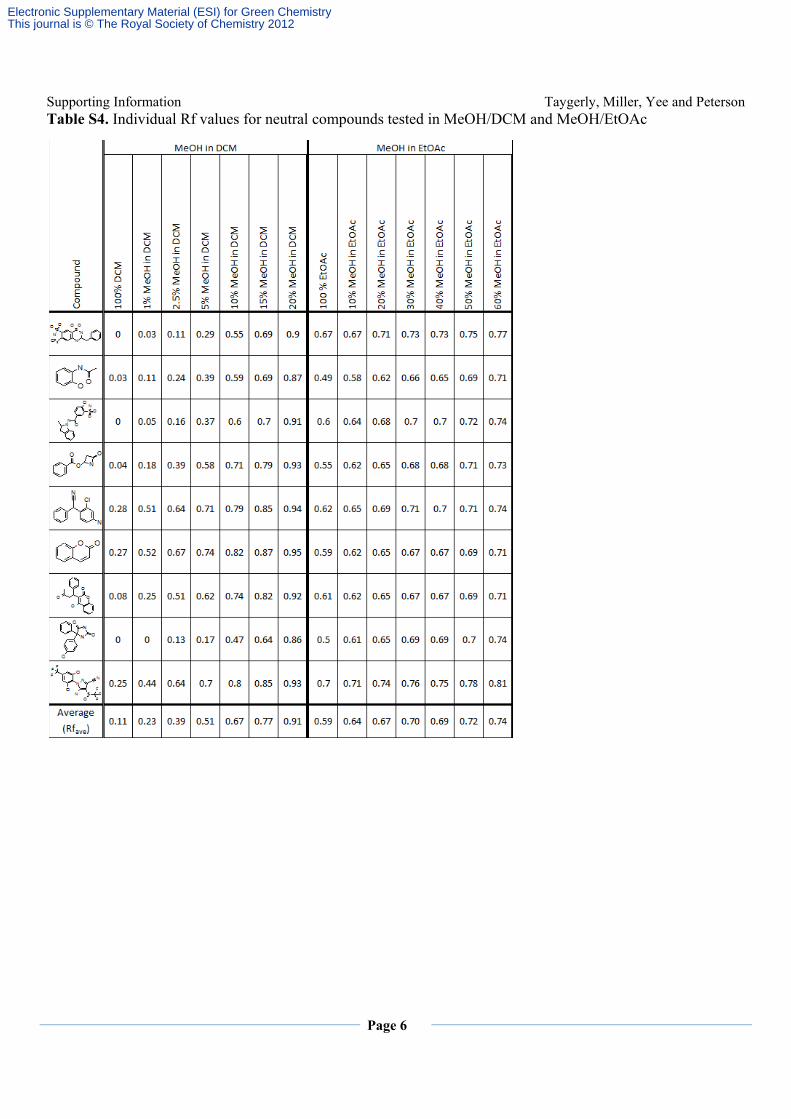
Table S4. Individual Rf values for neutral compounds tested in MeOH/DCM and MeOH/EtOAc
Electronic Supplementary Material (ESI) for Green ChemistryThis journal is © The Royal Society of Chemistry 2012

Supporting Information Taygerly, Miller, Yee and Peterson
Page 7
Table S5. Individual Rf values for neutral compounds tested in MeOH/MTBE and 3:1 EtOAc:EtOH in MTBE
Electronic Supplementary Material (ESI) for Green ChemistryThis journal is © The Royal Society of Chemistry 2012

Supporting Information Taygerly, Miller, Yee and Peterson
Page 8
Figure S2. Rfavg values for the basic compound set tested in solvent systems modified with NH4OH at increasing concentrations of polar eluent. Linear regression lines can be used to compare relative solvent eluting strength at different solvent concentrations.
Electronic Supplementary Material (ESI) for Green ChemistryThis journal is © The Royal Society of Chemistry 2012
Supporting Information Taygerly, Miller, Yee and Peterson
Page 9
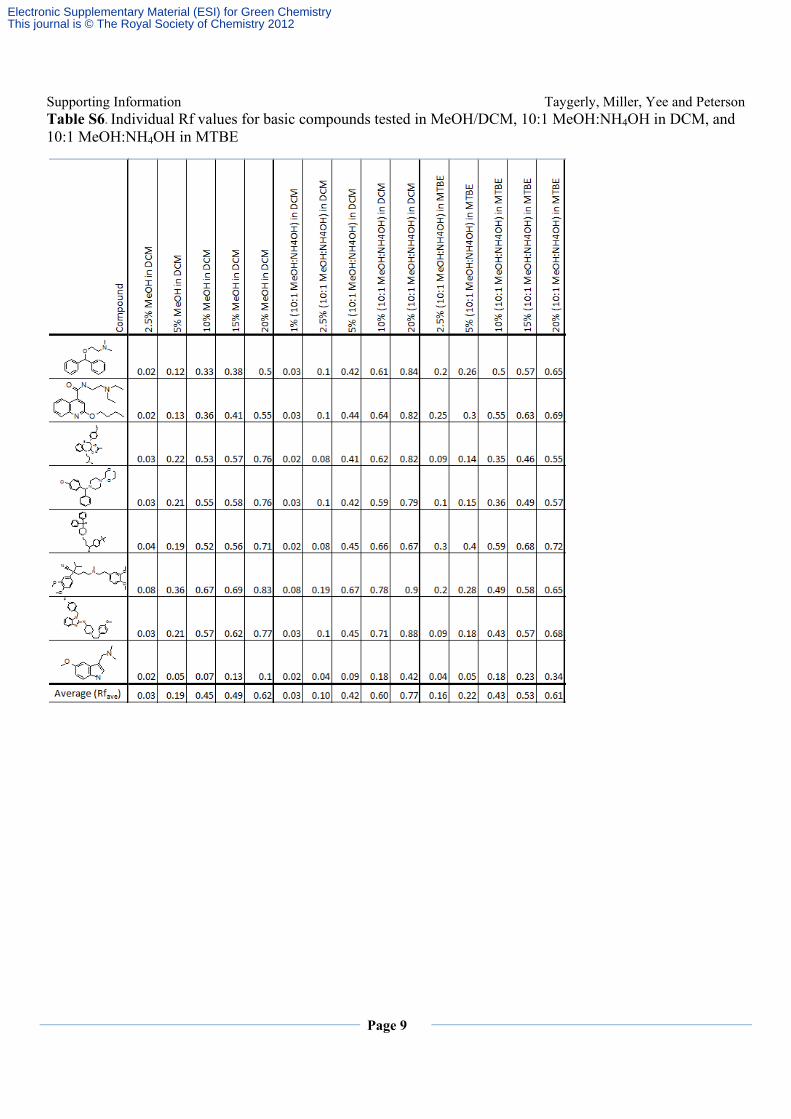
Table S6. Individual Rf values for basic compounds tested in MeOH/DCM, 10:1 MeOH:NH4OH in DCM, and 10:1 MeOH:NH4OH in MTBE
Electronic Supplementary Material (ESI) for Green ChemistryThis journal is © The Royal Society of Chemistry 2012

Supporting Information Taygerly, Miller, Yee and Peterson
Page 10
Table S7. Individual Rf values for basic compounds tested in 3:1 EtOAc:EtOH(modified with 2% NH4OH) and 10:1 MeOH:NH4OH in EtOAc.
Electronic Supplementary Material (ESI) for Green ChemistryThis journal is © The Royal Society of Chemistry 2012

Supporting Information Taygerly, Miller, Yee and Peterson
Page 11
Figure S3. Rfavg values for the acidic compound set tested in solvent systems modified with AcOH at increasing concentrations of polar eluent. Linear regression lines can be used to compare relative solvent eluting strength at different solvent concentrations.
Electronic Supplementary Material (ESI) for Green ChemistryThis journal is © The Royal Society of Chemistry 2012
Supporting Information Taygerly, Miller, Yee and Peterson
Page 12
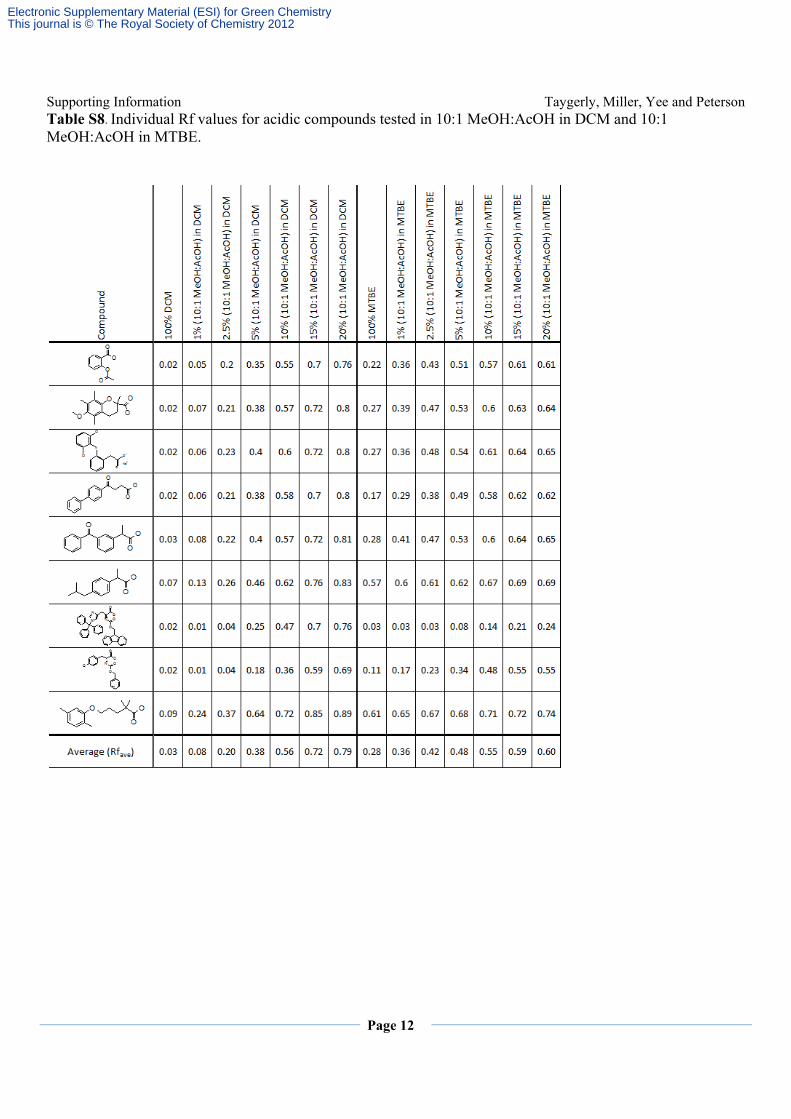
Table S8. Individual Rf values for acidic compounds tested in 10:1 MeOH:AcOH in DCM and 10:1 MeOH:AcOH in MTBE.
Electronic Supplementary Material (ESI) for Green ChemistryThis journal is © The Royal Society of Chemistry 2012
Supporting Information Taygerly, Miller, Yee and Peterson
Page 13
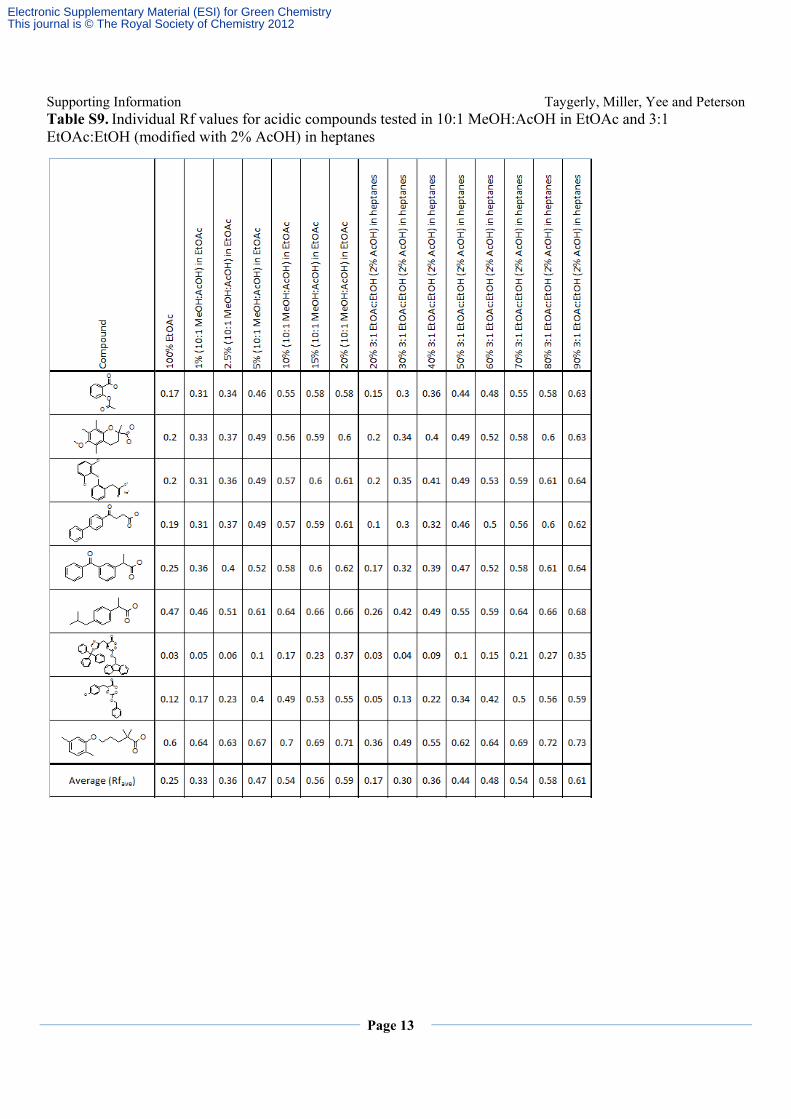
Table S9. Individual Rf values for acidic compounds tested in 10:1 MeOH:AcOH in EtOAc and 3:1 EtOAc:EtOH (modified with 2% AcOH) in heptanes
Electronic Supplementary Material (ESI) for Green ChemistryThis journal is © The Royal Society of Chemistry 2012