Embed Size (px)
Citation preview

Supporting Information
Oxidation-responsive micelles by a one-pot polymerization-induced self-assembly approach
Fabian H. Sobotta,a,b, Franziska Hausig, a,b Dominic Harz, a Stephanie Hoeppener,a,b Ulrich
S. Schubert, a,b Johannes C. Brendel,a,b,*
aLaboratory of Organic and Macromolecular Chemistry (IOMC), Friedrich Schiller University
Jena, Humboldtstrasse 10, 07743 Jena, Germany.
bJena Center for Soft Matter (JCSM), Friedrich Schiller University Jena, Philosophenweg 7,
07743 Jena, Germany.
*Correspondence to J. C. Brendel ([email protected])
Electronic Supplementary Material (ESI) for Polymer Chemistry.This journal is © The Royal Society of Chemistry 2018

Results
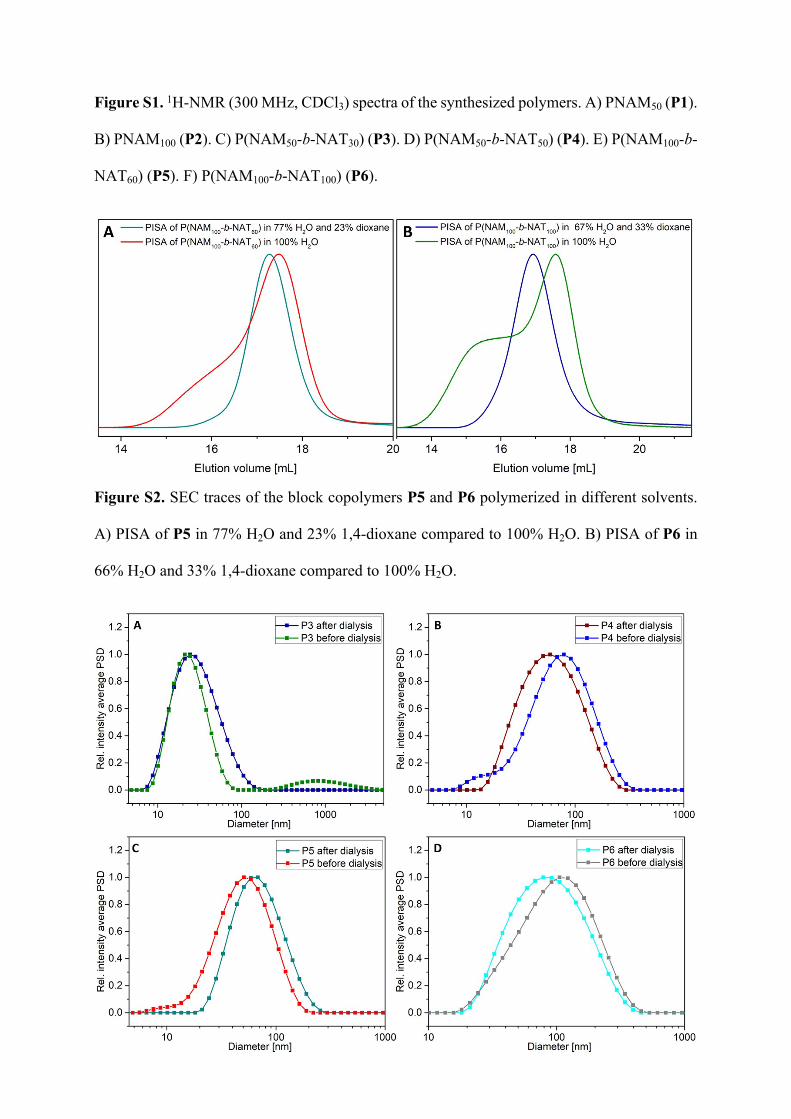
Figure S1. 1H-NMR (300 MHz, CDCl3) spectra of the synthesized polymers. A) PNAM50 (P1).
B) PNAM100 (P2). C) P(NAM50-b-NAT30) (P3). D) P(NAM50-b-NAT50) (P4). E) P(NAM100-b-
NAT60) (P5). F) P(NAM100-b-NAT100) (P6).
Figure S2. SEC traces of the block copolymers P5 and P6 polymerized in different solvents.
A) PISA of P5 in 77% H2O and 23% 1,4-dioxane compared to 100% H2O. B) PISA of P6 in
66% H2O and 33% 1,4-dioxane compared to 100% H2O.

Figure S3. DLS analysis (n = 3, c ~ 1 mg mL-1) of the micelles P3 (A), P4 (B), P5 (C) and P6
(D) before and after dialysis.
Figure S4. CMC of the nanostructures determined by fluorescence quenching of Nile red. The
CMC was determined as the point of intersection of the linear plots in the emission intensity
versus log c spectrum.

Figure S5. Evaluation of the toxicity and uptake behavior of the synthesized micelles. A)
Cytotoxicity assay of the polymers P3–P6 and of the oxidized form P(NAM50-b-NATOx30).
Non-treated cells served as 100% relative viability. L929 cells were treated 24 h with the
indicated concentrations of the polymers. Values represent the mean ± S.D. (n=3). B) Uptake
study on P(NAM50-b-NAT30) (P3) with encapsulated Nile red. HEK cells were treated at 4 and
37 °C and at 5 min, 4 and 24 h with the indicated concentrations of the polymer. Values
represent the mean ± S.D. (n=3).
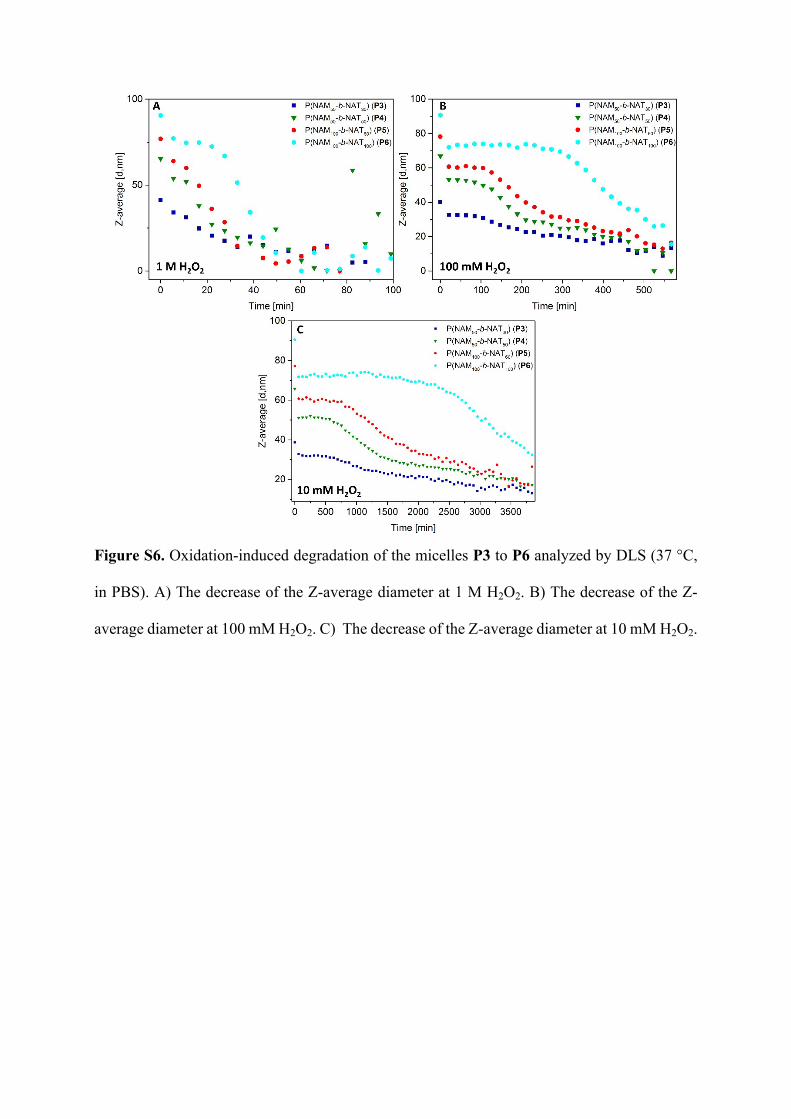
Figure S6. Oxidation-induced degradation of the micelles P3 to P6 analyzed by DLS (37 °C,
in PBS). A) The decrease of the Z-average diameter at 1 M H2O2. B) The decrease of the Z-
average diameter at 100 mM H2O2. C) The decrease of the Z-average diameter at 10 mM H2O2.
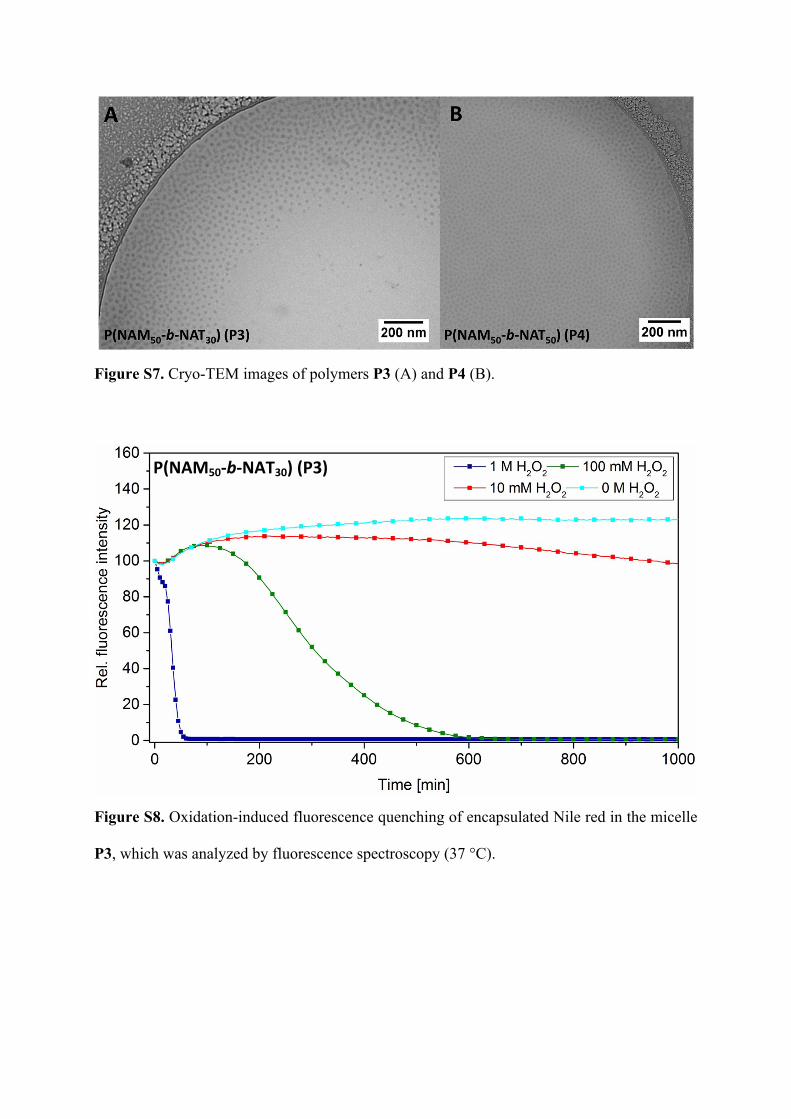
Figure S7. Cryo-TEM images of polymers P3 (A) and P4 (B).
Figure S8. Oxidation-induced fluorescence quenching of encapsulated Nile red in the micelle
P3, which was analyzed by fluorescence spectroscopy (37 °C).
P(NAM50-b-NAT30) (P3)

Figure S9. Oxidation-induced fluorescence quenching of encapsulated Nile red in the micelle
P4, which was analyzed by fluorescence spectroscopy (37 °C).
Figure S10. Oxidation-induced fluorescence quenching of encapsulated Nile red in the micelle
P5, which was analyzed by fluorescence spectroscopy (37 °C).
P(NAM50-b-NAT50) (P4)
P(NAM100-b-NAT60) (P5)
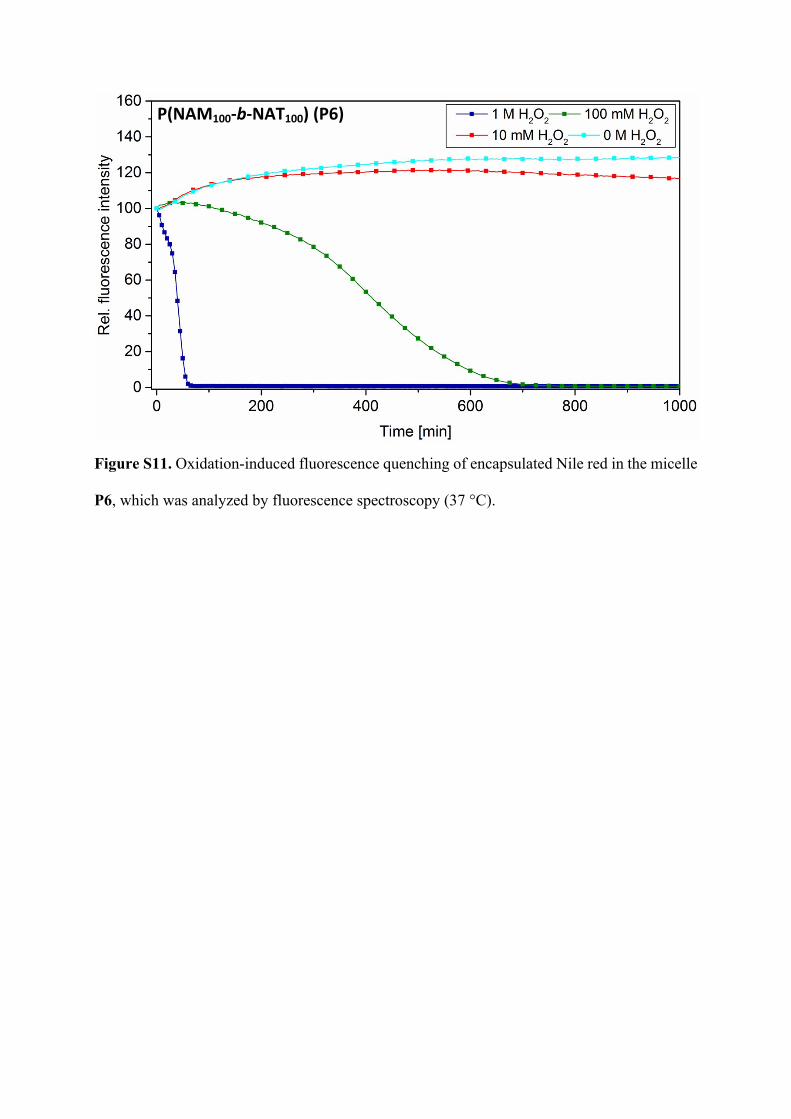
Figure S11. Oxidation-induced fluorescence quenching of encapsulated Nile red in the micelle
P6, which was analyzed by fluorescence spectroscopy (37 °C).
P(NAM100-b-NAT100) (P6)


![Electronic Supporting Information - rsc.org fileS1 Electronic Supporting Information Theoretical Insights into the Metal-free and Formal [2+2+2] Cycloaddition Strategy via Intramolecular](https://img.dokumen.tips/doc/110x75/5cae07a088c99383228c0156/electronic-supporting-information-rsc-electronic-supporting-information-theoretical.jpg)