Embed Size (px)
Citation preview

S1
Supporting Information for
Renewable Thermoset Polymers Based on Lignin and Carbohydrate
Derived Monomers
Yuan Jiang ab, Duanchen Ding ab, Shou Zhao c, Hanyu Zhu ab, Hilkka I Kenttämaaab, Mahdi M
Abu-Omar bc
a Brown Laboratory, Department of Chemistry, Purdue University, 560 Oval Drive, West
Lafayette, IN 47907, United States
b The Center for Direct Catalytic Conversion of Biomass to Biofuels (C3Bio), Purdue University,
Discovery Park, 1203 West State Street, West Lafayette, IN 47907, United States
c Department of Chemistry & Biochemistry, University of California Santa Barbara, Santa
Barbara, CA 93106-9510, United States
E-mail: [email protected]
Electronic Supplementary Material (ESI) for Green Chemistry.This journal is © The Royal Society of Chemistry 2018

S2
Contents
Experimental section ..................................................................................................................................S3
NMR spectra of bisphenol-HMF trinuclear compound (MH) ....................................................................S5
NMR spectra of bisphenol-furfural trinuclear compound (MF) .................................................................S7
NMR spectra of bisphenol-HMF-tetra-epoxide (MHE)..............................................................................S9
NMR spectra of bisphenol-furfural-tetra-epoxide (MFE).........................................................................S11
HPLC and high resolution mass spectra of bisphenol-furan trimers and corresponding epoxides ...........S13
References ................................................................................................................................................S16

S3
Experimental section
Materials. Furfural (FF, Sigma-Aldrich, 99%), 5-hydroxymethylfufural (HMF, Sigma-Aldrich, 99%), 4-methylcatechol (Sigma-Aldrich, 95%), epichlorohydrin (ECH, Sigma-Aldrich, 99%), tetrabutylammonium bromide (TBAB, Sigma-Aldrich, 98%), and diethylenetriamine (DETA, Sigma-Aldrich, 99%), were used as received. Methanol, ethanol, acetonitrile, and all other solvents used were obtained from commercial sources (Fisher and Sigma-Aldrich) and used without further purification.
Analysis methods. All the crude products were analyzed by Agilent 1260 Infinity Quaternary High-Performance Liquid Chromatography (HPLC) at 30 °C using a XDB-C18 column (250 x 74.6mm) for purity and conversion tests. A UV detector was set at a wavelength of 280 nm. A mixture of acetonitrile and H2O was used as the mobile phase at a flow rate of 0.5 mL/min. A gradient with a dynamic volumetric concentration of acetonitrile was designed starting from 20% at 0 min, ramping to 50% at 20 min, and then 80% at 55 min.
Proton and carbon as well as two-dimensional nuclear magnetic resonance (1H NMR, 13C NMR, and HMQC) analysis was performed using a Bruker AV-III-800 MHz spectrometer equipped with a 5 mm TXI probe to confirm chemical structures of condensation products and monomers. Acetone-d6 was used as the solvent for bisphenol-furan trimers, and deuterated chloroform for bisphenol-furan-epoxides.
FTIR spectra were collected with a Thermo-Nicolet Nexus 470 FTIR spectrometer using an attenuated total reflectance (ATR) sampling accessory. Spectra were recorded over a wavenumber range of 400−4000 cm−1 at a 4 cm−1 resolution. A background spectrum was collected each time before a sample was processed.
Mass spectrometric data (MS and HPLC-MS) were obtained on a Thermo Scientific LTQ Orbitrap mass spectrometer with electrospray ionization (ESI). For direct injection mass spectrometric analysis, all the substrates were doped with 1 % aqueous NaOH solution. The solutions were directly introduced into the ESI source by using a Hamilton gas-tight syringe at a flow rate of 20 µL min-1. The bisphenol-furan trinuclear compounds were detected under negative mode, while the epoxides were detected under positive mode after the addition of 2 equivalents of 1 % aqueous formic acid solution into the samples. [M-H]- and [M+Na]+ were the predominant ions observed in the negative and positive ion experiments, respectively. For HPLC-MS, HPLC eluents were mixed with 1 % aqueous NaOH solution through a tee connector before entering the ionization source. The electrospray voltage, lens voltage, injection flow rate and gas flow rate parameters were tuned for each different sample. The ion transfer capillary temperature was set to 275 °C. The most abundant ion formed upon ESI was subjected to isolation and collision-activated dissociation (CAD) to further confirm the structure. An isolation width of 1.5 m/z was chosen, and the collision energy was set to keep the height of the parent ion peak

S4
between 10 - 15% of the height of the base peak after CAD. All mass spectra are averages of 20 scans.
Preparative HPLC was carried out at room temperature on a Waters Prep LC 4000 preparative chromatography system with acetonitrile and water eluents. The gradient started from 15% of acetonitrile and slowly increased to 50 % acetonitrile in 40 min, followed by ramping to 95 % in another 15 min. UV detector was applied at 280 nm to monitor the products.
Differential scanning calorimetry (DSC) measurements were carried out on a PerkinElmer Jade DSC 4000 under nitrogen flow. A small amount (5-10 mg) of a mixture of epoxy monomer and DETA (the epoxy : NH ratio is 1 : 1) was placed inside a sealed aluminum plate and heated from 20 to 150 °C with a heating rate of 10 °C/min. A cooling rate of 5 °C/min was carried out right after the temperature reached 200 °C. When the sample was cooled to 20 °C, the heating process was repeated. Integrations of DSC peaks were done by using a baseline. The glass transition temperature (Tg) is taken at the inflection point of the curve.
Dynamic mechanical analysis (DMA) was performed in single-cantilever mode using a DMA 2980 from TA Instruments. The polymer materials were cast into rubber molds with rectangular dimensions of 30 mm x 10 mm x 2 mm. The tests were carried out by heating the mixtures from 45 to 165 °C with a rate of 3 °C/min. The α transition of the polymer materials was studied as the temperature corresponding to tan δ (loss modulus/storage modulus).
Thermogravimetric analysis (TGA) was performed on a TGA Q500 from TA Instruments. Small loads of polymer powder samples (15-20 mg) were placed into platinum pans. The samples were heated from 30 to 600 °C at a ramp rate of 20 °C/min under a nitrogen flow of 40 mL/min.
Density was measured from polymer’s mass and volume. The mass of the sample is measured by weighing it on a balance. The volume of the polymer sample is determined based on hydrostatic weighing method using Archimedes’ Principle.1 The sample is weighed both in air and while submerged in water. The volume of the sample is calculated by the difference of weight divided by the difference of density between air and water. The density of air under ambient conditions is about 0.0012 g/cm3.
Water absorption was measured using ASTM D570 standard method.2 The polymer samples were completely immersed in a flask of distilled water maintained at room temperature. At the end of 8 h, 24 h, and 54 h, the specimens were removed from water. All surface water of the specimens was wiped off and weighed immediately.

S5
NMR spectra of bisphenol-HMF trinuclear compound (MH)
Fig. S1 Proton NMR spectrum and assignment of bisphenol-HMF trinuclear compound, solvent: aceton-d6.
Fig. S2 Carbon NMR spectrum and assignment of bisphenol-HMF trinuclear compound, solvent: aceton-d6.

S6
Fig. S3 HMQC spectrum of bisphenol-HMF trinuclear compound, solvent: aceton-d6.

S7
NMR spectra of bisphenol-furfural trinuclear compound (MF)
Fig. S4 Proton NMR spectrum and assignment of bisphenol-furfural trinuclear compound, solvent: aceton-d6.
Fig. S5 Carbon NMR spectrum and assignment of bisphenol-furfural trinuclear compound, solvent: aceton-d6.

S8
Fig. S6 HMQC spectrum of bisphenol-furfural trinuclear compound, solvent: aceton-d6.

S9
NMR spectra of bisphenol-HMF-tetra-epoxide (MHE)
Fig. S7 Proton NMR spectrum and assignment of bisphenol-HMF-tetra-epoxide, solvent: chloroform-d.
Fig. S8 Carbon NMR spectrum and assignment of bisphenol-HMF-tetra-epoxide, solvent: chloroform-d.

S10
Fig. S9 Carbon NMR spectrum of bisphenol-HMF-tetra-epoxide, solvent: chloroform-d.
S11
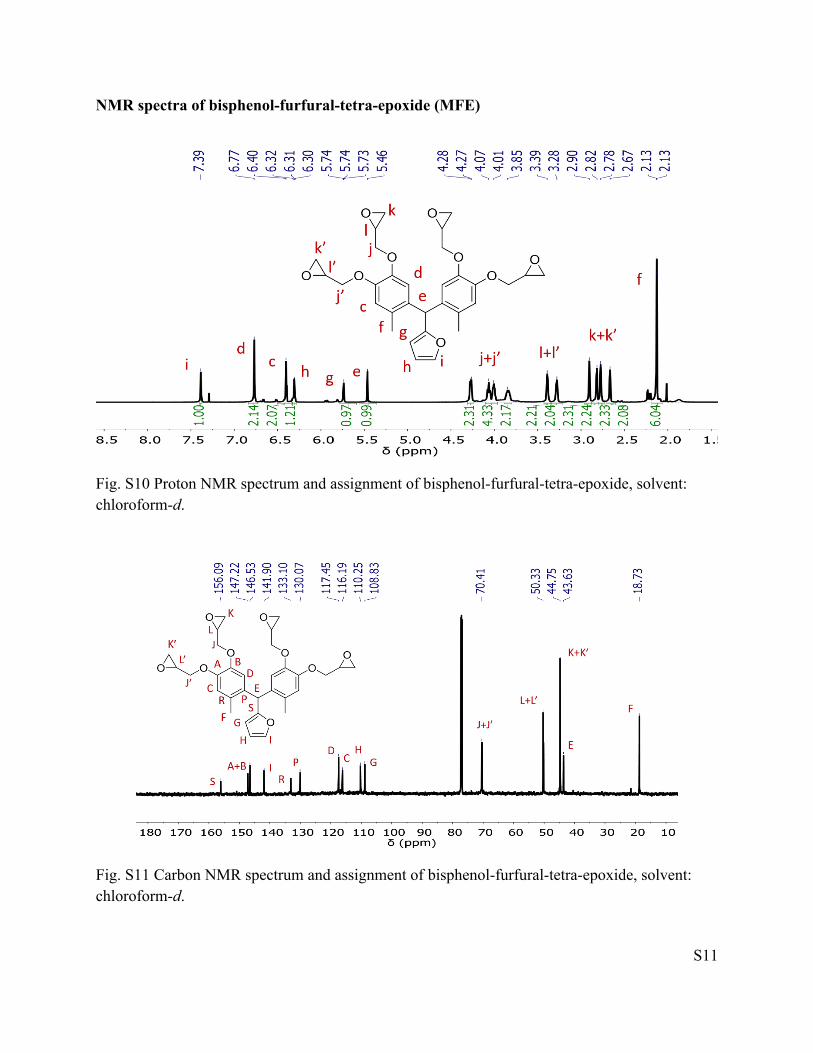
NMR spectra of bisphenol-furfural-tetra-epoxide (MFE)
Fig. S10 Proton NMR spectrum and assignment of bisphenol-furfural-tetra-epoxide, solvent: chloroform-d.
Fig. S11 Carbon NMR spectrum and assignment of bisphenol-furfural-tetra-epoxide, solvent: chloroform-d.

S12
Fig. S12 Carbon NMR spectrum of bisphenol-furfural-tetra-epoxide, solvent: chloroform-d.

S13
HPLC and high resolution mass spectra of bisphenol-furan trimers and corresponding epoxides
Fig. S13 HPLC spectra of crude products (containing unreacted reagents, products, and byproducts). The reactions were to synthesize (a) methylcatechol-HMF trimer (MH), (b) methylcatechol-furfural trimer (MF), (c) methylcatechol-HMF-epoxy (MHE), and (d) methylcatechol-furfural-epoxy (MFE). In the panel a and b, the starting materials are located at 6.5 min (HMF), 10.5 min (furfural), and 14.7 min (4-methylcatechol). The products are at 17.2 min (MH) and 23.4 min (MF). All the epoxide products and ring-closing byproducts (including those derived from 4-methylcatechol) are located between 22 to 39 min. In panel c and d, the peaks at 22.5 and 26.4 min are assigned to 4-methylcatechol ring-closing benzodioxane regioisomers and epoxy derivative, respectively. In panel c, 25.5 and 27.1 min are attributed to benzodioxane regioisomers of the epoxidation reaction, while 29.2 min stands for the tetra-epoxide product. As for panel d, both 34.5 and 36.5 min are the benzodioxane regioisomers of MF, the dominating 39.2 min peak represents the target product MFE. Multiple peaks are observed because of the existence of diastereomers.

S14
Fig. S14 HPLC/high resolution (-)ESI-MS analysis of purified product MH.
Fig. S15 HPLC/high resolution (-)ESI-MS analysis of purified product MF.

S15
Fig. S16 HPLC/high resolution (+)ESI-MS analysis of purified product MHE-tetra-epoxide.
Fig. S17 HPLC/high resolution (+)ESI-MS analysis of purified product MFE-tetra epoxide.

S16
References
1. Vladyslav Kholodovych and William J. Welsh, SpringerMaterials, Densities of Amorphous and Crystalline Polymers (Physical Properties of Polymers Handbook), ed. James E. Mark, 2007, DOI: http://materials.springer.com/lb/docs/sm_nlb_978-0-387-69002-5_37l.
2. ASTM D570-98, Standard Test Method for Water Absorption of Plastics, ASTM International, West Conshohocken, PA, 2010, DOI: 10.1520/D0570-98R10E01.