Embed Size (px)
Citation preview
S1
Dynamic and bio-orthogonal protein assembly along a
supramolecular polymer
Katja Petkau-Milroy#, Dana A. Uhlenheuer#, A.J.H. Spiering, Jef A.J.M. Vekemans, Luc Brunsveld*
Supporting Information
Table of Contents Supporting Information ................................................................................................................................ 1
General ...................................................................................................................................................... 2
Synthesis ................................................................................................................................................... 3
Self-assembly ............................................................................................................................................ 7
Functionalization of fluorescent proteins with Discotics .......................................................................... 9
Functionalization of fluorescent proteins with the supramolecular polymer ...................................... 9
Functionalization of SNAP-proteins with supramolecular polymer vs. small ligand .......................... 10
FRET from the Disc to the yellow fluorescent protein (YFP) ............................................................... 11
Inducing protein-protein interactions ................................................................................................ 13
Dynamic intermixing ........................................................................................................................... 14
References .............................................................................................................................................. 16
Electronic Supplementary Material (ESI) for Chemical ScienceThis journal is © The Royal Society of Chemistry 2013

S2
General O-Benzotriazolyl-N,N,N’,N’-tetramethyl-uronium-hexafluoro-phosphate (HBTU) and N,N´-
diisopropylethylamine (DIPEA) and trifluoroacetic acid (TFA) were purchased from Biosolve
(www.biosolve.nl). Dry N,N´-dimethylacetamide (DMA), dry N,N´-dimethylformamide (DMF), dry
triethylamine (TEA), isopropanol and lithium hydroxide monohydrate were purchased from Sigma-
Aldrich (www.sigmaaldrich.com). Oxalyl chloride, 1-chloro-N,N,2-trimethyl-1-propenylamine, and
magnesium sulfate were purchased from Acros (www.acros.be). Deuterated solvents were bought from
Cambridge Isotope Laboratories (www.isotope.com).
All solvents and chemicals were used as received. Water was demineralized prior to use. Chloroform,
tetrahydrofuran (THF), and dichloromethane (DCM) (HPLC grade) were degassed with argon and
purified by passage through activated alumina solvent column prior to use. Analytical thin layer
chromatography (TLC) was carried out using Merck pre-coated silica gel plates (60F-254) using
ultraviolet light irradiation at 254 or 365 nm. Manual column chromatography was carried out using
Merck aluminium oxide (90 active basic, 0.063-0.2 mm). Preparative recycling GPC was performed using
a Shimadzu system equipped with a Shimadzu LC-10ADvp pump, a Jai-Gel 2.5 H and a Jai-Gel 2 H column
in series and a Shimadzu SPD-10AVvp UV/Vis detection system performing detection at 275 nm and 325
nm. HPLC grade chloroform was used as the eluent (with a flow of 3.5 ml/min and manual injection was
performed with a volume of 2 ml. One cycle through the system took 1 h.) Manual size-exclusion
chromatography was performed on BIO RAD BioBeads S-X1 (200-400 mesh) in a long glass column (1.2
m) at atmospheric pressure and a flow rate less than 1 mL/min in DMF.
Matrix assisted laser desorption/ionisation time of flight mass spectra (MALDI-TOF-MS) were measured
on a PerSeptive Biosystems Voyager-DE PRO spectrometer with a Biospectrometry workstation using 2-
[(2E)-3-(4-tert-butylphenyl)-2-methylprop-2-enylidene]malononitrile (DCTB) as matrix material. M/z
values are given in g/mol. Infrared spectra were recorded as a liquid film on a Perkin Elmer Spectrum
One 1600 FT-IR spectrometer, equipped with a Perkin Elmer Universal ATR Sampler Accessory. 1H and 13C NMR spectra were recorded using a Varian Mercury Vx 400 MHz (100 MHz for 13C) NMR
spectrometer at 298 K. Chemical shifts are given in parts per million (ppm) and the spectra are
calibrated to residual solvent signals of CDCl3 (7.26 ppm (1H) and 77.0 ppm (13C)). Splitting patterns are
labeled as s, singlet; d, doublet; dd, double doublet; t, triplet; and m, multiplet.
General LC-MS analysis: samples were analyzed using a Shimadzu SCL-10 AD VP series HPLC coupled to a
diode array detector (Finnigan Surveyor PDA Plus detector, Thermo Electron Corporation) and an Ion-
Trap (LCQ Fleet, Thermo Scientific). Analyses were performed using a reversed phase HPLC column (C4
Jupiter, 150 x 2 mm, 5 µm), using an injection volume of 1-4 μL, a flow rate of 0.20 mL/min and typically
a gradient (20% to 90% in 10 min, held at 90% for 1 more minute) of acetonitrile in water (both
containing 0.1% formic acid) at 298K. Prior to LC-MS the protein samples have been desalted using
DyeEx 2.0 Spin Columns (Qiagen). Deconvolution of mass spectra was performed using the ProMassXcali
software.
Fluorescence spectra were recorded on a Varian Cary Eclipse photoluminescence spectrometer equipped
with a Perkin–Elmer PTP-1 Peltier temperature control system. All fluorescence measurements were
performed in phosphate buffer (25 mM, pH 7.5 containing 50 mM NaCl) in quartz cuvettes of 10 mm
Electronic Supplementary Material (ESI) for Chemical ScienceThis journal is © The Royal Society of Chemistry 2013

S3
light path (Hellma) and 2 mL minimal volume at 20°C. Samples were excited at 410 nm for CFP, 500 nm
for YFP or 340 nm for the discotics. The SNAP-tag fusion proteins were expressed and purified as
described previously.1 Protein concentrations were measured with NanoDrop V3.5.2 using A515 and a
molar extinction coefficient of 84 000 M-1cm-1 for YFP-SNAP2 and A435 and a molar extinction coefficient of
32 5000 M-1cm-1 for CFP-SNAP3. The FRET ratio (YFP/CFP) was calculated by dividing the emission of
YFP at 527 nm and the emission of CFP at 475 nm. The FRET ratio (YFP/Disc) was calculated by dividing
the emission of YFP at 527 nm and the emission of Disc at 494 nm. The change in FRET ratio is defined as
the difference between the FRET ratio at a later measuring point and the FRET ratio at the beginning.
Dynamic and static light scattering experiments were performed on an ALVCGS-3 Compact Goniometer,
in the angular range of 30 to 150 degrees. The incident beam was produced by a HeNe laser operating at
532 nm. The intensity signal was sent to an ALV5000 digital correlator, using a typical acquisition time of
60 s for each angle.
Synthesis
Scheme S1: Synthesis of Benzylguanine-Disc 2.
Compound 34, 45, 56, 77 and 128 were synthesized according to literature.
Electronic Supplementary Material (ESI) for Chemical ScienceThis journal is © The Royal Society of Chemistry 2013

S4
5-Methoxycarbonyl-benzene-1,3-dicarbonyl dichloride (8).
To an ice-cold stirred suspension of 5-methoxycarbonylbenzene-1,3-dicarboxylic acid5 (4, 84.5 mg, 0.377
mmol) in chloroform (2.5 ml) containing one drop of DMF was added dropwise in 15 min a solution of
oxalyl chloride (0.0965 mL, 1.131 mmol) in chloroform (2.5 mL). Then, the reaction mixture was allowed
to reach room temperature and the progress of the reaction was monitored by 1H-NMR. When no
carboxylic acid was left, the mixture was concentrated in vacuo and the residue flushed with dry
dichloromethane leaving a residue (0.098 g) that was used as such in the next step. 1H-NMR (THF-d8):
9.08 (d, J = 2 Hz, 2 H), 9.05 (t, J = 2 Hz, 1 H), 4.11 (s, CO2Me, 3H); 13C-NMR (CDCl3) 166.8, 164.2, 137.6,
136.8, 135.1, 132.8, 53.4.
Methyl 3,5-bis{{3’-{3,4,5-tris[2-(2-{2-[2-(2-methoxyethoxy)-ethoxy]-ethoxy}-ethoxy)-ethoxy]-
benzoylamino}-2,2’-bipyridyl-3-aminocarbonyl}}-benzoate (6).
A solution of crude 5-methoxycarbonyl-1,3-benzenedicarbonyl dichloride 8 (50 mg, 0.384 mmol) in
dichloromethane (1.25 mL) was added dropwise in 5 min to a stirred solution of monoamine 56 (0.40 g,
0.384 mmol) and triethylamine (0.102 mL, 0.768 mmol) in dichloromethane (5 mL) and the reaction was
continued overnight. The mixture was washed with water (3 x 1 mL), the organic layer dried with MgSO4,
filtered and concentrated in vacuo to leave a residue (0.48 g) that was dissolved in chloroform (3 mL).
Purification by column chromatography over alumina (25 g) with chloroform - isopropanol (98:2) gave
after evaporation of the appropriate fractions a residue (0.327 g) still containing monoamine. This
material was dissolved in water (9 mL) and extracted with wet ethyl acetate (4 x 10 mL) to remove most
of the monoamine. The remaining aqueous phase was then extracted with dichloromethane (3x 7.5 mL).
The combined dichloromethane phases were dried over MgSO4, filtered and concentrated in vacuo to
afford the pure ester (225 mg, 52%). IR (ATR): = 3108, 2870, 1730 (COCH3), 1680, 1569, 1099 cm-1. 1H-
NMR (CDCl3): = 15.37 (s, 2H), 14.43 (s, 2H), 9.53 (dd, J = 8.5 and 1.7 Hz, 2H), 9.42 (dd, J = 8.5 and 1.7
Hz, 2H), 9.22 (t, J = 2 Hz, 1 H), 9.03 (d, J = 2 Hz, 2H), 8.89 (dd, J = 4.6 and 1.5 Hz, 2H), 8.46 (dd, J = 3.9 and
1.8 Hz, 2H), 7.58 (dd, 2H), 7.56 (dd, 2H), 7.32 (s, 4H), 4.27 (t, 12 H), 4.12 (s, 3H), 3.9-3.5 (m, 108 H), 3.39
(s, 18 H). 13C-NMR (CDCl3): = 165.8, 165.8, 163.9, 152.7, 142.4, 142.1, 141.6, 141.0, 140.7, 137.6, 137.3,
136.0, 131.4, 131.3, 131.1, 130.4, 130.0, 129.8, 124.5, 124.3, 108.0, 72.45, 71.9, 70.8, 70.6, 70.5, 70.5,
69.7, 69.4, 59.0, 52.7. MALDI-TOF MS: m/z calcd (C110H164N8O42) 2270.20; found 2293.12 [M++Na],
2271.14 [M++H].
3,5-Bis{{3’-{3,4,5-tris[2-(2-{2-[2-(2-methoxyethoxy)-ethoxy]-ethoxy}-ethoxy)-ethoxy]benzoyl- amino}-
2,2’-bipyridyl-3-aminocarbonyl}}-benzoic acid (9).
To a suspension of methyl ester 6 (212.5 mg, 0.093 mmol) in water (5 ml) was added LiOH.H2O (19.5 mg,
0.465 mmol). The mixture was heated at 85°C overnight. Monitoring by 1H-NMR showed the
disappearance of ester. After cooling to room temperature the aqueous phase was extracted with ethyl
acetate (8 x 4 mL) to remove the last traces of monoamine. Then, the aqueous phase was acidified with
Electronic Supplementary Material (ESI) for Chemical ScienceThis journal is © The Royal Society of Chemistry 2013
S5
aqueous oxalic acid to pH 3-4, after which it was extracted with dichloromethane (3 x 4 mL). Drying of
the organic phase with MgSO4 and filtration gave a filtrate that was evaporated to afford the pure acid 9
as a thick oil (170 mg, 80%). IR (ATR): = 3079, 2870, 1729 (C=OOH), 1680, 1568, 1097 cm-1. 1H-NMR
(CDCl3): = 15.31 (s, 2H), 14.47 (s, 2H), 9.48 (dd, J = 8.5 and 1.7 Hz, 2H), 9.33 (dd, J = 8.5 and 1.7 Hz, 2H),
9.06 (t, J = 2 Hz, 1 H), 8.91 (d, J = 2 Hz, 2H), 8.84 (dd, J = 4.6 and 1.5 Hz, 2H), 8.42 (dd, J = 3.9 and 1.8 Hz,
2H), 7.47 (dd, 2H), 7.44 (dd, 2H), 7.29 (s, 4H), 4.24 (t, 12 H), 3.9-3.5 (m, 108 H), 3.39 (s, 18 H). 13C-NMR
(CDCl3): = 166.5, 165.6, 163.7, 152.6, 142.2, 141.8, 141.3, 141.1, 140.5, 137.5, 137.4, 135.6, 131.4,
131.4, 131.0, 130.4, 129.7, 129.5, 124.4, 124.3, 108.0, 72.5, 71.9, 71.9, 70.8, 70.6, 70.6, 70.5, 70.5, 70.5,
70.4, 69.7, 69.4, 59.0. MALDI-TOF MS: m/z calcd (C109H162N8O42) 2256.31; found 2278.99 [M++Na].
3,5-Bis{{3’-{3,4,5-tris[2-(2-{2-[2-(2-methoxyethoxy)-ethoxy]-ethoxy}-ethoxy)-ethoxy]benzoyl- amino}-
2,2’-bipyridyl-3-aminocarbonyl}}-benzolyl chloride (10).
A solution of 1-chloro-N,N,2-trimethyl-1-propenylamine (14.5 mg, 0.11 mmol) in dichloromethane (0.4
mL) was added dropwise in 40 minutes to 9 (0.164 g, 0.073 mmol) dissolved in dry dichloromethane
(1.5 mL). The progress of the reaction was monitored by IR. When no carboxylic acid was left, the
mixture was concentrated in vacuo to remove the excess of 1-chloro-N,N,2-trimethyl-1-propenylamine
and the residue was used as such in the next step. IR (ATR): = 2870, 1759 (C=OCl), 1672, 1568, 1097
cm-1.
Mono-NHBoc-Disc (11).
A solution of crude 10 (0.073 mmol) in dichloromethane (1.2 mL) was added dropwise in 30 min to a
stirred solution of monoamine 77 (0.094g, 0.08 mmol) and triethylamine (15 µL, 0.11 mmol) in
dichloromethane (0.5 mL) and the reaction was continued overnight. The reaction mixture was washed
with 0.1 M aqueous NaOH (2 x 3 mL) and brine (1 x 3 mL). The organic layer was dried with MgSO4,
filtered and concentrated in vacuo. The excess of 7 was removed using size-exclusion chromatography
(Recycling-GPC in chloroform), obtaining pure 11 (191 mg, 77%). IR (ATR): = 2873, 1738, 1715, 1672,
1568, 1097 cm-1. 1H-NMR (CDCl3): 15.53 (s, 3H), 14.49 (s, 3H), 9.60 (d, J = 8.5 Hz, 3H), 9.39 (d, J = 8.5
Hz, 3H), 9.28 (s, 3H), 9.05 (d, J = 4.5 Hz, 3H), 8.52 (d, J = 4.5 Hz, 3H), 7.57 (dd, J = 8.5, 4.5 Hz, 6H), 7.35 (s,
6H), 5.03 (s, 1H, NHBoc), 4.27 (dd, J = 10.8, 5.5 Hz, 18H), 3.90 (t, J = 4.8 Hz, 12H), 3.83 (t, J = 4.8 Hz, 6H),
3.74 (q, J = 4.8 Hz, 18H), 3.70 – 3.59 (m, 110H), 3.53 (dd, J = 10.4, 5.4 Hz, 18H), 3.37 (s, 6H), 3.35 (s, 18H),
3.30 (d, J = 5.2 Hz, 2H, CH2NHBoc), 1.43 (s, 9H). 13C NMR (CDCl3): δ=165.96, 164.25, 156.11 (C=OBoc),
152.88, 142.53, 142.41, 141.68, 141.60, 140.91, 137.67, 137.58, 136.28, 130.71, 130.11, 130.04, 129.71,
124.84, 124.49, 112.73, 108.19, 79.25 (C(CH3)3), 72.65, 72.05, 70.98, 70.81, 70.64, 70.36, 69.87, 69.55,
59.15 (OCH3), 40.55 (CH2NH), 28.57 (CH3). MALDI- TOF MS: m/z calcd (C165H251N13O62) 3408.81; found
3431.68 [M++Na], 3309.18 [(M-Boc)++H].
Mono-NH2-Disc (1).
To a stirring solution of 11 (33.7 mg, 0.099 mmol) in dichloromethane (2 mL) trifluoroacetic acid (TFA,
0.2 mL) was added dropwise and the reaction was continued for 2 h at room temperature before TFA
Electronic Supplementary Material (ESI) for Chemical ScienceThis journal is © The Royal Society of Chemistry 2013
S6
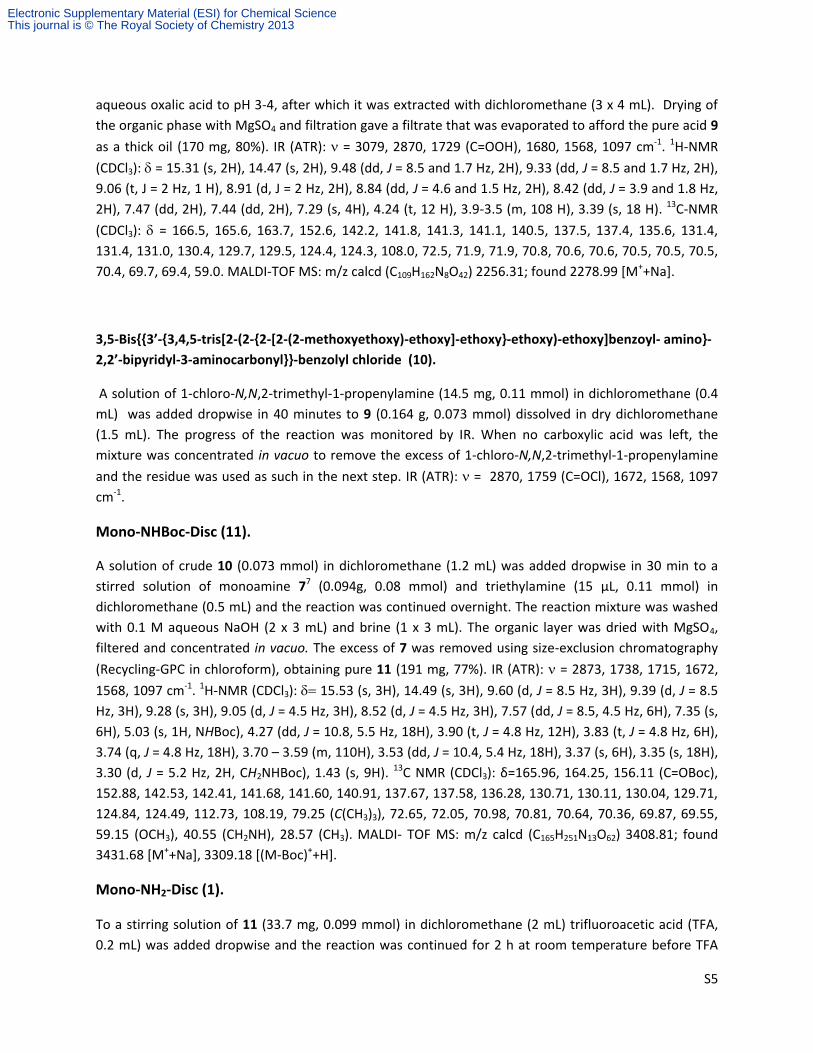
was co-evaporated with toluene. After drying, the pure mono-NH2-Disc 1 was obtained as a sticky yellow
compound (34 mg, quantitative). 1H-NMR (CDCl3): δ= 15.53 (s, 2H), 15.49 (s, 1H), 14.49 (s, 3H), 9.60 (d, J
= 8.5 Hz, 3H), 9.38 (m, 3H), 9.28 (s, 3H), 9.06 (d, J = 3.2 Hz, 3H), 8.52 (d, J = 3.2 Hz, 2H), 8.49 (d, J = 3.2 Hz,
1H), 7.57 (dd, J = 8.5, 4.5 Hz, 6H), 7.36 (s, 4H), 7.33 (s, 2H), 4.28 (dd, J = 10.0, 5.3 Hz, 18H), 3.97 – 3.88
(m, 12H), 3.88 – 3.80 (m, 6H), 3.79 – 3.71 (m, 18H), 3.70 – 3.58 (m, 110H), 3.59 – 3.48 (m, 18H), 3.37 (s,
6H), 3.36 (s, 18H), 3.23 (s, CH2NH2, 2H). 13C NMR (CDCl3): δ= 165.95, 164.23, 152.85, 152.71, 142.42,
142.39, 141.73, 141.68, 141.43, 140.91, 137.65, 137.57, 136.26, 131.20, 130.74, 130.11, 129.70, 124.84,
124.49, 108.12, 107.37, 72.64, 72.03, 71.99, 70.95, 69.99, 69.85, 69.70, 69.51, 69.15, 67.18,
59.14(OCH3), 59.12(OCH3), 40.23(CH2NH2), 29.82(CH3). MALDI- TOF MS: m/z calcd (C160H243N13O60)
3308.69; found 3309.77[M++H], 3331.66 [M++Na].
Figure S 1:1H-NMR of Mono-NHBoc-Disc 11 (top) and Mono-NH2-Disc 1 (bottom) in CDCl3 at 20°C.
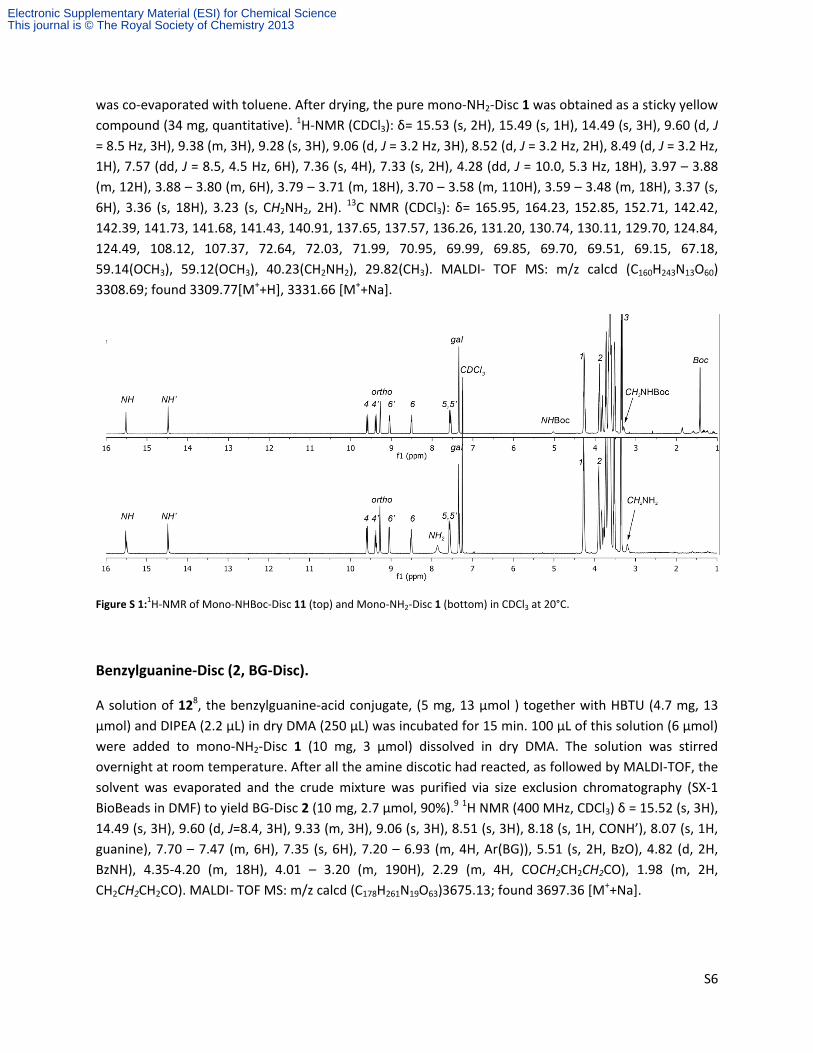
Benzylguanine-Disc (2, BG-Disc).
A solution of 128, the benzylguanine-acid conjugate, (5 mg, 13 µmol ) together with HBTU (4.7 mg, 13
µmol) and DIPEA (2.2 µL) in dry DMA (250 µL) was incubated for 15 min. 100 µL of this solution (6 µmol)
were added to mono-NH2-Disc 1 (10 mg, 3 µmol) dissolved in dry DMA. The solution was stirred
overnight at room temperature. After all the amine discotic had reacted, as followed by MALDI-TOF, the
solvent was evaporated and the crude mixture was purified via size exclusion chromatography (SX-1
BioBeads in DMF) to yield BG-Disc 2 (10 mg, 2.7 µmol, 90%).9 1H NMR (400 MHz, CDCl3) δ = 15.52 (s, 3H),
14.49 (s, 3H), 9.60 (d, J=8.4, 3H), 9.33 (m, 3H), 9.06 (s, 3H), 8.51 (s, 3H), 8.18 (s, 1H, CONH’), 8.07 (s, 1H,
guanine), 7.70 – 7.47 (m, 6H), 7.35 (s, 6H), 7.20 – 6.93 (m, 4H, Ar(BG)), 5.51 (s, 2H, BzO), 4.82 (d, 2H,
BzNH), 4.35-4.20 (m, 18H), 4.01 – 3.20 (m, 190H), 2.29 (m, 4H, COCH2CH2CH2CO), 1.98 (m, 2H,
CH2CH2CH2CO). MALDI- TOF MS: m/z calcd (C178H261N19O63)3675.13; found 3697.36 [M++Na].
Electronic Supplementary Material (ESI) for Chemical ScienceThis journal is © The Royal Society of Chemistry 2013

S7
Figure S 2: gCOSY of BG-Disc 2 in CDCl3 at 20°C.
Self-assembly The self-assembly of C3-symmetrical disc-shaped molecules leads selectively to the formation of
columnar stacks.4,10,11 The self-assembly is based on strong intramolecular hydrogen bonding between
the amide N-H groups and neighboring bipyridine N-atoms. This can be observed experimentally by a
downfield shift in the 1H-NMR (CDCl3) signal corresponding to the amide protons, from normally 6-9
ppm to approximately 15 ppm (Figure S 1).10 The intramolecular hydrogen bonding pre-organizes the
molecules into a propeller-like conformation, which allows the molecules to form long stacks primarily
through π-π stacking.12,13 In apolar or polar aprotic solvents such as chloroform, DCM, THF, and DMF
discotics are typically molecularly dissolved at low concentrations, whereas in polar protic solvents, such
as methanol, ethanol and water, the discotics self-assemble (Kass = 1 x 10⁸ L/mol) and become highly
fluorescent.4,11 The molecularly dissolved and self-assembled state can be visualized using UV/Vis,
fluorescence spectroscopy and dynamic light scattering (DLS) (Figure S 3). Upon self-assembly, a red-
shift in the UV/Vis spectra and an increase in fluorescence intensity can be observed (Figure S 3a & b).
The intrinsic fluorescence with a large Stokes shift of the discotics is attributed to the intramolecular
double proton transfer within the bipyridine-diamine groups.6 Upon self-assembly, due to the decreased
motion of the molecules within the self-assembling structure, the fluorescent lifetime increases from 0.3
to 4 ns.14 No correlation function can be obtained for the molecularly dissolved BG-Disc 2 in DCM. In
Electronic Supplementary Material (ESI) for Chemical ScienceThis journal is © The Royal Society of Chemistry 2013

S8
water, the correlation function of the self-assembled BG-Disc 2 shows that these columnar stacks diffuse
through the solution with the same velocity as a sphere with a radius of 200 nm (Figure S 3d).
Figure S 3: a) Photographs of these disc solutions in water (left) and in DCM (right) both 100 µM under illumination with UV-light (λex = 360 nm); b) Absorption spectra of BG-Disc 2 (100 µM) in H2O and DCM at 20 °C. In the absorption spectrum a red-shift is observed in self-assembled state in water; c) Emission spectra (λex = 350 nm) of BG-Disc 2 (100 µM) in H2O and DCM at 20 °C. In the emission spectrum an increase in emission is observed in the self-assembled state in water. d) DLS correlation functions of BG-Disc 2 (10 µM) in H2O and DCM at 20 °C at 90°. Inset: Cumulant fit of the correlation function of BG-Disc 2 (10 µM) in H2O. For the data on the Inert-Disc see reference 15.
1E-8 1E-7 1E-6 1E-5 1E-4 1E-3 0.01 0.1 1 10
0.0
0.2
0.4
0.6
0.8
1.0
C ()
(ms)
DCM fit for DCM
Water fit for Water
a) b) c)
d)
Electronic Supplementary Material (ESI) for Chemical ScienceThis journal is © The Royal Society of Chemistry 2013

S9
Functionalization of fluorescent proteins with Discotics
Functionalization of fluorescent proteins with the supramolecular polymer
Figure S 4: a) UV spectra of CFP-SNAP and YFP-SNAP (both 160 µM); b) normalized fluorescence spectra of CFP-SNAP (λex = 410 nm) and of YFP-SNAP (λex = 500 nm) both 1 µM1; c) Spectral overlap of fluorescent proteins with the discotics; blue = normalized excitation of CFP-SNAP, dark yellow = normalized excitation of YFP-SNAP, red = emission of BG-Disc.
First the coupling efficiencies were systematically optimized by varying the ligation temperature,
incubation times and coupling stoichiometry (data not shown). The best coupling efficiencies were
achieved using 100 µM BG-Disc 2/Inert-Disc 3 and a total concentration of 10 µM of SNAP-proteins. The
ligation was performed in a sodium phosphate buffer at 37°C in a shaking incubator for up to 3 hours.
The ligation was followed by LC-MS, SDS-PAGE and in case of YFP-SNAP by monitoring FRET from the
discotics to YFP upon covalent attachment. It has to be noted that the self-assembled discotics fall apart
under the ESI-MS conditions and on a denaturing gel.
Table S 1: Expected and found masses of proteins:
protein calculated found
Proteins CFP-SNAP 49151 49155 (± 2)
YFP-SNAP 49237 49240 (± 2)
Proteins reacted with 12 CFP-BG 49385 49387 (± 2)
YFP-BG 49471 49472 (± 2)
Protein-discotic conjugates CFP-Disc 52676 52678 (± 2)
YFP-Disc 52762 52764 (± 4)
a) b)
c)
Electronic Supplementary Material (ESI) for Chemical ScienceThis journal is © The Royal Society of Chemistry 2013

S10
Figure S 5: a) SDS-PAGE gel of CFP- and YFP-SNAP proteins after incubation for 6 hours with buffer, Inert-Disc or BG-Disc. (M= marker, 1= YFP-SNAP, 2=YFP-SNAP + BG-Disc, 3= YFP-SNAP + Inert-Disc, 4= CFP-SNAP, 5= CFP-SNAP + BG-Disc, 6= CFP-SNAP + Inert-Disc). b) LC-MS spectra of these samples (2, 3, 5, and 6) after 6 hours of incubation (TIC, MS and deconvoluted mass). It has to be noted that the self-assembled discotics fall apart under the ESI-MS conditions and on a denaturing gel.
Functionalization of SNAP-proteins with supramolecular polymer vs. small ligand
Since the functionalization is performed in buffer, where the supramolecular polymer is self-assembled,
the proteins are reacting with a highly molecularly crowded scaffold. The SDS-PAGE gel and the LC-MS
spectra after 3 hours of ligation (Figure S 5) show that over 90% of the YFP/CFP-SNAP protein has
reacted with the BG-Disc and only small traces of unreacted protein are still present.
To investigate the reactivity of the protein and to compare the functionalization of the BG-covered
supramolecular polymer with a small BG-molecule, the ligation reaction was as well performed under
the same conditions with 12. The complete functionalization of CFP-SNAP with the small ligand 12 was
achieved during the first 15 minutes of incubation (Figure S 6). In contrast, only 50% of the protein was
functionalized with the supramolecular polymer after the same time period. After 90 minutes around
90% of the protein was functionalized and longer incubation times did not lead to more
functionalization due to the inactivation of the enzyme overtime. In all future experiments the ligation
of CFP-SNAP/YFP-SNAP to 2 was stopped after 3 hours through addition of an excess of 12.
In literature quantitative functionalization of BG-functionalized ligands has often been reported.1
However, for the functionalization of more complex scaffolds lower yields are common.16 For self-
assembled monolayers (SAMs) consisting of BG-thiols mixed with matrix thiols yields of maximum 78%
were observed17, underlining the highly efficient functionalization of the supramolecular polymer
described here.
Electronic Supplementary Material (ESI) for Chemical ScienceThis journal is © The Royal Society of Chemistry 2013

S11
Figure S 6: Comparison between the functionalization of CFP-SNAP (10 µM) with the benzylguanine displaying supramolecular polymer (BG-Disc 2, 100 µM) and with the small benzylguanine ligand 12 (100 µM) at 37 °C.
FRET from the Disc to the yellow fluorescent protein (YFP)
a) b)
Electronic Supplementary Material (ESI) for Chemical ScienceThis journal is © The Royal Society of Chemistry 2013

S12
Figure S 7: a) Reference fluorescence spectra of Inert-Disc (20 µM), YFP-SNAP (2 µM) and a mixture of YFP-SNAP (2 µM) with Inert Disc 3 (20 µM) 4 h after mixing excited at 340 nm. At 340 nm, the excitation wavelength of the Disc, YFP is only excited to a small extent (blue line). Results show no background energy transfer in the presence on Inert Disc. b) The same three samples are excited at 500 nm, the excitation wavelength of YFP, showing the equal concentration of the YFP-SNAP protein present and no excitation of the Inert Disc at this wavelength. c) FRET ratios (from Disc to YFP) from the measurement shown in Figure 2 a&b in the main text.
Figure S 8: Reference fluorescence emission spectra of 1 µM CFP-SNAP and 3 µM BG-Disc 2 (left) and of 1 µM CFP-SNAP and 3 µM Inert Disc 3 (right) followed over time at 20°C. As expected no energy transfer is observed from the Disc to CFP, since the spectral overlap is insignificant (see Figure S 4) and CFP has a much lower quantum yield compared to YFP. Excitation wavelength is 340 nm.
The emission of the BG-Disc as well stays stable upon functionalization with CFP-SNAP indicating that
the functionalization with fluorescent proteins does not affect self-assembly of the discotics. Due to the
excitation of the fluorescent proteins by the laser used in the DLS setup, no DLS measurements could be
conducted of the proteins and of the proteins ligated to the discotics.
c)
Electronic Supplementary Material (ESI) for Chemical ScienceThis journal is © The Royal Society of Chemistry 2013

S13
Figure S 9: UV-spectra of BG-Disc 2 (20 µM) ligated to YFP-SNAP (2 µM) or to CFP-SNAP (2 µM).
The red-shift at 395 nm indicates the presence of the self-assembled state after ligation with proteins.
Inducing protein-protein interactions
Ligation of a 1:1 mixture of CFP-SNAP and YFP-SNAP with BG-Disc or Inert-Disc:
Final volume of ligation reaction is 420 µL, containing 100 µM BG-Disc and a 1:1 mixture of 5 µM CFP-
SNAP and 5 µM YFP-SNAP. After 3 h of shaking at 37°C the reaction was stopped through addition of a
large excess of benzylguanine derivative 12. 400 µL of this ligation reaction was diluted with 1600 µL of
buffer to have a final volume of 2 mL and a final concentration of 20 µM of BG-Disc and 1 µM of each
protein. Under the same conditions the 1:1 mixture of 5 µM CFP-SNAP and 5 µM YFP-SNAP was ligated
to the Inert-Disc (100 µM). The fluorescence spectra were measured at the excitation wavelength of 410
nm at 20°C (Figure 3, main text).
The LC-MS spectra in Figure S 10 belong to Figure 3 in the main text, where the fluorescence of these
ligation mixtures is measured. Deconvoluting the LC-MS peaks at around 7 minutes confirmed the
presence of both proteins in the ligation mixture. The nearly equal intensity of the deconvoluted masses
indicated that both proteins ligated with the same efficiency.
Figure S 10: LC-MS spectra of ligations of a 1:1 mixture of CFP-SNAP (5 µM) and YFP-SNAP (5 µM) with BG-Disc (2, 100 µM) after 3 h.
Electronic Supplementary Material (ESI) for Chemical ScienceThis journal is © The Royal Society of Chemistry 2013

S14
Figure S 11: a) Reference fluorescence emission spectra of 1 µM YFP-SNAP, 1 µM CFP-SNAP and of 20 µM Inert-Disc 3 at 20°C. Excitation wavelength is 410 nm, the excitation wavelength for CFP. At this wavelength only negligible excitation of YFP-SNAP (red trace) and hardly any excitation of the Inert-Disc 3 (blue trace) is observed. b) Normalized reference fluorescence emission spectra (λ ex = 410 nm) of mixtures of BG-Disc and Inert-Disc (both 20 µM) with either CFP-SNAP alone (2 µM) or with a 1:1 mixture of CFP- and YFP-SNAP (each 1 µM). The FRET ratio of CFP-SNAP in presence of either discotic is 0.4. For the mixture of Inert-Disc with CFP-SNAP and YFP-SNAP the FRET ratio increases to 0.48 due to a negligible excitation of YFP at 410 (see Figure S 7). When both proteins are mixed with the BG-Disc, due to energy transfer from CFP to YFP, the FRET ratio increases to 0.68.
Figure S 12: FRET ratio of the time course of 14 h of the ligation mixtures from Figure 3. The red trace corresponds to the 1:1 mixture of YFP-SNAP (1 µM) and CFP-SNAP (1 µM) reacted for 3 h at 37°C with the BG-discotic 2 (20 µM). The red trace corresponds to the 1:1 mixture of YFP-SNAP (1 µM) and CFP-SNAP (1 µM) incubated for 3 h at 37°C with the inert-discotic 3 (20 µM). The constant FRET ratio of the inert-discotic 3 and CFP-/YFP-SNAP mixture shows that the proteins don’t aggregate overtime, whereas the constant FRET ratio of the BG-discotic 2 and CFP-/YFP-SNAP mixture indicates no changes in the structure of the supramolecular polymers.
Dynamic intermixing
Ligation CFP-SNAP or YFP-SNAP with BG-Disc:
Final volume of ligation reaction is 210 µL, containing 100 µM BG-Disc and 10 µM CFP-SNAP. After 3 h of
shaking at 37° C the reaction was stopped through addition of a large excess of benzylguanine derivative
12. Under the same conditions YFP-SNAP was ligated to BG-Disc. 200 µL of each ligation reaction were
mixed and diluted with 1600 µL of buffer to have a final volume of 2 mL and a final concentration of 20
µM of BG-Disc and 1 µM of each protein. The fluorescence spectra were measured every 10 minutes
over the course of 17 h at 10°C at the excitation wavelength of 410 nm.
a) b)
Electronic Supplementary Material (ESI) for Chemical ScienceThis journal is © The Royal Society of Chemistry 2013

S15
Figure S 13: Non-corrected FRET ratios overtime of a mixture of 3 incubated with YFP-SNAP and of 3 incubated with CFP-SNAP (black) and of a mixture of YFP-SNAP ligated to 2 and of CFP-SNAP ligated to 2 (blue). The arrow indicates the time point at which 20 µM of 3 was added to both mixtures. The increase in energy transfer upon addition of 20 µM Inert-Disc is due to background excitation of the discotics at 410 nm (see Figure S 11). In Figure 4 in the main text the FRET ratio is corrected for this background excitation. The red line represents a double exponential growth fit.
Figure S 14: a) Fluorescence emission spectra (exc= 410 nm) over the time course of 17 h of a 1:1 mixture of the two ligations consisting of YFP-SNAP and 2 and of CFP-SNAP and 2 after 3 hours of separate ligation directly after intermixing; t = 0 min (black), t = 1020 min (red). The spectra are normalized to the initial CFP emission at 475 nm. The dashed line shows as the
a) b)
c) d)
Electronic Supplementary Material (ESI) for Chemical ScienceThis journal is © The Royal Society of Chemistry 2013

S16
comparison the emission of the mixture of proteins with the Inert-Disc (see c) where no energy transfer is observed. b)
Fluorescence emission spectra (exc= 410 nm) over the time course of 4 h of the 1:1 mixture of the two ligation shown in a after addition of Inert-Disc (20 µM); t = 0 min (black, 1040 min after start), t = 240 min (red, 1280 min after start). The spectra are
normalized to the initial CFP emission at 475 nm. c) Fluorescence emission spectra (exc= 410 nm) over the time course of 17 h of a 1:1 mixture of YFP-SNAP and 3 and of CFP-SNAP and 3 after 3 hours of separate ligation directly after intermixing; t = 0 min (black), t = 1020 min (red). The spectra are normalized to the initial CFP emission at 475 nm. d) Fluorescence emission spectra
(exc= 410 nm) over the time course of 4 h of the 1:1 mixture of the two ligation shown in c after addition of Inert-Disc (20 µM); t = 0 min (black, 1040 min after start), t = 240 min (red, 1280 min after start). The spectra are normalized to the initial CFP emission at 475 nm. These spectra belong to Figure 4 in the main text.
Figure S 15: Change in FRET ratios overtime of an intermixed mixture of YFP-SNAP ligated to 2 and of CFP-SNAP ligated to 2 without (blue) and after addition of 10 µM (red) and 20 µM (black) of 3.
References
(1) Uhlenheuer, D. A.; Wasserberg, D.; Haase, C.; Nguyen, H. D.; Schenkel, J. H.; Huskens, J.; Ravoo, B. J.; Jonkheijm, P.; Brunsveld, L. Chem. Eur. J. 2012, 18, 6788–6794.
(2) Patterson, G.; Day, R. N.; Piston, D. J. Cell Sci. 2001, 114, 837 –838. (3) Cubitt, A. B.; Woollenweber, L. A.; Heim, R. Methods Cell Biol. 1999, 58, 19–30. (4) Brunsveld, L.; Lohmeijer, B. G. G.; Vekemans, J. A. J. M.; Meijer, E. W. Chem. Commun. 2000,
2305–2306. (5) Ph(COOH)2COOMe from methyl coumalate by Diels-Alder reaction; H. von Pechmann, J. Liebigs
Ann. Chem. 1891, 261–309 Ph(COOH)2COOMe from trimethyl trimesoate Ph(COOMe)3: a) J.U. Wallace & S.H. Chen, Ind. Eng. Chem. Res. 2006, 45, 4494;b) J. Roosma, T. Mes, P. Leclère, A.R.A. Palmans & E.W. Meijer, J. Am Chem Soc. 2008, 130, 1120
(6) Brunsveld, L.; Zhang, H.; Glasbeek, M.; Vekemans, J. A. J. M.; Meijer, E. W. J. Am. Chem. Soc. 2000, 122, 6175–6182.
(7) Müller, M. K.; Petkau, K.; Brunsveld, L. Chem. Commun. 2010, 47, 310–312. (8) Lemercier, G.; Gendreizig, S.; Kindermann, M.; Johnsson, K. Angew. Chem. Int. Ed. 2007, 46,
4281–4284. (9) Uhlenheuer, D. A. Supramolecular control over protein assembly, Technische Universiteit
Eindhoven: ISBN: 978-90-386-2536-2, 2011.
Electronic Supplementary Material (ESI) for Chemical ScienceThis journal is © The Royal Society of Chemistry 2013

S17
(10) Palmans, A. R. A.; Vekemans, J. A. J. M.; Fischer, H.; Hikmet, R. A.; Meijer, E. W. Chem. Eur. J. 1997, 3, 300–307.
(11) Brunsveld, L. Supramolecular Chirality, Technische Universiteit Eindhoven: ISBN: 90-386-2852-8, 2001.
(12) Metzroth, T.; Hoffmann, A.; Martin-Rapun, R.; Smulders, M. M. J.; Pieterse, K.; Palmans, A. R. A.; Vekemans, J. A. J. M.; Meijer, E. W.; Spiess, H. W.; Gauss, J. Chem. Sci. 2011, 2, 69–76.
(13) Palmans, A. R. A. Supramolecular structures based on the intramolecular H-bonding in the 3,3’-di(acylamino)-2,2’-bipydridine unit, Technische Universiteit Eindhoven: Eindhoven, 1997.
(14) Toele, P.; Van Gorp, J. J.; Glasbeek, M. J. Phys. Chem. A 2005, 109, 10479–10487. (15) Petkau-Milroy, K.; Sonntag, M. H.; Van Onzen, A. H. A. M.; Brunsveld, L. J. Am. Chem. Soc. 2012,
134, 8086–8089. (16) Saccà, B.; Meyer, R.; Erkelenz, M.; Kiko, K.; Arndt, A.; Schroeder, H.; Rabe, K. S.; Niemeyer, C. M.
Angew. Chem. Int. Ed. 2010, 49, 9378–9383. (17) Engin, S.; Trouillet, V.; Franz, C. M.; Welle, A.; Bruns, M.; Wedlich, D. Langmuir 2010, 26, 6097–
6101.
Electronic Supplementary Material (ESI) for Chemical ScienceThis journal is © The Royal Society of Chemistry 2013