Embed Size (px)
Citation preview

Support Vector MachinesGraphical View, using Toy Example:
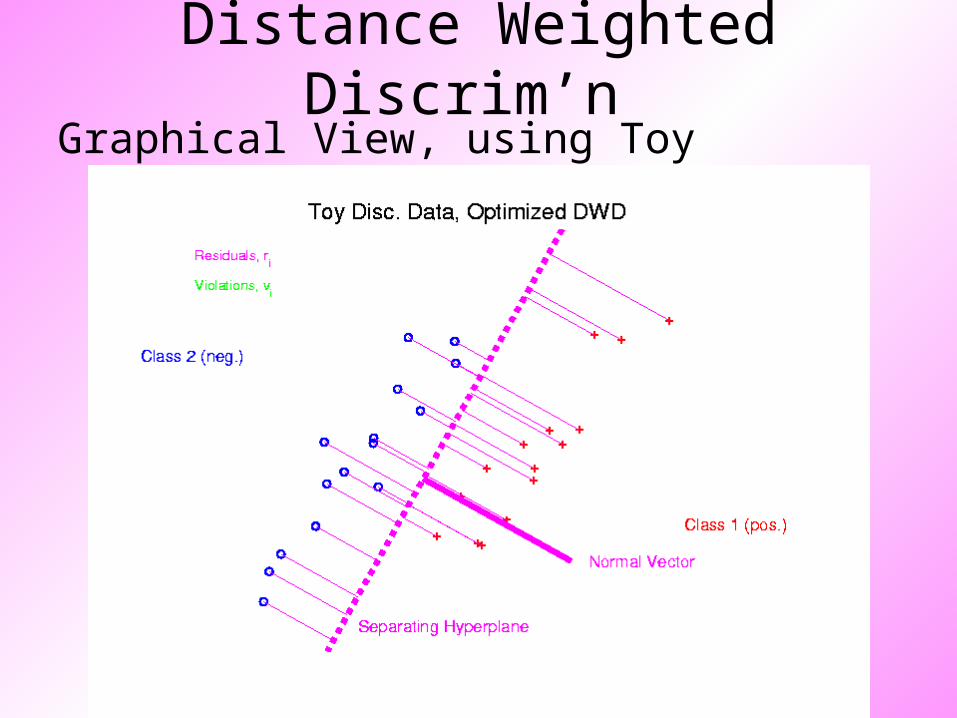
Distance Weighted Discrim’n
Graphical View, using Toy Example:

HDLSS Discrim’n Simulations
Wobble Mixture:

HDLSS Discrim’n Simulations
Wobble Mixture:80% dim. 1 , other dims 020% dim. 1 ±0.1, rand dim ±100,
others 0• MD still very bad, driven by outliers• SVM & DWD are both very robust• SVM loses (affected by margin push)• DWD slightly better (by w’ted
influence)• Methods converge for higher
dimension??Ignore RLR (a mistake)
2.21

Melanoma Data• Study Differences Between
(Malignant) Melanoma & (Benign) Nevi
Use Image Features as Before
(Recall from Transformation Discussion)
Paper: Miedema et al (2012)

March 17, 2010, 6
Clinical diagnosis
BackgroundIntroduction

ROC Curve
Slide
Cutoff
To
Trace
Out
Curve

Melanoma Data
Subclass
DWD
Direction
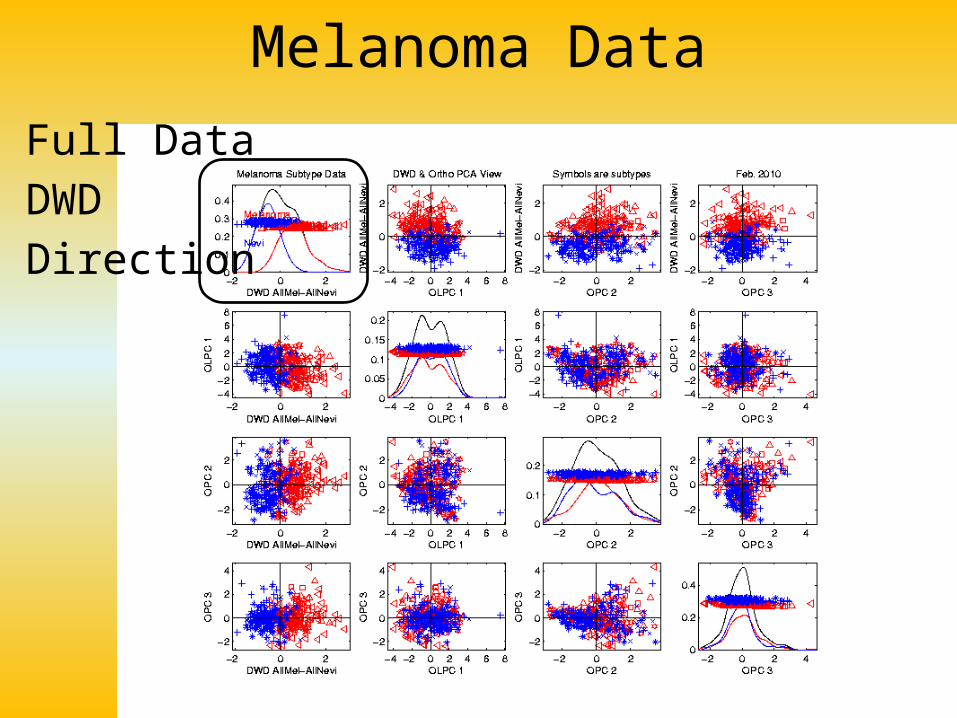
Melanoma Data
Full Data
DWD
Direction

Melanoma Data
Full Data
ROC
Analysis
AUC = 0.93
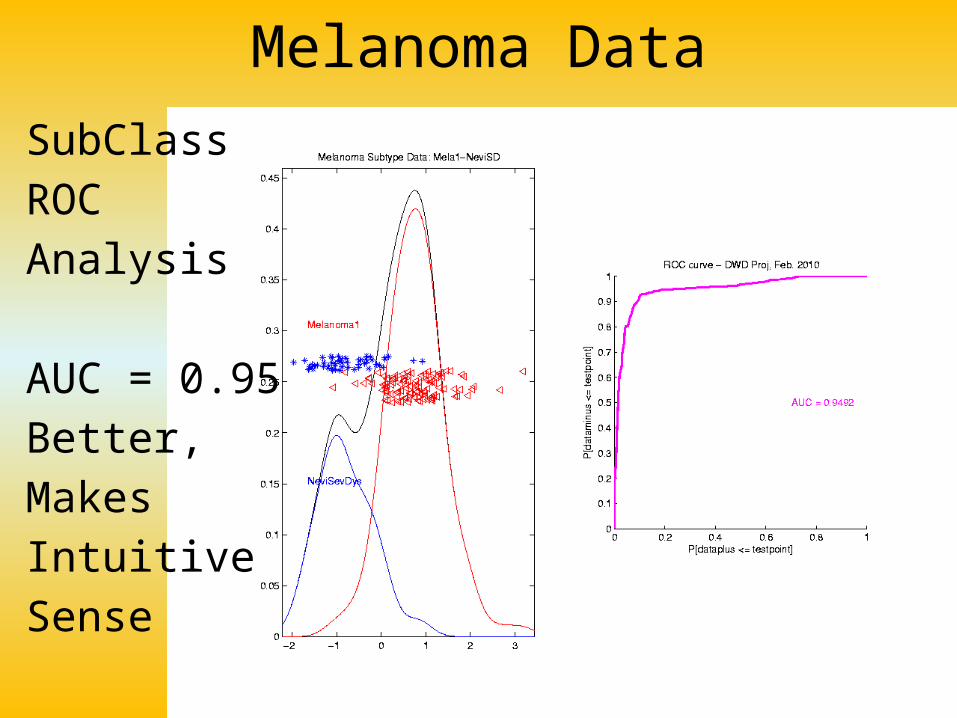
Melanoma Data
SubClass
ROC
Analysis
AUC = 0.95
Better,
Makes
Intuitive
Sense
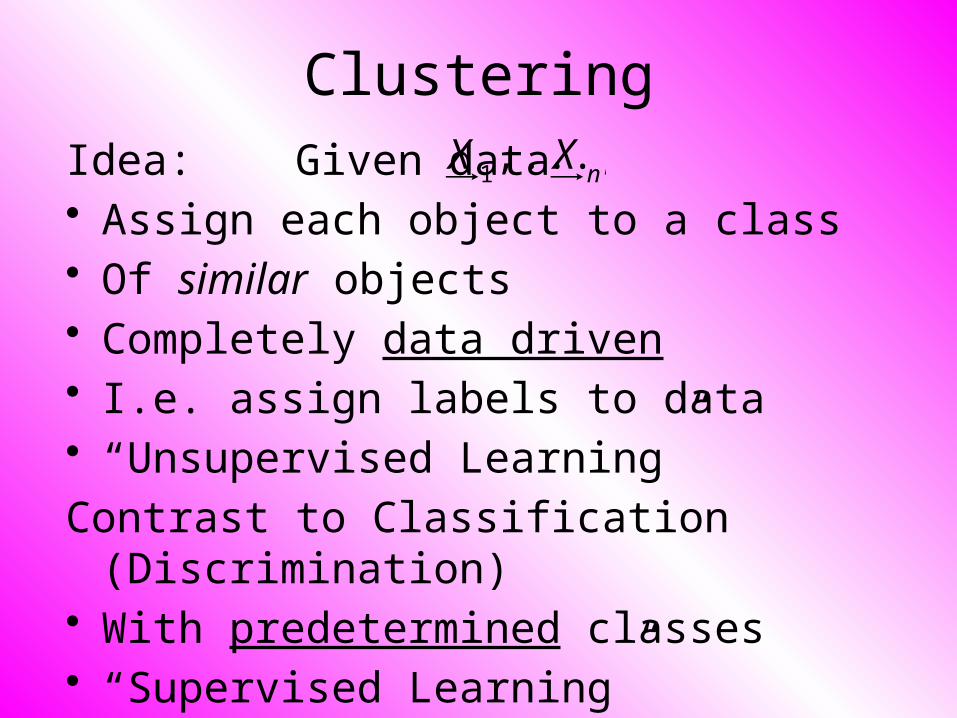
ClusteringIdea: Given data • Assign each object to a class• Of similar objects• Completely data driven• I.e. assign labels to data• “Unsupervised Learning”
Contrast to Classification (Discrimination)• With predetermined classes• “Supervised Learning”
nXX ,...,
1

K-means Clustering
Clustering Goal:
• Given data
• Choose classes
• To miminize
KCC ,...,1
nXX ,...,
1
n
ii
Ciji
K
j
K
XX
XX
CCCI j
1
2
2
1
1 ,,
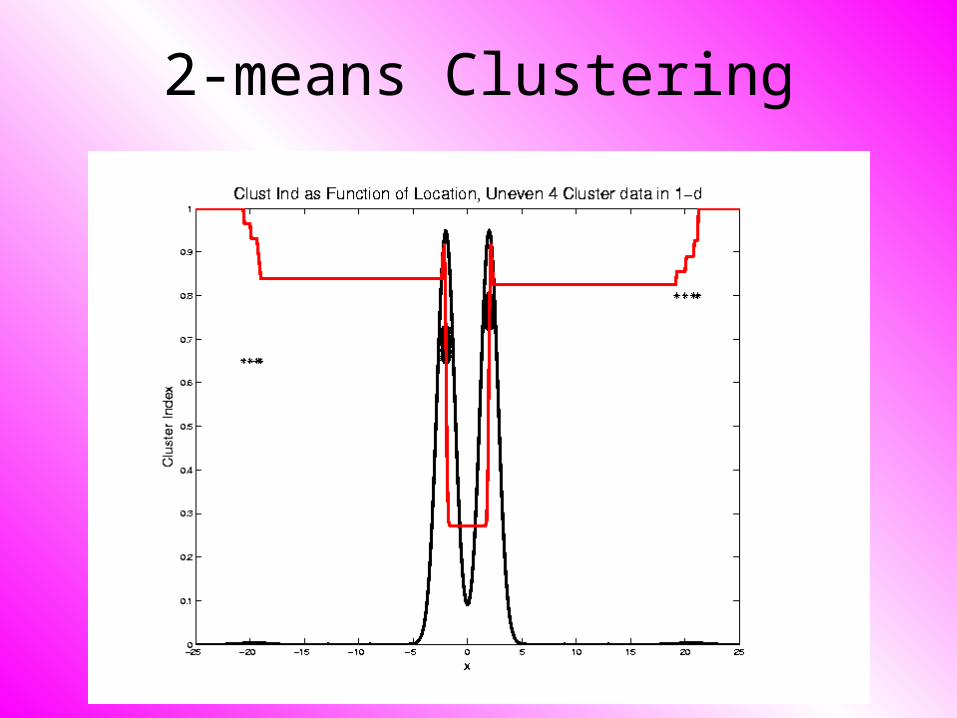
2-means Clustering

2-means Clustering
Study CI, using simple 1-d examples
• Over changing Classes (moving b’dry)
• Multi-modal data interesting effects
– Local mins can be hard to find
– i.e. iterative procedures can “get stuck”
(even in 1 dimension, with K = 2)

SWISS ScoreAnother Application of CI (Cluster Index)
Cabanski et al (2010)
SWISS ScoreAnother Application of CI (Cluster Index)
Cabanski et al (2010)
Idea: Use CI in bioinformatics to“measure quality of data preprocessing”

SWISS ScoreAnother Application of CI (Cluster Index)
Cabanski et al (2010)
Idea: Use CI in bioinformatics to“measure quality of data preprocessing”
Philosophy: Clusters Are Scientific GoalSo Want to Accentuate Them
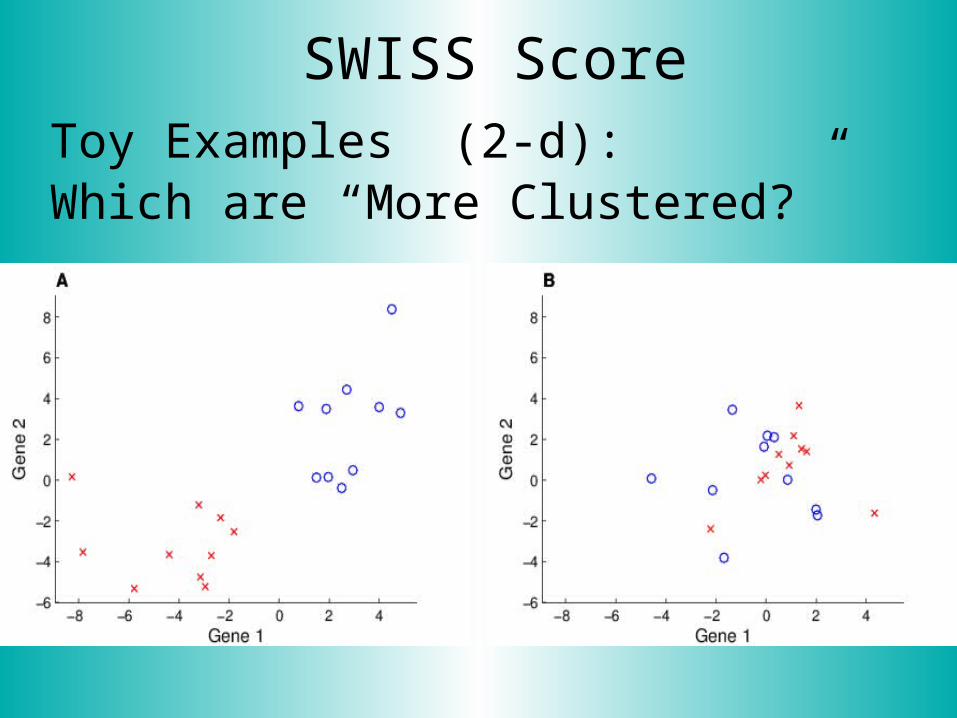
SWISS ScoreToy Examples (2-d): Which are “More Clustered?”

SWISS ScoreToy Examples (2-d): Which are “More Clustered?”
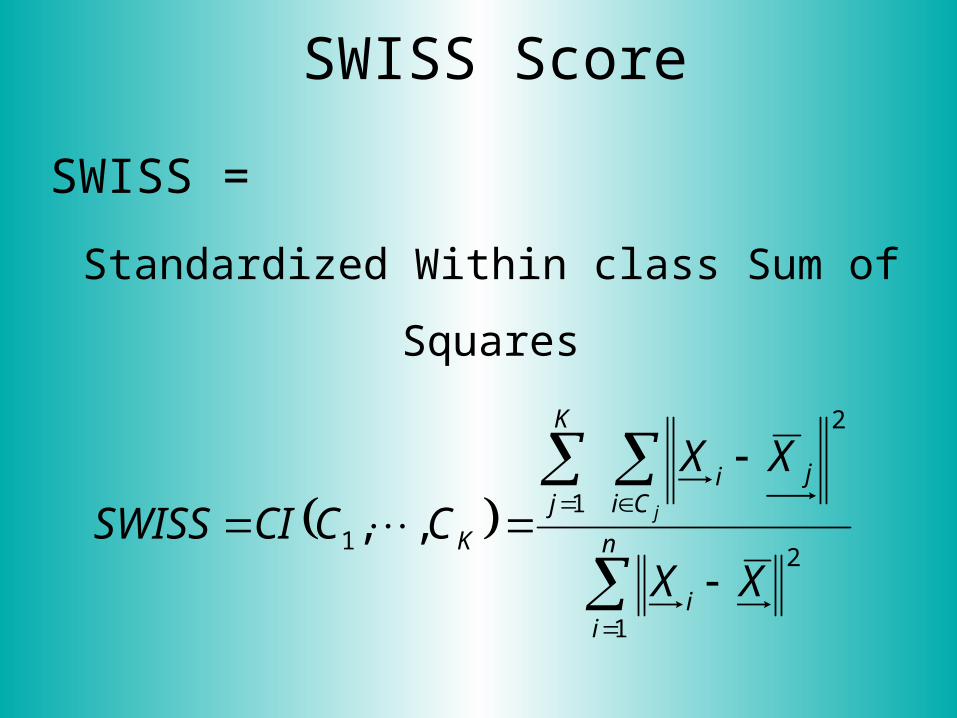
SWISS Score
SWISS =
Standardized Within class Sum of Squares
n
ii
Ciji
K
j
K
XX
XX
CCCISWISS j
1
2
2
1
1 ,,

SWISS Score
SWISS =
Standardized Within class Sum of Squares
n
ii
Ciji
K
j
K
XX
XX
CCCISWISS j
1
2
2
1
1 ,,
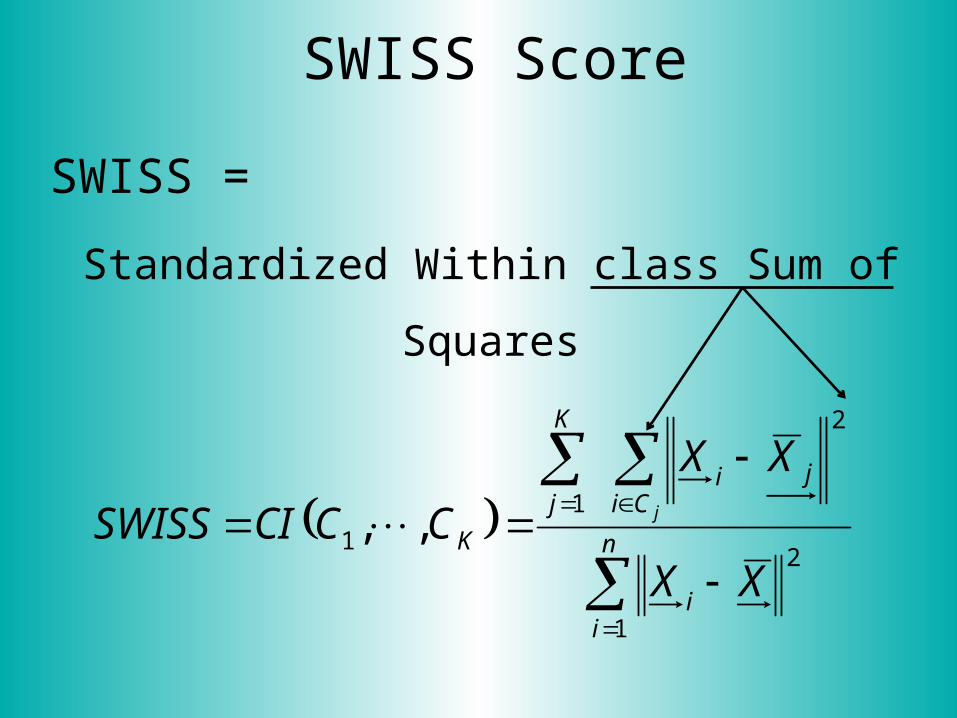
SWISS Score
SWISS =
Standardized Within class Sum of Squares
n
ii
Ciji
K
j
K
XX
XX
CCCISWISS j
1
2
2
1
1 ,,

SWISS Score
SWISS =
Standardized Within class Sum of Squares
n
ii
Ciji
K
j
K
XX
XX
CCCISWISS j
1
2
2
1
1 ,,

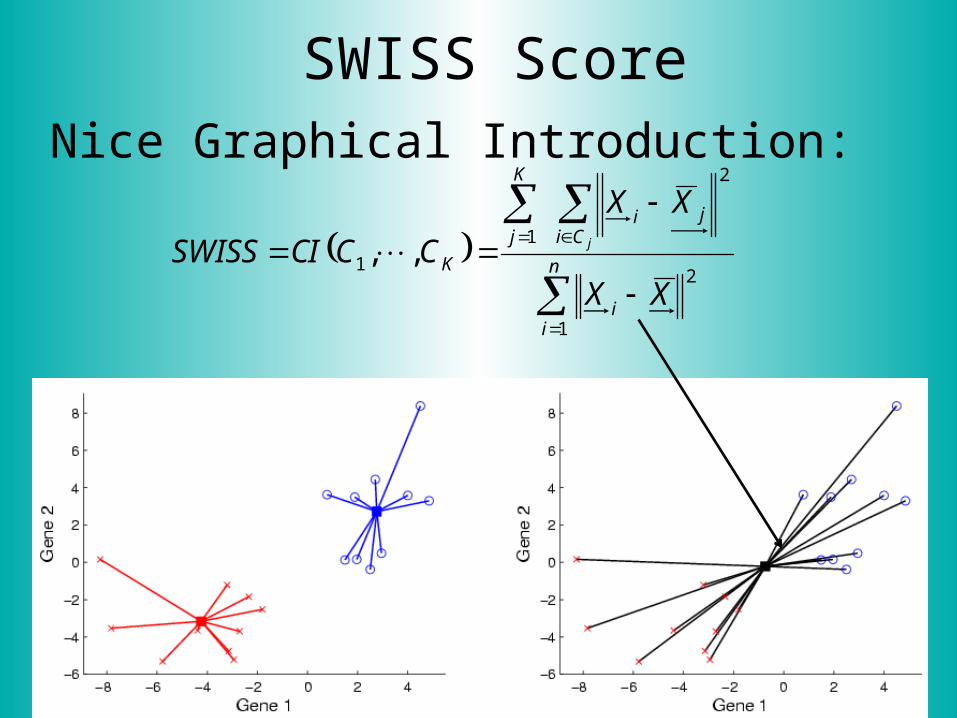
SWISS ScoreNice Graphical Introduction:
n
ii
Ciji
K
j
K
XX
XX
CCCISWISS j
1
2
2
1
1 ,,

SWISS ScoreNice Graphical Introduction:
n
ii
Ciji
K
j
K
XX
XX
CCCISWISS j
1
2
2
1
1 ,,
SWISS ScoreNice Graphical Introduction:
n
ii
Ciji
K
j
K
XX
XX
CCCISWISS j
1
2
2
1
1 ,,

SWISS ScoreRevisit Toy Examples (2-d): Which are “More Clustered?”

SWISS ScoreToy Examples (2-d): Which are “More Clustered?”

SWISS ScoreToy Examples (2-d): Which are “More Clustered?”

SWISS Score
Now Consider K > 2:
How well does it work?
n
ii
Ciji
K
j
K
XX
XX
CCCISWISS j
1
2
2
1
1 ,,

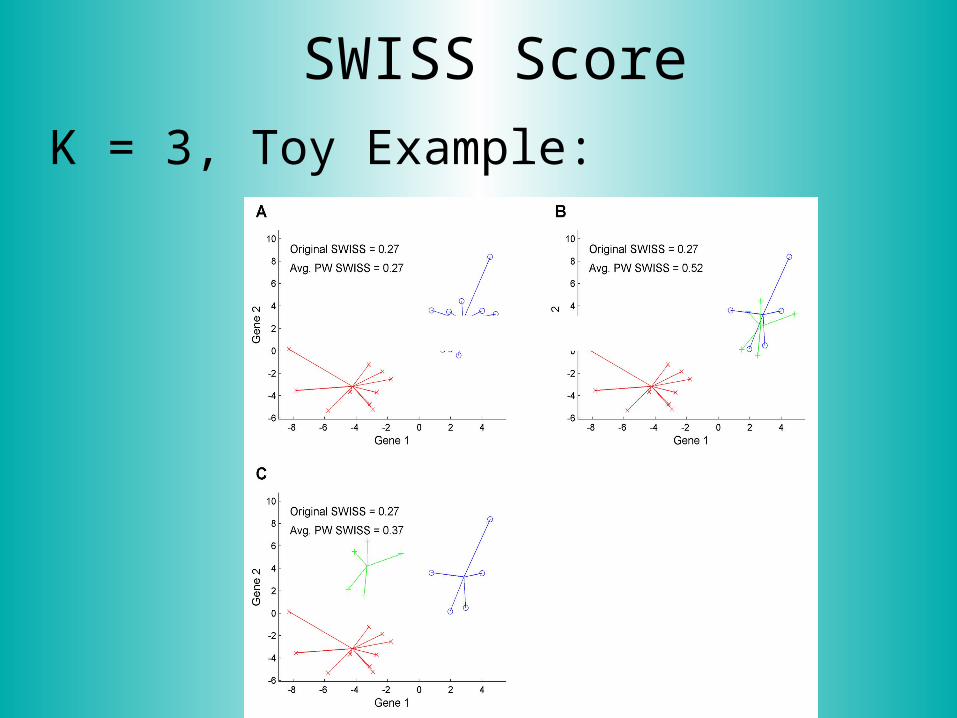
SWISS Score
K = 3, Toy Example:

SWISS Score
K = 3, Toy Example:
SWISS Score
K = 3, Toy Example:
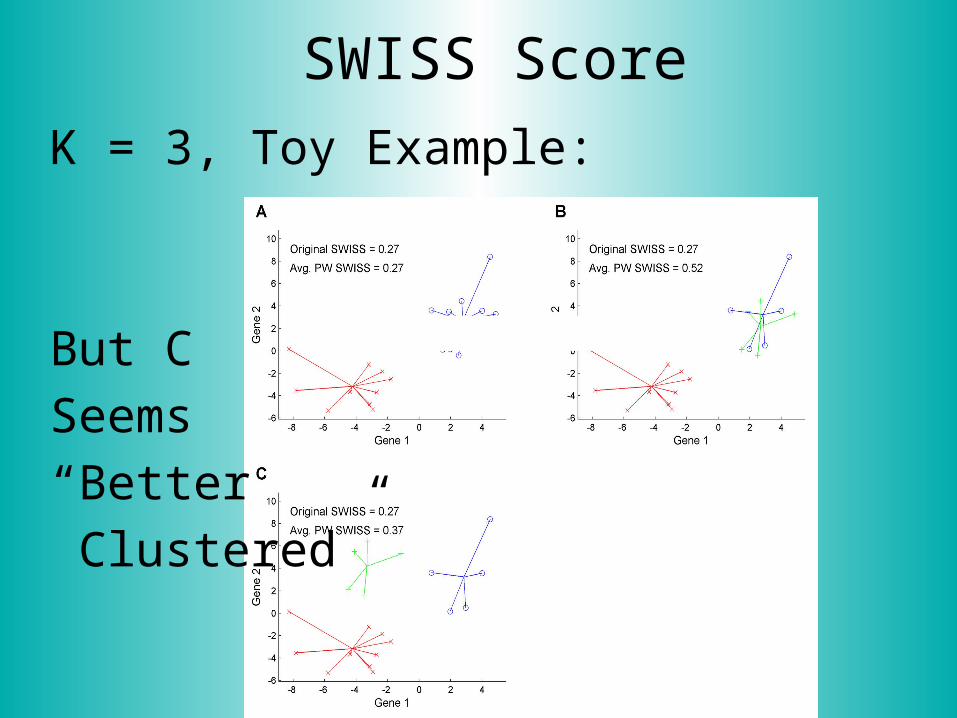
SWISS Score
K = 3, Toy Example:
But C
Seems
“Better
Clustered”

SWISS Score
K-Class SWISS:
Instead of using K-Class CI
Use Average of Pairwise SWISS Scores

SWISS Score
K-Class SWISS:
Instead of using K-Class CI
Use Average of Pairwise SWISS Scores
(Preserves [0,1] Range)

SWISS Score
Avg. Pairwise SWISS – Toy Examples

SWISS Score
Additional Feature:
Ǝ Hypothesis Tests: H1: SWISS1 < 1
H1: SWISS1 < SWISS2
Permutation Based
See Cabanski et al (2010)

Clustering
• A Very Large Area
• K-Means is Only One Approach

Clustering
• A Very Large Area
• K-Means is Only One Approach
• Has its Drawbacks
(Many Toy Examples of This)

Clustering
• A Very Large Area
• K-Means is Only One Approach
• Has its Drawbacks
(Many Toy Examples of This)
• Ǝ Many Other Approaches

Clustering
Recall Important References (monographs):
• Hartigan (1975)
• Gersho and Gray (1992)
• Kaufman and Rousseeuw (2005)
See Also Wikipedia

Clustering
• A Very Large Area
• K-Means is Only One Approach
• Has its Drawbacks
(Many Toy Examples of This)
• Ǝ Many Other Approaches
• Important (And Broad) Class
Hierarchical Clustering

Hiearchical ClusteringIdea: Consider Either:
Bottom Up Aggregation:
One by One Combine Data
Top Down Splitting:
All Data in One Cluster & Split
Through Entire Data Set, to get Dendogram

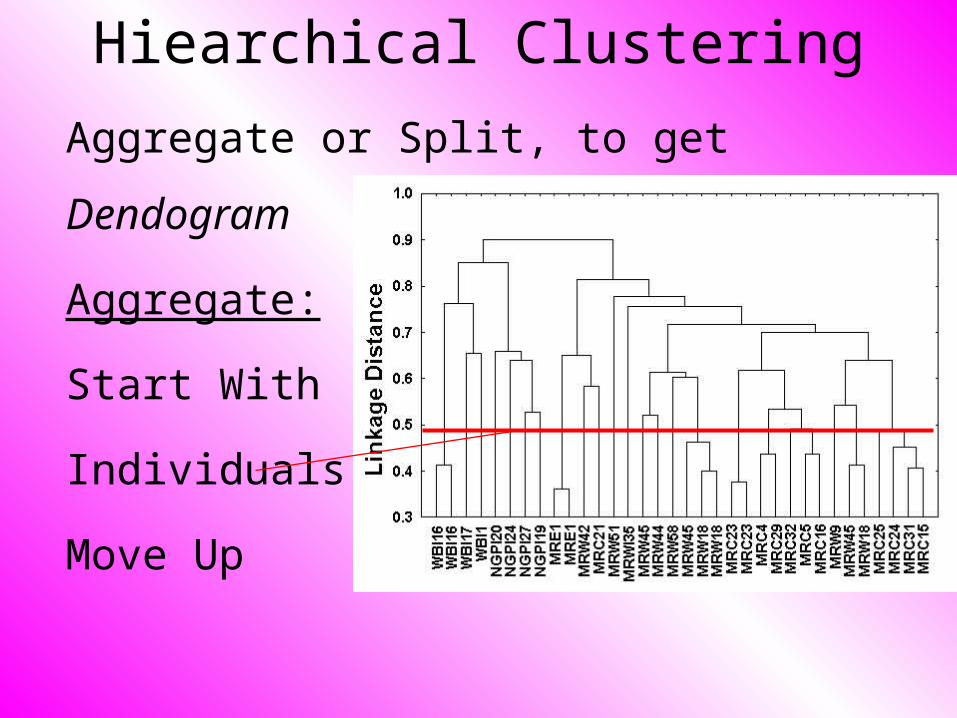
Hiearchical Clustering
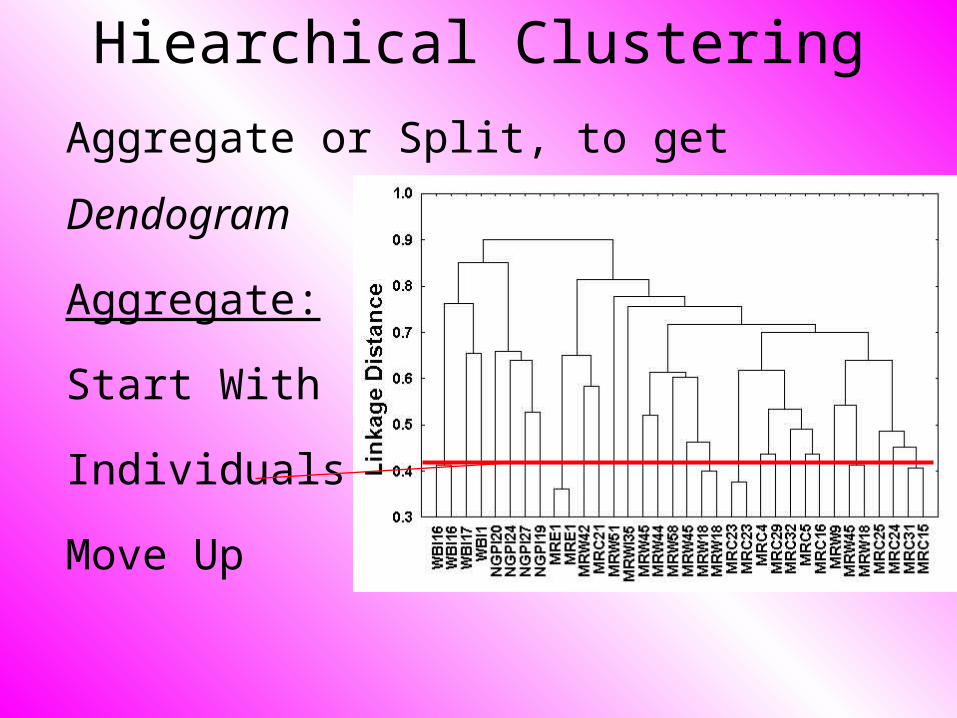
Aggregate or Split, to get Dendogram
Thanks to US EPA: water.epa.gov
Hiearchical Clustering
Aggregate or Split, to get Dendogram
Aggregate:
Start With
Individuals,
Move Up

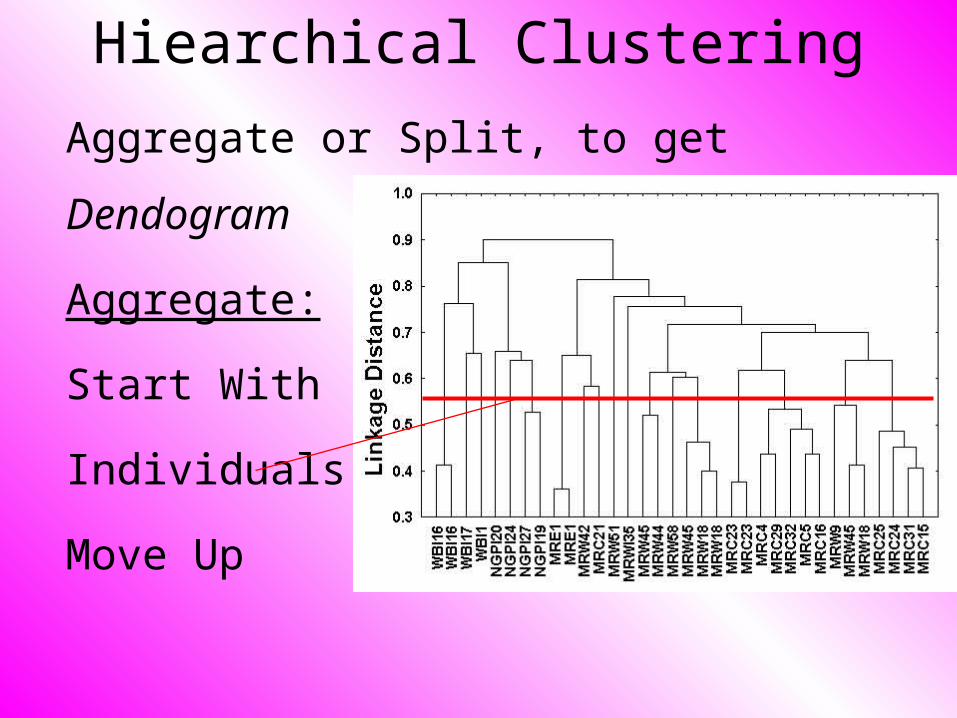
Hiearchical Clustering
Aggregate or Split, to get Dendogram
Aggregate:
Start With
Individuals
Hiearchical Clustering
Aggregate or Split, to get Dendogram
Aggregate:
Start With
Individuals,
Move Up
Hiearchical Clustering
Aggregate or Split, to get Dendogram
Aggregate:
Start With
Individuals,
Move Up

Hiearchical Clustering
Aggregate or Split, to get Dendogram
Aggregate:
Start With
Individuals,
Move Up

Hiearchical Clustering
Aggregate or Split, to get Dendogram
Aggregate:
Start With
Individuals,
Move Up,
End Up With
All in 1 Cluster

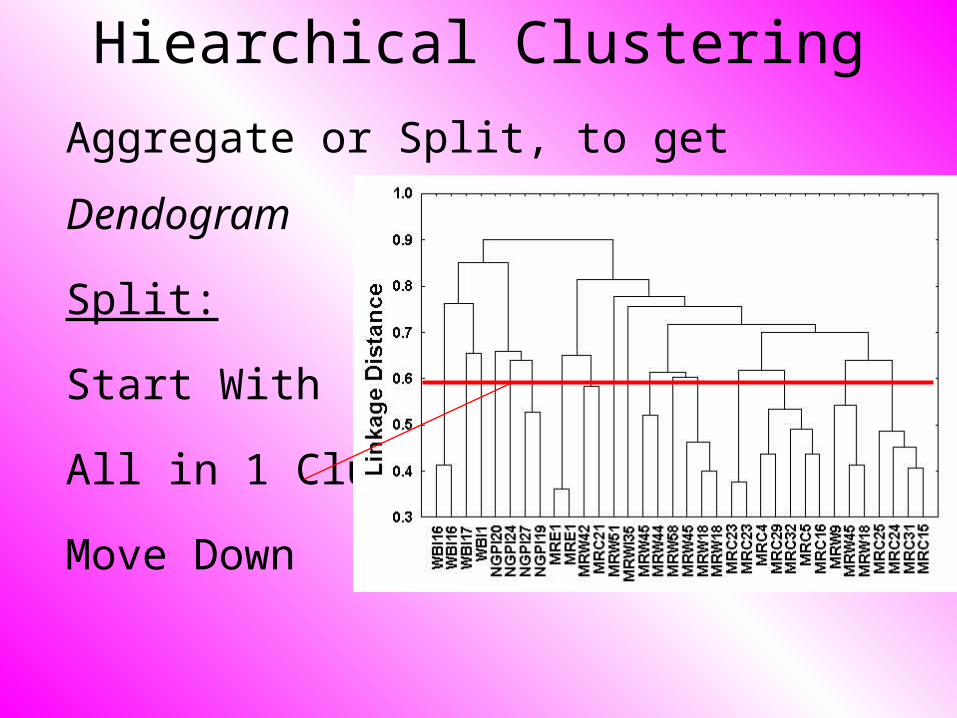
Hiearchical Clustering
Aggregate or Split, to get Dendogram
Split:
Start With
All in 1 Cluster
Hiearchical Clustering
Aggregate or Split, to get Dendogram
Split:
Start With
All in 1 Cluster,
Move Down
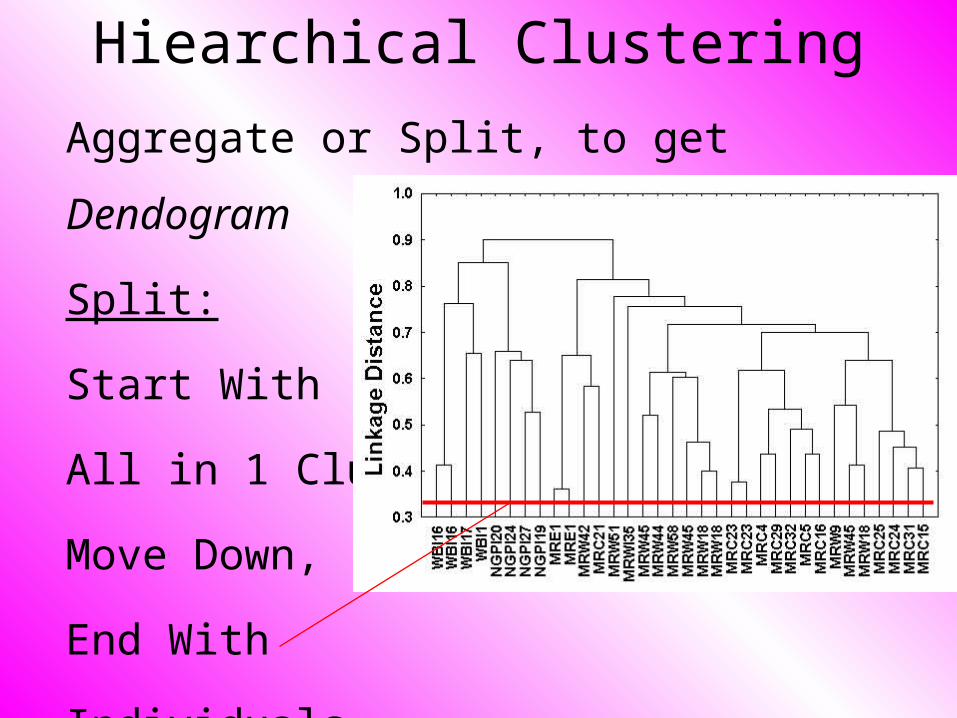
Hiearchical Clustering
Aggregate or Split, to get Dendogram
Split:
Start With
All in 1 Cluster,
Move Down,
End With
Individuals
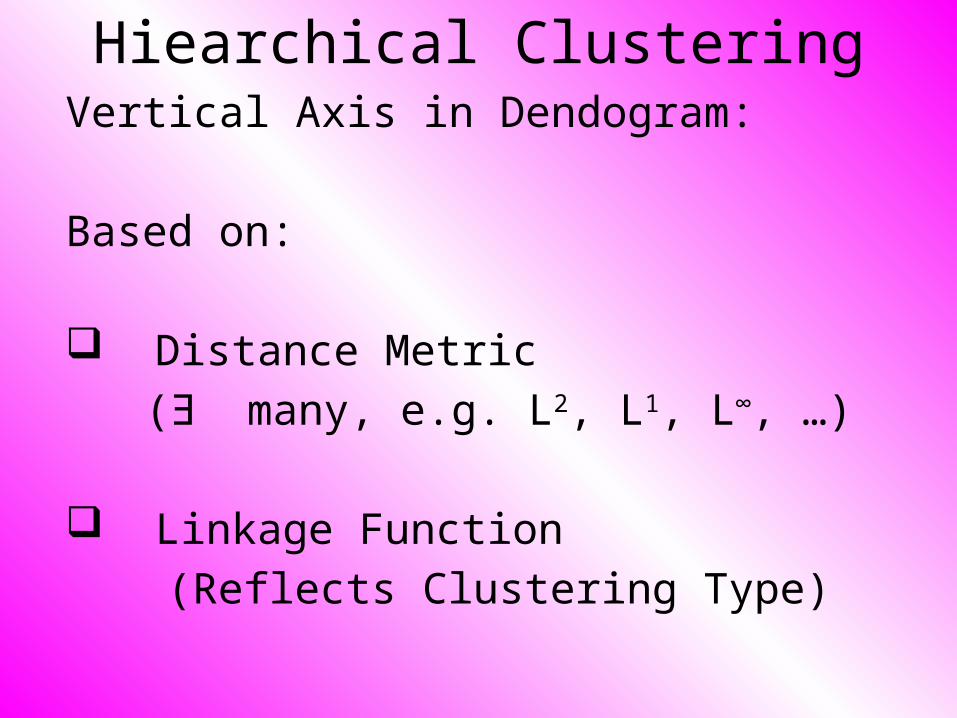
Hiearchical ClusteringVertical Axis in Dendogram:
Based on:
Distance Metric
(Ǝ many, e.g. L2, L1, L∞, …)
Linkage Function
(Reflects Clustering Type)
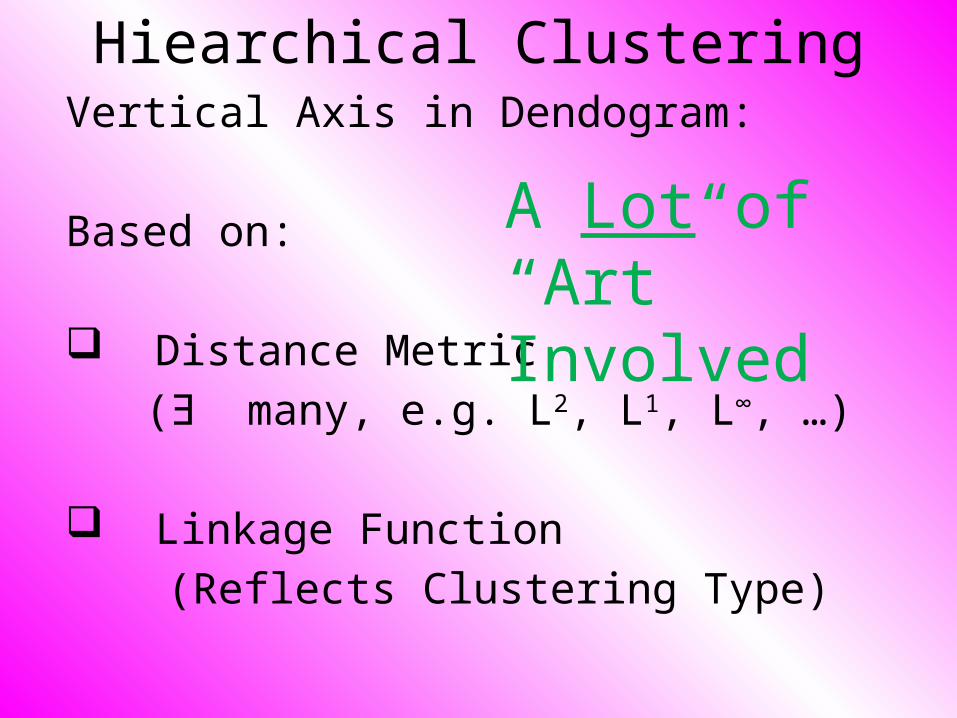
Hiearchical ClusteringVertical Axis in Dendogram:
Based on:
Distance Metric
(Ǝ many, e.g. L2, L1, L∞, …)
Linkage Function
(Reflects Clustering Type)
A Lot of “Art” Involved
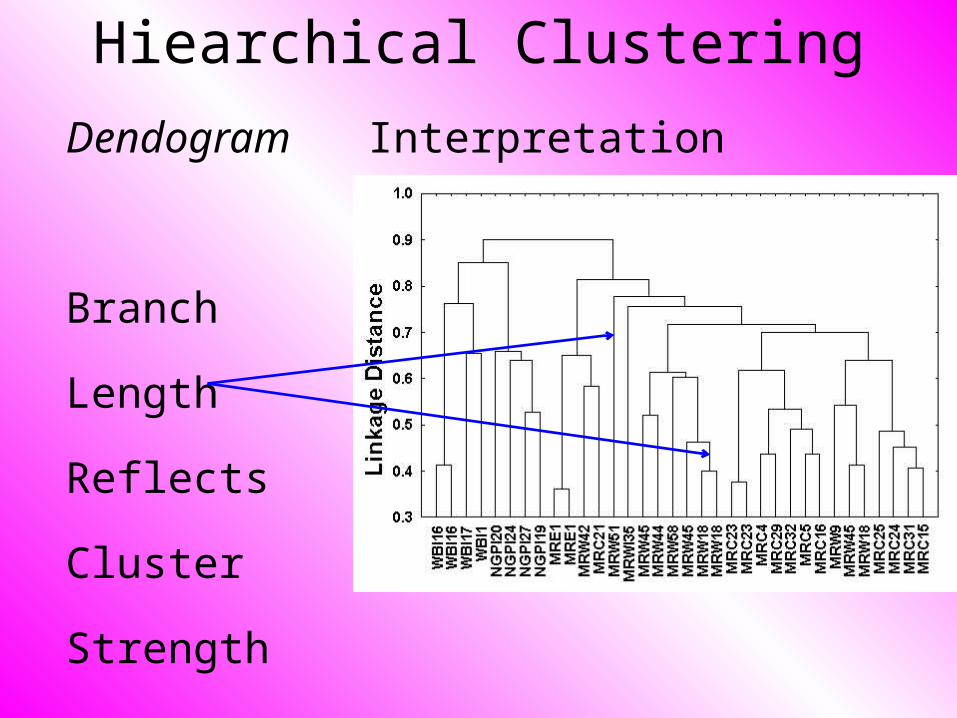
Hiearchical Clustering
Dendogram Interpretation
Branch
Length
Reflects
Cluster
Strength
SigClust
• Statistical Significance of Clusters• in HDLSS Data• When is a cluster “really there”?
SigClust
• Statistical Significance of Clusters• in HDLSS Data• When is a cluster “really there”?
Liu et al (2007), Huang et al (2014)

SigClust
Co-authors:
Andrew Nobel – UNC Statistics & OR
C. M. Perou – UNC Genetics
D. N. Hayes – UNC Oncology & Genetics
Yufeng Liu – UNC Statistics & OR
Hanwen Huang – U Georgia Biostatistics
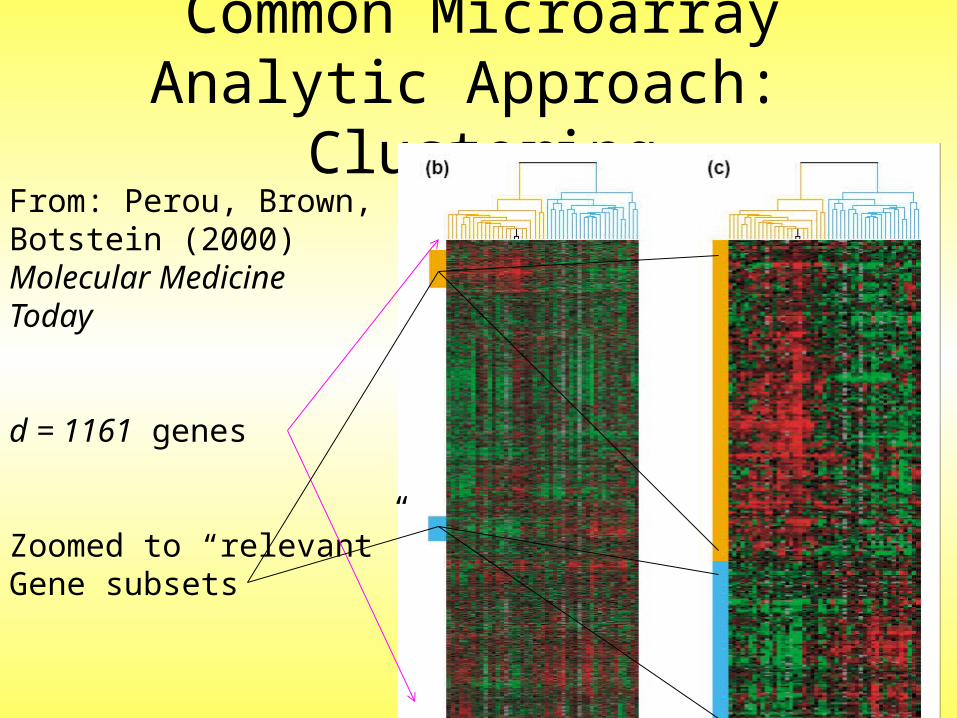
Common Microarray Analytic Approach: Clustering
From: Perou, Brown,Botstein (2000) Molecular MedicineToday
d = 1161 genes
Zoomed to “relevant”Gene subsets

Interesting Statistical Problem
For HDLSS data:When clusters seem to appear
E.g. found by clustering method
How do we know they are really there?Question asked by Neil Hayes
Define appropriate statistical significance?
Can we calculate it?
First Approaches: Hypo Testing
Idea: See if clusters seem to be
Significantly Different Distributions

First Approaches: Hypo Testing
Idea: See if clusters seem to be
Significantly Different Distributions
There Are Several Hypothesis Tests
Most Consistent with Visualization:
Direction, Projection, Permutation

DiProPerm Hypothesis Test
Context: 2 – sample means
H0: μ+1 = μ-1 vs. H1: μ+1 ≠ μ-1
(in High Dimensions)
Wei et al (2013)

DiProPerm Hypothesis Test
Context: 2 – sample means
H0: μ+1 = μ-1 vs. H1: μ+1 ≠ μ-1
Challenges: Distributional Assumptions Parameter Estimation

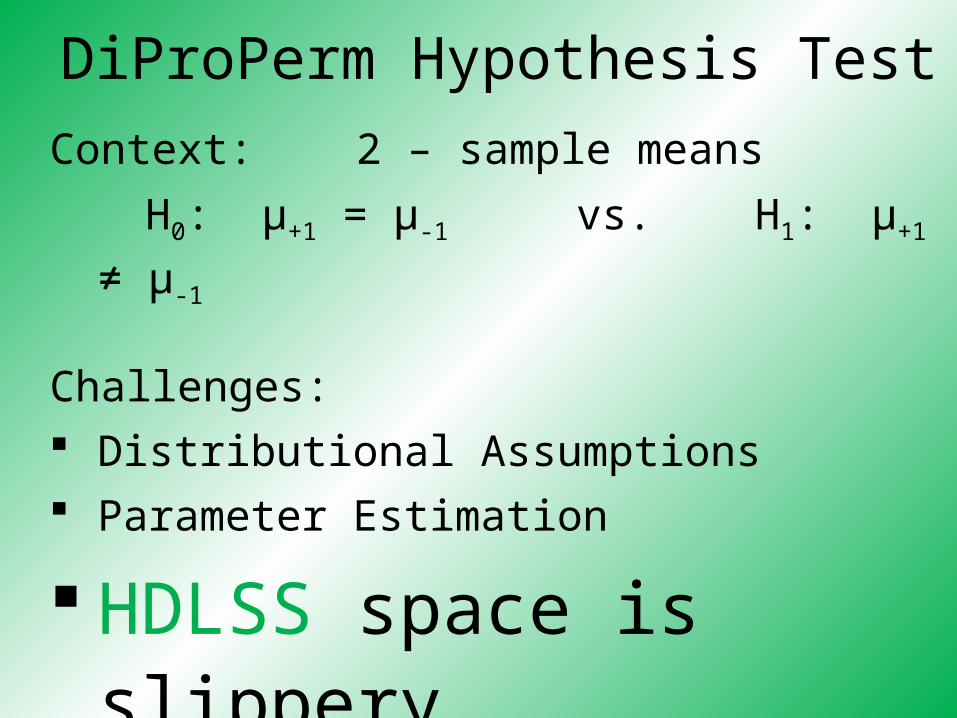
DiProPerm Hypothesis Test
Context: 2 – sample means
H0: μ+1 = μ-1 vs. H1: μ+1 ≠ μ-1
Challenges: Distributional Assumptions Parameter Estimation
HDLSS space is slippery
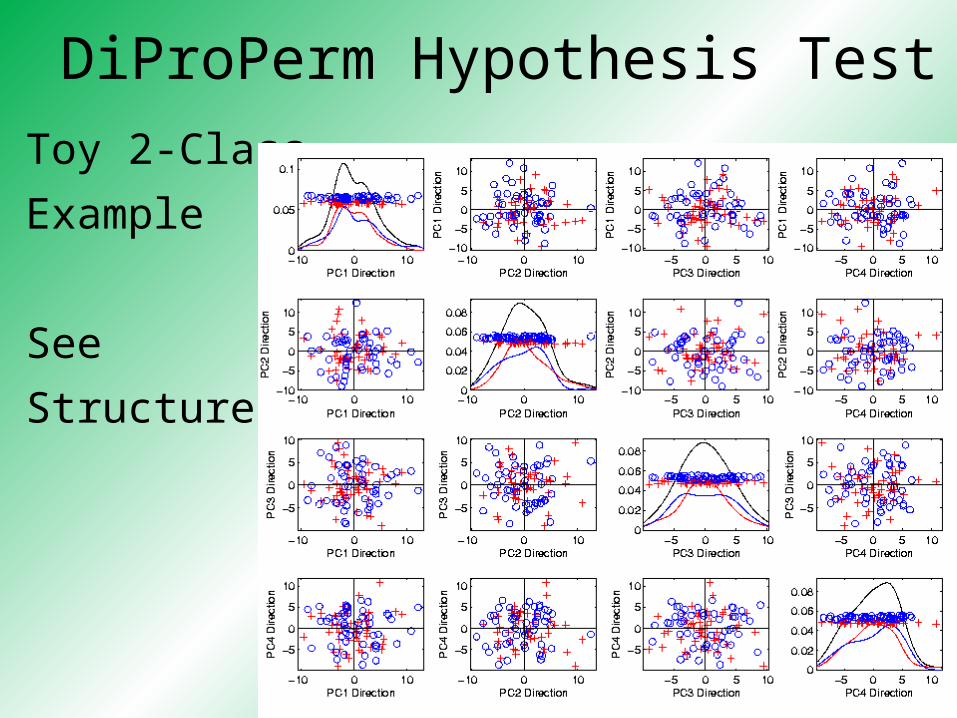
DiProPerm Hypothesis Test
Toy 2-Class
Example
See
Structure?

DiProPerm Hypothesis Test
Toy 2-Class
Example
See
Structure?
Careful,
Only PC1-4
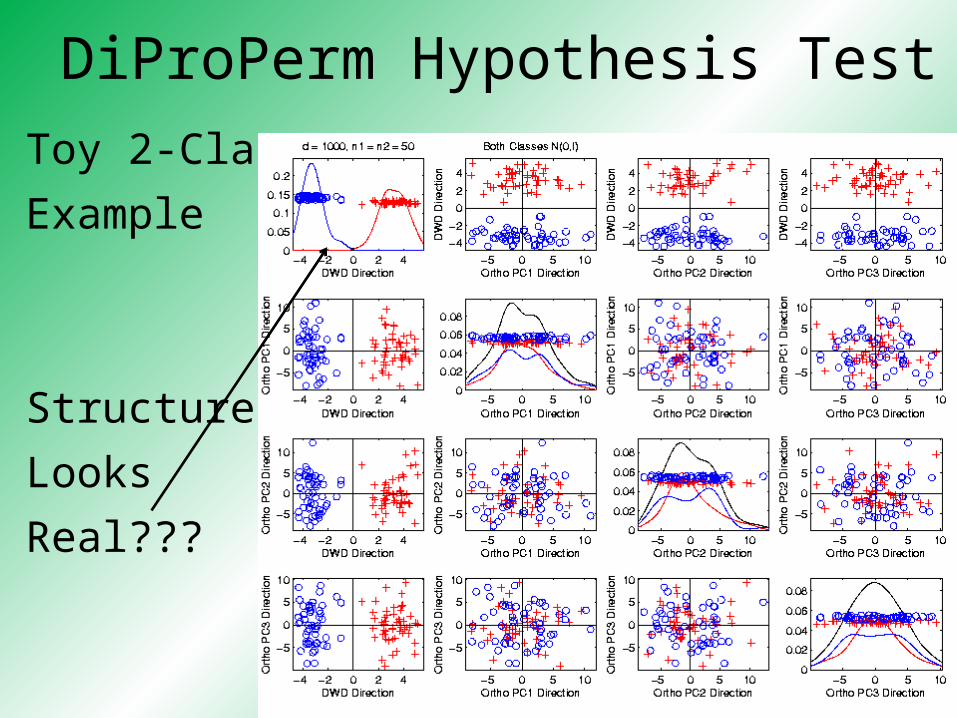
DiProPerm Hypothesis Test
Toy 2-Class
Example
Structure
Looks
Real???

DiProPerm Hypothesis Test
Toy 2-Class
Example
Actually
Both
Classes
Are N(0,I),
d = 1000

DiProPerm Hypothesis Test
Toy 2-Class
Example
Actually
Both
Classes
Are N(0,I),
d = 1000

DiProPerm Hypothesis Test
Toy 2-Class
Example
Separation
Is Natural
Sampling
Variation
DiProPerm Hypothesis Test
Context: 2 – sample means
H0: μ+1 = μ-1 vs. H1: μ+1 ≠ μ-1
Challenges: Distributional Assumptions Parameter Estimation
HDLSS space is slippery

DiProPerm Hypothesis Test
Context: 2 – sample means
H0: μ+1 = μ-1 vs. H1: μ+1 ≠ μ-1
Challenges: Distributional Assumptions Parameter Estimation
Suggested Approach:
Permutation test

DiProPerm Hypothesis Test
Suggested Approach: Find a DIrection
(separating classes)

DiProPerm Hypothesis Test
Suggested Approach: Find a DIrection
(separating classes) PROject the data
(reduces to 1 dim)

DiProPerm Hypothesis Test
Suggested Approach: Find a DIrection
(separating classes) PROject the data
(reduces to 1 dim) PERMute
(class labels, to assess significance,
with recomputed direction)

DiProPerm Hypothesis Test

DiProPerm Hypothesis Test
DiProPerm Hypothesis Test

DiProPerm Hypothesis Test

DiProPerm Hypothesis Test
.
.
.Repeat this 1,000 times
To get:

DiProPerm Hypothesis Test

DiProPerm Hypothesis Test
Toy 2-Class
Example
p-value
Not
Significant
DiProPerm Hypothesis Test
Real Data Example: Autism
Caudate Shape
(sub-cortical brain structure)
Shape summarized by 3-d locations of 1032 corresponding points
Autistic vs. Typically Developing

DiProPerm Hypothesis Test
Finds
Significant
Difference
Despite Weak
Visual
Impression
Thanks to Josh Cates

DiProPerm Hypothesis Test
Also Compare: Developmentally Delayed
No
Significant
Difference
But Strong
Visual
ImpressionThanks to Josh Cates

DiProPerm Hypothesis Test
Two
Examples
Which Is
“More
Distinct”?
Visually Better Separation? Thanks to Katie Hoadley
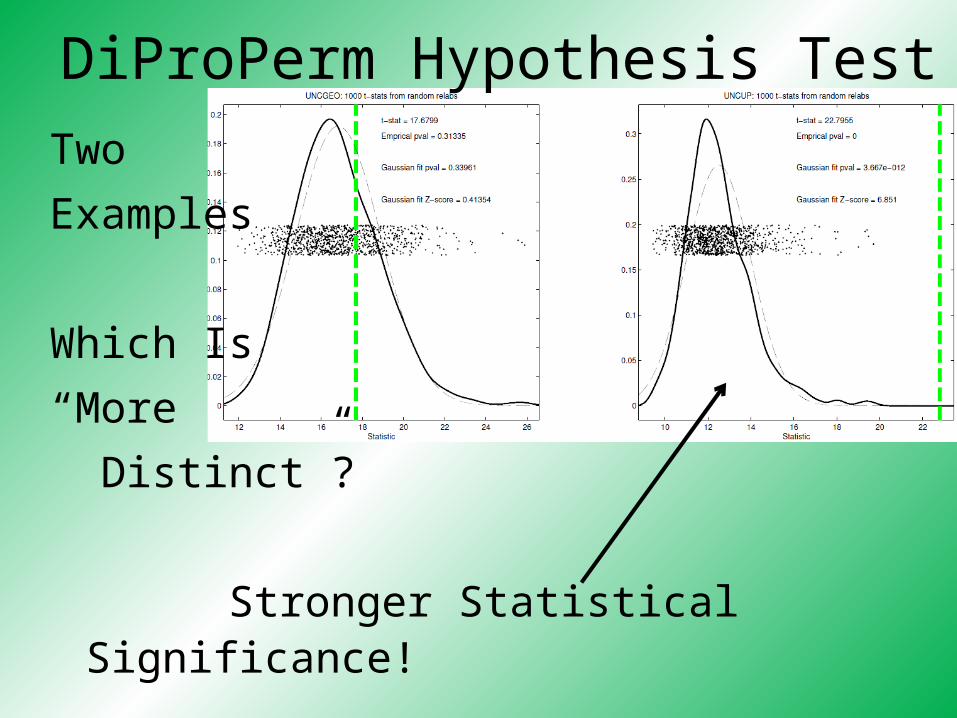
DiProPerm Hypothesis Test
Two
Examples
Which Is
“More
Distinct”?
Stronger Statistical Significance! Thanks to Katie Hoadley

DiProPerm Hypothesis Test
Value of DiProPerm: Visual Impression is Easily Misleading
(onto HDLSS projections,
e.g. Maximal Data Piling) Really Need to Assess Significance DiProPerm used routinely
(even for variable selection)

DiProPerm Hypothesis Test
Choice of Direction: Distance Weighted Discrimination
(DWD) Support Vector Machine (SVM) Mean Difference Maximal Data Piling
DiProPerm Hypothesis Test
Choice of 1-d Summary Statistic: 2-sample t-stat Mean difference Median difference Area Under ROC Curve

Interesting Statistical Problem
For HDLSS data:When clusters seem to appear
E.g. found by clustering method
How do we know they are really there?Question asked by Neil Hayes
Define appropriate statistical significance?
Can we calculate it?

First Approaches: Hypo Testing
e.g. Direction, Projection, Permutation Hypothesis test of:
Significant difference between sub-populationsEffective and AccurateI.e. Sensitive and SpecificThere exist several such testsBut critical point is:
What result implies about clusters
Clarifying Simple Example
Why Population Difference Tests cannot indicate clustering
Andrew Nobel ObservationFor Gaussian Data (Clearly 1 Cluster!)Assign Extreme Labels
(e.g. by clustering)Subpopulations are signif’ly different
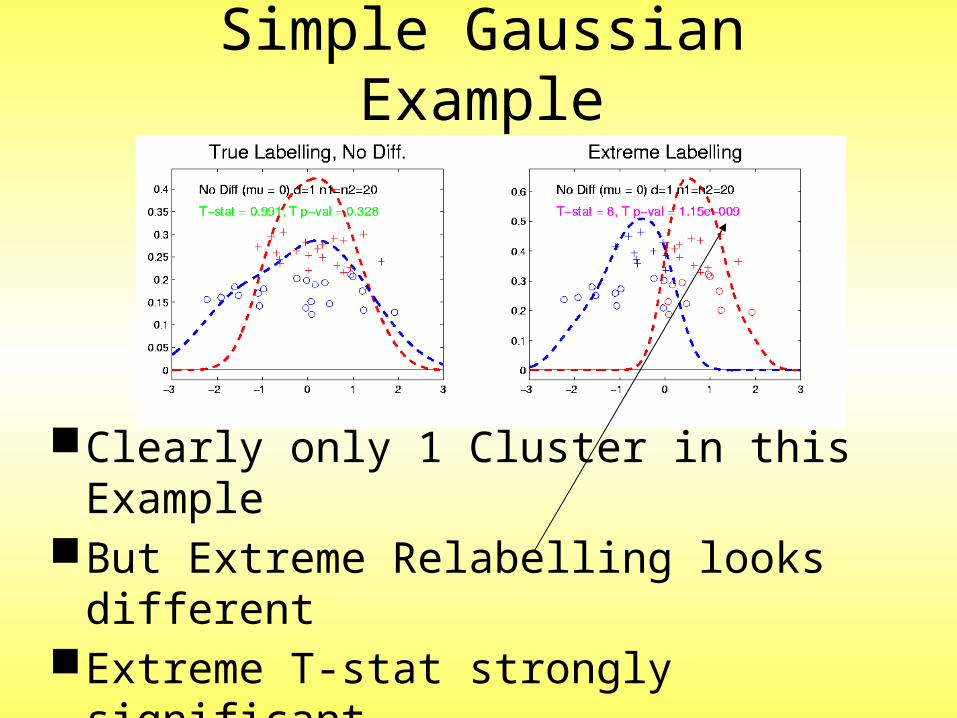
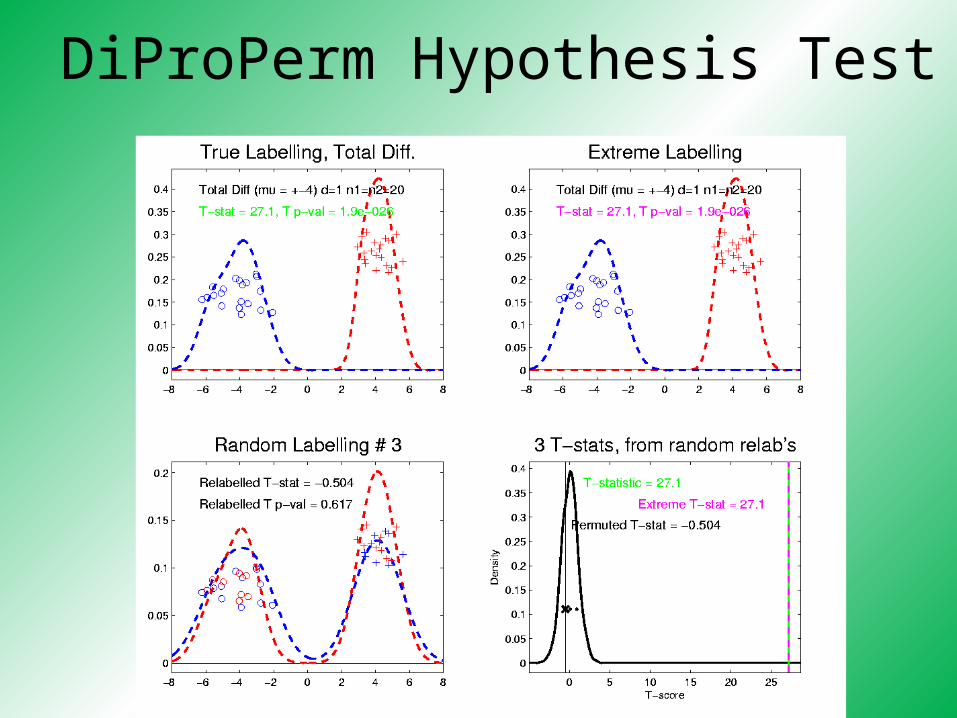
Simple Gaussian Example
Clearly only 1 Cluster in this ExampleBut Extreme Relabelling looks differentExtreme T-stat strongly significantIndicates 2 clusters in data
Simple Gaussian Example
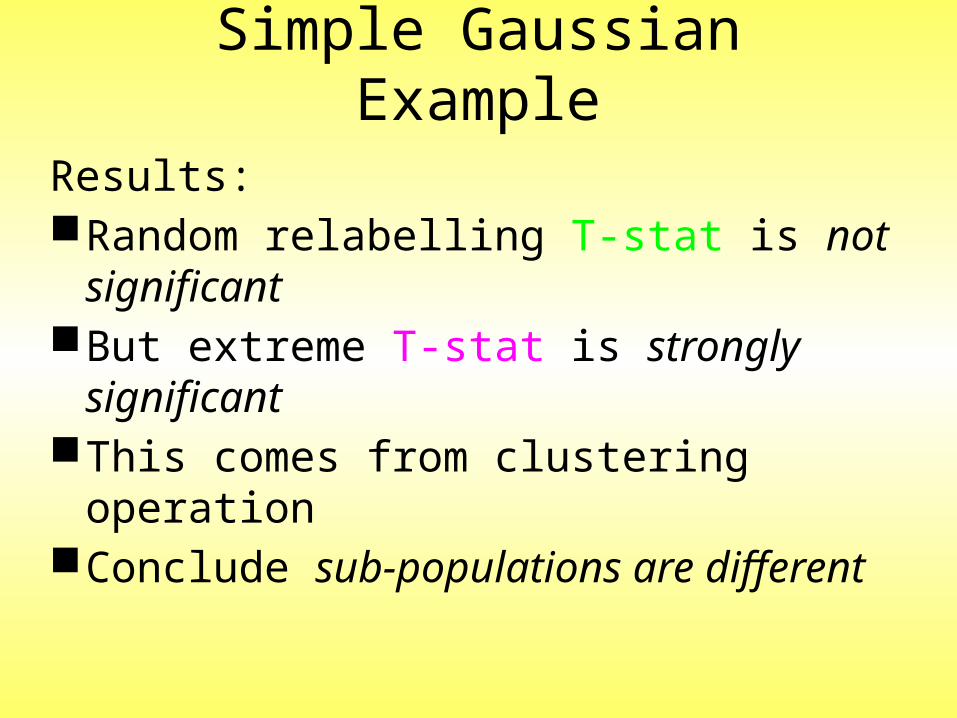
Results:Random relabelling T-stat is not significantBut extreme T-stat is strongly significantThis comes from clustering operationConclude sub-populations are different

Simple Gaussian Example
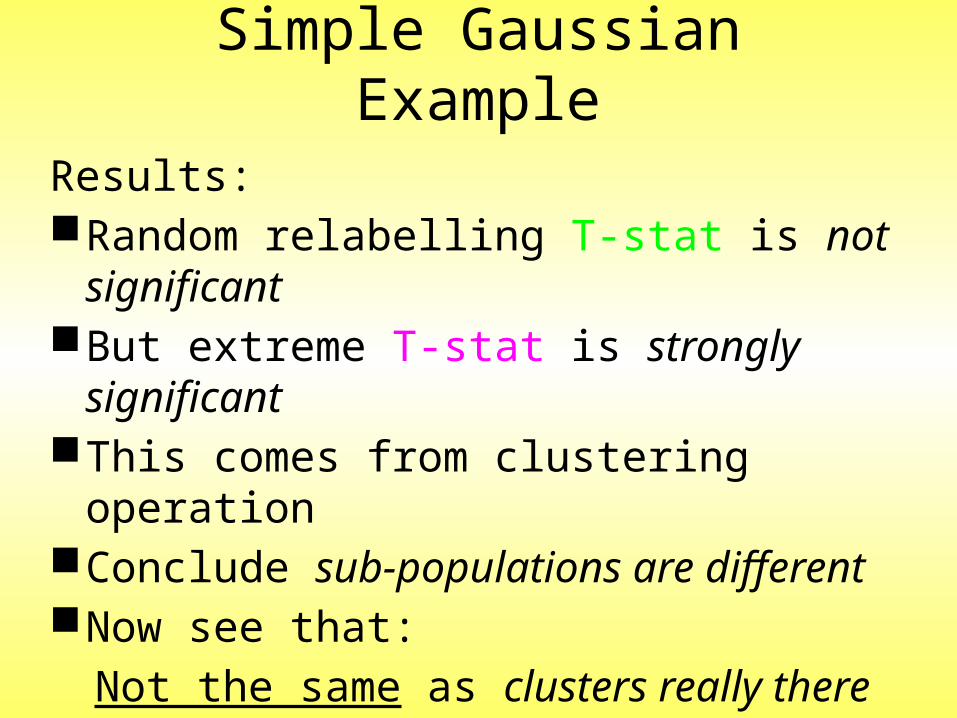
Results:Random relabelling T-stat is not significantBut extreme T-stat is strongly significantThis comes from clustering operationConclude sub-populations are differentNow see that:
Not the same as clusters really there
Simple Gaussian Example
Results:Random relabelling T-stat is not significantBut extreme T-stat is strongly significantThis comes from clustering operationConclude sub-populations are differentNow see that:
Not the same as clusters really thereNeed a new approach to study clusters

Statistical Significance of Clusters
Basis of SigClust Approach:
What defines: A Single Cluster?A Gaussian distribution (Sarle & Kou 1993)

Statistical Significance of Clusters
Basis of SigClust Approach:
What defines: A Single Cluster?A Gaussian distribution (Sarle & Kou 1993)
So define SigClust test based on:2-means cluster index (measure) as statisticGaussian null distributionCurrently compute by simulationPossible to do this analytically???

SigClust Statistic – 2-Means Cluster Index
Measure of non-Gaussianity:2-means Cluster IndexFamiliar Criterion from k-means Clustering

SigClust Statistic – 2-Means Cluster Index
Measure of non-Gaussianity:2-means Cluster IndexFamiliar Criterion from k-means ClusteringWithin Class Sum of Squared Distances to
Class MeansPrefer to divide (normalize) by Overall Sum
of Squared Distances to MeanPuts on scale of proportions

SigClust Statistic – 2-Means Cluster Index
Measure of non-Gaussianity:2-means Cluster Index:
Class Index Sets Class Means
“Within Class Var’n” / “Total Var’n”
22
1
2
1
|| ||
,|| ||
k
k
cj
k j C
n
jj
x x
CIx x
SigClust Gaussian null distribut’n
Which Gaussian (for null)?

SigClust Gaussian null distribut’n
Which Gaussian (for null)?
Standard (sphered) normal?No, not realisticRejection not strong evidence for clusteringCould also get that from a-spherical Gaussian

SigClust Gaussian null distribut’n
Which Gaussian (for null)?
Standard (sphered) normal?No, not realisticRejection not strong evidence for clusteringCould also get that from a-spherical Gaussian
Need Gaussian more like data:Need Full modelChallenge: Parameter EstimationRecall HDLSS Context

SigClust Gaussian null distribut’n
Estimated Mean, (of Gaussian dist’n)?1st Key Idea: Can ignore this

SigClust Gaussian null distribut’n
Estimated Mean, (of Gaussian dist’n)?1st Key Idea: Can ignore thisBy appealing to shift invariance of CI
When Data are (rigidly) shiftedCI remains the same
So enough to simulate with mean 0

SigClust Gaussian null distribut’n
Estimated Mean, (of Gaussian dist’n)?1st Key Idea: Can ignore thisBy appealing to shift invariance of CI
When Data are (rigidly) shiftedCI remains the same
So enough to simulate with mean 0Other uses of invariance ideas?

SigClust Gaussian null distribut’n
Challenge: how to estimate cov. Matrix ?

SigClust Gaussian null distribut’n
Challenge: how to estimate cov. Matrix ?Number of parameters:E.g. Perou 500 data:
Dimension
so
But Sample Size
2
)1( dd
533n
46,797,9752
)1(
dd9674d
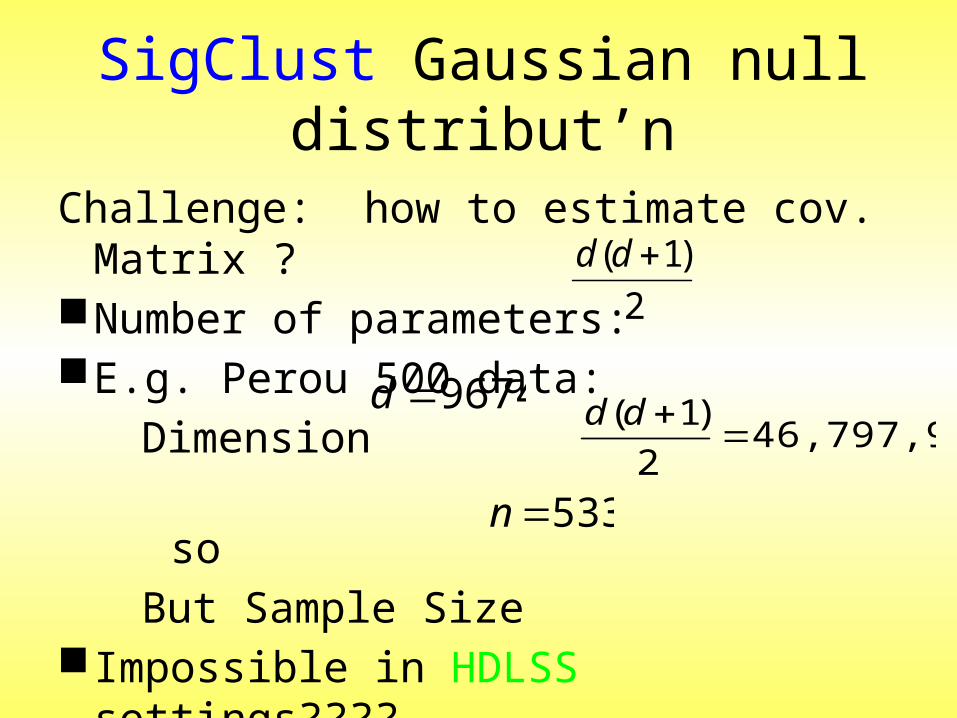
SigClust Gaussian null distribut’n
Challenge: how to estimate cov. Matrix ?Number of parameters:E.g. Perou 500 data:
Dimension
so
But Sample Size Impossible in HDLSS settings????
Way around this problem?
2
)1( dd
533n
46,797,9752
)1(
dd9674d

SigClust Gaussian null distribut’n
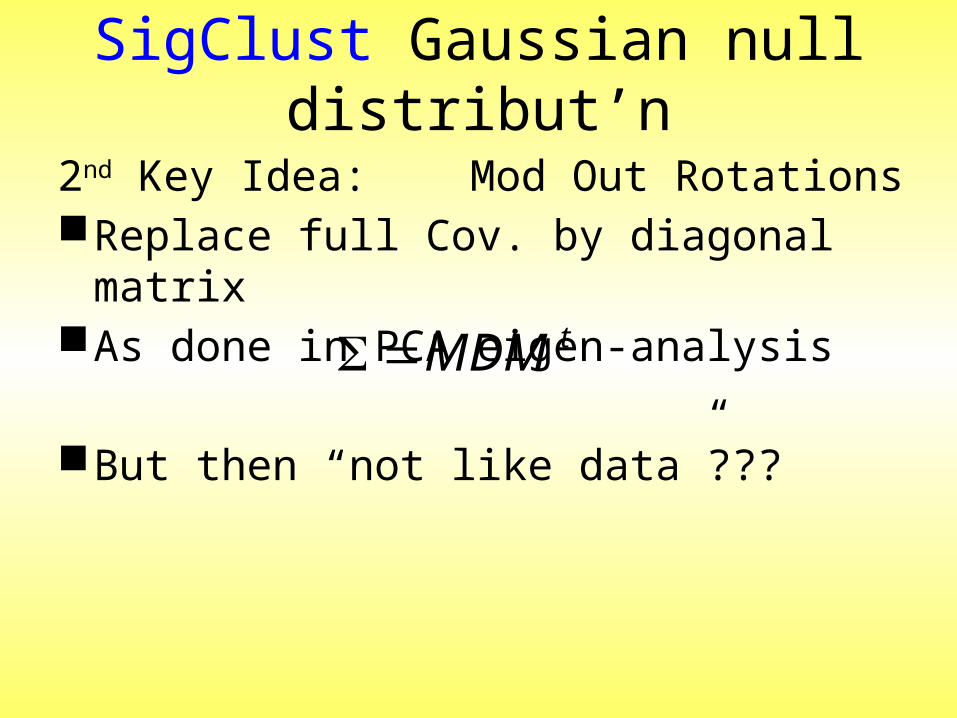
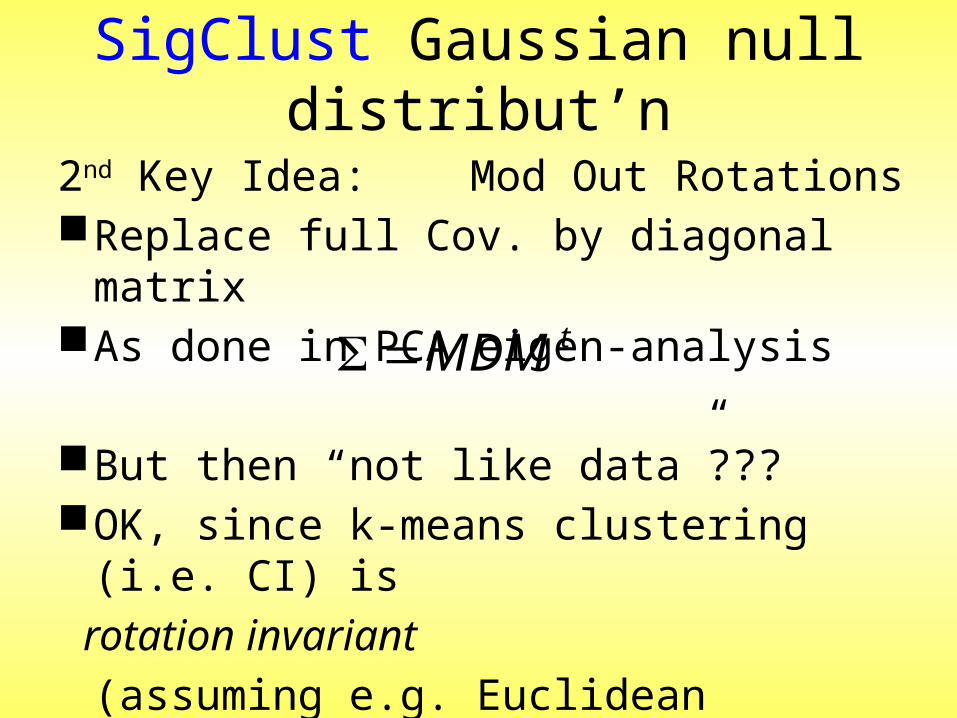
2nd Key Idea: Mod Out Rotations
SigClust Gaussian null distribut’n
2nd Key Idea: Mod Out RotationsReplace full Cov. by diagonal matrixAs done in PCA eigen-analysis
But then “not like data”???
tMDM
SigClust Gaussian null distribut’n
2nd Key Idea: Mod Out RotationsReplace full Cov. by diagonal matrixAs done in PCA eigen-analysis
But then “not like data”???OK, since k-means clustering (i.e. CI) is
rotation invariant
(assuming e.g. Euclidean Distance)
tMDM

SigClust Gaussian null distribut’n
2nd Key Idea: Mod Out Rotations
Only need to estimate diagonal matrix
But still have HDLSS problems?

SigClust Gaussian null distribut’n
2nd Key Idea: Mod Out Rotations
Only need to estimate diagonal matrix
But still have HDLSS problems?
E.g. Perou 500 data:
Dimension
Sample Size
Still need to estimate param’s9674d533n9674d

SigClust Gaussian null distribut’n
3rd Key Idea: Factor Analysis Model