Embed Size (px)
Citation preview

Support for pro-poor agricultural development and rural poverty reduction
in Eastern Cape
By
Dzivakwi, Robert and Jacobs, Peter T.
Poster presented at the Joint 3rd African Association of Agricultural
Economists (AAAE) and 48th Agricultural Economists Association of South Africa
(AEASA) Conference, Cape Town, South Africa, September 19-23, 2010

AEASA September 2010 1
Support for pro-poor agricultural development and rural
poverty reduction in Eastern Cape
Robert Dzivakwi and Peter T. Jacobs1
Paper/Poster submitted for Presentation at Agricultural Economics Association of SA
Annual Conference September 2010
Cape Town South Africa
First Draft (Not for Citation) May 2010
Corresponding Author: Mr. Robert Dzivakwi Department of Economics University of Western Cape Room 3.10 3rd level EMS Building Modderdam Road Bellville,Cape Town 7535 South Africa Cell Number:+27-72 867 9018 E-mail Address: [email protected]; [email protected]
1 Robert Dzivakwi, Masters Candidate- NRF/Norwary Project on ‘Agro-Food Markets and the Rural Poor”, Economics Department, University of the Western Cape. Peter Jacobs, Chief Research Specialist, Human Sciences Research Council, Cape Town.
AEASA September 2010 2
Support for pro-poor agricultural development and rural poverty reduction in
Eastern Cape
Abstract
Official data show that a small proportion of Eastern Cape households evidently derive their main or primary income from farming. But the same data also show that the majority of households with access to small plots suitable for farming are concentrated in Eastern Cape. Furthermore, comparative analyses of standard indicators of human well-being and development of Eastern Cape with the rest of South Africa show that the province consistently reports worse than national average rates of poverty, food insecurity, unemployment and inequality- reaching extreme levels in rural locations. Over the medium term, higher economic growth and service-oriented sectoral change, might be inadequate to reverse this dismal track record in human well-being. In this context, this paper considers the potential of better targeted public spending on agricultural development for resource-poor small farmers to raise living standards in the Eastern Cape. According to the latest official evidence, slightly more than half a million households in Eastern Cape (representing roughly 40% of all South African households) reported that they have access to farmland- with average land size in the order of 1-1.25 ha per farmily. Interventions aimed at boosting agricultural productivity among these small producers, such as the CASP launched in 2004/05, must be better targeted to meet the needs of the intended beneficiaries.

AEASA September 2010 3
Support for pro-poor agricultural development and rural
poverty reduction in Eastern Cape
1. Introduction
Approximately 6.6 million people live in the Eastern Cape, comprising roughly 13.5% of
the South African population, ranking it third in terms of population size behind Gauteng
and KwaZulu-Natal (Statssa, 2009). The province incorporates the former homelands of
Transkei and Ciskei, fragmented enclaves designed under apartheid and systematically
underdeveloped through lack of sustainable investment and constant out-migration of its
productive workforce. Although the highest population densities prevail in and around
Port Elizabeth and Uitenhage, a coastal metropolitan hub constructed around a restricted
secondary industrial base, substantial numbers of the province’s population reside in rural
areas around commercial farms and communal-tenure villages (Eastern Cape Provincial
Government [ECPG], Growth and Development Plan, 2004).
What this last point underscores is that any effective provincial development strategy
ought to coherently set out empowering and growth-enhancing interventions for rural
development, or perhaps more precisely, sustainable agricultural-led development. It
must strive to boost productivity and employment creating investment in agriculture as a
way to improve human well-being. Moreover, the spatial spread of key development
indicators- unemployment and money-metric indicators of poverty and inequality point to
rural localities to be at a distinct disadvantage with extremely dismal scores for the

AEASA September 2010 4
standard set of indicators. Comparing these indicators of human well-being with similar
national data for South Africa highlights an even more depressing contrast of socio-
economic underdevelopment and deprivation. It is indeed a poor province seriously in
need of a comprehensive and sustainable development strategy.
Eastern Cape provincial government has an economic development plan which gives
marginal attention to its agricultural sector. Furthermore, the new 2010-2014 strategic
plan of the provincial Agricultural Department lacks a clear perspective on how to
optimize the agricultural resource-potential of the province for sustainable livelihoods
and raise the living standards of people living in that region of South Africa. In this
context, this paper critically evaluates the current and potential contribution of
agricultural development as an integral component of a broader pro-poor Eastern Cape
economic development strategy. Agriculture’s direct and indirect contributions to
economic development are well-documented (Meijerink and Roza 2007, NDA 2001,
Bresciani and Valdes 2007). It contributes to economic growth and has the potential to
reduce income poverty on a sustainable basis- especially through wage-labour on farms
and income-generating small-scale farming.
The paper is divided into 3 main sections: First, we present a comparative overview of
Eastern Cape economic growth trajectory and pathways, with special attention to sectoral
contributions. The second part shifts attention to livelihood strategies and living standards
to highlight the main ways in which rural people in the province make a living. The third
main section critically reviews the agricultural sector in the province, focusing on land
AEASA September 2010 5
use patterns by agricultural sub-sectors (highlighting agro-ecological changes underway),
land/ agricultural reforms and examines public expenditure on agriculture to demonstrate
the extent to which a pro-poor agricultural led strategy informs policy. Overarching
conclusions and directions for future research are offered in the final section.
2. Economic development pathways of the Eastern Cape
2.1. Phases of economic growth
To argue the case for a pro-poor agricultural development strategy for Eastern Cape, this
section starts with a comparative overview of key provincial economic indicators in
recent years. This overview draws specific attention to the provincial economic growth
rate and trends in the contributions of key sectors to its economic performance. We focus
on the post-apartheid era because the 1996 Constitution and subsequent spatial policy
framework legally fixed its provincial borders. To contextualize this background
information, and where feasible, a comparative analysis with relevant national-level data
will be presented.
Eastern Cape Province contributed about 7.5% to the national GDP in 2008 (StatsSA
2009). Figure 1 shows that for the period 1996 to 2009, economic growth in Eastern Cape
roughly tracked the nationwide trend. Over this short period, it is possible to subdivide
the economic performance in Eastern Cape into four distinct phases: a downturn from
1996 to 1998; lackluster growth for 1998-2002; steady and accelerated growth until
2006-2007; an economic downturn post-2008. Economic upturns and downturns closely
match national trends, albeit usually lower levels than the national average rate of
AEASA September 2010 6
growth. This implies that sectors that drive economic performance in the province have
been and continue to be very sensitive to forces that impact on the national economy.
Historically, the real GDP growth rate for Eastern Cape has experienced more
fluctuations relative to other provinces. Degefe, (1998), for example, argues that the
economic downturn of 1996-1998 was a direct spillover from East Asian Economic
crisis, which evidently had an extended lagged-effect on South Africa. Tracking the
developmental outcomes of the lackluster economic performance, Khosa (2002) found
that ‘growth failed to trickle down to the poor’ but was, unsurprisingly, inadequate to
substantially raise real living standards.
The steady accelerated economic growth which started in 2002 and peaked around 2006-
07, was driven and sustained by many factors. However, policy statements tend to focus
on the latter period of the growth cycle. Eastern Cape policy makers adapted the
Accelerated and Shared Growth Initiative for South Africa (ASGI-SA) introduced by the
Mbeki-administration in 2005, to propel economic expansion in the province in a more
focused manner whilst also aligning it to national policy priorities (PDGP, 2009). When
compared to the national average, growth rates declined in 2008 as a result of the global
economic downturn initially driven by the financial crisis linked to the US housing
sector.

AEASA September 2010 7
Figure 1: Comparison of Provincial Real GDP and South Africa average GDP at
constant price 2005 and
3.3
1.8
-0.4
2.4
4.3
2.7
1.6
2.6
3.6
4.9
5.45.2
3.7
-1.0
4.3
2.6
0.5
2.4
4.2
2.7
3.7
2.9
4.6
5.3
5.6 5.5
3.7
-1.8
-3.0
-2.0
-1.0
0.0
1.0
2.0
3.0
4.0
5.0
6.0
1995 1996 1997 1998 1999 2000 2001 2002 2003 2004 2005 2006 2007 2008 2009
Eastern Cape South Africa ave
Source: Stats SA, 2009 2.1. Composition of key economic sectors
Visible shifts in the sectoral composition of economies normally occur over long periods
and display structural development patterns (Memedovic, and Lapadre, 2009). Data
limitations and the brief post-apartheid period prevent us from detecting large-scale
transformations in the sectoral composition of provincial and national economic output.
Against the backdrop of these constraints, we present a snapshot of trends in sectoral
composition for the last 15 years. This helps to understand where agriculture fits into
overall development, its potential value addition to growth and its status relative to other
sectors.

AEASA September 2010 8
Figure 3 below shows the sector contribution to the province GDP and confirms the
relative decline in the primary and secondary sectors since the mid-1990s. In 2008, the
tertiary sector made the main contribution to provincial economic growth- estimated to
account for 68.5% of economic output. At the same time, the contribution of the
secondary sector contributed around 19% whilst the primary sector (predominantly
farming) contributed 2.4% to value-added output. The main components of the tertiary
sector are the financial sector (20%) and community and personal services (Barbour and
Sowman, 2004, StatsSa 2007). The primary sector, particularly agriculture, is unstable as
it remains vulnerable to exogenous environmental and macro-economic shocks.
Figure 3: Comparison sector contribution to the Provincial economy from 1995 to
2008
0%
20%
40%
60%
80%
100%
1995 1996 1997 1998 1999 2000 2001 2002 2003 2004 2005 2006 2007 2008
Primary Industries Secondary Industries Tertiary industries Source: Stats SA, 2009

AEASA September 2010 9
3. Livelihood strategies and living standards
In this section we present an overview of the livelihood strategies and living standards of
people in Eastern Cape. Historically, agriculture played a key role in sustaining living
standards. However, today the sources of household income appear to be more
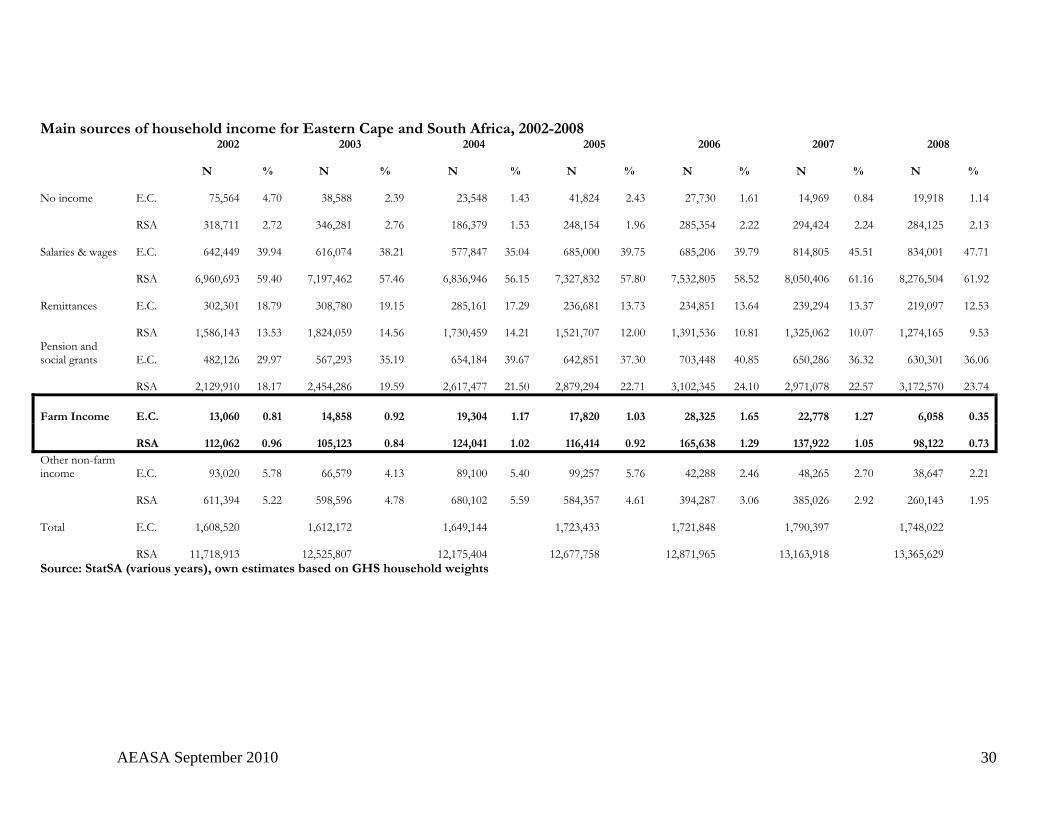
diversified, but heavily reliant on transfer incomes: pensions/grants and remittances-
drawing on reported main source of the household income in the General Household
Survey (StatsSA, various years). The point here is that even this might offer a very
inaccurate view of what is happening because people might be investing some of their
cash transfers in small-scale farming- anecdotal evidence seems to suggest this.
3.1.Employment and livelihood strategies
Employment remains the chief pathway to lift people out of poverty. To understand this,
we need to focus on labour market participation of the population in Eastern Cape.
Historically, rural households of former homelands have supported their families with
remittance incomes of family migrants working in the mines and commercial farms
(Perret et al, 2000). With the poor performance and weak labour-absorbing growth in
mining, employment declined significantly in this sector. Furthermore, the sectoral shift
from primary industry towards manufacturing and tertiary industries has led to relatively
slow absorption of unskilled and semi-skilled labour because these sectors demand more
of skilled labour. Overall, the sectors that drive economic growth in Eastern Cape have
not significantly absorbed the available labour force (Barbour and Sowman, 2004).
AEASA September 2010 10
Officially, agriculture’s contribution to job creation in 2002 stood at 9% of the workforce
in the province. From 1996 to 2002 the average annual employment growth rate in
agriculture was in the order of 3% (Fraser et al, 2003). The majority of those employed in
agriculture are employed in the large commercial farms and in some instances by the
emerging farmers. Smallholder farmers rarely employ permanent non-family workers;
they typically rely on family labour (D’haese, et al, 2005). By 2009, commercial farms
employed 725 000 workers (Statistic South Africa, 2009).
Livelihood strategies for rural households are closely tied to labour market participation
(Simbi and Aliber, 2000). Even though remittances represent the second component for
the rural livelihood, it has significantly declined (Barbour and Sowman, 2004; see also
data in appendix). The province lacks diversity in the rural non-farm economy and
abundant labour-intensive small-scale industries and other local value adding activities
(Farolfi and Perret, 2002). As a consequence there has been significantly reduced
employment in the rural non-farm sector alongside the decline in remittance incomes.
Islam and Buckley (2009) added that low wages in commercial farms have left workers
with virtually no extra income to send to their rural families. In the context of the 2007-
2008 wave of rapid food price inflation, the inability of migrants to remit might have
contributed to rising incidents of household food insecurity.
Farming forms part of a mix of livelihood strategies activities among poor rural
households across Eastern Cape. They regard livestock as a source to ‘smooth incomes’
and as a mitigation strategy against uninsured economic shocks/risks (Nkonki, 2007).

AEASA September 2010 11
Fraser et al (2003) calculated that in the central Eastern Cape (note: Ciskei area for 1999
included), agriculture contributed 9,3% of the rural household income. Perret (2002)
argues that full-time farming (sheep keeping and wool production), remains an alternative
strategy to earn cash income, despite high risks, compounded by missing and imperfect
credit and product markets in many rural localities in the province.
3.2. Living standards of population
The Eastern Cape Province faces a number of challenges such as underdevelopment, high
unemployment, high dependency ratios, high poverty levels, and a skewed economic
structure (Provide, 2005). This is a province which is more than 60 percent rural and yet
is driven by the tertiary sector, with a total contribution of 68.5% to the economy
(Statistics South Africa, 2009). The GDP per person in the Eastern Cape is lower than the
national average (Provide, 2005, Stats SA, 2009). According to the IES/LFS 2000
estimate the Eastern Cape per capita income was R6,774 in 2000, only about half the
national average of R12,411. The average income reported from an agricultural
household amount to R17,729 lower relative to that of non-agricultural households
amounting to R32,204. Also on racial groups, Coloured and African agricultural
households are the least earners with income levels R13,690 and R12,749 respectively,
while White agricultural households had the highest of R145,806 (Provide, 2005).
Food shortage is also a problem in the province (Provincial growth and developmental
plan, 2004). The climatic conditions are not conducive for crop production. Grain is
AEASA September 2010 12
acquired from large commercial farmers and group projects under irrigation. Also some
smallholder farmers do have small gardens at the back of their homesteads (Bank and
Meyer, 2006). The grain from such practice cannot be enough to support the whole
family. Hence, livestock are sometimes sold to generate income for food purchase
(Provide, 2005). Aliber and Hart (2009) found 3-4 million households engage in small-
scale farming, to supplement their food requirements, with the majority of these resource-
poor small farmers in Eastern Cape. According to BMR (2005), the province has the
majority population in the in the lowest income category, and spend the largest amount
on food. In this case, of the R70 billion estimated in 2005, 25.5% accrue to food. Food
expenditure accounts for 60%-80% of the household and agriculture can help with long-
term food security (Baiphethi and Jacobs, 2009).
Poverty has not changed significantly over period between 2004 and 2008 (BMR, 2009).
Currently, nearly 7 out of 10 people still live in poverty. The East of the province still has
the highest poverty concentration. Income inequality can be seen prominently between
the urban and the rural population. In the rural population, inequality is seen in between
the agricultural and non-agricultural households (Provide, 2005). The poverty is very
much directly linked to the historical economic neglect of the province.
Household in the Eastern Cape can either be categorized as agricultural and non-
agricultural household (Provide, 2005). The agricultural households are mainly found in
the rural area, while the non-agricultural households occupy the urban areas. The sources
of income for the rural households include: agricultural income (sales of agricultural

AEASA September 2010 13
products, wage income from working in the commercial farms) and non-agricultural
income (pension funds, child grant and remuneration from working). The evidence from
the Provide (2005) shows that the agricultural households are worse-off in terms of
income when compared the non-agricultural households.
Headcount poverty rates measured in monetary terms in Eastern Cape remain the highest
in the country- hovering between 60% and 70% depending on various estimates used
(Provide, 2005; Bank and Meyer, 2006). At municipal level only Nelson Mandela
metropolitan (around Port Elizabeth) had poverty rates below the national average. Other
areas had poverty above the national average, with the OR Tambo, Amathole and Chris
Hani ranked the poorest districts (Provide, 2005).
Poverty is mainly a rural phenomenon, agricultural households having the highest levels
and depth of poverty. Moreover, poverty is not a static condition, especially among
farmers (Perret, 2002). It may shift from one type to another due to the life-cycles and
other factors such as shocks/crises, and long-term factors. Examples given by Bank and
Meyer (2006), includes racial/gender discrimination and market failures. The life-cycle
plays a major role as aging population get more access to pension fund. 2Given that that
has been significant increase in the contribution of government transfers of over years.
Evidence from the BMR (2009) shows that in 2008 financial year, 12,8 million
household received grants country wide. Of this figure, about 18% where in the Eastern
Cape second highest following the 25.4% in the KZN. This could be explained by the
2 Government transfers in South Africa has seven types of social grants; Care Dependency, Child support, Foster care, Grand-in-aid, Old age grant, Disability and War Vet grant.

AEASA September 2010 14
fact that these are two provinces with the highest number with in the lowest income
group.
Poverty is also correlated with education level. According Perret (2002), high poverty
levels exist in households with no education. Provide (2005) shows poverty as in the
province correlated with ill-health as well as unemployment. From these patterns of
poverty and unemployment, we can deduce that growth in the province has not
significantly reduced poverty and joblessness.
Using income as one way of measuring poverty, in 2007 about 67% of the Eastern Cape
population had income below R800 a month (Stats SA, Community survey, 2007).
According to the BMR (2009), the majority of the households country wide (51.5%) have
their income trapped in the lowest income group. Eastern Cape has 19% (1310193) of
households in the lowest income group, just below that of KZN (20.5% -1411913).
Table 1 below shows a set of common measures of human well-being for Eastern Cape
for the period 2000-2007. Although there has been a decline in th average poverty
headcount ratio over this period, and the absolute numbers of people living in poverty,
the provincial HDI and gini coefficient do not show overall improvements in human
well-being. In terms of income distribution, the province is characterised by inequality, as
shown with Gini coefficient close to 1. The Gini coefficient figures in the table above
shows that inequality has worsened from 2000 to 2007 increasing fro 0.65 to 0.67.

AEASA September 2010 15
(Estimates from Provide (2005) placed the Eastern Cape gini in 2000 in the order of
0.69.).
Table 1: Comparative overview of Human Development Measures for the Eastern
Cape3
Measure 2000 2004 2007
Human Development index (HDI) 0.49 0.53 0.53
Gini Coefficient 0.65 0.67 0.67
Number of people in poverty (million) 3.99 4.31 3.95
Percentage of people in poverty (%) 63.1 67.2 61.9
Source, Global Insight, 2008
The source of inequality is from the labour income for the overall Gini coefficient for the
province (Provide, 2005). It is interesting to note that, income from gross operating
surplus4 contributes to the inequality more amongst the agricultural households than in
the non-agricultural household. This could imply that, the inequalities in the ownerships
of capital stock and land are the driving factors amongst agricultural households
(Provide, 2005). It is also believed that inequalities within agricultural households are
driven primarily by inequalities in the distribution of wages (Provide, 2005).
3 Measures the ability to live a healthy life, communicate, participate in the community and means to afford a decent living. The Gini coefficient measures the inequality takes figures between 0 and 1 representing perfect equality and perfect inequality respectively. 4 Income from gross operating surplus can be interpreted as returns to physical and human capital, and, in an agricultural context, the returns to land owned by the agricultural household. Implying that inequalities in the ownerships of capital stock and land are the driving factors to the inequality amongst agricultural households (Provide, 2005)

AEASA September 2010 16
4. Support for pro-poor agricultural development
4.1. Agricultural dualism
South Africa has a dualistic agricultural sector which means that alongside highly
capitalized and large-scale commercial sector many resource-poor small farmers cultivate
crops and keep livestock under varied land tenure arrangements. (NDA 2001, Kirsten and
van Zyl 1998). Historically, commercial agriculture has been dominated by a minority of
white farmers, either as family farmers, agricultural cooperatives or modernizing
agribusinesses. Resource-poor small farmers are predominantly black and more than two-
thirds of them are concentrated in the former homelands, mainly but not exclusively in
the including Eastern Cape. According to table 2 below, 70% of the land (17,1 million
hectares) is in the provinces’ commercial farming regions against 30% in developing
areas (the former homelands). This inequality in land distribution is even starker if
examined in conservative per capita terms because more resource-poor farmers are
concentrated on this smaller proportion of land. The post-apartheid government has been
implementing policies for a more equitable distribution of land and agricultural resources
in an effort to gradually overcome agricultural or agrarian dualism. In Eastern Cape, as
well as other provinces, some beneficiaries of these land and agricultural reforms form a
new category of small black farmers on private farmland often categorized as emerging
farmers.
Land and agro-ecological conditions remain key determinants of farming yields and
returns, especially for resource-poor farmers using traditional methods and unable to
make huge capital investment in farming. Table 2 compares land availability, potential
AEASA September 2010 17
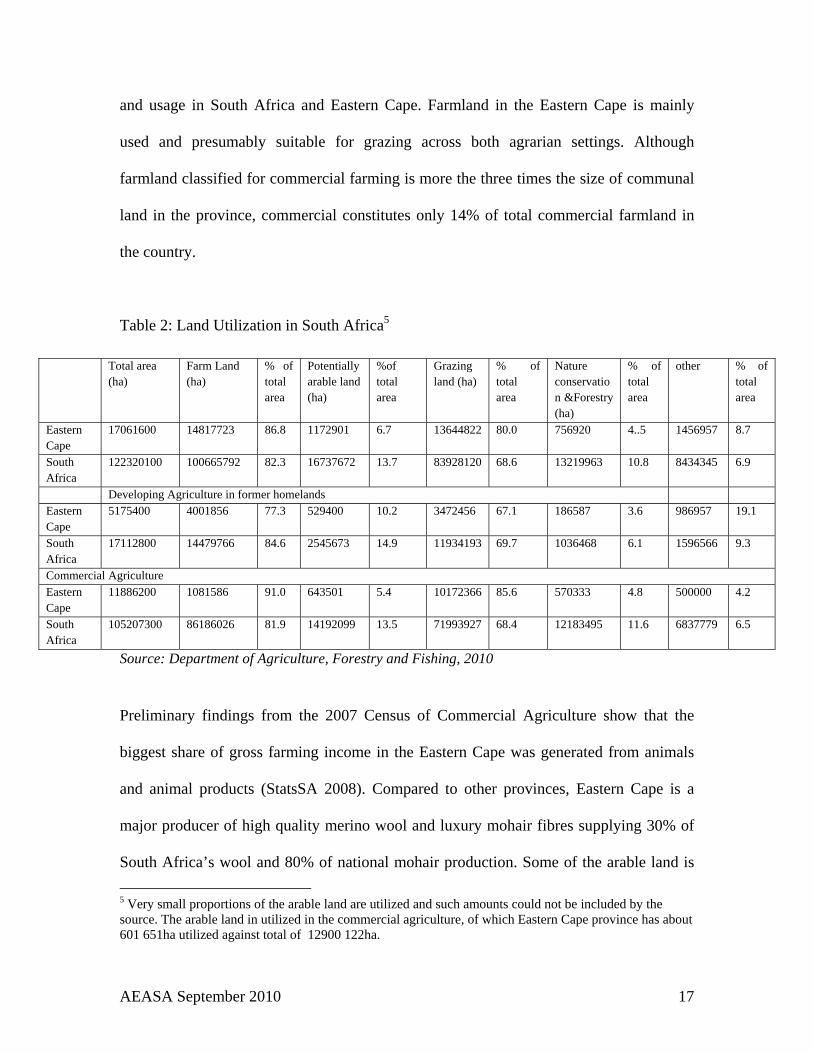
and usage in South Africa and Eastern Cape. Farmland in the Eastern Cape is mainly
used and presumably suitable for grazing across both agrarian settings. Although
farmland classified for commercial farming is more the three times the size of communal
land in the province, commercial constitutes only 14% of total commercial farmland in
the country.
Table 2: Land Utilization in South Africa5
Source: Department of Agriculture, Forestry and Fishing, 2010
Preliminary findings from the 2007 Census of Commercial Agriculture show that the
biggest share of gross farming income in the Eastern Cape was generated from animals
and animal products (StatsSA 2008). Compared to other provinces, Eastern Cape is a
major producer of high quality merino wool and luxury mohair fibres supplying 30% of
South Africa’s wool and 80% of national mohair production. Some of the arable land is
5 Very small proportions of the arable land are utilized and such amounts could not be included by the source. The arable land in utilized in the commercial agriculture, of which Eastern Cape province has about 601 651ha utilized against total of 12900 122ha.
Total area (ha)
Farm Land (ha)
% of total area
Potentially arable land (ha)
%of total area
Grazing land (ha)
% of total area
Nature conservation &Forestry (ha)
% of total area
other % of total area
Eastern Cape
17061600 14817723 86.8 1172901 6.7 13644822 80.0 756920 4..5 1456957 8.7
South Africa
122320100 100665792 82.3 16737672 13.7 83928120 68.6 13219963 10.8 8434345 6.9
Developing Agriculture in former homelands Eastern Cape
5175400 4001856 77.3 529400 10.2 3472456 67.1 186587 3.6 986957 19.1
South Africa
17112800 14479766 84.6 2545673 14.9 11934193 69.7 1036468 6.1 1596566 9.3
Commercial Agriculture Eastern Cape
11886200 1081586 91.0 643501 5.4 10172366 85.6 570333 4.8 500000 4.2
South Africa
105207300 86186026 81.9 14192099 13.5 71993927 68.4 12183495 11.6 6837779 6.5

AEASA September 2010 18
considered suitable for crop farming: slightly more than 500,000 ha in developing areas
compared to 600,000 ha under commercial crop production. Pineapples and chicory are
major commercially produced crops and recent data suggest output of both crops
continue to increase (DAFF, 2010).
According to the available official evidence, reported in table 3.1 below, slightly more
than half a million households in Eastern Cape (representing roughly 40% of all South
African households) reported that they have access to farmland- with land size in the
order of 1-1.25 ha per family.
Table 3: Households reporting access to farming plots by average plot size (in hectares) for Eastern Cape and South Africa, 2005-2008
2005 2006 2007 2008 Eastern
Cape South Africa
Eastern Cape
South Africa
Eastern Cape
South Africa
Eastern Cape
South Africa
Avg. land size (ha) 1.04 1.86 1.19 1.65 1.23 1.92 1.18 1.80 st. dev (ha) 1.89 3.66 2.13 3.57 3.08 4.24 2.21 3.95 N (households) 532,255 1,183,441 656,482 1,380,252 526,855 1,142,653 506,506 1242152
Source: StatsSA (various years) GHS
4.2. Land and agricultural policy reforms
In Eastern Cape, as in other provinces that incorporate the former homelands, the
disparities between the commercial and communal (particularly resource-poor
smallholder) farmers cut across the areas of access to productive inputs and access to
markets. In communal areas land tenure arrangements remain insecure and certain and
this is a disincentive to private investment in efficiency enhancing farming practices.
Natural resource degradation and poor access to water, primarily due to inadequate
investment in upgrading irrigation, are additional barriers to raising farm productivity in
communal areas. Other factors constraining farming in the underdeveloped regions of

AEASA September 2010 19
are: poor agricultural infrastructure, inadequate access to functional social service, lack of
ownership of land, capital assets and finance capital.
Over the last 15 years several state policies have been adopted to bridge the gap between
the large commercial farmers and small-scale farmers. Land reform, deregulation of
agricultural markets, the formalization of farm dweller tenure relations, and AgriBEE are
examples of these policy changes. The motivation for land reform is grounded in the
notion that promoting smallholder agricultural growth can be an effective strategy to
reduce rural poverty and income inequality (Machethe, 2004). The Land Redistribution
for Agricultural Development (LRAD), rights-based land restitution and legislation to
protect the tenure rights of farm dwellers continue to be national and provincial flagship
land reform strategies.
According to the Eastern Cape development plan, only 4.3% of land in the Eastern Cape
has been transferred to ‘emerging farmers’ since 1994 (PGDP, 2009), partly due to lack
of funding. Some of the challenges facing land reform programme mentioned includes;
inadequate resources, insecure land tenure arrangements, poor M& E systems, weak
(often non-existent) intergovernmental coordination and other institutional arrangements
(including dysfunctional community property associations). Beside the periodic quality of
life surveys, comprehensive information about the socio-economic status of land reform
beneficiaries is still lacking and this is an obstacle to systematically track the livelihoods
impacts of land reforms (Hall 2009).
AEASA September 2010 20
4.3. Agricultural development support
If agricultural development is to achieve its pro-poor outcomes, appropriate policies and
adequate fiscal support are vital. Additional policies, such as the Comprehensive
Agricultural Support Programme (CASP) and Agricultural Broad Based Black Economic
Empowerment (AgriBBBEE), have also been selectively implemented to fast track
agricultural development support to poor black farmers. National Budgets and Estimates
of National Expenditures published annually by National Treasury show that national
fiscal expenditure on agriculture has been increasing from R872 million (in 2001/02) to
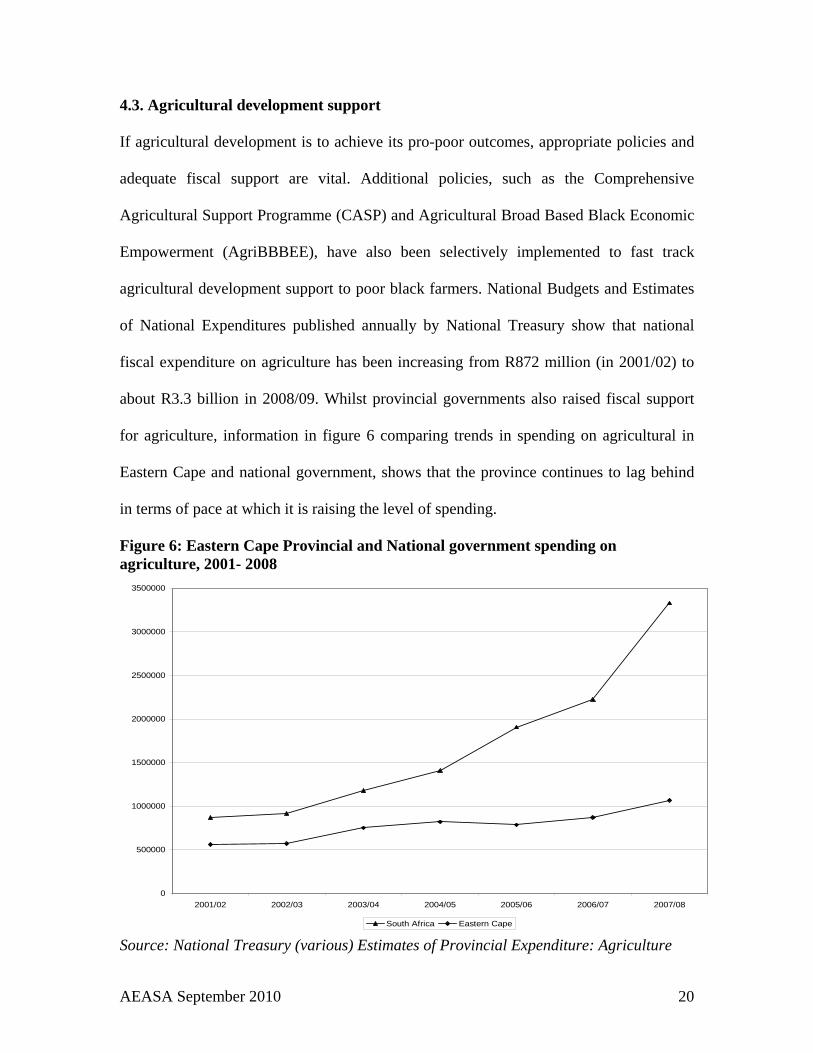
about R3.3 billion in 2008/09. Whilst provincial governments also raised fiscal support
for agriculture, information in figure 6 comparing trends in spending on agricultural in
Eastern Cape and national government, shows that the province continues to lag behind
in terms of pace at which it is raising the level of spending.
Figure 6: Eastern Cape Provincial and National government spending on agriculture, 2001- 2008
0
500000
1000000
1500000
2000000
2500000
3000000
3500000
2001/02 2002/03 2003/04 2004/05 2005/06 2006/07 2007/08
South Africa Eastern Cape
Source: National Treasury (various) Estimates of Provincial Expenditure: Agriculture
AEASA September 2010 21
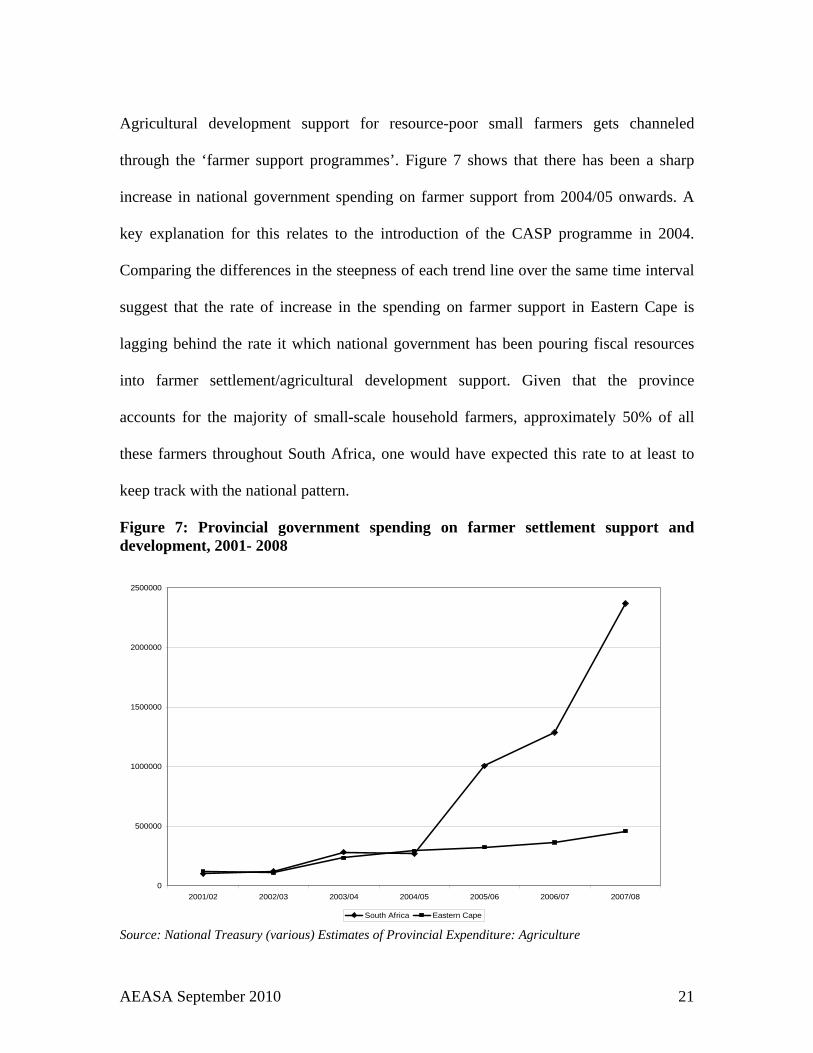
Agricultural development support for resource-poor small farmers gets channeled
through the ‘farmer support programmes’. Figure 7 shows that there has been a sharp
increase in national government spending on farmer support from 2004/05 onwards. A
key explanation for this relates to the introduction of the CASP programme in 2004.
Comparing the differences in the steepness of each trend line over the same time interval
suggest that the rate of increase in the spending on farmer support in Eastern Cape is
lagging behind the rate it which national government has been pouring fiscal resources
into farmer settlement/agricultural development support. Given that the province
accounts for the majority of small-scale household farmers, approximately 50% of all
these farmers throughout South Africa, one would have expected this rate to at least to
keep track with the national pattern.
Figure 7: Provincial government spending on farmer settlement support and development, 2001- 2008
0
500000
1000000
1500000
2000000
2500000
2001/02 2002/03 2003/04 2004/05 2005/06 2006/07 2007/08
South Africa Eastern Cape
Source: National Treasury (various) Estimates of Provincial Expenditure: Agriculture

AEASA September 2010 22
The observed expansion in the monetary value of agricultural development support
provides insufficient evidence to assess the importance attached to the agricultural sector.
One way to shed light on this is by looking at the changes in two proportions:
(a) the proportion of agricultural spending in total expenditure- to illustrate where
agriculture ranks relative to other spending priorities
(b) the proportion of the farmer support relative to total agricultural expenditure- to
show the extent to which fiscal resources are targeted at resources-poor farmers.
Figure 8 graphs the share/proportion of farmer support expenditure relative to total
spending on agriculture for the province and that of South Africa, respectively. Our
estimate of (a) at the national level show that government continues to spend less than
1% of its total budget on agriculture and only a small fraction of national expenditure
actually goes directly to farmer beneficiaries.
Focusing on Eastern Cape, it is interesting to observe that its relative share on farmer
support spending has been above that at national average for the period prior to 2004/05.
In fact, the share of the farmer support programme has steadily increased from
approximately 21.22% (2001/02) to 41.04% (2005/06) period. However, after 2005/06,
there has not been any substantial rise in share of fiscal resources allocated to farmer
support for the province- rising to mere 43% by 2007/08 .
Figure 8: Farmer settlement support and development as a percentage of total agricultural expenditure by province, 2001-2008

AEASA September 2010 23
11.613.38
23.96
19.06
52.7
57.92
71.12
21.2219.63
31.29
35.71
41.04 41.92 42.99
0
10
20
30
40
50
60
70
80
2001/02 2002/03 2003/04 2004/05 2005/06 2006/07 2007/08
South Africa Eastern Cape Source: National Treasury (various) Estimates of Provincial Expenditure: Agriculture
Going forward, what is the emerging strategic vision of Eastern Cape policy leaders in
the domain of agriculture? Given the foregoing analysis of agricultural development
expenditure patterns, what evidence is there to show that a dramatic pro-resource poor
small farmer shift is beginning to form the thrust of support for agricultural development?
The 2010-2014 Strategic Plan for Eastern Cape agriculture is an informative starting
point because it underscores several initiatives. It laments the underperformance of the
agricultural sector relative to manufacturing, services and tourism sectors. Some of the
major constraints to account for this are resource limitations to support poorer farmers
and rising prices of fertilizer (PGDP, 2009). Land transfers through land reform and
nominal increases in agricultural development support, to date, apparently did not reverse
the overall decline in agricultural productivity and output. Other commentators, such as
Fraser and Jari (2009), are of the view that inefficiencies in agricultural output markets

AEASA September 2010 24
compounded by weak institutional arrangements continue to block the poverty-reducing
potential of support for farming.
The Six-Peg Policy framework which promotes a green revolution strategy for Eastern
Cape is set to continue. To date, this framework has underpinned infrastructure
installation (including fencing, dipping tanks, stock water dams and irrigation schemes)
and key farming inputs such as tractors and implements. In 2007/08, Six-Peg delivered
the following: erected some 650 km of fencing, upgraded 72 dipping tanks, developed 42
small irrigation units, 25 tractors and established 30 stock water facilities. Siyakula
Massive, the provincial intervention to improve food security through maize production,
is set to continue (Tregurtha 2009).
The Rural Sustainable Village Model, aimed to expand investment in agricultural
infrastructure, was introduced in Mbizana in 2008 and is set to be expanded. It promotes
entrepreneurial development with a user friendly marketing information system using cell
phone technology. This initiative was developed and launched in December 2008
(Nkwinti, 2008) to enable previously disadvantaged farmers better access to market
information, particularly output market prices.
Conclusion
This paper has argued the case for promoting a pro-poor agriculture-led development
strategy in Eastern Cape Province, a populous region incorporating the former homelands
of Transkei and Ciskei. Three sets of arguments have been developed in support of this

AEASA September 2010 25
proposition. Firstly, we have demonstrated that accelerated economic growth in Eastern
Cape during 2002-2007, based on tertiary and secondary sectors, has not substantially
improved human well-being. Secondly, while the headcount of income poverty has been
improving, income inequality and the human development index for the province,
especially in rural areas, have worsened. Thirdly, fiscal support for agricultural
development is increasingly lagging behind the pace of national investment, yet the
province is home to the majority of resource-poor small farmers in the South Africa.

AEASA September 2010 26
References:
Barbour, T and Sowman, M, 2004. Eastern Cape Provincial Growth and Development Plan (PGDP) for the period 2004-2014, Mainstrteaming evvironment sustainability consideretions in to the PGDP, Cape Town, Available online: http://www.ecprov.gov.za/index.php?module=pgdp (Accessed 13/01/2010) Baiphethi M.N and Jacobs, P.T., 2009. The contribution of subsistence farming to food security in South Africa Agrekon,48(4) 459 Bank, L and Meyer, L, 2006. Rapid Eastern Cape Provincial Assessment and Socio-economic survey, Summary Report, The Fort Hare Institute of Social and Econmic Research (FHISER) and Development Research Africa (DRA) Bank, L and Minkley, G., 2005. Going Nowhere Slowly? Land, Livelihoods and Rural Development in the Eastern Cape, Social Dynamics, 31(1)1-38 Bureau of Market Research (BMR), 2005. Total cashe expenditures in South Africa by living standards measure (LSM) group and products, Research Paper 347. Bureau of Market Research (BMR), 2008. Income and Expenditure of household in South Africa in 2007 and 2008, Research Report 383 Buso, N., 2003. Municipal Commonage Administration in the Free State Province: Can Municipalities in the Current Local Government Dispensation Promote Emerging Farming? Human Sciences Research Council, October. Available at: http://www.hsrc.ac.za/research/output/outputDocuments/2374Busocommonagereport.pdf Degefe, B, 1998. South - East Asia’s’ Economic Crisis and Africa An overview from the Region, Papers for Discussion, New York Department of Agriculture, Forestry and Fisheries (DAFF), 2009. Abstract of Agricultural Statistics 2010 Davenport, N.A., Gambiza, J., 2009. Municipal commonage policy and livestock owners: Findings from the Eastern Cape, South Africa, Land Use Policy 26: 513–520 de Lange, A., 2004. The Evaluation of Empowerment Policies, Strategies and Performance within the Agricultural Sector, Eastern Cape Province, Final NDA Report-EC Report

AEASA September 2010 27
D’haese, M., Verbeke W., Van Huylenbroeck, J., Kirsten, G and D'haese L., 2005. New Institutional Arrangements for Rural Development: The Case of Local Woolgrowers' Associations in the Transkei Area, South Africa Journal of Development Studies, 41:8, 1444 — 1466 Eiseb, M.M. 2000. Characterization of small-scale farmers in the Keiskammahoek magisterial district of Eastern Cape. Unpublished M Sc Agric dissertation, University of Fort Hare, Alice. Farolfi, S. and Perret, S. 2002, Inter-sectoral competition for water allocation in rural South Africa: Analysing a case study through a standard environmental economics approach, Working paper 23 Freser, G.C.G., Monde, N. and Van Averbeke, W., 2003. Food Security on South Africa: A case study of rural livelihoods in the Eastern Cape Province. In: Lieb Nieuwoudt and Jan Groenewald (eds), The Challenge of Change: Agriculture, Land and the South African Economy, University of Natal Press, Pietermaritzburg, pp 171 - 183. Islam, R and Buckley, G. 2009. Rising food prices and their implications for employment, decent work and poverty reduction, Employment Working Paper No. 30 Jari, B and Fraser, G. C. G., 2009. An analysis of institutional and technical factors influencing agricultural marketing amongst smallholder farmers in the Kat River Valley, Eastern Cape Province, South Africa, African Journal of Agricultural Researce, 4(11)1129-1137,Avalable online at http://www.academicjournals.org/AJAR (Accessed 24/03/2010) Jacobs, P. Aliber, M., Hart, T. O’Donovan, M. 2008, Review of rural development paper commissioned for the Fifteen Year Review Khosa., M.M., 2002. Perceptions of economic and financial conditions of households in 2000, Development Southern Africa, 19: 5, 681-697 Machethe, C. L. 2004. Agriculture and poverty in South Africa: Can agriculture reduce poverty? Paper presented at the conference, Overcoming Underdevelopment, October 28–29, 2004, Pretoria, South Africa. National Treasury (various) Estimates of Provincial Expenditure: Agriculture National Department of Agriculture, 2008. Sheep Breeds, Pretoria

AEASA September 2010 28
Nkwinti, G, 2008. Eastern Cape Department of Agriculture 2008 Policy Speech, Available onlin at http://www.info.gov.za/speeches/2008/08032613451001.htm, (Accessed 14/03/2010) Nkonki, B, 2007. The diversity of smallholder wool production and its marketing aspects : a case study at Xume, Eastern Cape, South Africa, Unpublished Master's Dissertation; Pretoria Perret, S, Carsten, J, Randela, R and Moyo, S., 2000. Activity system and Livilihoods in Eastern Cape Province rural areas (Transkei): Household typologies as socio-economic contributions to LandCare project. Working Paper Perret, 2002. Livelihood strategies in rural Transkei (Eastern Cape Province): how does wool production fit in? Working paper: 2002-20 Provide Project, 2005. A profile of the Eastern Cape province: Demographics, poverty, inequality and unemployment, Background Paper 1(2) Statistic South Africa, various years, General Household Survey. Pretoria: StatsSA Statistics South Africa, Community survey 2007 Statistics South Africa, 2005 Simbi and Michael Aliber Agricultural Employment Crisis in South Africa Tracey, TIPS Working Paper 13_2000 Shackleton, C.M., Shackleton, S.E., Cousins, B., 2001. The role of land based strategies in rural livelihoods: the contribution of arable production, animal husbandry and natural resource harvesting in communal areas in South Africa. Development Southern Africa 18, 581–604. Bank L., 2008. Challenges of Transition: land, livelihoods and rural development in the Eastern Cape. Working Paper Series 1, Bhisho: ECSECC.
Kirsten, J., 1995. Rural Non-farm Enterprises: A vehicle fro rural development in South
Africa, Agrekon, 34(4) 198-204
Meijerink and Roza (2007).The role of agriculture in economic development Markets,
Chains and Sustainable Development Strategy & Policy paper 4
AEASA September 2010 29
Memedovic, O and Lapadre L, 2009. Structural Change in the World Economy: Main
Features and Trends, Research and Statistics Branch, Working paper 24
Watkins, D. A., 2009. An assessment of the environmental compliance monitoring
capacity of the Department of Minerals and Energy, Eastern Cape, Unpublished Masters
thesis, Available online: http://eprints.ru.ac.za/1564/1/Watkins_MBA-TR09-90.pdf
(accessed 01/06/2010)
AEASA September 2010 30
Main sources of household income for Eastern Cape and South Africa, 2002-2008
2002
2003
2004
2005
2006
2007
2008
N % N % N % N % N % N % N %
No income E.C.
75,564
4.70
38,588
2.39 23,548
1.43
41,824
2.43
27,730
1.61
14,969
0.84
19,918
1.14
RSA
318,711
2.72
346,281
2.76 186,379
1.53
248,154
1.96
285,354
2.22
294,424
2.24
284,125
2.13
Salaries & wages E.C.
642,449
39.94
616,074
38.21 577,847
35.04
685,000
39.75
685,206
39.79
814,805
45.51
834,001
47.71
RSA
6,960,693
59.40
7,197,462
57.46 6,836,946
56.15
7,327,832
57.80
7,532,805
58.52
8,050,406
61.16
8,276,504
61.92
Remittances E.C.
302,301
18.79
308,780
19.15 285,161
17.29
236,681
13.73
234,851
13.64
239,294
13.37
219,097
12.53
RSA
1,586,143
13.53
1,824,059
14.56 1,730,459
14.21
1,521,707
12.00
1,391,536
10.81
1,325,062
10.07
1,274,165
9.53 Pension and social grants E.C.
482,126
29.97
567,293
35.19 654,184
39.67
642,851
37.30
703,448
40.85
650,286
36.32
630,301
36.06
RSA
2,129,910
18.17
2,454,286
19.59 2,617,477
21.50
2,879,294
22.71
3,102,345
24.10
2,971,078
22.57
3,172,570
23.74
Farm Income E.C.
13,060
0.81
14,858
0.92 19,304
1.17
17,820
1.03
28,325
1.65
22,778
1.27
6,058
0.35
RSA 112,062
0.96
105,123
0.84 124,041
1.02
116,414
0.92
165,638
1.29
137,922
1.05
98,122
0.73
Other non-farm income E.C.
93,020
5.78
66,579
4.13 89,100
5.40
99,257
5.76
42,288
2.46
48,265
2.70
38,647
2.21
RSA
611,394
5.22
598,596
4.78 680,102
5.59
584,357
4.61
394,287
3.06
385,026
2.92
260,143
1.95
Total E.C.
1,608,520
1,612,172 1,649,144
1,723,433
1,721,848
1,790,397
1,748,022
RSA
11,718,913
12,525,807 12,175,404
12,677,758
12,871,965
13,163,918
13,365,629 Source: StatSA (various years), own estimates based on GHS household weights