Embed Size (px)
Citation preview

TEXTO PARA DISCUSSÃO Nº 003/2010
Poor voters vs. poor places: persisting patterns and recent changes
in Brazilian electoral patterns
Cesar Zucco Yale Program on Democracy and Woodrow Wilson School
Princeton University

CENTRO DE ESTUDOS DA METRÓPOLE SÉRIE TEXTOS PARA DISCUSSÃO
ISSN: em tramitação
Expediente Centro de Estudos da Metrópole Diretora Marta Arretche Conselho Diretor do CEM Adrián Gurza Lavalle Alvaro Augusto Comin Antônio Sérgio Guimarães Eduardo Marques Fernando Limongi Nadya Araújo Guimarães Márcia Lima Marta Arretche Henri Gervaiseau Paula Montero Ronaldo de Almeida Vera Schattan Coelho Comissão Coordenadora do INCT Antônio Sérgio Guimarães Celi Scalon Eduardo Marques Elisa Reis Fernando Limongi Marta Arretche Nadya Araújo Guimarães Paula Montero
Publicação online cujo objetivo é divulgar resultados de estudos direta ou indiretamente desenvolvidos como parte da pesquisa do Centro de Estudos da Metrópole, de forma a favorecer a difusão de informações para pesquisadores, estudantes e profissionais especializados e estabelecer espaço para troca de idéias e sugestões. Os textos desta série estão disponíveis em: www.centrodametropole.org.br As opiniões emitidas nesta publicação são de inteira responsabilidade de seus autores, não exprimindo necessariamente o ponto de vista do Centro de Estudos da Metrópole. É permitida a reprodução dos textos e dados neles contidos, desde que citada a fonte e que não haja restrição expressa pelos autores. Reproduções para fins comerciais são proibidas.
www.centrodametropole.org.br Rua Morgado de Mateus 615
Vila Mariana 04015 902 São Paulo SP Brasil Fone 55 11 – 5574 0399 Fax 55 11 – 5574 5928

Poor Voters vs. Poor Places: Persisting patterns and recent
changes in Brazilian electoral patterns∗
Cesar Zucco
Yale Program on Democracy
and
Woodrow Wilson School
Princeton University
This version: March 9, 2010
For latest version see www.princeton.edu/ zucco/papers/poorplaces.pdf
Abstract
Despite much attention paid recently to changes in Lula’s historical electoral patterns,
much less attention has gone into putting these results into perspective. Even before the
Bolsa Familia, the reduction in poverty, and good economic performance, incumbent party
candidates performed proportionally better in poorer places than they did in richer places.
In this sense despite being a change for Lula, the new voting patterns are more a continuation
than a rupture with historical trends.
The changes that did happen, however, are found in the least likely of places. Inspection
of electoral results suggest that incumbent party candidates before Lula had a specially
hard time wining the votes of the poorer voters in the richer municipalities, a group of voters
which is larger, in absolute terms, than the poor voters in the poorest municipalities. Hence,
paradoxically, the electoral effects of the Bolsa Familia might have been more influential in
changing electoral patterns in the more developed, as opposed to the least developed places
in the country.
∗This is work in progress and results are still tentative. Prepared for the Center for Metropolitan Studies
Seminar “Metropolis and Inequalities”, Sao Paulo, March 24–26, 2010.

Zucco: Poor places. . . Draft: March 9, 2010
The 2006 presidential elections in Brazil marked a dramatic shift in Lula’s traditional voting base
away from the more developed regions of the country and into its poorest areas. Incumbent
president Lula obtained a sweeping majority of the votes in the less developed areas of the
country, reversing a two decade personal and party history of performing significantly better in
more developed regions. However one looks at it, these elections represented a significant change
in Lula’s electorate (Zucco Jr. 2008, Nicolau & Peixoto 2007, Hunter & Power 2007). Higher
socioeconomic level had been shown to be a historically strong predictor of party identification
with the PT (Samuels 2006), and until very recently the party was all but absent from the
most backward regions of the country. How could such a radical shift happen in such a short
time-span?
An already sprawling literature has focused on the possible effects of social policy, and
specifically on the Bolsa Familia (Hunter & Power 2007, Nicolau & Peixoto 2007, Zucco Jr. 2008),
and it has also been said that the economy had a particular pro-poor economic growth (Carraro,
Araujo Jr, Dame, Monasterio & Shikida 2007). In related work, I have examined the issue
in detail and found that even after controlling for economic growth, the BF program had a
considerable effect is winning over votes for Lula (Zucco Jr. 2010). However, there is evidence
that at least part of the shift in Lula’s voting base would have happened even if BF had not
come about. There is more to it, and an interesting incumbency effect seems to be part of the
story (Zucco Jr. 2008, Canedo-Pinheiro 2009).
To be clear from the outset, this is not a paper about Bolsa Familia per se. It is about
what is possibly a broader empirical regularity, that, to my knowledge, has not been properly
explored. This paper is a first attempt at a more systematic study of a possible pro-government
bias in poorer places in the country1 It is a very tentative empirical exploration, combined with
conjectures about the mechanisms causing it and about its possible implications for democracy
and public policy.
The paper is built on the assumption that electoral patterns come about in response to
government actions. This is an assumption, and as such is not empirically verified, though I
later provide a brief justification for it. The core of the paper shows that though poorer places
tend to support incumbents at higher rates than richer places, the behavior of poor voters,
broadly considered, does not necessarily follow this aggregate movement. In particular, it is1This could also be read as an anti-government bias in the richer places, a not so trivial difference. This point
was made by Eduardo Leoni.
2

Zucco: Poor places. . . Draft: March 9, 2010
interesting to inquire about how poor voters in richer places behave. If voters are being won
over by particularistic handouts (Kitschelt & Wilkinson 2007), poor voters anywhere should be
the ones being targeted. However, incumbents typically perform considerably better in poor
places than among poor voters in richer places.
This distinction is important because electoral politics and policy provision have both a ter-
ritorial/geographic component, specially with regards to the delivery of local public and private
goods. Private goods, in principle, could be delivered to individuals without regard to their
geographical location, but in practice the channels by which they are delivered operate through
the smaller units of the state, around which government — and consequently elections — are
structured. While only voters — and not places — vote, government actions are frequently
dispensed according to geographical mechanisms, and geography is frequently a proxy for gov-
ernment decisions regarding individuals. Hence, a proper understanding of the interactions
between policy and elections requires the analysis of both individual and ecological patterns.
I start by characterizing the shift in Lula’s voting base between 2002 and 2006 and placing it
within broader electoral patterns over the past presidential elections in Brazil. In the subsequent
sections I explore ecological voting patterns in greater detail, and examine the electoral behavior
of individuals (as opposed to places). The last sections are much more tentative and speculative:
I first conjecture about the possible mechanisms generating the patterns I described above, and
then present some possible implications of the situation.
1 Lula’s Shifting Vote-Base
Lula da Silva (PT) ran for president in all of the five presidential elections since Brazil’s re-
turn to democracy. After losing the first three — two of which to PSDB candidate Fernando
Henrique Cardoso — Lula defeated Jose Serra in 2002, and won re-election in 2006 against
Geraldo Alckmin, both from the PSDB. Despite obtaining a roughly similar share of the vote
against candidates of the same party in the last two elections, Lula’s voting patterns in 2006
deviated significantly from what he obtained in 2002 and in the preceding elections. While Lula
traditionally collected proportionally more votes in the more well-off of Brazil’s municipalities,
in 2006 this pattern was reversed. This fact is relatively uncontroversial and can be seen in
electoral results and in survey data.
One important intervening factor between the two elections was the creation of Bolsa Fa-
3

Zucco: Poor places. . . Draft: March 9, 2010
milia, a massive cash transfer program implemented and maintained by the federal government.
When Lula took office in early 2003, there existed several different sectoral social programs that
shared some characteristics with BF. At that time, there were 5 million families in Bolsa Escola, 1
million families in Bolsa Alimentacao, and 9 million families in the Auxılio Gas program. These
programs were administered separately by different ministries, there was considerable overlap
in coverage, and the quality of the programs’ roll (cadastro) was very poor. These programs
were gradually phased out as BF was created and expanded to 3.6 million families by the end
of 2003, to 6.5 million in 2004, 8.9 million in 2005, reaching 11 million families on the eve of the
2006 elections. BF, however, is not simply an unification of previous programs as it was built
on a different institutional setup.
It makes sense to single out one specific policy as potential cause for such a dramatic shift
only if one considers that the program reached, in October 2006, just over 20% of the population
— about 40 million people. Almost 60% of survey respondents at election time reported knowing
somebody that received the benefit. Of the 60% of respondents that agreed that the country
had become more democratic under Lula, 60% said the main reason was that the now had more
opportunities to improve their lives (Vox Populi 2006). In another survey also carried out close
to election time, 34% of respondents chose “the fight against poverty” as Lula most successful
policy initiative out of 15 possible policy areas, with “none of the above” coming a distant
second with 9%,2 and 67% approved of the government’s policies to fight hunger and poverty
(Ibope 2006).
With such notoriety, it is evident that the program’s electoral effects have already been
noted by the specialized literature. Hunter & Power (2007) published what was probably the
first academic piece linking the BF to the 2006 electoral results, arguing that the program had
been one of the pillars of Lula’s victory. This was soon followed by Zucco Jr. (2008) and Nicolau
& Peixoto (2007), who did more data intensive studies from Brazil’s 5500 municipalities, finding
more evidence in support for a BF electoral effect. Since then, others have dealt with different
political aspects of the issue (Soares & Terron 2008, Licio, Castro & Renno 2009, Fenwick 2009,
Canedo-Pinheiro 2009).
More importantly, however, the BFP was not the only “novelty” in Brazilian politics to
appear between 2002 and 2006. In that period too, the PT became the incumbent party for2Another 15% of respondents listed “fight against poverty” as the second most successful area.
4

Zucco: Poor places. . . Draft: March 9, 2010
Table 1: Level of Development and Voting for the PSDB and PT Presidential Candidates
1994 1998 2002 20061st 2nd 1st 2nd
PTLula Lula Lula Lula0.04 0.30 0.34 0.29 −0.74−0.71<0.01 <0.01 <0.01 <0.01 <0.01 <0.01
PSDBFHC FHC Serra Alckmin−0.36 −0.16 −0.03−0.29 0.69 0.71
<0.01 <0.01 0.07 <0.01 <0.01 <0.01
N 5019 5513 5565 5565 5565 5565
Notes: Table reproduced from Zucco Jr. (2008). Figures indicate the correlations between the HDI-M and thevote share obtained by each party’s presidential candidate, with the p-value shown in parenthesis. Figures inbold are for incumbent party candidates. Data were obtained from IPEA and TSE.
the first time. Incumbency, as it turns out, seems to have a conspicuous effect on electoral
voting patterns. As first noted in Zucco Jr. (2008), all recent incumbent party candidates
got a proportionally higher share of the vote in poorer places while the reverse applies to the
main party in opposition. This does not mean that the incumbent party candidate always wins
elections in poorer places, as his average level of support can vary for many different reasons.
It does suggest, however, that incumbents have a built- in advantage in reaching these voters.
Table 1 illustrates this reversal of patterns for Lula, but it also shows the broader trend
whereby all incumbents in this table do better in less developed places — hence the negative
association of vote shares and level of development measured by the Human Development Index
(HDI-M) — while the opposite holds for the same parties when fielding an opposition candidate.
It is not clear, yet, what is the actual mechanism behind this regularity, nor whether any
specific policy instrument led voters in poorer places to vote disproportionately for incumbent
candidates, but evidence suggests that where the public sector represents a larger share of
the economy, and where the local government is less reliant on locally raised taxes (and more
reliant on transfers), the incumbent candidate tends to get more votes (Zucco Jr. 2008). The
actual story might hinge on direct financial dependence on the federal government by voters,
but it might also be mediated by an alignment of local authorities — which depend on federal
resources — with the powers that be in Brasilia, a conjecture I return to later in the text. At
any rate, this pro-government tendencies should shift our focus away from Bolsa Familia itself,
and towards the study of this pattern and its implications.
5

Zucco: Poor places. . . Draft: March 9, 2010
2 Where Parties Get Their Votes From
The basic fact that Lula constituency shifted considerably between 2002 and 2006 is quite clear,
so I will not dwell on it extensively. The point of this paper is to inquire about the meaning
of this shift, and to suggest that is more than just a Lula-specific phenomenon. I start by
examining the PT’s candidate shift, and then move on to other substantiate other such shifts.
Lula’s case can be visualized in many different ways, but the Figures 1, below, are a nice
summary. They report the results of a single regression on a pooled data of municipal level
results from the first rounds of all five elections of the current democratic period. The regression
examines mainly the association between the level of development of each municipality and
Lula’s vote share. This is done with the inclusion of an interaction term between the party’s
status (government or opposition) with development, and by allowing this effect to vary by state,
with the inclusion of state random effects. The regression also includes a host of socio-economic
controls at the municipal level such as the population size, share of the non-white population
and share of pentecostal Christians.
To facilitate interpretation of these results, and especially that of the interaction term and
the random effects coefficients, Figure 1 reports the predicted effects of development on Lula’s
vote-share for the two possible incumbency status.3 The cloud of dots represents the actual
municipal level returns, the main (average) effect of level of development is shown in red (thicker
lines), and the variation from state to state is shown in gray. All other variables held at their
mean values.
The results show that when in opposition, Lula tended to do better in richer places, a
relationship that holds within almost every state — implying that it is not just regional across-
state differences that drive the results. Once in opposition, Lula’s voting patterns changed
considerably, and the new pattern holds in every single state.
Just to corroborate the magnitude of the change in Lula’s voting patterns between 2002 and
2006, it is worth mentioning that Lula’s the swing itself (the difference between his vote share
in 2006 and 2002 in each municipality) is negatively associated with the level of development of
municipalities, a result that is observed in 24 of the the 26 states individually considered. As
Figure 2 shows, this indicates not only that Lula improved considerably his vote share in poorer
places, but that he lost votes in more developed places, a result I return to later in the paper3Strictly speaking, the word “effects” is not a very good one, and the argument is not clearly causal.
6

Zucco: Poor places. . . Draft: March 9, 2010
0.0
0.2
0.4
0.6
0.8
In Government
Vot
e S
hare
Level of Development (HDI)
N=5464
Lower Higher
0.0
0.2
0.4
0.6
0.8
In Oppostion
Vot
e S
hare
Level of Development (HDI)
N=19652
Lower Higher
Figure 1: PT Vote Share by Level of Development: 1989–2006Notes: Figure shows the predicted vote for the PT’s presidential candidate based on a regression of vote shareat the municipal level in five elections on status as incumbent or opposition and level of development of themunicipalities. Regression includes socio-economic controls and state random effects. The cloud of dots representsthe actual municipal level returns, the main (average) effect of level of development shown in red, the variationfrom state to state shown in gray. All other variables held at their mean values.
when considering the urban electorate, in particular.
The obvious problem with any generalization from the PT’s case is that we only observe one
shift in incumbency status over time. Any attempt to analyze this shift will effectively partition
our observations into a “before” and “after” period, and will be capturing the effect of any time
trending variable, as well as any specific one-time shock that might have occurred at the the
time of the shift. Until the PT loses the presidential election and fields an opposition contender,
there is no way around this problem. However, we might try to reason by analogy, by looking
at other “cases”.
The analysis of the PSDB’s electoral patterns provides us with slightly more leverage as
the party’s incumbency status shifted twice. The PSDB, formed in 1988 as a splinter from the
PMDB and fielded presidential candidates in all presidential elections since democratization.
In 1989, Mario Covas was obviously not the “main” opposition candidate, but he finished a
respectable fourth place with 11% of the vote, behind Brizola and Lula (both close to 17%) and
Collor (30%). In 1994, though not technically the incumbent party (Itamar Franco governed
without any partisan affiliation) Fernando Henrique Cardoso ran as the incumbent candidate.
7

Zucco: Poor places. . . Draft: March 9, 2010
0.5 0.6 0.7 0.8 0.9
−0.
4−
0.2
0.0
0.2
0.4
0.6
0.8
Human Development Index
Lula
200
6 −
Lul
a 20
02
Figure 2: PT Electoral Swing and Level of Development 2006–2002Notes: Figure shows how the difference between Lula’s performance in 2006 and 2002 realates to the level ofdevelopment of municipalities. Higher values in the horizontal axis indicate places where Lula performed betterin 2006, and lower values where he performed better in 2002. Both a linear and lowess regression are shown.
8

Zucco: Poor places. . . Draft: March 9, 2010
He had been the finance minister in charge of the Real stabilization plan, and ran and won with
support of president Itamar Franco. In 1998, again with Cardoso, and 2002 with Jose Serra,
the PSDB also ran as the incumbent party. In 2006, Alckmin was the PSDB’s candidate, and
main opposition contender.
In the two elections in which the PSDB contested the presidential election as an opposition
party, the socio-economic ecological patterns of its vote were similar, and positively associated
with the level of development of municipalities. In other words, as an opposition party the
PSDB does better in poorer places. In 1989, despite the fact that Covas achieved his highest
vote share in relatively poor state of Ceara, the overall relationship between his performance
and the level of development of municipalities is clearly positive, and it was positive in 24 of
the 26 states.4 The strong negative relationship is found precisely in Ceara, where the PSDB
was particularly entrenched and exerted significant control over the state machine. In 2006,
again an opposition party, the PSDB performed considerably better in less developed places.5
In the middle three elections, two with Cardoso and one with Serra, the relationship between
the PSDB’s electoral performance and level of development was reversed.
Figure 3 was produced from the same regression explained in the analysis of the PT voting
patterns, and presents very similar results. Results for the PSDB are a little noisier than for
the PT. When in government, the negative association does not hold in seven states, and when
in opposition it does not hold in one state. But the average effect is clearly negative in one case
and positive in the other, just like was found in the case of the PT.
Differently from the PT, the PSDB fielded four different presidential candidates in the period,
so part of the variation in patterns could be attributed to differences between the candidates
themselves. However, it is important to note that all four candidates were originally from the
State of Sao Paulo, which reduces, somewhat, comparability issues. Still, the PSDB provides
a more interesting case than the PT because the party shifted incumbency status twice, ruling
out the the time trend explanations that could affect analysis of the PT’s case.
Closer attention to the two incumbency status shifts the PSDB went through provides an
even clearer picture. As Figure 4 shows, the swing experienced by the party in presidential
elections between 1989 and 1994 is strongly negatively associated with the level of development4The Distrito Federal is not subdivided into municipalities, so within state effects cannot be estimated.5The patterns exhibited by the party in 2006 display a correlation of 0.34 with those results from 1989, once
the outlying state of Ceara is dropped. With Ceara, where the PSDB lost much of its electoral clout due todefections, this correlation is lower, but still positive and statistically significant.
9

Zucco: Poor places. . . Draft: March 9, 2010
0.0
0.2
0.4
0.6
0.8
In Government
Vot
e S
hare
Level of Development (HDI)
N=15292
Lower Higher
0.0
0.2
0.4
0.6
0.8
In Oppostion
Vot
e S
hare
Level of Development (HDI)
N=9824
Lower Higher
Figure 3: PSDB Vote Share by Level of Development: 1989–2006Notes: Figure shows the predicted vote for the PSDB presidential candidate based on a regression of voteshare at the municipal level in five elections on status as incumbent or opposition and level of development ofthe municipalities. Regression includes socio-economic controls and state random effects. The cloud of dotsrepresents the actual municipal level returns, the main (average) effect of level of development shown in red, thevariation from state to state shown in gray. All other variables held at their mean values.
of municipalities. That is to say, the party grew much more in poorer places while declining or
growing much less in richer ones, a result that holds within 22. In 2006 the story is reversed, as
the swing is strongly positively associated with level of development and holds in 23 states. The
PSDB grew more in poorer places when it won government, and underwent the reverse process
when it returned to opposition.
This general process might, in fact, have been at work in Brazil for even longer, concealed
under limitations in electoral participation. To this end, there is considerable second hand
evidence suggests that a similar shift occurred with the PMDB at around the mid-eighties but
hard data is harder to come about. The first obvious problem is that the lack of presidential
elections make a direct comparison with the current period difficult. It it safe to assume,
however, that national legislative elections at the time were the ones that more closely resembled
the current presidential elections. Senate elections, in particular, were the most “nationalized”
but, unfortunately, even state level senatorial results are hard to obtain for 1986. I focus, instead,
on elections for the Camara of Deputados, for which state level results could be compiled for
10

Zucco: Poor places. . . Draft: March 9, 2010
0.4 0.5 0.6 0.7 0.8
0.0
0.2
0.4
0.6
0.8
Human Development Index
FH
C 1
994
− C
ovas
198
9
(a) Between 1989 and 1994
0.5 0.6 0.7 0.8 0.9
−0.
6−
0.4
−0.
20.
00.
20.
40.
6
Human Development Index
Alc
kmin
200
6 −
Ser
ra 2
002
(b) Between 2002 and 2006
Figure 4: PSDB Electoral Swings and Level of DevelopmentNotes: Figures show how the difference between the PSDB candidates performance between two selected pairs ofconsecutive elections varied with the level of development of municipalities. Higher values in the horizontal axisindicate places where the PSDB performed better in the second election, and lower values where he performedbetter in the first election of each pair. Both a linear and lowess regression are shown.
11
Zucco: Poor places. . . Draft: March 9, 2010
the whole period.6
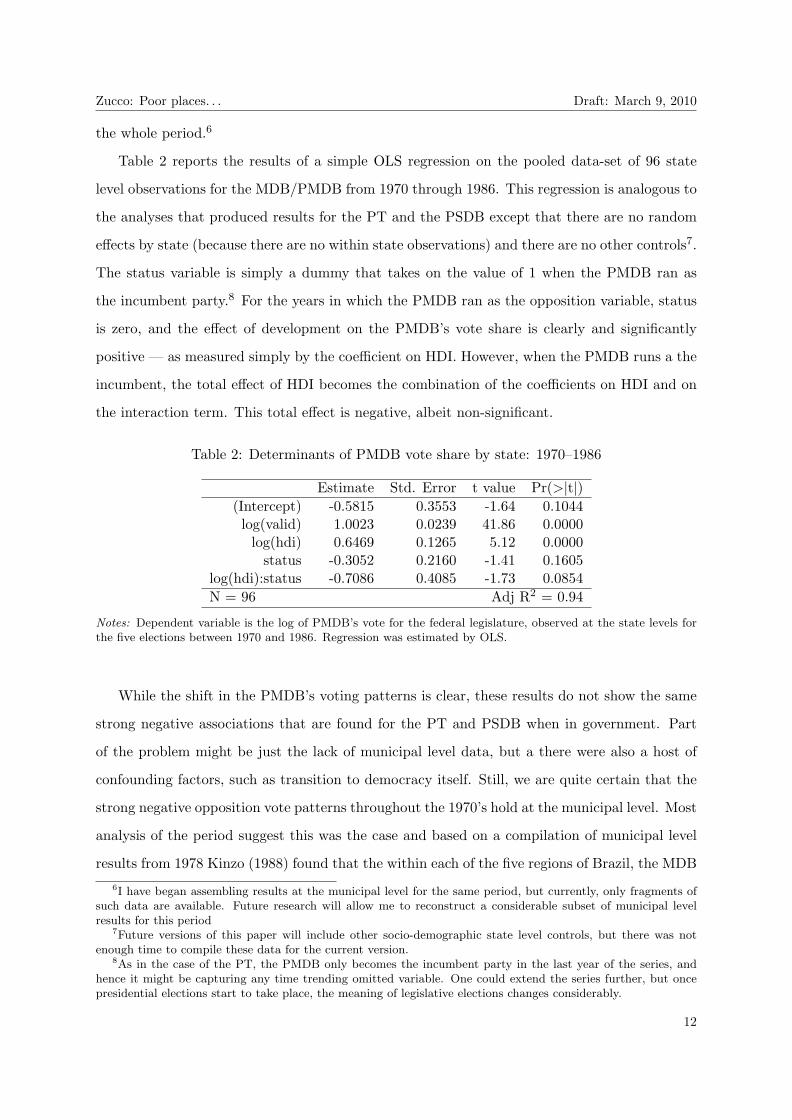
Table 2 reports the results of a simple OLS regression on the pooled data-set of 96 state
level observations for the MDB/PMDB from 1970 through 1986. This regression is analogous to
the analyses that produced results for the PT and the PSDB except that there are no random
effects by state (because there are no within state observations) and there are no other controls7.
The status variable is simply a dummy that takes on the value of 1 when the PMDB ran as
the incumbent party.8 For the years in which the PMDB ran as the opposition variable, status
is zero, and the effect of development on the PMDB’s vote share is clearly and significantly
positive — as measured simply by the coefficient on HDI. However, when the PMDB runs a the
incumbent, the total effect of HDI becomes the combination of the coefficients on HDI and on
the interaction term. This total effect is negative, albeit non-significant.
Table 2: Determinants of PMDB vote share by state: 1970–1986
Estimate Std. Error t value Pr(>|t|)(Intercept) -0.5815 0.3553 -1.64 0.1044
log(valid) 1.0023 0.0239 41.86 0.0000log(hdi) 0.6469 0.1265 5.12 0.0000
status -0.3052 0.2160 -1.41 0.1605log(hdi):status -0.7086 0.4085 -1.73 0.0854N = 96 Adj R2 = 0.94
Notes: Dependent variable is the log of PMDB’s vote for the federal legislature, observed at the state levels forthe five elections between 1970 and 1986. Regression was estimated by OLS.
While the shift in the PMDB’s voting patterns is clear, these results do not show the same
strong negative associations that are found for the PT and PSDB when in government. Part
of the problem might be just the lack of municipal level data, but a there were also a host of
confounding factors, such as transition to democracy itself. Still, we are quite certain that the
strong negative opposition vote patterns throughout the 1970’s hold at the municipal level. Most
analysis of the period suggest this was the case and based on a compilation of municipal level
results from 1978 Kinzo (1988) found that the within each of the five regions of Brazil, the MDB6I have began assembling results at the municipal level for the same period, but currently, only fragments of
such data are available. Future research will allow me to reconstruct a considerable subset of municipal levelresults for this period
7Future versions of this paper will include other socio-demographic state level controls, but there was notenough time to compile these data for the current version.
8As in the case of the PT, the PMDB only becomes the incumbent party in the last year of the series, andhence it might be capturing any time trending omitted variable. One could extend the series further, but oncepresidential elections start to take place, the meaning of legislative elections changes considerably.
12

Zucco: Poor places. . . Draft: March 9, 2010
●
●
●
●
●
●
●
●
● ●
●
●
●●
●
●
●
●
●
●
●
●
●
●
●
0.4 0.5 0.6 0.7
−0.
10.
00.
10.
2
PI
Human Development Index
PM
DB
198
6 −
PM
DB
198
2
Figure 5: PMDB Electoral Swing and Level of Development 1986–1982Notes: Figure shows the association between PMDB’s swing in vote share by state between 1986 and 1992plotted against the level of development of each state. The solid line shows the linear association between thetwo quantities, and the dashed line reports the same association after excluding the state of Piauı.
performed systematically better in state capitals than in middle sized cities, and considerably
worse in smaller towns, ruling out an intrinsically regional phenomenon. Municipal level data
are only readily available for the whole country in 1982, and my analysis indicate that it in that
year the PMDB still exhibited the typical opposition patterns of performing better in richer
places. To definitely observe the swing, however, it would be important to obtain municipal
level data 1986. While that is not possible, I tentatively present an analysis of state level swings
in Figure 5. As expected, the PMDB did seem to grow more in poorer places as suggested by
negative association in the Figure, but this result is much less pronounced than I found with
the PSDB and the PT. If one excludes the state of Piauı, a clear outlier where the PMDB lost
ground where it “should” have gained, the negative association become considerably stronger,
and I strongly suspect that municipal level data — when available — will corroborate the
pattern as well.
<<<< MUNICIPAL LEVEL RESULTS WILL BE ADDED WHEN AVAILABLE >>>
In short, all the available data suggests, albeit tentatively, that there exists a “government”
13

Zucco: Poor places. . . Draft: March 9, 2010
and an “opposition” ecological voting pattern which hold regardless of who government and
opposition are.
3 Voters and Places
The ecological analyses of the preceding section dos not tell us much about how individual
voters behave. Ultimately, it is individual and not places that vote. This distinction is par-
ticularly interesting if one considers who are the likely targets of government largesse. From
the redistributive perspective, governments should target the poorer voters with particularistic
benefits, as these voters are then ones more likely to be swayed. Still, it is not clear that the
government can, in fact, reach such voters easily. The state’s organization into geographic units
provides institutional incentives for governments to focus on places as a proxy for individuals.
This alternative way of targeting, however, can only be very imperfect, for a large share of the
poor individuals are not located in poor places, and smaller but non-negligible number of people
in poor places, are not in fact poor. This conundrum seems to reflect itself in the data once
one attempts to account for the distinction between behavior in poor places and the behavior
of poor voters.
The same aggregate electoral returns analyzed above can tell us a little more about this
distinction once we apply ecological inference techniques to the data. Opening up the vote of
the poorer voters in in rich and poor places suggests a twist to the general empirical regularity
explored in the previous section. As one would imagine given the persistent pro-incumbent
ecological patterns, incumbent candidates before Lula 2006 received more support from poor
voters in poor places than from poor voters in richer places (Table 3). The difference was
smaller for Cardoso 1994 — probably due to the success of the Real stabilization plan — and
the absolute level of support has varied, but the relative pattern is there. This, however, is not
what happened under Lula.
These results should definitely be taken with a grain of salt. Ecological inference techniques
are estimates — not actual results — and there is debate over how reliable they really are.
Additional evidence, however, can be obtained from individual level data. While these are
somewhat more certain data, obtained from surveys close to the election date and which predict
the results of the elections quite well, there are limits to the extent that which they can be
disaggregated into subgroups of interest.
14

Zucco: Poor places. . . Draft: March 9, 2010
Table 3: Incumbent Candidate Voting by Poor Voters in Different Types of Municipalities
1994 1998 2002 2006 2006 2006Cardoso Cardoso Serra Lula Share Poor* Poor Voters*
Lev
elof
Dev
elop
men
t Lowest 64.88 66.33 32.17 76.63 74.80 5.51
⇓63.24 51.23 34.33 76.87 64.67 6.3470.78 44.85 23.86 77.41 45.81 4.6269.08 29.35 8.11 64.82 30.33 4.85
Highest 49.83 28.56 9.41 74.20 16.73 8.77
Notes: Table reports ecological inference estimates for the share of poor voters voting for the incumbent partycandidate across five subsets of municipalities, ordered by level of development. Development is measured byincome per head. Definition of poverty and share of each municipality’s population that is poor was obtainedfrom IPEA. *Total number of poor is expressed in millions os voters actually voting in 2006. Last two columnsapply 2000 poverty rates to 2006 voting figures, and are for illustration purposes only. Since poverty is known tohave declined between 2000 and 2006, actual figures are probably smaller.
Table 4 shows results from DataFolha surveys close to each of the last four elections. While
most available surveys do not indicate the specific municipality from which individual respon-
dents were drafted, I approximated the level of development of the municipality by grouping
them into metropolitan and hinterland (interior), a classification that is available in all surveys.9
I further broke down respondents into the lowest income group — earning less than two min-
imum wages at the time of each survey — and a group composed of those earning more than
five minimum wages.10
Table 4: Vote Intention for Incumbent Party Candidate Close to the Elections 1994–2006
1994 1998 2002 2006Cardoso Cardoso Serra Lula
Metro Poor 39.77 33.05 11.87 54.07Hinterland Poor 45.74 45.98 21.37 57.04
Metro Upper-Middle 44.08 44.00 17.72 31.65Brazil 44.75 45.88 18.29 46.49
Notes: Table reports vote intention for the incumbent party candidate for three sub-groups of respondents toDataFolha surveys taken close to the first round of each presidential election (Datafolha 1994, Datafolha 1998,Datafolha 2002, Datafolha 2006).
It is obvious that the absolute levels of support for each candidate have varied over time.9For surveys that reported metropolitan municipalities and capital cities separately I lumped the categories
together. This division, however, is less accurate than what we would obtain if looking at the level of developmentof the municipality, as many hinterland municipalities in the South are considerably richer than those in theNortheast.
10As the number of respondents in these surveys was quite large, there are at least 700 respondents in each ofthese categories in each survey, and many more than that in several instances.
15

Zucco: Poor places. . . Draft: March 9, 2010
While this variation is potentially very interesting, I focus simply on another aspect of these
results. Prior to Lula in 2006, incumbents performed worse among the metropolitan poor than
among both the more well-of metropolitan groups and the hinterland poor. Lula was the first
to perform equally well among poor voters wherever they are.
The reverse side of the coin is that poor voters in richer places, and in specifically in
metropolitan regions, seem to been an elusive lot from the point of view of incumbents, at least
before Lula. Though I do not have more detailed figures for earlier periods, there is evidence that
this was the case even during the military regime. In several studies spanning many decades,
Lamounier provides ample evidence that within the city of Sao Paulo’s, the poorer administra-
tive regions voted more for the MDB. More generally, poorer voters in richer places seemed to
have been the staple of opposition and the basis on which political contestation has emerged.
The PCB and later the PTB had substantial support in working class districts within the city
of Sao Paulo (Lamounier 1975) and later that ARENA always performed better in richer places
of what is Brazil’s richest city, and its support in the poorest regions dropped to single digit
figures by 1978 and remained in the teens up through 1982 (Lamounier 1980, Lamounier 1986).
The 1989 elections do not speak directly to the argument because there was no relevant
incumbent candidate. While Collor was identified with many of the more conservative parties
that had occupied power in the previous decades, he was by no means the incumbent candidate.
Still, it is interesting to note that on the eve of the first round, Collor had 40% of the vote
intention among the poor in non-metropolitan regions, but was roughly tied with Brizola among
the metropolitan poor for just over 20%, with Lula slightly behind. If one lumps together the
groups making under 5 minimum wages at the time, then there is a basically a three way
tie among the metropolitan poor. So while conservative elements previously associated with
past government — both the civilian government under the PMDB and the previous military
regime — jumped on Collor’s bandwagon, they were not able to deliver the same levels of
support among the metropolitan poor that they helped secure in the poorer places. The truly
opposition candidates — Brizola, Lula and Covas — more success mobilizing urban poor than
Collor.
Individually considered, these results could be interpreted as a conservative–progressive
divide, and at the time that was the basic interpretation. However, considering all the shifts
and realignments alluded to earlier, it seems clear that ideology cannot really explain the overall
16

Zucco: Poor places. . . Draft: March 9, 2010
Table 5: Vote Intention Close to the 1989 Elections
Metro Poor Hinterland PoorCollor 23.76 35.48
Brizola 21.27 13.58Lula 16.30 11.71
Covas 9.12 8.49Maluf 8.01 10.36
Notes: Table reports vote intention for the five main candidates in the 1989 presidential election, in a Ibopesurvey taken close to the election (Ibope 1989).
patterns. Taken together with the patterns shown in the previous section, the electoral results
and surveys shown here suggest that the true novelty of Lula’s electoral performance in 2006,
was not so much that his electorate switched towards the poorer regions — which had happened
before with new incumbents — but rather his capacity to reach poor voters irrespective of where
they are.
4 The Mechanisms Behind the Patterns: A Conjecture
Incumbent party candidates tend to do better in poorer places, regardless of how they performed
when in opposition, regardless of their personal characteristics, and regardless of ideology. How-
ever, the same story does not hold exactly with regards to poor voters, as incumbents seem to
have a harder time reaching the poor in richer places. The novelty in the case of Lula was that
the incumbent performed well among the urban poor. How can we make sense of the persisting
trends, and how to interpret the change that Lula represents?
The distinction between poor voters and poor places suggests that political processes that
operate at the level of the geographic units (states and municipalities) have, to date, trumped
any other political processes that might operate at the level of individuals. This, in itself,
is suggestive that ideology is not the driving force behind these results, as it would be hard
to imagine ideological swings following the geographical patterns we observe. A more likely
candidate to a geographic mechanism is that voters, and poor voters in particular, are responding
to the delivery of tangible benefits, either directly in the form of pensions, benefits, in kind
transfer to voters, or indirectly as through support for local projects and programs is a potential
culprit that elicit the support and mobilization efforts of local political leaders. In this context,
the Bolsa Familia was one such highly visible policy in 2006, but it is probably the case that
17

Zucco: Poor places. . . Draft: March 9, 2010
other policies, formal or informal, were playing the Bolsa Familia’s role in previous periods,
though probably less efficiently. The rest of the paper assumes that the swings I have shown
are, in fact, responses to some type of government action.
The most general point of this tentative theorization is a refinement of an insight of clien-
telism theory. It is not enough to be the poorest voters in order to be preferentially targeted
by government handouts. The channels for delivery of benefits must be in place so that voters
can be reached. While in some polities party networks play this role (such as in Argentina,
or Mexico under the PRI) in contemporary Brazil local networks seem to be less partisan, and
maintained by the availability of resources from higher spheres of government. As the nationally
competitive parties are not the same that control local politics, local networks are available to
be “rented out” to different political forces. From the perspective of local leaders, the choice of
which national level candidate to algin themselves with involves identifying which force is likely
to provide the most benefits to the locality (and its political forces), giving rise to an interesting
market in which state and federal politics interacts with local politics.
If this is the mechanism at work, it closely resembles the phenomenon of “cartorialismo” as
described by Carvalho (1966),11 but this market would be somewhat different from the regional
political dynamic identified by Brasil (1983). Arguing against the inexorable decline of the
“conservative” parties suggest by earlier work (Soares 1973), Brasil focused on the interplay
between national and local politics. As part of this dynamic, he noticed that groups that
dominated local politics were quite different than those politicians in state and national politics,
even though they were typically within the same party. Today, the fact that the relevant national
parties are not typically the same parties that dominate politics at state and local levels, the
“market” is more unconstrained, resulting in greater freedom for local groups to align with the
government in search of better opportunities.
It is hard to know if this is a completely different dynamic than what existed before, or
whether the 1946–1964 arrangements would have eventually evolved into something similar to
this. National parties were first formed at the end of the Vargas dictatorship, but they were11Once rural oligarchies lost their structural (economic) control over municipalities, some were able to maintain
political control through the control of public jobs and public resources. However, most municipalities are toopoor to sustain a significant number of jobs or considerable resources, so much of the is provided from outside ofthe municipality itself. Evidently, there not all municipalities got significant resources from the state and federalgovernments. It was necessary that the local oligarchies obtain some type of projection beyond the municipalityfor that to happen. The success of local oligarchies became dependent on their capacity to forge links betweenlocal interests and state and national level politics, nece “cartorialismo.”
18

Zucco: Poor places. . . Draft: March 9, 2010
not entirely new. In fact, they were basically a re-sorting of mostly oligarchical elites, into its
roughly pro-Vargas regime camp (PSD) and anti-Vargas camp (UDN), which explains. These
parties were able to form so quickly and dominate the 1945 elections precisely because they
were merely a coordination of existing state level groups (Soares 1973, p.70). The communist
party (PCB) had laid its national organizational foundations during the Vargas regime, despite
proscription, and though restricted to larger cities was the first truly national party to emerge.
The PTB was build on the union infra-structure created during the Vargas regime, but was
emerged gradually after 1945. If the PTB had eventually reached an accommodation with local
chapters of older state-based parties, it would have probably resembled a lot the relationship
that exists today between the PT and the PSDB and the other parties.
For the purposes of this paper, however, this historical digression is just to illustrate a
plausible mechanism by which a pro-government bias in the poorest places could have emerged
under the current electoral conditions. Here, I am not implying governism of the most obvious
and blatant type, as practiced in during the “Old Republic” of the early 20th Century, when
all 11 presidential elections were won by the government candidate with more than 80% of the
vote (Lamounier 1990, p.36). In fact, it is not even the case that the government candidates win
the largest share of the vote in poorer places. Rather, the phenomenon is that, all else equal,
incumbent candidates perform better in poorer places. I take this to evidence of greater ease to
reach voters in poorer places or, conversely, greater difficulties by the opposition to reach them,
and the reason might simply be that local government in poor places depend on the Federal
government, and are willing to align themselves with the incumbents to increase their access to
resources.
5 Possible Implications
In this section I sketch some possible answers for the “so what” question. Assuming that the
patterns I showed before really exist, and assuming that these patterns are produced by electoral
responses to government actions, what are its possible consequences?
Possible Implications for Democracy: Evidence suggests that Brazilian political system
provides incentives for presidential candidates to seek out the same group of voters, regardless
of who were their original constituents. For such tendency, let us call the current Brazilian po-
19

Zucco: Poor places. . . Draft: March 9, 2010
litical system “constituency diluting” — for parties and candidates have different “constituents”
depending on their government or opposition status. This situation might not be the true in
other countries and, in fact, there is prima facie evidence that other polities are “constituency
maintaining”. Future work will seek to identify which polities fall into each category, but a ten-
tative hypothesis is that constituency maintaining systems in highly unequal countries would
lead to instability.
This, for instance, was the view implicit in Furtado’s analysis of the tensions in the 46–
64 regime, where the executive had incentives to make (irresponsible) promises to the urban
electorate, and to attempt to deliver on those promises. Congress, on the other hand, was
representative of the rural and oligarchic groups (Furtado 1965), and eminently a conservative
or even reactionary force. In a related point, Soares (1973) saw that structural changes would
move the country away from conservative parties, and fears of a progressive shift in in the
electorate prompted the coup. The underlying logic of both analysis is that elected politicians
would, in fact, represent the interests of the constituencies that brought them to power, and as
the balance of social forces in the country was changing, those on the losing side could anticipate
that democracy was not in their best interests.
I conjecture that similar dynamics might hold in other poor and unequal polities where par-
ties cater to specific socioeconomic or geographic groups. The “impossible game” in Argentina
(O’Donnell 1973), pre-Pinochet Chile (Valenzuela 1978), and possibly Bolivia in more recent
times could be cases of constituency maintaining systems that suffer from instability precisely
because one group gets the upper hand or is entirely locked out of the system.
Current Brazil, in this sense, exhibits a “happy” coincidence that might make electoral
democracy sustainable in the long run. In wanting to appeal to the cheapest voters, incumbents
are called upon to favor poorest places. This provides relief for local political leaders, irrespective
of what they stand for, and probably trickles down to voters. Rather than invading strongholds
and displacing local politicians, the party in charge of the federal government becomes symbiotic
with the local political leaders, in an accommodation of interests. While this probably reduces
the speed of political change, it provides buy-in from all political forces. If democracy is, indeed,
an equilibrium, Brazil’s very imperfect version might be an interesting example.
Implications for Urban Voters: Regardless of the potential stability of this arrangement,
urban voters, and especially the poor urban voters are — or have been — on the losing side.
20

Zucco: Poor places. . . Draft: March 9, 2010
National opposition parties do not control the government machine, and hence have a harder
time reaching voters in the poorest places. This generates two sets of reinforcing incentives.
First, the logical strategy for opposition parties is to contest the urban votes, which are the
ones over which governments typically lack access advantage they have in the poorer places.
The opposition will campaign by criticizing the government’s performance, a strategy that can
be effective if times are bad. Not only the urban voters can see for themselves the considerable
inequality of the country, but they can be reached by tv, radio, and other direct appeals, and
are much less likely to be influenced by government handouts.
The problem, from these voters’ perspective, is that the same reasons that make them an
attractive constituency for the opposition, make them a less attractive for government handouts,
even if the opposition wins government. The reason is not so much that these voters would
not respond to governments initiatives, but rather that the distribution networks present in
smaller places are not in place in richer ones. An option would be to provide public goods, and
option which makes economic sense in denser places. However, reaching voters with universal
public goods provides uncertain electoral returns, at best (Diaz-Cayeros, Magaloni & Estevez
Forthcoming), and the very poor might end up crowded out of fruition of these goods by the
better off. Hence, if urban voters are an uncertain bet for incumbents, comparative advantages
suggest they would concentrate on the poorer places instead.
This is of particular interest to those interested in public services provisions and on the
politics of metropolitan areas. The urban poor are a particularly large group of people, but one
that is hard to reach with visible government policies, and voters that are hard to mobilize.
How Targeted social policies fit in: Within this context, Bolsa Familia does appear to be a
novel policy, but not for the reasons usually cited. What makes it new is precisely the ability to
reach this poor voters in richer places. In doing this, it might be shutting the opposition out of
access to the poorest voters everywhere, and this might have important electoral consequences.
Figure 6, below, is reproduced from previous work and shows the estimated vote for Lula
among Bolsa Familia beneficiaries and non-beneficiaries in municipalities with different levels of
development. The left side of the graph shows very high support for Lula in poorer places by
both groups. Here, however, BF represents only a quantitative change from previous elections.
A greater share of people in poor places voted for the government candidate, but these voters
have always been more inclined to vote for the government than people in the richer places.
21

Zucco: Poor places. . . Draft: March 9, 2010
0.5 0.6 0.7 0.8 0.9
00.
220.
50.
680.
871
Level of Development of the Municipality(Value of HDI−M)
Pre
dict
ed S
uppo
rt fo
r Lu
la
Beneficiaries
Non−Beneficiaries
●
●
B
A
Figure 6: Predicted Support for Lula Given Level of Development
Notes: Figure reproduced from Zucco Jr. (2010). Figure shows the predicted vote for Lula among Bolsa Familiabeneficiaries and non-beneficiaries across the range of municipal development level (HDI-M) actually observed.Predicted votes were computed from regression results using ecological inference estimates of the vote for Lulaamong beneficiaries and non-beneficiaries. The histogram in the background depicts the actual distribution ofthe HDI-M variable.
22

Zucco: Poor places. . . Draft: March 9, 2010
The real differences to previous incumbent candidates, however, appears in the right side
of the figure. Recipients, arguably the poorest segment of urban voters, voted massively for
Lula. For all the focus on how Bolsa Familia has changed the landscape of Brazilian electoral
politics especially in the least developed areas, the electoral effects of the Bolsa Familia and
other targeted policies might be more influential in changing patterns in the more developed
regions. In particular, it seems to represent a major breakthrough in the provision of benefits
and consequently in the electoral behavior, or the urban poor.
By winning support of the poorest segments of the electorate, government candidates might
not need to cater to middle class voters to be competitive in the cities. Middle class services
such as universities, hospitals, public service jobs, or even issues such as income taxes, that
mostly do not affect the very poor, might be dropped altogether from electoral platform. The
electoral success of policies such as the BF might, in the end, reduce attempts to provide other
public services. To the extent to which this reduces distortive government spending, it might
not be a bad outcome.
6 Discussion and Conclusion
It is important to acknowledge that this paper is based on the votes that candidates effectively
obtain, but that it makes claims about votes that candidates in general, and incumbents in
particular, seek to gain. For the most part — except for the recent case of the Bolsa Familia
— little evidence has been provided in terms of how policy instruments are linked to electoral
returns. This link is assumed, and not shown. Hence, the most fundamental assumption behind
the interpretation of the electoral patterns shown here is that these are responses to the provision
of public and private goods to voters, done by government, and not based on ideological links
between voters and candidates.
With these important caveats, and acknowledging that much empirical work remains to be
done, the paper has shown that the dramatic change in Lula’s electorate between 2002 and
2006 is not unheard of in Brazil. Much to the contrary, there seems to be a pattern by which
incumbent party candidates do better in poorer places while opposition candidates do better
in conservative places, regardless of who they are, and what they stand for. These results
suggest that Lula’s electorate would probably have switched between 2002 and 2006 even if the
BFP had not been implemented. The program, in this sense, seems to have mostly amplified
23

Zucco: Poor places. . . Draft: March 9, 2010
pre-existing trends to the extreme.
The one important true novelty of the 2006 election was that, for the first time, the incumbent
party candidate did very well among the poor voters in the richer places of the country. I
conjecture that targeted social policies allows the government to deliver particular benefits
to the poorest voters without being subject to the geographical logic of service and benefits
distribution that is intrinsic to government. This, however, is merely a conjecture.
The obvious question not addressed in the paper is why Lula was able to implement such
a program, and why hadn’t is been tried before – at least not with in its current order of
magnitude. This is a question that probably can only be answered comparatively, and it will be
subject of future research. Still, as I have speculated in the preceding section, BF it is a policy
with potentially important — though still undeterminate — long term electoral effects.
References
Almeida, Alverto Carlos. 2006. Por que Lula? O contexto e as estrategias polıticas que explicam a eleicaoe a crise. Rio de Janeiro: Record.
Almeida, Jorge. 1996. Como Vota o Brasileiro. 2 ed. Sao Paulo: Xama.Brasil, Olavo. 1983. Partidos Polıticos Brasileiros: 45 a 64. Biblioteca de Ciencias Sociais Rio de Janeiro:
Graal.Canedo-Pinheiro, Mauricio. 2009. “Bolsa Famılia ou Desempenho da Economia? Determinantes da
Reeleicao de Lula em 2006.” Unpublished manuscript, Fundacao Getulio Vargas, Rio de Janeiro.Carraro, Andre, Ari Francisco Araujo Jr, Otavio Menezes Dame, Lenoardo Monteiro Monasterio &
Claudio Djissey Shikida. 2007. “‘E a economia, companheiro!’: uma analise empırica da reeleicaode Lula com base em dados municipais.” Ibemec MG Working Paper - WP41.
Carvalho, Jose Murillo de. 1966. “A Familia, a Politica a uma Hipotese.” Revista Brasileira de EstudosPoliticos :153–194.
Datafolha. 1994. Itencao de voto para Presidente — Datafolha/BRASIL94.SET-00377. Interviewed21292 people on September 27-28. In Banco de Dados do Centro de Estudos de OpiniaoPublica, ed. CESOP-UNICAMP. http://www.cesop.unicamp.br/site/htm/busca/php, accessedon 09/01/2008: .
Datafolha. 1998. Intencao de voto para presidente 1998 — DAT/BR2006.SET-00870. In Banco de Dadosdo Centro de Estudos de Opiniao Publica, ed. CESOP-UNICAMP. http://www.cesop.unicamp.br/site/htm/busca/php, accessed on 09/01/2008: .
Datafolha. 2002. Intencao de voto para presidente 2002 — Ibope/BR2006.SET-01692. In Banco de Dadosdo Centro de Estudos de Opiniao Publica, ed. CESOP-UNICAMP. http://www.cesop.unicamp.br/site/htm/busca/php, accessed on 09/01/2008: .
Datafolha. 2006. Intencao de voto para presidente 2006 — PO 613364A Datafolha. In Banco de Dadosdo Datafolha, ed. Datafolha.
Diaz-Cayeros, Alberto, Beatriz Magaloni & Federico Estevez. Forthcoming. Strategies of Vote Buying:Social Transfers, Democracy and Welfare in Mexico. Cambridge: Cambridge University Press.
Fenwick, Tracy Beck. 2009. “Avoiding Governors: The Success of Bolsa Famılia.” Latin AmericanResearch Review 44(1):102–131.
Furtado, Celso. 1965. Political Obstacles to the Economic Development of Brazil. In Obstacles to Changein Latin America, ed. Claudio Veliz. Oxford: Oxford University Press pp. 145–161.
24

Zucco: Poor places. . . Draft: March 9, 2010
Hall, Anthony. 2006. “From Fome Zero to Bolsa Famılia: Social Policies and Poverty Alleviation underLula.” Journal of Latin American Studies 38:389–709.
Hunter, Wendy & Timothy Power. 2007. “Rewarding Lula: Executive Power, Social Policy and theBrazilian Elections of 2006.” Latin American Politics and Society 49(1):1–30.
Ibope. 1989. Voto Nacional XVI — Ibope/BRASIL89.NOV-00200. Interviewed 3650 people in November.In Banco de Dados do Centro de Estudos de Opiniao Publica, ed. CESOP-UNICAMP. http://www.cesop.unicamp.br/site/htm/busca/php, accessed on 09/01/2008: .
Ibope. 2006. Intencao de voto para presidente 2006 — Ibope/BR2006.SET-02358. Interviewed 2002 peopleon Sep. 6th. In Banco de Dados do Centro de Estudos de Opiniao Publica, ed. CESOP-UNICAMP.http://www.cesop.unicamp.br/site/htm/busca/php, accessed on 09/01/2008: .
Kinzo, Maria D’Alva Gil. 1988. Legal Opposition Politics under Authoritarian Rule in Brazil: The Caseof the MDB, 1966–79. London: Macmillan Press.
Kitschelt, Herbert & Steven Wilkinson, eds. 2007. Patrons, Clients, and Policies: Patterns of DemocraticAccountability and Political Competition. Cambridge: Cambridge University Press.
Lamounier, Bolivar. 1975. Comportamento Eleitoral em Sao Paulo: Passado e Presente. In Os Partidose as Eleicoes no Brasil, ed. Bolivar Lamounier & Fernando Henrique Cardoso. Sao Paulo: Paz eTerra pp. 15–44.
Lamounier, Bolivar. 1980. O Voto em Sao Paulo, 1970–1978. In Voto de Desconfianca, ed. BolivarLamounier. Petropolis: Vozes–Cebrap chapter , p. .
Lamounier, Bolivar. 1986. 1985, O Voto em Sao Paulo. Sao Paulo: IDESP.Lamounier, Bolivar. 1990. Tera o Brasil um govenro legitimo e estavel em 1990? in Lamounier, Figueiredo,
Kinzo, Muszynski & Sadek (1990) pp. 7–16.Lamounier, Bolıvar, Marcus Figueiredo, Maria D’Alva Gil Kinzo, Judith Muszynski & Maria Tereza
Sadek. 1990. Cem Anos de Eleicoes Presidenciais. Number 36 in “Textos” Sao Paulo: IDESP.Licio, Elaine, Henrique Castro & Lucio Renno. 2009. “Bolsa Famılia e Voto nas Eleicoes Presidenciais
de 2006: Em Busca do Elo Perdido.” Opiniao Publica 15(1):29–58.Nicolau, Jairo & Vitor Peixoto. 2007. “As bases municipais da votacao de Lula em 2006.” Published online
in Forum Internet as Position Paper 2 http://www.forumnacional.org.br/forum/pforum62a.asp.
O’Donnell, Guillermo. 1973. Modernization and Bureaucratic Authoritarianism. Studies in South Amer-ican Politics Berkeley: University of California Press.
Samuels, David. 2006. “Sources of Mass Partisanship in Brazil.” Latin American Politics and Society48(2):1–27.
Soares, Glaucio Ary Dillon & Sonia Luiza Terron. 2008. “Dois Lulas: a geografia eleitoral da reeleicao(explorando conceitos, metodos e tecnicas de analise geoespacial).” Opiniao Publica 14(2):269–301.
Soares, Graucio Ary Dillon. 1973. Sociedade e Polıtica no Brasil. Corpo e Alma do Brasil Sao Paulo:Difusao Eurpeia do Livro.
Valenzuela, Arturo. 1978. The Breakdown of Democratic Regimes: Chile. Baltimore: John HopkinsUniversity Press.
Vox Populi. 2006. Intencao de voto para presidente 2006 — PP 100-02 2006 2 Turno. Interviewed 2005people on Oct. 16th and 17th. In Banco de Dados do Centro de Estudos de Opiniao Publica, ed.CESOP-UNICAMP.
Zucco Jr., Cesar. 2008. “The President’s ‘New’ Constituency: Lula and the Pragmatic Vote in Brazil’s2006 Presidential Election.” Journal of Latin American Studies 40(1):29–49.
Zucco Jr., Cesar. 2010. “Cash-transfers and Voting Behavior: An assessment of the political impactsof the Bolsa Famılia program.” Unpublished manuscript avaialble at http://www.princeton.edu/~zucco/papers/cctvotingbehavior.
25

www.centrodametropole.org.br