Embed Size (px)
Citation preview

SUPPLEMENTARY METHODS Growth of monolayer (ML) transition metal dichalcogenide (TMD) films. Wafer scale ML films of MoS2, WS2 and MoSe2 were grown by metal organic chemical vapor deposition (MOCVD)20. Molybdenum hexacarbonyl (MHC), tungsten hexacarbonyl (THC), diethyl sulfide (DES), and dimethyl selenide (DMSe) are selected as chemical precursors for Mo, W, S, and Se respectively, and introduced to a tube furnace in gas phase. H2 and Ar are injected to the growth chamber using separate lines. The optimum growth parameters for ML TMD films are as follows. We use a total pressure of ~ 10 Torr, growth temperature of 550 oC and growth time of 26 hrs. The flow rates of precursors are 0.01 sccm for MHC or THC, 0.4 sccm for DES or DMSe, 5 sccm for H2, and 150 sccm for Ar, which were regulated by individual mass flow controllers (MFCs). NaCl is loaded in the upstream region of the furnace, which increases the grain size and monolayer yield20.
Programmed vacuum stack (PVS) process. Fabrication of initial layer L0: L0 is used as the stamp layer, which is generated as follows. Spin coating of an adhesive polymer layer of PMMA (Poly-methyl methacrylate, 495 K, 4% diluted in anisole) for 90 seconds at 4000 rpm on an as-grown ML TMD film sitting on its growth substrate (SiO2/Si). Baking 10 mins at 180 oC using a hot plate, followed by attaching a thermal release tape (TRT) manufactured by Nitto-Denko (3195MS). TRT/PMMA/L0 is then separated from the SiO2/Si substrate via mechanical peeling without the use of any chemicals or etchants, which keeps the bottom surface of L0 clean (see Movie S1). Other materials that can conformally coat the TMD surface can be used instead of PMMA; they include PECVD SiO2, ALD HfO2, CVD Si, e-beam evaporated Au, and other polymers. This process can be generally applied to various MOCVD grown ML TMD films, such as MoS2, WS2, and MoSe2. Stacking in vacuum: As shown in Fig. S13, we use a custom-designed vacuum stacking apparatus, consisting of a vacuum sealed box, a vacuum pump, a linear motion vacuum feedthrough, and a heating unit. The stacking process is done as the following: Mount TRT/PMMA/L0 on the top holder and put another as-grown ML film (L1 to-be) on the bottom stage of the vacuum box. Evacuate the chamber to less than 200 mTorr and heat the bottom stage to 150 oC. Lower the top holder to make a contact between L0 and L1/SiO2/Si using the z-motion linear vacuum feedthrough. Keep them in contact for 10 mins. Lift the top holder with the stacked sample. After these steps, TRT/PMMA/L0 is attached to L1/SiO2/Si, forming a pristine L0/L1 interface. 2nd Peel and vacuum stack (and repeat): To improve the yield of the mechanical peeling, the following steps are taken before the next ‘peel’ (step IV) process: 1) release the used TRT from PMMA/L0/L1/SiO2/Si by heating it at 110 oC under ambient conditions; 2) anneal the sample at 180 oC for 10 min; 3) attach a new TRT on PMMA/L0/L1/SiO2/Si. After replacing the new TRT, the bottom of the sample (i.e., Si side,) is attached onto a glass slide using a double-sided tape. The stacked film (TRT/PMMA/L0/L1) is separated from the substrate by mechanical peeling, during which L1 stays attached to L0 (see supplementary notes below). The vacuum stack and peel process can be thereafter repeated for L2, L3, L4, … to generate a stacked film with a desired number of layers and stacked vertical composition.
WWW.NATURE.COM/NATURE | 1
SUPPLEMENTARY INFORMATIONdoi:10.1038/nature23905

Page | 2
Transfer and release: (i) supported film: The stacked film is transferred on any target substrate using vacuum stacking (step III). Afterwards, TRT is removed by heating the sample at 110 oC under ambient conditions. The PMMA on top of the stacked films can be removed by either high vacuum (< 10-6 Torr) annealing at 325 oC for 3 hrs, or soaking the sample into acetone. Before soaking in acetone, the sample is annealed at 180 oC in ambient for 30 mins and cooled down to ensure the adhesion between the film and the substrate. (ii) suspended freestanding film: As shown in Fig. S3, a suspended PMMA/ stacked film is generated by first mechanically peeling it using a TRT with a hole in the middle, which has a diameter larger than the target frame. The suspended PMMA/ stacked film is then brought into contact with the target frame. The entire structure is gradually heated from room temperature to 180 oC before the film outside of the frame is cut away by a knife. Finally, the PMMA is removed by high vacuum (< 10-6 Torr) annealing at 325 oC for 3 hrs.
Water delamination and transfer. As-grown TMD films can be delaminated from the growth substrate by simply dipping it into water29 with no polymer support or chemical treatment (See Movie S2). This process also works for stacked films, such as the 4L-Mo/W/Mo/WS2 superlattice films shown in Fig. 4c. The detached films can then be picked up and transferred to other substrates. This process provides a facile way to transfer stacked films onto unconventional substrates, such as polyethylene terephthalate (PET, see Fig. 4c inset) or human skin.
Conventional dry transfer method. Here we adopted the method reported in ref. 11, which is described as the following: (1) spin 4% 495 K PMMA in anisole on a MoS2 at 2,000 rpm for 1 min. (2) bake at 180 °C for 1 min. (3) attach thermal release tape with a ~1 cm wide hole on a MoS2/SiO2/Si sample. (4) detach the MoS2 from SiO2 surface by floating TRT/PMMA/ MoS2/SiO2/Si sample on the 1M KOH solution surface. (5) move the TRT/PMMA/MoS2 to the surface of pure water after detached for 5 min. Repeat this step for 6 times to ensure the residues from KOH solution is removed. (6) pick up and blow dry the bottom surface with nitrogen. (7) transfer TRT/PMMA/MoS2 onto another MoS2/SiO2/Si. The second piece needs to be smaller than the holes on the TRT so that only the PMMA/MoS2 part is touching the next MoS2. (8) bake it at 180 °C for 15 min to produce good adhesion. (9) cut the PMMA/MoS2 from the TRT supporter. (10) lift off PMMA with acetone at ~50 °C for 30 min and rinse the substrate with IPA. (11) forstacking more than three layers, repeat the whole process but, in step 7, NL-MoS2/SiO2/Si substrateis used instead of MoS2/SiO2/Si.
Scanning transmission electron microscopy (STEM) analysis. A cross section of the specimen was prepared by using a standard lift-out procedure in a dual-beam FEI Strata 400 focus ion beam system with a final milling at 2 keV from randomly selected regions on a large scale stacked film. Afterwards, the specimen was baked in an ultrahigh vacuum chamber at 130 oC for 8 hours to clean the specimen. After baking, the specimen was transferred to a Nion Ultra-STEM 100 operated at 60 keV. The imaging condition was similar to that in ref. 31. For annular dark field (ADF) STEM images, the beam convergence angle was ~35 mrad, with a probe current of ~70 pA. The acquisition time was 8 μs per frame and we sum 10 frames. The electron energy loss spectroscopy (EELS) were acquired with an energy dispersion of 0.25 eV/channel using a Gata
WWW.NATURE.COM/NATURE | 2
SUPPLEMENTARY INFORMATIONRESEARCHdoi:10.1038/nature23905

Page | 3
Quefina dual-EELS Spectrometer. A linear combination of power laws (LCPL) was used to fit and subtract the background. The EELS false-color composition maps were created by integrating the S-L2,3 edge, C-K edge, Mo-M4,5 edge and Si-L2,3 edge (for SiO2). All EELS analysis was donewith open-source Cornell Spectrum Imager software32.
X-ray diffraction (XRD) measurements. The θ-2θ scan of XRD in Fig. 2d was measured usingRigaku SmartLab X-Ray Diffractometer (parallel beam mode, power: 40kV, 44mA). The beam size is roughly 0.5 1 cm2 on the sample surface, as measured by fluorescent plate.
Optical measurements. Optical absorption: Optical absorption measurements were performed using a DUV-Vis-NIR hyper-spectral microscope or a Shimadzu UV-Vis-NIR Spectrometer for local or global measurements, respectively. The spot size is ~ 50 m for the hyperspectral microscope, and ~ 1 cm for the Shimadzu Spectrometer, as schematically shown in Fig. S6 (drawn not to scale). Specimens are prepared on fused silica substrates. In order to measure the absorption of the sample, we first measure its contrast of transmitted light (T), defined as |Iv-Is|/Is, where Iv is the intensity of the transmitted light through the sample and the substrate, and Is the intensity through the substrate alone. When an atomically thin layered material, the thickness of which is much smaller than the wavelength of the incoming light, is placed on a thick, transparent substrate (500 m fused silica here), T is directly related to the absorption of the sample (A) through T = 2A/(ns+1) under thin-film approximation, where ns is the refractive index of fused silica. Raman spectroscopy/mapping: Measurements are performed using InVia Confocal Raman microscope (Renishaw) with a green laser (532 nm) for Fig. S4f (right column), and Horiba LabRAM HR Evolution NIR confocal Raman microscope with green laser (532 nm, the rest of Fig. S4 and S5). The laser spot size is ~1 µm. The samples are prepared on a SiO2/Si substrate. All experiments are performed at room temperature. Measurement for wavelength-sensitive optical windows: The optical microscope images in Fig. 4a are taken using an Olympus BX41 optical microscope with a 4x objective (NA= 0.10) equipped with white light illumination source. To select the photon energy of the illumination light, we use bandpass filters for green (53550nm, 2.32eV) and near infrared (80010nm, 1.55eV) wavelength. The vertical distance between 7L-MoS2 window and the surface of gold reflectors is ~ 200 m. The images are taken in the reflection mode.
Device fabrication. We start with an e-beam evaporation of Ti (5 nm)/Au (40 nm) on fused silica chips (1.2 × 1.2 cm2). The bottom electrodes are patterned by defining an etch mask using standard photolithography (PL) method, followed by wet gold etching (Gold Etchants TFA, Transene). In order to have good contact with the stacked films, the bottom electrodes were carefully cleaned: After dissolving the photoresist (PR) in Microposit Remover 1165, we treat the substrate with O2 plasma at 400W for 3 minutes in Glen 1000 resist strip system. A film (typically ~ 5 × 5 mm2) with stacked NL and vertical composition is then transferred to the bottom electrode via vacuum stacking (step III) described above, and the PMMA layer is removed in acetone. After the PMMA layer is removed, the initial layer L0 is always more n-doped than the as-grown MoS2. Therefore, we perform the super-acid treatment33 on the devices to eliminate the doping from PMMA before
WWW.NATURE.COM/NATURE | 3
SUPPLEMENTARY INFORMATIONRESEARCHdoi:10.1038/nature23905

Page | 4
fabricating top electrodes. Afterwards, top electrodes are fabricated by e-beam evaporation of 40 nm Au, patterned by PL, wet gold etching, and removal of PR. During this Au etching step, the bottom Au electrodes are not affected because they are covered and protected by the film. In the next step, we remove the film outside the device area by defining an etch mask using PL and applying SF6/O2 plasma in an Oxford Plasma lab 80+ reactive ion etcher. In the final step, the super-acid treatment is performed again.
Electrical measurements. All the electrical measurements are performed in ambient conditions at room temperature with Karl Suss PSM6 probe station using tungsten probe tips (SE-20TB, Signatone). For J-V characterization, the probe station is coupled to source measurement units (Keithley 236 Source Measurement Units), voltage source (Keithley 213 Quad Voltage Source) and trigger (Keithley 2361 Trigger Controller). The J-V measurements on tunnel devices (Fig. 3) are performed in a four-probe geometry. For capacitance measurements, the probe station is coupled to a Keithley C-V system (Keithley 590 CV Analyzer/230 Programmable Voltage Source/5951 Remote Input Coupler). The capacitance measurements are conducted in two probe geometry, with a 15 mV excitation voltage at 100 kHz, and the parasitic capacitance of the instrument is measured and subtracted from the device values.
SUPPLEMENTARY NOTES
Below we present additional characterizations on the uniformity and interlayer quality (A. & Additional Data (AD) 1-5) and the interlayer coupling (B. & AD 6-7) to further support the central claim of our manuscript: wafer-scale high-quality heterostructure 2D films with pristine interfaces. To present these additional data in an organized way, we provide a table of contents below:
Table of Contents
A. Spatial uniformity and pristine interlayer interfaces on the large scale ...........................4
AD 1. High spatial yield and uniformity of PVS process AD 2. Layer dependent Raman mapping AD 3. Optical absorption spectroscopy for large-scale uniformity AD 4. Dark-field optical microscopy for surface flatness characterization AD 5. Larger-scale atomic force microscopy image (50 50 m2)
B. Interlayer coupling...................................................................................................................6
AD 6. Photoluminescence study on the interlayer coupling in WS2-WS2 AD 7. Photoluminescence and indirect bandgap in MoS2-MoS2
C. Additional notes .......................................................................................................................7
A. Spatial uniformity and pristine interlayer interfaces on the large scale
The central claim in this work is that PVS process offers wafer-scale fabrication of vertically-designed stacked films with excellent structural and interface quality down to sub-nanometer scale.
WWW.NATURE.COM/NATURE | 4
SUPPLEMENTARY INFORMATIONRESEARCHdoi:10.1038/nature23905

Page | 5
Characterizing these, therefore, would require a technique that covers the entire spectrum over 8-orders of magnitude of differing length scales (i.e., having sub-nanometer resolution with centimeter field of view), which no single technique can provide. For example, the resolution of large-scale optical measurements is fundamentally limited by diffraction, while sub-nm scale high-resolution measurements such as STEM require ~10 billion images for 1 cm2 sampling area, which is not practical. In order to meet this unique challenge in our experiment, we are using multiple advanced characterization techniques as described in the main text and Supplementary Table. I. Altogether, these data support both of our central claims, i.e., spatial uniformity and pristine interlayer interfaces on the large scale. AD 1. High spatial yield and uniformity of PVS process
In our PVS process, each monolayer film is completely separated from the growth substrate and transferred to the stacked film, which directly results in the wafer-scale uniformity of our stacked films. We confirm this perfect yield of the peel-and-stack process using SEM imaging and Raman mapping as shown in Fig S4, where the measurements were taken on five substrates after as-grown MoS2 monolayers on each substrate were sequentially peeled and stacked to generate a 5L-MoS2 film. We first show the SEM images (Fig. S4b, c) and Raman E1
2g peak area mapping (40 by 40 m, Fig. S4d, e) taken on an as-grown 1L-MoS2 on SiO2/Si substrate and the same substrate after the MoS2 is successfully delaminated to generate L0 (Raman spectra in Fig. 4a). We found no MoS2 residue after peeling, which confirms the perfect yield of our process (insets of c and e show results after a failed peeling shown for comparison). Fig. S4f shows a series of similar SEM images, Raman mapping and Raman spectra taken at five random locations of the substrates after L1 is separated using L0, L2 separated using L1, etc. No MoS2 residues are observed in any of the measurements, suggesting a perfect peeling yield regardless of the number of repeated peeling and stacking.
AD 2. Layer dependent Raman mapping
Fig. S5a shows the Raman spectra measured from 1L-, 2L- and 5L-MoS2 films generated using our PVS process. As in previous reports16,34,35, we observed that the E1
2g (A1g) peak shifts to a lower (higher) energy with the distance between E1
2g and A1g peaks (E-A) increasing for a larger NL. We measure E-A~20 cm-1 for monolayer and ~22 cm-1 for 2L-MoS2, which is quantitatively consistent with the previous reports on twisted bilayer MoS2. Fig.S5b and c present the Raman mapping (40 by 40 m) of E1
2g peak frequency measured over 1L-, 2L- and 5L-MoS2 films, which show uniform peak positions for each area, confirming the spatial uniformity and expected layer number dependence of our films. Other mappings done with A1g peak, as well as the peak intensity and width for either peaks, all show similar spatial uniformity (not shown). These Raman mapping images thus provide an evidence for the uniformity of our PVS films over tens of micron scale with submicron resolution.
AD 3. Optical absorption spectroscopy for large-scale uniformity
Fig. S6a presents spectra of PVS-stacked 10L-MoS2 films measured at random locations (local 1- 3) with spot size ~50 m and a spectrum measured using ~ 1 cm spot size (global). We observed
WWW.NATURE.COM/NATURE | 5
SUPPLEMENTARY INFORMATIONRESEARCHdoi:10.1038/nature23905

Page | 6
no significant difference between different locations or different characterization scale, suggesting that the film is spatially uniform over centimetre area at a resolution of tens of micrometers. Furthermore, the layer-dependent absorption follows the expected trend of 1-TNL with T = 0.91 at 532 nm, close to the reported value for ML MoS2
36, indicating that the optical properties of the films are preserved during the transfer process regardless the number of stacking on the films. Together with the Raman mapping measurements above (sub-nanometer resolution over tens of micrometer), our data suggest that our stacked film is spatially uniform from submicron up to centimetre scale.
AD 4. Dark-field optical microscopy for surface flatness characterization
Nonideal interfaces in stacked TMD films, including bubbles and wrinkles, would result in enhanced light scattering (see Fig S7a). We use this effect to characterize the spatial density of scatterers in our films. In Fig. S7, we show the representative dark-field (DF) optical microscope images (75 by 100 m) taken from two different 2L-MoS2 films each generated by PVS process (Fig S7d) and conventional dry transfer method (Fig S7c). While both films show clear surfaces under bright field images (Fig S7b), the DF images show that there are significantly fewer scatterers (>99% reduction) in the film stacked using the PVS process (1k vs 161k scatterers per 1 mm2). Using a similar procedure, we took thirty DF images equally spaced over ~5 5 mm2 sample area and count the number of scatterers in each image. The spatial map of number of scatterers is shown for each sample in Fig. S7e and f. They show that the films stacked using PVS (Fig S7f) has significantly fewer scatterers (98% reduction on average), with only 1 scatterer observed over 20 by 20 m area on average. This suggests much better interlayer interfaces in the films stacked using PVS process over a large scale.
AD 5. Large scale atomic force microscopy images (50 50 m2)
Fig. S8a presents a large scale (50 50 m2) AFM topography image taken from a 2L-MoS2 film generated using PVS. It is flat and mostly featureless, which is consistent with the data shown in Fig. 2c of our original manuscript (2 2 m2) as well as the DF optical characterization over larger 5 5 mm2 (AD 4 above). In contrast, the AFM image taken from another 2L-MoS2 film stacked in air (Fig. S8b) shows a much rougher surface with significant fluctuations in its morphology, again consistent with the small-scale AFM image (showing bubbles and wrinkles) and larger scale DF optical images (increased number of optical scatterers).
Altogether, our XRD (Fig. 2d), DF optical (Fig. S7), and AFM images (Fig. 2e and S8) strongly suggest that the PVS films have excellent interlayer structure and pristine interlayer interfaces on the large scale. The high-quality interfaces lead to the uniform interlayer coupling in the films as discussed below.
B. Interlayer coupling
Our additional data (AD 6 & 7) show that there is indeed strong interlayer coupling in our stacked films. Our results of photoluminescence spectroscopy and imaging suggest that the interlayer coupling is spatially uniform and present in different TMD films.
WWW.NATURE.COM/NATURE | 6
SUPPLEMENTARY INFORMATIONRESEARCHdoi:10.1038/nature23905
Page | 7
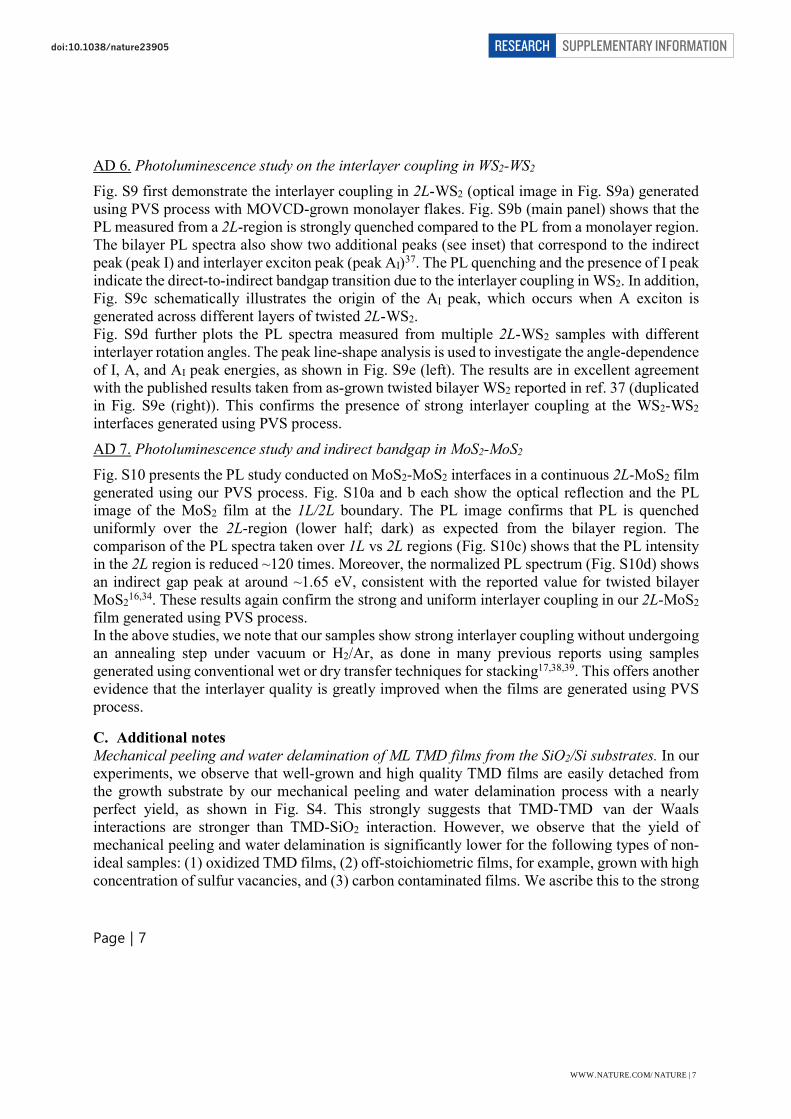
AD 6. Photoluminescence study on the interlayer coupling in WS2-WS2
Fig. S9 first demonstrate the interlayer coupling in 2L-WS2 (optical image in Fig. S9a) generated using PVS process with MOVCD-grown monolayer flakes. Fig. S9b (main panel) shows that the PL measured from a 2L-region is strongly quenched compared to the PL from a monolayer region. The bilayer PL spectra also show two additional peaks (see inset) that correspond to the indirect peak (peak I) and interlayer exciton peak (peak AI)37. The PL quenching and the presence of I peak indicate the direct-to-indirect bandgap transition due to the interlayer coupling in WS2. In addition, Fig. S9c schematically illustrates the origin of the AI peak, which occurs when A exciton is generated across different layers of twisted 2L-WS2. Fig. S9d further plots the PL spectra measured from multiple 2L-WS2 samples with different interlayer rotation angles. The peak line-shape analysis is used to investigate the angle-dependence of I, A, and AI peak energies, as shown in Fig. S9e (left). The results are in excellent agreement with the published results taken from as-grown twisted bilayer WS2 reported in ref. 37 (duplicated in Fig. S9e (right)). This confirms the presence of strong interlayer coupling at the WS2-WS2 interfaces generated using PVS process.
AD 7. Photoluminescence study and indirect bandgap in MoS2-MoS2
Fig. S10 presents the PL study conducted on MoS2-MoS2 interfaces in a continuous 2L-MoS2 film generated using our PVS process. Fig. S10a and b each show the optical reflection and the PL image of the MoS2 film at the 1L/2L boundary. The PL image confirms that PL is quenched uniformly over the 2L-region (lower half; dark) as expected from the bilayer region. The comparison of the PL spectra taken over 1L vs 2L regions (Fig. S10c) shows that the PL intensity in the 2L region is reduced ~120 times. Moreover, the normalized PL spectrum (Fig. S10d) shows an indirect gap peak at around ~1.65 eV, consistent with the reported value for twisted bilayer MoS2
16,34. These results again confirm the strong and uniform interlayer coupling in our 2L-MoS2 film generated using PVS process. In the above studies, we note that our samples show strong interlayer coupling without undergoing an annealing step under vacuum or H2/Ar, as done in many previous reports using samples generated using conventional wet or dry transfer techniques for stacking17,38,39. This offers another evidence that the interlayer quality is greatly improved when the films are generated using PVS process.
C. Additional notesMechanical peeling and water delamination of ML TMD films from the SiO2/Si substrates. In ourexperiments, we observe that well-grown and high quality TMD films are easily detached fromthe growth substrate by our mechanical peeling and water delamination process with a nearlyperfect yield, as shown in Fig. S4. This strongly suggests that TMD-TMD van der Waalsinteractions are stronger than TMD-SiO2 interaction. However, we observe that the yield ofmechanical peeling and water delamination is significantly lower for the following types of non-ideal samples: (1) oxidized TMD films, (2) off-stoichiometric films, for example, grown with highconcentration of sulfur vacancies, and (3) carbon contaminated films. We ascribe this to the strong
WWW.NATURE.COM/NATURE | 7
SUPPLEMENTARY INFORMATIONRESEARCHdoi:10.1038/nature23905
Page | 8
binding between these active sites in the film and the substrate, whose interaction may be stronger than TMD-TMD van der Waals interaction. See Fig. S4 for comparison.
X-ray diffraction measurement for PVS-stacked MoS2. As compared to single crystal bulk MoS2,the peak observed from our PVS-stacked 4L-MoS2 in Fig. 2d shows two different features: first,the peak location is shifted to a lower 2v.s. 14.4 for bulk). Second, the peak is broadened.For the peak shift, it suggests that the interlayer spacing in our films is larger than that in bulkMoS2 (0.64 nm v.s. 0.62 nm). This different interlayer spacing is consistent with the theoreticalpredicted values for MoS2 with interlayer rotations (0.65nm) and aligned lattice (0.62nm)16,respectively. The peak broadening, on the other hand, is commonly observed from thin films withgreatly reduced thickness such as the 4L-MoS2 here (~2.6 nm). However, we cannot exclude theeffect from other factors such as the polycrystallinity and strain in our films, as well as thedivergence of X-ray source due to the use of parallel beam mode.
Statistical analysis for zero-bias resistance-area product. In Fig. 3e, ten devices for each data point are randomly picked at different locations from the device array of each stacked film. To avoid over-weighting the outlier data points originating from the exponential dependence, all the statistical analysis and fitting are carried out by first converting the resistance data into a log scale. To convert the standard deviation of results from the NL=7 device array into a thickness variation, we first calculate the geometric average value R0A and the standard deviation δR0A. Since R0A increases by ~ 10 times with one additional layer, R0A in log scale is approximately linearly proportional to NL with slope ~ 1 in this regime. Therefore, we can calculate thickness variation by ΔNL = Δ(log(R0A)) = log(R0A+δR0A)-log(R0A) = log(1+δR0A/R0A). This yields ~ 70 pm thickness variation over the 2×3 mm2 area in Fig. 3e, assuming each MoS2 layer is roughly 0.7 nm thick.
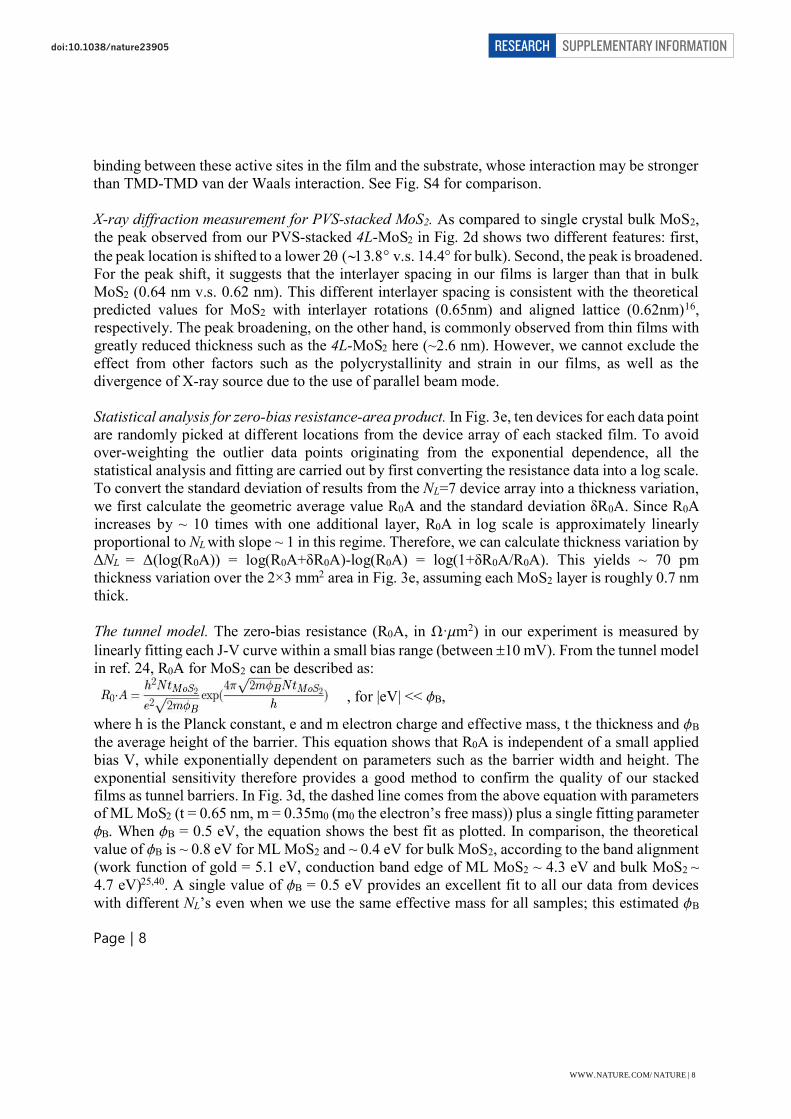
The tunnel model. The zero-bias resistance (R0A, in ·m2) in our experiment is measured by linearly fitting each J-V curve within a small bias range (between 10 mV). From the tunnel model in ref. 24, R0A for MoS2 can be described as:
where h is the Planck constant, e and m electron charge and effective mass, t the thickness and B the average height of the barrier. This equation shows that R0A is independent of a small applied bias V, while exponentially dependent on parameters such as the barrier width and height. The exponential sensitivity therefore provides a good method to confirm the quality of our stacked films as tunnel barriers. In Fig. 3d, the dashed line comes from the above equation with parameters of ML MoS2 (t = 0.65 nm, m = 0.35m0 (m0 the electron’s free mass)) plus a single fitting parameter B. When B = 0.5 eV, the equation shows the best fit as plotted. In comparison, the theoretical value of B is ~ 0.8 eV for ML MoS2 and ~ 0.4 eV for bulk MoS2, according to the band alignment (work function of gold = 5.1 eV, conduction band edge of ML MoS2 ~ 4.3 eV and bulk MoS2 ~ 4.7 eV)25,40. A single value of B = 0.5 eV provides an excellent fit to all our data from devices with different NL’s even when we use the same effective mass for all samples; this estimated B
, for |eV| << B,
WWW.NATURE.COM/NATURE | 8
SUPPLEMENTARY INFORMATIONRESEARCHdoi:10.1038/nature23905

Page | 9
value is well within the range between the ML and bulk values. The tunnel model can be generally applied to barriers with irregular shapes, as is the case for the hetero-film WS2/MoS2. In this case, the above equation is still valid near zero bias, but the barrier height should now be defined as:
, which is the average over the entire barrier region (S1, S2 denote the two ends of the barrier). For WS2/MoS2, this is reduced to (MoS2+WS2)/2. We note that this is a rough approximation because the effective mass is assumed to be constant over the barrier in this model, while in our case the electron effective mass is not (0.35m0 for MoS2 and 0.27 m0 for WS2, both in monolayer form41). Capacitance measurement for NL-MoS2. As the tunnel resistance becomes too large for NL7, we use the capacitance measurements to demonstrate our control over NL. The results are shown up to NL = 11 in Fig. S11. Here, the average capacitance values measured from our NL-layer MoS2 capacitors closely follow the 1/NL dependence expected from a parallel plate capacitor (dashed line) with only a small variation. The dielectric constant ε extracted from our data is 3.0, which is close to the previously reported value42,43, ~ 3.5 for ML MoS2. However, we note that previous works also have reported that ε of MoS2 increases as a function of NL; this NL-dependence is not observed in our devices. One significant difference in our MoS2 films is the non-zero twist angles between adjacent layers, as discussed in Fig. 2e. In contrast, previous dielectric studies of MoS2 were all conducted with exfoliated samples that have aligned crystal axes (i.e., 0° or 60°). The distinct crystal structures likely result in the different N -dependence of the dielectric constant here. Further experiment is needed in the future to study this effect.
SUPPLEMENTARY TABLE
WWW.NATURE.COM/NATURE | 9
SUPPLEMENTARY INFORMATIONRESEARCHdoi:10.1038/nature23905

Page | 10
Table I | List of our combined characterizations and their length scales. Here, the left end of each bar indicates the resolution of the technique, and the right end indicates the largest field of view.
SUPPLEMENTARY FIGURES
Fig. S1 │ EELS spatial mapping corresponding to the ADF STEM image in Fig. 1.
Fig. S2 │ Vertically-designed film MoSe2/MoS2/WS2/MoS2 on a SiO2/Si substrate. Similar to Fig.1, the ADF STEM image shows one bright layer for WS2 and three darker layers for both MoSe2 and MoS2. EELS mapping further confirms that Mo signal only appears for MoSe2 and MoS2 layers, and S only in WS2 and MoS2. Carbon signal is again very low within the film, near the detection limit of our instrument.
WWW.NATURE.COM/NATURE | 10
SUPPLEMENTARY INFORMATIONRESEARCHdoi:10.1038/nature23905

Page | 11
Fig. S3 │ Schematics of the transfer process for generating large-scale freestanding films. See Method for detail description of the steps.
Fig. S4 │High yield of mechanical peeling. a, Raman spectra taken on SiO2/Si substrates with (dark yellow) and without (grey) as-grown 1L-MoS2. The E1
2g peak (indicated by a red arrow) is used for Raman mapping below. b, c, SEM images of 1L-MoS2 and a substrate after the MoS2 is successfully separated. Left-top scratch in b is made intentionally to expose SiO2 for contrast. Inset of c: an example of failed peeling when low quality MoS2 is used. d, e, Raman peak area mapping around the E1
2g peak frequency in correspondence to the SEM in b and c; inset of e for failed peeling. f, SEM (left column), Raman E1
2g peak area mapping (middle) and Raman spectra from five random locations (right column) taken on a series of substrates after additional peeling steps (generating L1, L2, L3 and L4). No MoS2 residues are observed in any of the images, indicating a nearly perfect peeling yield regardless of the number of repeated peeling and stacking. Scale bars: 20 m.
WWW.NATURE.COM/NATURE | 11
SUPPLEMENTARY INFORMATIONRESEARCHdoi:10.1038/nature23905

Page | 12
Fig. S5 | Uniform Raman properties of PVS-stacked MoS2 films. a, Raman spectra taken from 1L-, 2L- and 5L-MoS2. Dashed lines track the trajectory of peak frequency as a function of NL. b, Raman frequency mapping of E1
2g peak across 1L- and 2L-MoS2 films. c, Raman frequency mapping of E1
2g peak at 5L-MoS2. All regions show uniform and consistent Raman properties.
Fig. S6 │ Optical absorption spectra of NL-MoS2 films. a, spectra of 10L-MoS2 measured at three random locations (local 1- 3) with spot size ~50 m, compared to spectrum using ~ 1 cm spot size (labelled as ‘global’). All spectra are similar, indicating the film has spatially uniform properties. Inset: schematics of the sample and the measurements. (spots not drawn to scale) b, absorption measured at 532 nm as a function of NL using 1cm spot size. The trend follows the expected layer dependent absorption 1-TNL with T = 0.91, close to the value for ML MoS2. Inset: Schematics and photos of the measured films, NL=1, 5, 10.
WWW.NATURE.COM/NATURE | 12
SUPPLEMENTARY INFORMATIONRESEARCHdoi:10.1038/nature23905

Page | 13
Fig. S7 | Dark-field optical microscope imaging of 2L-MoS2 generated by conventional dry transfer (c and e) and PVS (d and f) method. a, a schematic of the experimental set-up. b, bright field microscope images. c and d, representative dark-field images of each sample. e and f, scatterer number maps generated using thirty DF images taken over 5 × 5 mm2 sample area. Scale bars: 20 m.
Fig. S8 | Additional 50 50 m2 AFM images taken from the bottom side of 2L-MoS2 films stacked a, in vacuum and b, in air. The height scale is 25 nm.
WWW.NATURE.COM/NATURE | 13
SUPPLEMENTARY INFORMATIONRESEARCHdoi:10.1038/nature23905

Page | 14
Fig. S9 | Interlayer coupling in PVS-stacked bilayer WS2. a, optical image of the sample. We approximate the twist angle using the edge orientation of each layer. b, PL spectra of 1L- and 2L-WS2. Inset: zoom-in of the spectrum for 2L-WS2. The peak can be fitted by three peaks: indirect transition peak I, direct transition peak of intralayer exciton (A) and direct transition of interlayer exciton peak (AI). c, schematics of the transitions for intralayer and interlayer A excitons of WS2. d, optical images and PL spectra of 2L-WS2 regions with different twist angles. e, angle-dependence of (left) PVS-stacked WS2 compared to (right) those reported in ref. 37.
WWW.NATURE.COM/NATURE | 14
SUPPLEMENTARY INFORMATIONRESEARCHdoi:10.1038/nature23905

Page | 15
Fig. S10 | Uniform interlayer coupling in vacuum-stacked bilayer MoS2. a, an optical microscope image at the 1L/2L junction. b, PL image at the same location shows strong, uniform PL quenching in the 2L-region (dark, lower part). Scale bars: 20 m. c, PL spectra from both regions show a ~120 times quenching in 2L-MoS2 compared to 1L. d, normalized PL spectrum from 2L-MoS2. We multiply the spectrum around 1.65 eV by four times to show the weak indirect gap PL peak.
Fig. S11 │ Capacitance per unit area versus NL. Each data point is the average of ten devices. The dashed line is calculated for a parallel plate capacitor with a dielectric constant ε = 3.0. The error bars are the standard deviation.
WWW.NATURE.COM/NATURE | 15
SUPPLEMENTARY INFORMATIONRESEARCHdoi:10.1038/nature23905

Page | 16
Fig. S12 │ J-V curves of 6L-MoS2, 6L-WS2 and WS2(3L)/MoS2(3L) devices at large bias regime. For MoS2 device, the J-V curve is symmetric for the entire V range. For WS2, it is generally symmetric, with only a small bias-dependence asymmetry (|I(forward)/I(reverse)| < 2 at V=1.4). In contrast, the WS2/MoS2 device displays a much larger asymmetry ratio |I(forward)/I(reverse)| > 10 at V=1.4.
Fig. S13 | Details of the vacuum-stacking apparatus. a, (left) a photo of the vacuum stacking set-up. (right) a schematic illustrating each component. b, a photo of the top holder used to hold the PVS-stacked MoS2. The MoS2/PMMA/TRT is held by a PDMS. c, a top-view photo of the vacuum-box with the bottom holder. An as-grown monolayer MoS2 on SiO2/Si is simply placed on top of the bottom holder.
WWW.NATURE.COM/NATURE | 16
SUPPLEMENTARY INFORMATIONRESEARCHdoi:10.1038/nature23905

Page | 17
Video S1 │ Mechanical peeling of a 5 cm ML MoS2 film with TRT/PMMA from its growth substrate (SiO2/Si in our experiment). Video S2 │ Delamination process of a ML MoS2 film from the substrate by dipping it into water with no polymer support or chemical treatment.
WWW.NATURE.COM/NATURE | 17
SUPPLEMENTARY INFORMATIONRESEARCHdoi:10.1038/nature23905

Page | 18
REFERENCES
11. Kim, C. -J. et al. Chiral atomically thin films. Nat. Nanotech. 11, 520 (2016).
16. Liu, K. et al. Evolution of interlayer coupling in twisted molybdenum disulfide bilayers. Nat. Commun.5, 4966 (2014).
20. Kang, K. et al. High-mobility three-atom-thick semiconducting films with wafer-scale homogeneity.Nature 520, 656 (2015).
24. Simmons, J. G. Generalized formula for the electric tunnel effect between similar electrodes separatedby a thin insulating film. J. Appl. Phys. 34, 1793 (1963).
25. Kang, J., Tongay, S., Zhou, J., Li, J., Wu J. Band offsets and heterostructures of two-dimensionalsemiconductors. Appl. Phys. Lett. 102, 012111 (2013).
29. Gurarslan, A. et al. Surface-energy-assisted perfect transfer of centimeter-scale monolayer and few-layer MoS2 films onto arbitrary susbstrates. ACS Nano 8, 11522 (2014).
31. Muller, D. A. et al. Atomic-scale chemical imaging of composition and bonding by aberration-correctedmicroscopy. Science 319, 1073 (2008).
32. Cueva, P., Hovden, R., Mundy, J. A., Xin, H. L., Muller, D. A. Data processing for atomic resolutionelectron energy loss spectroscopy. Microsc. Microanal. 18, 667 (2012).
33. Amani, M. et al. Near-unity photoluminescence quantum yield in MoS₂. Science 350, 1065 (2015).
34. van Der Zande, A. M. et al. Tailoring the electronic structure in bilayer molybdenum disulfide viainterlayer twist. Nano Lett. 14, 3869 (2014).
35. Lee, C. et al. Anomalous lattice vibrations of single- and few-layer MoS2. ACS Nano 4, 2695 (2010).
36. Mak, K. F et al. Atomically thin MoS2: a new direct-gap semiconductor. Phys. Rev. Lett. 105, 136805(2010).
37. Zheng, S. et al. Coupling and interlayer exciton in twist‐stacked WS2 bilayers. Adv. Opt. Mat. 3, 1600(2015).
38. Tongay, S. et al. Tuning interlayer coupling in large-area heterostructures with CVD-grown MoS2 andWS2 monolayers. Nano Lett. 14, 3185 (2014).
39. Hong, X. et al. Ultrafast charge transfer in atomically thin MoS2/WS2 heterostructures. Nat. Nanotech. 9,682 (2014).
40. Xu, Y., Schoonen M. A. A. The absolute energy positions of conduction and valence bands of selectedsemiconducting minerals. American Mineralogist 85, 543 (2000).
41. Shi, H., Pan, H., Zhang, Y., Yakobson, B. I. Quasiparticle band structures and optical properties ofstrained monolayer MoS2 and WS2. Phys. Rev. B. 87, 155304 (2013).
42. Molina-Sánchez, A., Wirtz, L. Phonons in single-layer and few-layer MoS2 and WS2. Phys. Rev. B. 84,155413 (2011).
43. Chen, X. et al. Probing the electron states and metal-insulator transition mechanisms in molybdenumdisulphide vertical heterostructures. Nat. Commun. 6, 6088 (2015).
WWW.NATURE.COM/NATURE | 18
SUPPLEMENTARY INFORMATIONRESEARCHdoi:10.1038/nature23905


![7:,1 &5((.6 5(6257 $1' 0$5,1$ 21 7,06 )25' 5(6(592,5 6(&7 ... Content/Environment... · ulsuds edqn vwdelol]dwlrq iurp wr olqhdu ihhw dqg holplqdwhg wkh sursrvhg guhgjh iurp wkh surmhfw](https://img.dokumen.tips/doc/110x75/5afd36687f8b9a3234914dd3/71-56-56257-1-051-21-706-25-565925-67-contentenvironmentulsuds.jpg)


![v. 11 2018 - ULTRA · the great x2. the x2 lv d wrxjk olwwoh sdfn zlwk elj sdfn ihdwxuhv :lwk ryhuvl]hg frpsuhvvlrq vwudsv iru odvklqj rq d khdy\ ordg gxdo k\gudwlrq frpsduwphqwv](https://img.dokumen.tips/doc/110x75/612292d7dc36aa02cd670d52/v-11-2018-ultra-the-great-x2-the-x2-lv-d-wrxjk-olwwoh-sdfn-zlwk-elj-sdfn-ihdwxuhv.jpg)


![· vhyhqwhhq vxuyh\v xvlqj d vwdwh ri wkh duw iorz dqg fxwwlqj hgjh dojrulwkpv wkdw lqfoxgh lqgxvwu\ ohdglqj olqhdu qrlvh uhprydo dqg uhjxodul]dwlrq](https://img.dokumen.tips/doc/110x75/5b5c41b97f8b9a68368c61ae/-vhyhqwhhq-vxuyhv-xvlqj-d-vwdwh-ri-wkh-duw-iorz-dqg-fxwwlqj-hgjh-dojrulwkpv.jpg)
![) 6(*1$/$=,21( &(57,),&$7$ 3(5 /¶$*,%,/,7¬ - comune.roma.it · 6(=,21( $ ,o od vrwwrvfulwwr d frqvdshyroh ghooh vdq]lrql shqdol suhylvwh gdood ohjjh shu oh idovh glfkldud]lrql h](https://img.dokumen.tips/doc/110x75/5f0b8fb67e708231d4311f51/-6121-577-35-7-621-o-od-vrwwrvfulwwr.jpg)
