Embed Size (px)
Citation preview

1
Supplementary Information for:
Analyzing Uncertainty in a Comparative Life Cycle Assessment of Hand
Drying Systems
Jeremy R. Gregory, Trisha M. Montalbo, Randolph E. Kirchain
1 Scope
1.1 Functional unit A single pair of dry hands represents the functional unit. The corresponding reference flows therefore
include the allocated fraction of a hand dryer or the number of cotton or paper towels associated with
drying that pair of hands (Table 1). For the hand dryers, “dry” is defined by the NSF Protocol P335 (NSF
2007), which sets forth a standard for dryer operation and hygiene, thereby providing a consistent basis
for determining use intensity. Although hygiene is part of the protocol and is another purpose of the
systems that is of interest to the scientific community, it is not considered in this analysis.
Since hand dryers clearly dry more than one pair of hands over their lifetime, their impact has to be
allocated across all these pairs of hands. The same holds true for the cotton roll towels, towel
dispensers, waste bin, bin liners, and packaging used by these products. Allocation is accomplished by
assuming dryers have a 5‐year life span (given the 5‐year warranties on the high‐speed dryers (Dyson ;
Excel Dryer)), over which they dry 350,000 pairs of hands (Blower 2011)—equal to approximately 1,350
pairs of hands a week. Therefore, 1/350,000 or 2.86 × 10‐6 of the impact of a dryer is allocated to the
functional unit. The same assumptions are used for the towel dispensers, waste bin, and packaging.
The effect of dryer lifetime usage on environmental impact is investigated in the sensitivity analysis.
Bin liners and cotton roll towels are also used for multiple pairs of dry hands but do not last the full
350,000 uses and therefore they require their own allocation strategies. If five bin liners are consumed
each week—one for each workday (Environmental Resources Management 2001)—each liner will
correspond to, on average, 270 pairs of dry hands. Consequently, 1/270 or 0.0037 bin liners are
allocated to the functional unit. Although waste bins and bin liners can also be used for the disposal of
other objects, their impacts are fully allocated to paper towels, which represents a worst‐case scenario.
Additionally, the presence of paper towels will increase the need to change the liners. Likewise, the fact
that cotton towels can be laundered and reused an average of 103 times (Eberle and Möller 2006)
before they are disposed has to be taken into account when calculating the fraction of a towel required
to fulfill the functional unit. No allocation is necessary for the paper towels themselves.

2
Table 1 Corresponding drying system reference flow given a functional unit of drying one pair of hands.
Drying system Reference flow
Hand dryers 2.86 × 10‐6 dryer and packaging Electricity to dry one pair of hands
Cotton roll towels 9.71 × 10‐3 cotton towel and packaginga 2.86 × 10‐6 cotton towel dispenser Laundry to wash a towel
Paper towels
2 towels and packagingb 2.86 × 10‐6 paper towel dispenser 2.86 × 10‐6 waste bin 3.7 × 10‐2 bin liner
(a) Assuming one cotton roll towel pull per dry (b) Assuming two paper towels per dry.
1.2 System boundary The analysis includes all life cycle stages, from cradle to grave, along with transportation between each
stage. These stages and their corresponding locations are shown in Figure 1 for the hand dryer, cotton
roll towel, and paper towel systems. The United States is the primary region of focus for the use of the
products in this study. In order to put the hand‐drying systems on equal footing from a supply chain
standpoint and to make the analysis strictly a comparison between the performance of the product
systems rather than between specific supply chain scenarios, all systems, with the exception of paper
towels, are assumed to be manufactured in China and used in the United States. China is a common
location for the manufacturing of technology products; it is also a reasonable assumption for the
manufacture of cotton roll towels (see (Eberle and Möller 2006)). Paper towels, on the other hand, are
assumed to be both manufactured and used in the United States because this represents the industry
standard for a product that is used in a location where the raw materials are plentiful at a competitive
price and the production is not labor‐intensive.

3
Figure 1 Hand dryer, cotton roll towel, and paper towel life cycle stages and corresponding locations assumptions for the
baseline scenario.
Material 1
Material 2
Material N
Paper towel life cycle stages
Baseline location
Materials Manufacturing Use End‐of‐life
Distribution center
Manufacturing facility
Washrooms Waste facility
Transport (road)
Transport (road)
Transport (road)
Kansas City, KS, United States
Kansas City, KS, United States
Various locations, United States
100 km from washrooms
250 km from manufacturing facility
Material 1
Material 2
Material N
Cotton roll towel life cycle stages
Baseline location
Materials Manufacturing Use End‐of‐life
Distribution center
Manufacturing facility
Washrooms Waste facility Laundry
Transport (road)
Transport (road)
Transport (road)
Transport (road)
Transport (ship, rail)
Kansas City, KS, United States
Shanghai, China Various locations, United States
100 km from washrooms
100 km from washrooms
250 km from manufacturing facility
Material 1
Material 2
Material N
Dryer life cycle stages
Baseline location
Materials Manufacturing Use End‐of‐life
Distribution center
Manufacturing facility
Washrooms Waste facility
Transport (road)
Transport (road)
Transport (road)
Transport (ship, rail)
Kansas City, KS, United States
Shanghai, China Various locations, United States
100 km from washrooms
250 km from manufacturing facility

4
1.2.1 Life cycle stages
Upstream processes such as the mining of ore or the extraction and refining of petroleum for vehicle
fuel are included within system boundaries. Once the ore is extracted and refined into raw materials
(the materials stage in Figure 1), the materials are transported to a manufacturing facility where they
are processed and assembled into finished products (the manufacturing stage). Only the energy
required to manufacture dryers or towels is accounted for in the calculation of manufacturing stage
impact. Capital equipment (e.g. buildings, machines, etc.) used by Dyson or any of the other hand dryer
or towel manufacturing firms is not included in the manufacturing phase of the analysis because the
published reports on dryer and towel production that served as sources of inventory data for this report
likewise do not include capital equipment in the primary production phase. This assumption is
reasonable given the expected small contribution of auxiliary electricity and capital equipment to the
overall life cycle burden of the hand‐drying systems. Data for capital equipment upstream of drying
system production, however, is included through use of the ecoinvent database for unit process
inventory data.
After production, the dryers and cotton roll towels are transported from China to a distribution center in
the central US. The paper towel facility, by contrast, is located in the US and is therefore assumed to be
co‐located with a distribution center, which eliminates the need for a corresponding transportation
step. Although transportation to and from the distribution center is accounted for, the impact due to
the center itself is not included in the system because the burdens associated with operating
warehouses are small in comparison with the burden of manufacturing. This is based on rough
calculations using data from a case study by Carnegie Mellon University (Weber et al. 2008) that indicate
that warehousing would be approximately 0.05% of the total GWP for dryers, 0.5 % for cotton roll
towels, and 3% for paper towels (further details in Appendix A.7.1 of the full report (Montalbo et al.
2011)).
The products are next transported from the distribution center to a washroom, where the use stage
takes place. For dryers, the use stage impact is solely due to the electricity required for operation.
While the standard dryer, which heats the air, can potentially affect washroom HVAC performance, this
is not considered in the analysis due to the difficulty of quantifying such an effect. Maintenance of the
dryers is also assumed to be beyond the scope of this analysis because maintenance is typically a labor‐
driven activity, which is not included in the scope of environmental impact assessment. The use stage
for the cotton roll towels encompasses not only the use of the towel inside a washroom, but also a
cleaning step which takes place at a laundry facility. Consequently, cotton roll towels have an additional
transportation step to deliver them to and from the laundry.
Finally, at the end‐of‐life, all product types are transported to a nearby waste facility where they are
incinerated or sent to a landfill. With the exception of the cardboard packaging, there is no clear
evidence that these products are commonly recycled—or in the case of cotton and paper towels,
composted—in the US.

5
1.2.2 Allocation of recycled content
System boundaries also have to be defined when a product life cycle is part of an open loop recycling
system, as is the case for the paper towels manufactured from recycled content. In such cases,
allocation decisions for the raw material production, recycling, and end‐of‐life burdens are necessary
because the paper towel system cannot be expanded to encompass all product life cycles due to lack of
knowledge about the additional products. Various allocation strategies are described in Appendix A.4 of
the full report (Montalbo et al. 2011). The cut‐off method, which assigns the burden of recycling to the
product life cycles that use recycled content, is chosen for the baseline. Since paper towels can use
recycled content but are rarely recycled themselves (same assumption as in the Kimberly‐Clark study
(Madsen 2007)), they represent the final product of an open loop recycling system and are allocated the
burdens from recycling waste paper and end‐of‐life in accordance with the selected strategy.
1.3 Cut‐off criteria In addition to hand‐drying system boundaries, the cut‐off criteria, or the point at which input or output
flows are excluded from the analysis, have to be defined for each system. These criteria can be based
on the mass, energy, or environmental significance of the flows. In the case of the Dyson Airblade™
hand dryer, all parts are accounted for, with the smaller parts such as screws or fasteners aggregated by
material (Blower 2011). The data on which this analysis is based also included a breakdown of the
resistors and other components on the Dyson Airblade™ hand dryer’s printed circuit board; this level of
detail, however, was deemed unnecessary and the data re‐aggregated to circuit board level.
The XLERATOR® dryer, standard dryer, and paper towel life cycle inventories were all based on the study
for Excel Dryer (Dettling 2009). This study included as many components as possible given available
information, and predicted that omitted parts would account for less 1% of total impact. Lastly, the
cotton roll towels were based on the ETSA study (Eberle and Möller 2006), which excluded processes
that consisted of less than 1% of total mass and energy balance. The number of processes excluded,
however, was limited so that they accounted for no more than 5% of the total balance.
2 Life Cycle Inventory Analysis This section details the data and assumptions used to conduct a life cycle inventory analysis for each
hand‐drying system. The complete inventory is generated by combining bill of activities1 data for each
system with life cycle inventory data of required unit processes from existing databases (i.e., ecoinvent).
Whenever possible, data used in this study were obtained from existing sources.
Table 2 lists the generic hand drying system terms (such as high‐speed hands‐under dryer) and the
specific products that correspond to those generic terms. The specific product names are used in this
section because the data sources are about those products. The full analysis included two variations of
the high‐speed hands‐in (HSHI) dryer (one with an aluminum outer casing and one with a plastic outer
casing) and two variations of the paper towels (one with 100% virgin paper content and one with 100%
recycled paper content). Data for all product variations are included in this section, but the results in the
1 “Bill of activities” is defined to include material composition, production requirements, use requirements, and transportation
distances for a product system.

6
paper are only for the HSHI dryer with the aluminum outer casing and the 100% virgin content paper
towel. This is because the differences between the two alternatives for each product are quite small, so
one set of results for each product type are presented for clarity’s sake. The conservative alternative for
comparisons in each instance is selected: the HSHI dryer has the lowest overall impact, so the aluminum
cover alternative is used in comparisons because it has a higher impact than the plastic version, and the
paper towel has the highest overall impact, so the virgin content alternative is used because it has a
lower impact than the recycled version.
Table 2 Hand drying systems generic names and specific products and data sources.
Hand Drying System Primary Source of Product Material and Performance Data
Hands‐under (HU) dryer Generic dryer in (Dettling 2009)
High‐speed hands‐under (HSHU) dryer Excel XLERATOR® dryer in (Dettling 2009)
High‐speed hands‐in (HSHI) dryer Dyson Airblade™ dryer with aluminum cover (Blower 2011)
Cotton roll towels (CRT) Generic cotton towel in (Eberle and Möller 2006)
Paper towels (PT) Kimberly‐Clark 100% virgin paper towel in (Madsen 2007)
Table 3 summarizes the assumptions made for the baseline scenario; detailed data for each hand‐drying
system can be found at the end of this section. Much of the data for product compositions and
manufacturing processes are derived from other LCA studies on the systems; when necessary,
assumptions are made in order to insure that the analyses are conducted on a consistent basis (e.g.,
production or use location). In particular, all products, with the exception of paper towels, are assumed
to be manufactured in China (see Figure 1), even though this is not necessarily the case for the dryers in
reality (e.g., the XLERATOR® dryer is produced in the US (Dettling 2009) and the Dyson Airblade™ hand
dryer is produced in Malaysia (Blower 2011)). The use of a consistent basis for manufacturing location
and transportation distances is motivated by an objective of the study to compare the influence of
different manufacturing and use scenarios of the different hand‐drying systems. This is only meaningful
if the supply chain scenarios are the same and plausible for similar products. China is a highly plausible
location for the production of hand dryers because it is a common location for the manufacturing of
technological products. Using a consistent basis enables a comparison among products that is focused
on product attributes including material composition, manufacturing process, and energy consumption,
and not on supply chain configuration (which is not known for all products). Paper towels are the
exception to this practice: this study assumes that the paper towels are produced and used in the US
because this is the industry standard for a product that is used in a location where the raw materials are
plentiful at a competitive price and the production is not labor‐intensive.
Bill of activities data sources and assumptions for all hand‐drying systems are detailed by life cycle stage.
The bill of activities data information is followed by a description of the life cycle inventory data used by
the unit processes.

7
Table 3 Assumptions used to generate hand‐drying system life cycle inventories for the baseline analysis.
Drying system Airblade™(high‐speed
hands‐in dryer)
XLERATOR®(high‐speed
hands‐under dryer)
Standard warm air dryer
Cotton roll towels Paper towels
Functional unit 1 pair of dry hands
Lifetime usage 350,000 pairs of dry hands over 5 years [26, 27]
Mass (+ manufacturing scrap) per dryer or towel
Al: 14.8 kg (1.43 kg)Pl: 9.9 kg (2.16 kg) [27]
9.4 kg (1.12 kg) [14] 6.4 kg (0.9 kg) [14] 16.2 g (2.2 g) [12] 1.98 g (0.08 g) [14]
Manufacturing location China China China China US
Manufacturing energy per dryer or towel
146 MJ electricity [27]
156 MJ electricity [14]
156 MJ electricity [14]
431 kJ electricity 507 kJ gas [12]
14.7 kJ electricity 24.4 kJ gas [14]
Use location US
Use intensity 12 sec @ 1,400 W + 0 sec @ 0 W + 439 sec @ 1 W
20 sec @ 1,500 W + 1.5 sec @ 750 W + 429 sec @ 1 W
31 sec @ 2,300 W + 1.5 sec @ 1,150 W + 406 sec @ 0.4 W
1 towel (pull) + laundry
2 towels
End‐of‐life scenario 76.7% of cardboard recycled 19% of remaining waste incinerated with energy recovery 81% of remaining waste landfilled with methane capture and conversion to electricity [30, 31]
Transportation Raw material to plant Plant to warehouse Warehouse to washroom Washroom to laundry and back Washroom to waste facility
250 km via truck 10,500 km via ocean freighter + 2,600 km via freight train + 24 km via truck (excl. paper towels) 1,760 km via truck 100 km via truck (cotton towels only) 100 km via truck
Additional lifecycles Packaging Packaging Packaging Packaging, dispenser Packaging, dispenser, waste bin, bin liners
Packaging per dryer or towel 2.94 kg cardboard [27]
0.27 kg cardboard [14]
0.45 kg cardboard [14]
0.08 g polyethylene 0.18 g cardboard [14]

8
2.1 Bill of Activities The bills of activities for each product system are included at the end of this section. They are combined
with unit process inventory data to construct drying system life cycle inventories. Most of these data
were obtained from critically reviewed LCAs dating from 2006 and later. With the exception of the
cotton roll towel bill of activities, data are at most 10 years old. Dyson supplied data for its Dyson
Airblade™ hand dryers (Blower 2011). Data for the XLERATOR® and standard dryers were taken from
the Excel study (Dettling 2009), which obtained its data directly from Excel Dryer, Inc and—in the case of
the standard dryer—from the Airdri streamlined LCA (Environmental Resources Management 2001).
Cotton roll towel data were obtained from the ETSA report (Eberle and Möller 2006); this study used
existing literature from the 1990s and 2000s for cotton roll towel production, but conducted its own
survey of laundries to develop a laundering process inventory. Finally, paper towel data were based on
a combination of the Excel (Dettling 2009), Kimberly‐Clark (Madsen 2007), and ETSA (Eberle and Möller
2006) studies. The Excel study also relied on the Kimberly‐Clark report for paper towel data, whereas
the ETSA study relied on a 2001 report on the best available techniques report in the pulp and paper
industry.
2.1.1 Production: materials and manufacturing
This analysis accounts for the impact of material production, including upstream impact starting from
ore extraction. Dryer materials are conservatively assumed to be manufactured from virgin content.
They are then transported 250 km from their respective production or storage facility to the
manufacturing plant where dryer or towel manufacturing takes place. Two hundred fifty kilometers was
chosen as an intermediate distance between the 750 km by road assumed in Airdri and Excel studies
(Dettling 2009; Environmental Resources Management 2001), and the 30 km used in prior Dyson
analyses (Blower 2011). With the exception of the paper towel systems, all materials production and
manufacturing takes place in China; consequently, the Chinese average grid mix, along with Chinese
emission factors when available, is assumed for the production of electricity. Paper towels, by contrast,
are assumed to be manufactured in the US and thus rely on the US grid. Once the products are finished,
they are then shipped to a distribution center in the US and from there to a washroom. All
transportation steps in this analysis are consolidated into a separate life cycle stage and summarized in a
following section.
Materials and manufacturing data for the aluminum and the plastic Dyson Airblade™ hand dryers were
provided by Dyson and are based on the firm’s analysis for its Carbon Reduction Label through the
Carbon Trust (Blower 2011). Melamine is assumed for the bulk molding compound. Materials data for
the dryers account for a 9.7% and a 22% scrap rate for the aluminum and plastic dryers, respectively,
which represents the worst‐case scenario for material loss. Capital equipment used in dryer
manufacture is not included (in accordance with the system boundaries).
Corresponding data for the XLERATOR®, the high‐speed hands‐under dryer, were based on the study
prepared for Excel Dryer (Dettling 2009). The Excel study uses a generic bill of activities that does not
represent any one XLERATOR® in Excel Dryer’s product line. Specifically, the report assumes that the

9
XLERATOR®’s cover is a combination of the dryer’s three available covers: stainless steel, plastic, and
chrome finish. This assumption is carried over into this study because no alternative data were available
for the individual covers. The same study is used to obtain production data for a standard warm air
dryer (which is, in turn, based on the Airdri B‐709 model from the Environmental Resources
Management study conducted for Airdri Ltd. and Bobrick Washroom Equipment (Environmental
Resources Management 2001)). For both dryers, polypropylene is assumed for unknown plastic types,
such as the “Plastic mixture” listed in the products’ bills of materials for the housing retainer and motor
plastics. The dryers also contain unspecified mass. This mass is accounted for when calculating
transportation stage impact, but is assumed to have no influence on production stage impact. Finally, a
15% scrap rate—around the average rate of the two Dyson Airblade™ hand dryers—is added to the
material input flows of both dryers in order to ensure an accurate comparison. Scrap values in Table 3,
however, are slightly less than 15% because the scrap rate was not applied to electronic components or
unspecified mass.
Production data for the cotton roll towels were obtained from the Okö‐Institut report for the European
Textile Services Association (Eberle and Möller 2006). The production of these towels includes
production of cotton fibers, spinning and sizing of the yarn, and weaving, de‐sizing, and bleaching of the
fabric. A 10% weight loss is assumed in the spinning process (Eberle and Möller 2006), plus a 2% loss in
weaving based on ecoinvent data (Frischknecht et al. 2007). Thus, it takes 18.4 grams of cotton fibers to
produce the 16.2 grams of cotton towel that represent one pull of the roll (Eberle and Möller 2006). The
dispenser used for the cotton towels is based on the paper towel dispenser in the Excel study, although
no batteries or circuitry associated with automatic paper towel dispensers are included since the towels
are presumably pulled by hand from the roll.
Paper towels manufactured from 100% virgin and from 100% recycled content are examined in this
analysis. The former is assumed to use pulp manufactured via the sulfate or kraft pulping process, the
dominant pulping process that accounts for 80% of the world’s pulp production, and bleached using
elemental chlorine free (ECF) technology, the most common bleaching process for sulfate pulp in the US
as of 2002. This pulp is then transported 250 km (a distance consistent with raw material transportation
distances for the hand dryers) from its respective facility to a non‐integrated manufacturing plant where
the paper towels are produced. Virgin paper towel manufacturing data were based on the Excel Dryer
(Dettling 2009), Kimberly‐Clark (Madsen 2007), and ETSA (Eberle and Möller 2006) studies.
Paper towels manufactured from recycled content were also assumed to be produced in a non‐
integrated plant. In such cases, market deinked pulp would be transported to this plant from its
respective manufacturing facility and used as a raw material in paper towel production. Bill of activities
and inventory data for deinked pulp manufactured from 100% recycled content, however, were
unavailable even among the critically reviewed LCA studies. The Kimberly‐Clark (Madsen 2007) report
provides an incomplete inventory, while the study by Excel (Dettling 2009) does not even account for
the environmental impact from pulp manufacturing (this is acknowledged in the report). Although the
ETSA (Eberle and Möller 2006) study provides an inventory for tissue manufacturing, this inventory is for
an integrated plant (where pulp and tissue are manufactured in a continuous process) and assumes only
50% recycled content.

10
Given the lack of available data, this study made simplifying assumptions for the deinked pulp
manufacturing process. Specifically, the impact associated with manufacturing deinked pulp was
assumed equal to that associated with manufacturing ECF‐bleached sulfate pulp. Wood in the sulfate
pulp process, however, was replaced with 1.5 kg of waste paper (Eberle and Möller 2006). This
substitution addresses key differences in raw material acquisition, but it may leave some processes in
the pulping step that are required only for virgin material production (such as wood chipping). While
these assumptions introduce uncertainty to the results (more so than the results of paper towels
manufactured from virgin content), the uncertainty cannot be quantified due to lack of actual inventory
data for paper towels. A more detailed study on recycled paper towels is recommended; since no such
study currently exists, paper towel results from this study were compared with results from the other
LCAs in the full report (Montalbo et al. 2011) to ensure this study’s assumptions were reasonable
In both cases, pulp and tissue were manufactured in the same country where the use stage takes place.
Additionally, this assumption is consistent with the Kimberly‐Clark study. Paper towels have a final
product mass of 1.98 g; a 3.85% manufacturing loss is accounted for in raw material requirements
(Dettling 2009; Madsen 2007). The manufacturing plant is also assumed to be is co‐located with a
distribution center, thus eliminating the need for transportation between manufacturing plant and
warehouse. This is a reasonable assumption because the impact of any transport between the plant and
the distribution center would be miniscule in comparison with the impact of transporting the hand
dryers and cotton roll towels over 13,000‐km from China to their respective distribution centers.
The results for the paper towels containing recycled content are presented using the cut‐off allocation
approach, which is detailed in the full report (Montalbo et al. 2011). This allocation scheme was
selected for the baseline analysis because it only accounts for the burdens directly associated with the
production and disposal of the recycled‐content towels. Paper towels are not recycled (same
assumption as the Kimberly‐Clark study (Madsen 2007)) and therefore represent the final product life
cycle in an open loop recycling system. Thus, following the cut‐off allocation scheme, paper towels
manufactured from 100% recycled content are assigned the full burden from recycling waste paper back
into pulp, and the full burden from end‐of‐life.
In addition to the towel life cycle, life cycles for a dispenser, waste bin, and bin liners are included in the
assessment of paper towel hand‐drying systems. The dispenser is the same as that used for the cotton
towels; the waste bin is assumed to be entirely composed of steel, and the bin liners from polyethylene.
2.1.2 Detailed Bills of Activities Data
Bill of activities data for each of the hand‐drying systems is detailed in Tables 4 and 5 below. The data
represent the materials and processes required to dry a single pair of hands—that is, one functional
unit. It should also be noted that within each life cycle stage, the data are consolidated by material or
process rather than by part.

11
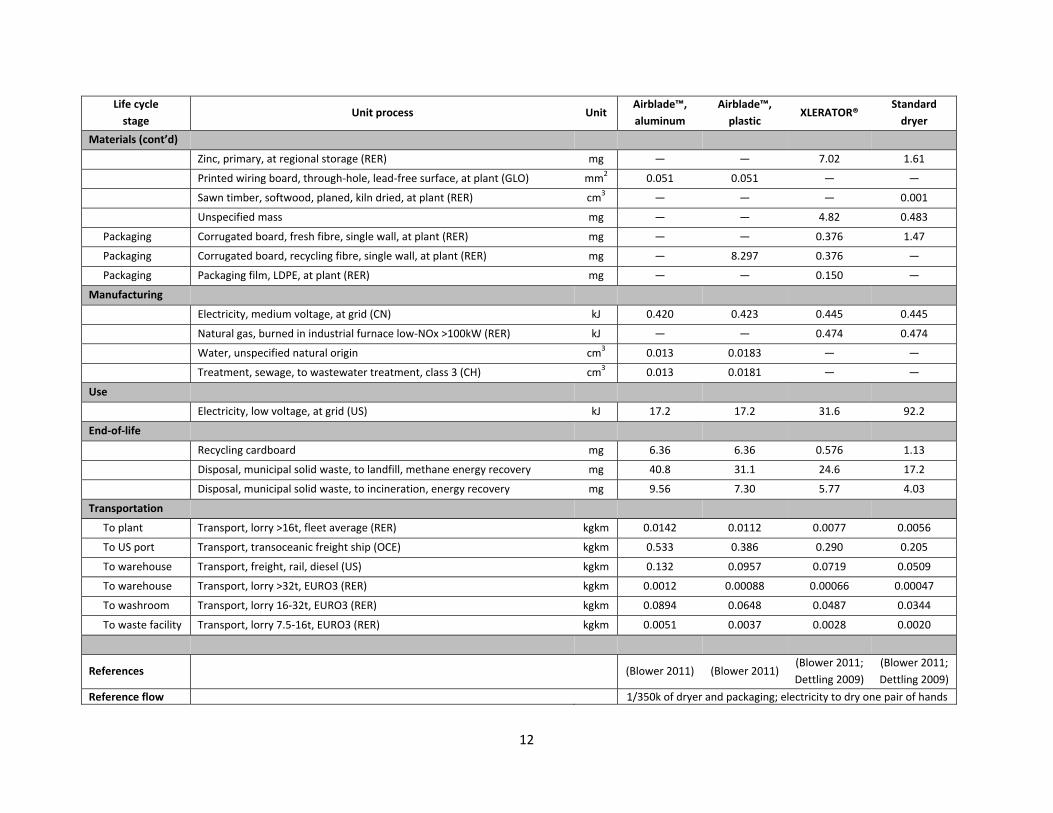
Table 4 Bill of activities data representing one functional unit of hand dryer systems.
Life cycle stage
Unit process Unit Airblade™, aluminum
Airblade™, plastic
XLERATOR® Standard dryer
Materials
Acrylonitrile‐butadiene‐styrene copolymer, ABS, at plant (RER) mg 0.302 0.302 1.62 0.405
Adhesive for metals, at plant (DE) mg 0.086 0.086 — —
Aluminium, primary, at plant (RER) mg 25.7 — — 2.797
Aluminium, secondary, from old scrap, at plant (RER) mg — — — 2.797
Ceramic tiles, at regional storage (CH) mg — — — 0.302
Chromium, at regional storage (RER) mg — — 0.016 —
Copper, primary, at refinery (RER) mg 0.029 0.029 0.966 0.767
Electronic component, active,nspecified, at plant (GLO) mg — — 0.669 0.669
Epoxy resin, liquid, at plant (RER) mg — — 0.025 —
Galvanized steel mg — — — 6.24
Glass fiber reinforced polypropylene mg 2.81 2.807 — —
Glass fibre reinforced plastic, polyamide, injection molding, at plant (RER) mg — — 4.01 —
Glass fibre, at plant (RER) mg 0.494 0.494 — —
Melamine, at plant (RER) mg 1.70 1.703 — —
Nickel, 99.5%, at plant (GLO) mg — — 0.0056 —
Nylon 6, at plant (RER) mg — — — 0.342
Paper, newsprint, at regional storage (RER) mg 0.483 0.483 — —
Plastic mixture with extrusion mg — — 1.25 —
Polycarbonate, at plant (RER) mg 0.464 9.401 — —
Polyethylene terephthalate, granulate, amorphous, at plant (RER) mg — — — 0.179
Polyethylene, LDPE, granulate, at plant (RER) mg 0.459 0.459 — —
Polypropylene, granulate, at plant (RER) mg 3.24 3.239 — —
Polystyrene, general purpose, GPPS, at plant (RER) mg 1.89 1.89 — —
Polyurethane, rigid foam, at plant (RER) mg 0.063 0.063 — —
Polyvinylchloride, at regional storage (RER) mg 0.493 0.493 — —
Stainless steel sheet mg 6.14 11.03 — —
Steel, converter, chromium steel 18/8, at plant (RER) mg 1.31 1.309 9.67 3.80
Synthetic rubber, at plant (RER) mg 2.05 2.050 — —
12
Life cycle
stage Unit process Unit
Airblade™,
aluminum
Airblade™,
plastic XLERATOR®
Standard
dryer
Materials (cont’d)
Zinc, primary, at regional storage (RER) mg — — 7.02 1.61
Printed wiring board, through‐hole, lead‐free surface, at plant (GLO) mm2 0.051 0.051 — —
Sawn timber, softwood, planed, kiln dried, at plant (RER) cm3 — — — 0.001
Unspecified mass mg — — 4.82 0.483
Packaging Corrugated board, fresh fibre, single wall, at plant (RER) mg — — 0.376 1.47
Packaging Corrugated board, recycling fibre, single wall, at plant (RER) mg — 8.297 0.376 —
Packaging Packaging film, LDPE, at plant (RER) mg — — 0.150 —
Manufacturing
Electricity, medium voltage, at grid (CN) kJ 0.420 0.423 0.445 0.445
Natural gas, burned in industrial furnace low‐NOx >100kW (RER) kJ — — 0.474 0.474
Water, unspecified natural origin cm3 0.013 0.0183 — —
Treatment, sewage, to wastewater treatment, class 3 (CH) cm3 0.013 0.0181 — —
Use
Electricity, low voltage, at grid (US) kJ 17.2 17.2 31.6 92.2
End‐of‐life
Recycling cardboard mg 6.36 6.36 0.576 1.13
Disposal, municipal solid waste, to landfill, methane energy recovery mg 40.8 31.1 24.6 17.2
Disposal, municipal solid waste, to incineration, energy recovery mg 9.56 7.30 5.77 4.03
Transportation
To plant Transport, lorry >16t, fleet average (RER) kgkm 0.0142 0.0112 0.0077 0.0056
To US port Transport, transoceanic freight ship (OCE) kgkm 0.533 0.386 0.290 0.205
To warehouse Transport, freight, rail, diesel (US) kgkm 0.132 0.0957 0.0719 0.0509
To warehouse Transport, lorry >32t, EURO3 (RER) kgkm 0.0012 0.00088 0.00066 0.00047
To washroom Transport, lorry 16‐32t, EURO3 (RER) kgkm 0.0894 0.0648 0.0487 0.0344
To waste facility Transport, lorry 7.5‐16t, EURO3 (RER) kgkm 0.0051 0.0037 0.0028 0.0020
References (Blower 2011) (Blower 2011) (Blower 2011;
Dettling 2009)
(Blower 2011;
Dettling 2009)
Reference flow 1/350k of dryer and packaging; electricity to dry one pair of hands

13
Table 5 Bill of activities data representing one functional unit of towel systems.
Life cycle stage
Unit process Unit Cotton roll towels
Paper towels Dispenser Waste bin and liners
Materials
Copper, primary, at refinery (RER) mg — — 0.483 —
Cotton fibres, ginned, at farm (CN) mg 178 — — —
Polyethylene, LDPE, granulate, at plant (RER) mg — — — 126
Polypropylene, granulate, at plant (RER) mg — — 9.13 —
Steel, converter, chromium steel 18/8, at plant (RER) mg — — 0.483 20.4
Sulphate pulp, ECF bleached, at plant (RER) mg — 4,112 — —
Pulp from waste paper mg — (4,112)a — —
Packaging Corrugated board, fresh fibre, single wall, at plant (RER) mg — 414 0.648 10.1
Packaging Packaging film, LDPE, at plant (RER) mg 90.2 — — —
Manufacturing
Electricity, medium voltage, at grid (CN) kJ — — 0.445 —
Electricity, low voltage, at grid (US) kJ — 29.4 — —
Natural gas, burned in industrial furnace low‐NOx >100kW (RER) kJ — 48.7 0.474 —
Water,nspecified natural origin L — 0.212 — —
Treatment, sewage, to wastewater treatment, class 3 (CH) L — 0.212 — —
Extrusion, plastic film (RER) mg — — — 126
Extrusion, plastic pipes (RER) mg — — 7.98 —
Spinning cotton fiber mg 160 — — —
Sizing mg 160 — — —
Weaving mg 157 — — —
De‐sizing / scouring / bleaching mg 157 — — —
Use
Laundering g 16.2 — — —
End‐of‐life
Recycling cardboard mg — 317 0.496 7.75
Disposal, municipal solid waste, to landfill, methane energy recovery mg 218 3,410 8.30 120
Disposal, municipal solid waste, to incineration, energy recovery mg 51.0 800 1.95 28.2

14
Life cycle stage
Unit process Unit Cotton roll towels
Paper towels Dispenser Waste bin and liners
Transportation
To plant Transport, lorry >16t, fleet average (RER) kgkm 0.0671 1.13 0.0027 0.039
To US port Transport, transoceanic freight ship (OCE) kgkm 1.65 — 0.098 1.57
To warehouse Transport, freight, rail, diesel (US) kgkm 0.409 — 0.0243 0.388
To warehouse Transport, lorry >32t, EURO3 (RER) kgkm 0.0038 — 0.00022 0.0036
To washroom Transport, lorry 16‐32t, EURO3 (RER) kgkm 0.277 7.60 0.0164 0.262
To laundry Transport, lorry 3.5‐7.5t, EURO3 (RER) kgkm 1.62 — — —
To waste facility Transport, lorry 7.5‐16t, EURO3 (RER) kgkm 0.024 0.432 0.00093 0.015
References (Eberle and
Möller 2006)
(Dettling
2009; Eberle
and Möller
2006; Madsen
2007)
(Dettling
2009)
(Dettling
2009;
Environmental
Resources
Management
2001)
Reference flow
1/103 of one towel pull and packaging, plus laundry
2 paper towels
1/350,000 of dispenser and packaging
1/350,000 of waste bin & pkging, plus 1/270 of bin liner & pkging
(a) Parentheses indicate masses associated with paper towels manufactured from 100% recycled content (assuming cut‐off allocation of that content).

15
2.1.3 Use
Ideally, bill of activities data for the use phase would include details of washroom visitor usage patterns
for each hand‐drying system—how long they spent operating each dryer or how many towels they used
after washing hands. Such data would also cover the significant variation in the way people dry their
hands due to differences in hand sizes, in preferences about acceptable dryness, and in willingness to
spend time drying hands. However, the reality is that there are no existing data sources capturing this
wide variation, nor is there a common method for determining hand dryness across all the different
drying systems. While this study has not attempted to address this gap, the authors have nonetheless
made every effort to characterize drying system use intensity using the best available data and a
consistent basis for comparison.
Use intensity represents the amount of resources each hand‐drying system requires to dry a pair of
hands. For hand dryers, this is related to the time users spend operating the dryers. Hand dryer dry
times have been incorporated into the study in two ways: (1) measured according to a standard that
defines when hands are dry and (2) reported by dryer manufacturers (Table 6). To ensure a consistent,
scientific basis when comparing hand dryers, this study adopts measured dry times as its primary
baseline. These times were measured according to the NSF Protocol P335 (NSF 2007), which defines
hygienically dry hands has having less than 0.1 grams of moisture remaining after drying. NSF protocol
measurements were performed by Dyson. Manufacturer‐reported dry times are used as a secondary
baseline for some analyses. These reported dry times were obtained from dryer specifications taken
from manufacturers’ websites. Neither Excel Dryer nor the standard dryer manufacturers, however,
provide documentation on how they arrived at their dryers’ respective dry times or what their basis was
for dryness.
Variation in use intensity is also evaluated in order to assess the consequences of differing user
preferences and thus, differing usage patterns. For instance, users may prefer to hold their hands in the
air stream until a desired dryness is achieved—referred to as drying‐driven usage in this report. The dry
times for drying‐driven usage are defined as 50% below to 25% above the measured baseline dry times
(as defined by the NSF Protocol P335). Alternatively, users may prefer to wait the same length of time
for their hands to dry, regardless of dryer type, before leaving—referred to as time‐driven usage. Both
drying‐ and time‐driven usage patterns are assessed in the uncertainty analysis.
Table 6 Measured and reported dry times for hand dryers.
Dryer Measured
NSF P335 for US Reported
Airblade™ 12 sec (Blower 2011) 12 sec (Dyson)
XLERATOR® 20 sec (Blower 2011) 12 sec (Dettling
2009)
Standard dryer 31 sec (Blower 2011)
30 sec (Environmental
Resources Management 2001)

16
Once dry time is determined, it is then multiplied by the dryer’s in‐use rated power to arrive at the
energy consumed during operation. In‐use energy consumption, though, is only part of a dryer’s total
energy requirement as dryers also consume energy even when not actively drying hands. In addition to
dry time, both the XLERATOR® and the standard dryers are assumed to have a 1.5‐second spin‐down
time at half power (Dettling 2009); the Dyson Airblade™ hand dryer, by contrast, uses a digital motor
and does not consume power during spin‐down (Dyson). All dryers are also assumed to have sensors
that require energy when in standby mode. The XLERATOR® is assumed to have the same 1‐W standby
power consumption as the Dyson Airblade™ hand dryer (Dyson), whereas the standard dryer is lower at
0.4‐W. Time spent on standby is calculated by subtracting the total use and spin‐down time for 350,000
pairs of hands from the total time in the 5‐year dryer life span. This total standby time is then
normalized by the 350,000 uses and multiplied by standby power rating. From here, spin‐down and
standby energy consumptions are added to a dryer’s in‐use energy consumption to arrive at the total
energy allocated to drying a pair of hands. The US average electric grid mix is used when assessing the
environmental impact of this energy. Table 7 summarizes dryer power consumption, along with spin‐
down and standby times; additional details for calculating dryer energy consumption can be found in
Appendix A.1.1 of the full report (Montalbo et al. 2011).
Table 7 Dryer power consumption during use, spin‐down, and standby.
In‐use Spin‐down Standby
Power Time Power Power Time
Airblade™ 1,400 W (Dyson)
0 sec 0 W (Blower
2011) 1 W (Dyson) 439 sec
XLERATOR® 1,500 W
(Excel Dryer)
1.5 sec (Dettling 2009)
750 W (Dettling 2009)
1 W 429 sec
Standard dryer 2,300 W (Blower 2011)
1.5 sec (Dettling 2009)
1,150 W 0.4 W 418 sec
The use intensity of the cotton roll towel drying system is represented by one pull on a cotton towel roll
per functional unit, equal to the ETSA study’s assumption (Eberle and Möller 2006). While the in‐
washroom use of cotton roll towels does not have an impact, laundering the towels does. The
laundering process is also based on the ETSA study (Eberle and Möller 2006). Used towels are
transported 50 km from the washroom to the laundry, where they are washed and thermally disinfected
before being packaged in plastic film and returned to the washroom.
Unlike the hand dryers, there is no equivalent protocol for determining the number of paper towels
required to achieve a specific level of dryness. Thus, the paper towel baseline assumes a use intensity of
two towels per functional unit based on observational data from a University of Florida study (Archibald
and Jarvis 2011). As part of the UF study, researchers observed the length of time public washroom
users washed their hands and the number of paper towels they took to dry their hands. Paper towel
usage varied between one and seven towels, with an average of 2.1 towels per user. It should be noted

17
that the two‐paper towel use intensity assumption is consistent with several other LCA studies, a
noteworthy exception being the Kimberly‐Clark Study, which assumes 1.5 paper towels. However, none
of the studies provides any rigorous justification for the number of paper towels used, including
Kimberly‐Clark. Thus, the data from the UF study is used as the basis for the number of paper towels in
this study. Another consideration is that the exact number of paper towels will likely depend on towel
mass, which varies among the different studies surveyed. Both use intensity and towel mass are
explored in the uncertainty analysis presented in the main paper. Since paper towels, packaging,
dispensers, the waste bin, and bin liners do not require any energy during use, they therefore have to
impact in this stage.
2.1.4 End‐of‐life
Once the hand dryers or towels are no longer in use, the products are transported 100 km to a waste
facility, consistent with (Blower 2011), and disposed according to US average waste and recycling
fractions from 2008 as determined by the US EPA. Thus, 76.7% of cardboard packaging is recovered for
recycling; each kilogram of cardboard is assumed to displace 0.78 kg of new cardboard (estimated based
on (Eberle and Möller 2006)). Nineteen percent of the remaining cardboard and all other waste is
incinerated, with the remaining 81% sent to the landfill.
Both energy recovery from incineration and methane capture from landfill emissions are considered in
the baseline scenario. Incineration energy recovery is assumed to produce 0.65 kWh of electricity per
kilogram of waste incinerated. Since this 0.65‐kWh represents the avoided production of electricity,
each drying system is credited with 0.632 g CO2 eq per kilogram of waste incinerated—the emissions
associated with producing 0.65 kWh of electricity given the US average grid mix. Methane captured
from landfill emissions is also assumed to be burned with energy recovery to produce electricity.
Additional details and references for this process can be found in the details about the modified unit
process data in the following section.
Aside from the recycling of cardboard packaging, no other recycling is assumed to take place. While
hand dryers can be recycled (and indeed are required to be recycled in Europe per the waste electrical
and electronic equipment directive), there is no clear evidence that this is common practice in the US.
Paper towel recycling is also possible, as noted by Kimberly‐Clark, although their LCA study (Madsen
2007) assumes that the paper towels are not recovered after disposal. Like the hand dryers, there is no
strong evidence that recycling paper towels is common practice in the US; composting, however, is
gaining ground and is thus addressed in the uncertainty analysis. Cotton towels are not recycled, but
can potentially be reused as industrial cleaning cloths (Eberle and Möller 2006).
2.1.5 Transportation
Transportation takes place between each of the life cycle stages. Distances are either taken from
literature, or estimated according to production, use, and end‐of‐life locations. Table 8 lists the distance
and vehicle type for each transportation step. Vehicle types are chosen to match as closely as possible
to those used in (Blower 2011; Eberle and Möller 2006). Some steps are not included in the paper towel
life cycle because the towels are assumed to be manufactured in the same country where they are used

18
and have a manufacturing facility co‐located with their warehouse. Cotton roll towels have the
additional step of being transported to and from the laundry.
Table 8 Transportation vehicles and distances for all products (unless noted otherwise).
What To where Distance Vehicle Notes
Raw materials Manufacturing
plant 250 km >16t truck
Finished product Long Beach port 10,500 km Ocean freighter Excluding paper
towels
Finished product Warehouse 2,600 km 24 kma
Freight train >32t truck
Excluding paper towels
Finished product Washroom 1,760 kmb >32t truck
Dirty / clean towels Laundry & back 100 km (Eberle and Möller 2006)
3.5‐7.5t truck Cotton towels
only
Used product Waste facility 100 km (Blower
2011) 7.5‐16t truck
(a) Estimated using (Blower 2011) and Google Maps.
(b) Estimated by averaging driving distances from Kansas City, KS to New York, NY; Los Angeles, CA; and Chicago, IL using
Google Maps.
2.2 Unit process inventory data In addition to the bill of activities data, unit process inventory data are also necessary to generate a life
cycle inventory. A unit process is the smallest element considered in the life cycle inventory analysis for
which input and output data are quantified (International Organisation for Standardisation 2006). The
inputs and outputs can be in terms of other unit processes (e.g., electricity or steel production) or basic
substances (e.g., minerals or gaseous emissions). These unit inventories are typically obtained from
databases such as ecoinvent (Frischknecht et al. 2007) and USLCI (The Athena Institute and the National
Renewable Energy Laboratory 2010).
Whenever possible, the unit process inventory data for the life cycle inventories are taken from the
ecoinvent Database v2.1 (Frischknecht et al. 2007). The majority of ecoinvent unit processes are used
without modification. Consequently, they represent the database’s default assumptions such as the
inclusion of capital equipment for raw materials production, a mixture of country‐specific emissions
factors for a single country’s electricity production owing to data availability limitations, and the use of
European fuels and emissions factors for road transportation. In a few cases, though, ecoinvent process
data is modified or data is adopted from external sources because of a lack of existing inventory data.
These cases are summarized below and the tables that follow provide further details. Also, a generic
ecoinvent unit process, “Electronic component, active, unspecified,” the same unit process as in the
Excel study (Dettling 2009), is used for the XLERATOR and standard dryer electronic components
because specific information is not available for these components.
Modified unit processes include:

19
Galvanized steel (Table 10) – The quantity of the “zinc coating” required was estimated by
calculating the area of a 0.7‐mm thick square of steel weighing one kilogram. Given that the
zinc remaining on the steel is approximately 45 mm, it adds less than 12 g to overall mass and is
therefore not counted in the process.
Stainless steel sheet (Table 11) – This process assumes stainless steel is rolled into sheets and
that there are no losses from rolling.
Plastic mixture with extrusion (Table 12) – Because of lack of specific data in the Excel study, this
process was created to provide a generic plastic process for the XLERATOR and standard dryers.
It also assumes there are no losses from processing.
Glass fiber reinforced polypropylene (Table 13) – This process was created specifically for the
Dyson Airblade™ hand dryers; it assumes the same amount of electricity consumption as the
PC/ABS process (Table 14).
Polycarbonate / Acrylonitrile‐butadiene‐styrene (Table 14) – Process data were obtained from
Dyson and assume a 3% material loss.
Cotton towel production and laundering (Tables 15 – 19) – Process data were obtained from the
ETSA study.
Pulp from waste paper (Table 20) – This process makes the assumption that the input and
output flows from manufacturing pulp from waste paper are equal to those of manufacturing
ECF‐bleached sulfate pulp from virgin wood. The only exception is that instead of wood, waste
paper is used. Only a partial inventory is shown because the unit process is adopted from the
ecoinvent unit process for ECF‐bleached sulfate pulp.
Cardboard recycling (Table 21) – The avoided production of cardboard is calculated assuming
each kilogram of recycled paper still requires 0.22 kg of virgin fibers.
Incineration with energy recovery (Table 22) – The ecoinvent process for municipal solid waste
incineration (Disposal, municipal solid waste, 22.9% water, to municipal incineration/CH U) is
modified to include the avoided production of 0.65 kWh of electricity per kilogram of waste
incinerated. This electricity is assumed to replace electricity production on the US average grid
mix, thus leading to the avoided emissions of 0.632 g CO2 eq per kilogram of waste incinerated.
These emissions from the avoided production of electricity are credited to the drying systems.
Table 22 only includes a subset of process inputs and emissions; flows not included are the same
as those in the unmodified ecoinvent process.
Landfill with methane capture (Table 23) – The ecoinvent process for municipal solid waste
landfill (Disposal, municipal solid waste, 22.9% water, to sanitary landfill/CH U) is modified to
account for methane capture of landfill emissions and the subsequent combustion of such
emissions with energy recovery to produce electricity. Seventy‐five percent of methane

20
emissions—from both biogenic and fossil sources—are captured for a total of 16.2 g of methane
per kilogram of waste. These captured emissions are burned and completely converted to
carbon dioxide, which is released into the atmosphere (4.43 g CO2 per kilogram of waste). Heat
from the combustion reaction is recovered (the lower heating value of methane, 802 kJ / kg CH4,
is assumed) and used to produce electricity. Given an efficiency of 11,600 MJ per kWh, 251 J
(6.97 × 10‐5 kWh) of electricity is generated and assumed to replace production on the US
average grid. All emissions from the avoided production of electricity are credited to the drying
systems. Table 23 only includes a subset of process inputs and emissions; flows not included are
the same as those in the unmodified ecoinvent process.
Composting (Table 24) – Composting towels in place of sending them to a landfill or incinerator
is analyzed in the uncertainty analysis. This process assumes that the compost generated allows
the avoided production of fertilizer, the mass of which is calculated based on data from
ecoinvent and a European Commission study on biodegradable municipal waste. Calculation
results are shown in Table 9. These results assume that 1 kg dry matter displaces 18.9 g N, 4.86
g P2O5, and 11.7 g K2O over 10 years, and that 1 kg of biodegradable waste yields 350 g compost,
which contains 60% dry matter. Nutrient displacement values represent data for an average
compost, which includes some fraction of kitchen scraps and yard waste, because no data is
available for paper‐ or cotton‐only compost. Fertilizer types are selected based on usage data
from the USDA Economic Research Service and weight fractions of nutrients in each fertilizer are
taken from ecoinvent documentation. The calculated mass of displaced urea‐ammonium nitrate
accounts for the presence of nitrogen in monoammonium phosphate, the phosphorus fertilizer.
Table 9 Avoided fertilizer production assumptions for compost end‐of‐life scenario.
Nutrient Mass
displaced per kg dry matter
Mass displaced per kg compost
Mass displaced per kg waste
Fertilizer Nutrient weight %
Fertilizer displaced per kg waste
Nitrogen 18.9 g 11.3 g 3.95 g
Urea‐ammonium nitrate
32% 11.7 g
Monoammonium phosphate
11% —
Phosphorus 4.9 g 2.9 g 1.02 g Monoammonium
phosphate 52% 2.0 g
Potassium 11.7 g 7.0 g 2.45 g Potassium chloride
60% 4.1 g
Table 10 Unit process for galvanized steel.
Unit Process: Galvanized steel
Inputs Outputs
Name Amount Unit Name Amount Unit
Chromium steel (RER) 1 kg Galvanized steel 1 kg
Zinc coating (RER) 0.1815 m2

21
Table 11 Unit process for stainless steel sheet.
Unit Process: Stainless steel sheet
Inputs Outputs
Name Amount Unit Name Amount Unit
Chromium steel (RER) 1 kg Sheet steel 1 kg
Sheet rolling (RER) 1 kg
Table 12 Unit process for plastic mixture with extrusion.
Unit Process: Plastic mixture with extrusion
Inputs Outputs
Name Amount Unit Name Amount Unit
Polypropylene (RER) 1 kg Plastic mixture with extrusion 1 kg
Extrusion (RER) 1 kg
Table 13 Unit process for glass fiber reinforced polypropylene.
Unit Process: Glass fiber reinforced polypropylene
Inputs Outputs
Name Amount Unit Name Amount Unit
Glass fiber (RER) 0.3 kg Glass fiber reinforced PP 1 kg
Polypropylene (RER) 0.7 kg
Electricity (CN) 0.3 kWh
Table 14 Unit process for polycarbonate / acrylonitrile‐butadiene‐styrene.
Unit Process: Polycarbonate / Acrylonitrile‐butadiene‐styrene (Blower 2011)
Inputs Outputs
Name Amount Unit Name Amount Unit
Polycarbonate (RER) 0.721 kg PC/ABS 1 kg
ABS copolymer (RER) 0.309 kg
Electricity (CN) 0.3 kWh
Table 15 Unit process for spinning (cotton towels).
Unit Process: Spinning cotton fiber (Eberle and Möller 2006)
Inputs Outputs
Name Amount Unit Name Amount Unit
Electricity (CN) 7.67 MJ Spun cotton fiber 1 kg
Natural gas (RER) 2.5 MJ

22
Table 16 Unit process for sizing (cotton towels).
Unit Process: Sizing (Eberle and Möller 2006)
Inputs Outputs
Name Amount Unit Name Amount Unit
Starch (DE) 0.1 kg Sized fiber 1 kg
Table 17 Unit process for weaving (cotton towels).
Unit Process: Weaving (Eberle and Möller 2006)
Inputs Outputs
Name Amount Unit Name Amount Unit
Electricity (CN) 15.2 MJ Woven cotton towel 1 kg
Natural gas (RER) 13.9 MJ
Table 18 Unit process for de‐sizing, scouring, and bleaching (cotton towels).
Unit Process: De‐sizing / scouring / bleaching (Eberle and Möller 2006)
Inputs Outputs
Name Amount Unit Name Amount Unit
Water 0.162 m3 Bleached cotton towel 1 kg
Hydrogen peroxide (RER) 0.45 kg
Sodium hydroxide (RER) 0.055 kg To water
Electricity (CN) 3.6 MJ Ammonium 1.6 g
Natural gas (RER) 14.9 MJ Nitrogen 2.9 g
Phosphorus 0.24 g
Sewage (CH) 0.162 m3
Table 19 Unit process for laundering (cotton towels).
Unit Process: Laundering
Inputs Outputs
Name Amount Unit Name Amount Unit
Water 9.4 L Washed cotton towel 1 kg
Soap (RER) 26.1 g
Electricity (US) 0.1 kWh Sewage (CH) 9.4 L
Natural gas (RER) 4.1 MJ

23
Table 20 Partial unit process inventory for producing pulp from waste paper.
Unit Process: Pulp from waste paper
Inputs Outputs
Name Amount Unit Name Amount Unit
Water 0.074 m3 Bleached sulfate pulp 1 kg
Waste paper (RER) 1.5 kg
Quicklime (CH) 0.0084 kg To air
Carbon dioxide liquid (RER) 0.001 kg Heat, waste 5.26 MJ
Hydrogen peroxide (RER) 0.0054 kg Carbon dioxide, biogenic 2.21 kg
Sulfuric acid (RER) 0.0301 kg «Same as ecoinvent process»
…
To water
«Same as ecoinvent process»
Disposal, hazardous waste (DE) 0.00026 kg
«Same as ecoinvent process»
Table 21 Unit process for cardboard recycling.
Unit Process: Cardboard recycling
Inputs Outputs
Name Amount Unit Name Amount Unit
Corrugated board (RER) 1 kg Corrugated board 1 kg
Avoided production
Corrugated board (RER) 0.78 kg
Table 22 Unit process for incineration with energy recovery.
Unit Process: Incineration with energy recovery
Inputs Outputs
Name Amount Unit Name Amount Unit
Municipal solid waste 1 kg Emissions
«Same as ecoinvent process»
Additional inputs
«Same as ecoinvent process»
Avoided production
Electricity (US) 0.65 kWh

24
Table 23 Unit process for landfill with methane capture and energy recovery.
Unit Process: Landfill with methane capture and energy recovery
Inputs Outputs
Name Amount Unit Name Amount Unit
Municipal solid waste 1 kg To air
Carbon dioxide, biogenic 182 g
Avoided production Carbon dioxide, fossil 8.30 g
Electricity (US) 251 J Methane, biogenic 5.15 g
Methane, fossil 0.236 g
Additional inputs
«Same as ecoinvent process» Additional emissions
«Same as ecoinvent process»
Table 24 Unit process for composting as a waste treatment option.
Unit Process: Compost (waste treatment)
Inputs Outputs
Name Amount Unit Name Amount Unit
Biodegradable waste 1 kg Compost 0.35 kg
Diesel (RER) 0.291 g
Electricity (US) 0.0175 kWh To air
Ammonia 130 mg
Avoided product Carbon dioxide 124 G
Urea ammonium nitrate 11.7 g Carbon monoxide 9.29 mg
Monoammonium phosphate 2.0 g Hydrocarbons, unspecified 3.81 mg
Potassium chloride 4.1 g Hydrogen chloride 0.013 mg
Hydrogen fluoride 0.013 mg
Methane 344 mg
Nitrogen oxides 15.73 mg
Particulates 0.897 mg
Sulfur oxides 3.54 mg
VOC 8.4 mg
To water
BOD 0.013 mg
COD 0.013 mg
TOC 0.145 mg
Chlorine 0.013 mg
Fluorine 0.013 mg
Metallic ions 0.013 mg
Phenol 0.013 mg
Suspended solids 0.013 mg

25
3 Pedigree Matrix Scores for Parameter Uncertainty Analysis A pedigree matrix approach (Frischknecht et al. 2007) has been employed to translate qualitative
assessments of the appropriateness of data sources into quantifiable uncertainty calculations. As part of
this method, the bill of activities data sources are first evaluated based on six characteristics: reliability,
completeness, temporal correlation, geographic correlation, further technological correlation, and
sample size. One of five quality levels that describe the degree of uncertainty is chosen for each of the
characteristics based on descriptions found in (Frischknecht et al. 2007). These quality levels are, in
turn, each associated with an uncertainty factor that quantifies their uncertainty (Table 25). Lower
quality level values represent higher confidence in the data and thus translate to smaller uncertainty
factors. A seventh “basic uncertainty factor” is also added according to whether the process represents
an input or output to the technosphere or emissions. Finally, uncertainty factors are used to calculate
the geometric standard deviation (SDg) of the bill of activities data using the following equation:
272
62
52
42
32
22
1 lnlnlnlnlnlnln UUUUUUUg eSD
Ux represent the uncertainty factors of the six characteristics plus the basic uncertainty factor.
The pedigree matrix approach is applied to each element in the bill of activities and the resulting
geometric standard deviations entered into SimaPro, where they are used to scale the distribution
means (represented by the baseline unit process quantities). A Monte Carlo simulation is then run to
assess the consequences of data source quality on environmental impact.
Table 25 Pedigree matrix uncertainty factors (Frischknecht et al. 2007).
Quality Level 1 2 3 4 5
Reliability 1.00 1.05 1.10 1.20 1.50
Completeness 1.00 1.02 1.05 1.10 1.20
Temporal correlation 1.00 1.03 1.10 1.20 1.50
Geographical correlation 1.00 1.01 1.02 — 1.10
Further technological correlation 1.00 — 1.20 1.50 2.00
Sample size 1.00 1.02 1.05 1.10 1.20
The specific pedigree matrix scores assigned to the unit processes used in the analysis are outlined in
Table 26.

26
Table 26 Unit process quality levels used in pedigree matrix analysis. Quality levels shown in order for reliability, completeness, temporal correlation, geographic correlation, further technological correlation, and sample size; basic uncertainty factors are also included.
Airblade™ XLERATOR®, standard dryer,
paper towels Cotton roll towels
Unit process Quality levels GSD Quality levels GSD Quality levels GSD
Materials
Acrylonitrile‐butadiene‐styrene copolymer, ABS, at plant 1, 1, 3, 1, 1, 5, 1.05 1.235 2, 3, 3, 1, 1, 5, 1.05 1.249 — —
Adhesive for metals, at plant 1, 1, 3, 1, 3, 5, 1.05 1.322 — — — —
Aluminium, primary, at plant 1, 1, 3, 1, 1, 5, 1.05 1.235 2, 3, 3, 1, 1, 5, 1.05 1.249 — —
Aluminium, secondary, from old scrap, at plant — — 2, 3, 3, 1, 1, 5, 1.05 1.249 — —
Ceramic tiles, at regional storage — — 2, 3, 3, 1, 3, 5, 1.05 1.333 — —
Chromium, at regional storage — — 2, 3, 3, 1, 1, 5, 1.05 1.249 — —
Copper, primary, at refinery 1, 1, 3, 1, 1, 5, 1.05 1.235 2, 3, 3, 1, 1, 5, 1.05 1.249 2, 3, 3, 1, 1, 5, 1.05 1.249
Cotton fibres, ginned, at farm (China) — — — — 2, 3, 3, 1, 1, 5, 1.05 1.249
Electronic component, active, unspecified, at plant — — 2, 3, 3, 1, 3, 5, 1.05 1.333 — —
Epoxy resin, liquid, at plant — — 2, 3, 3, 1, 1, 5, 1.05 1.249 — —
Galvanized steel — — 2, 3, 3, 1, 1, 5, 1.05 1.249 — —
Glass fiber reinforced polypropylene 1, 1, 3, 1, 1, 5, 1.05 1.235 — — — —
Glass fibre reinforced plastic, polyamide, injection moulding, at plant — — 2, 3, 3, 1, 1, 5, 1.05 1.249 — —
Glass fibre, at plant 1, 1, 3, 1, 1, 5, 1.05 1.235 — — — —
Melamine, at plant 1, 1, 3, 1, 3, 5, 1.05 1.322 — — — —
Nickel, 99.5%, at plant — — 2, 3, 3, 1, 1, 5, 1.05 1.249 — —
Nylon 6, at plant — — 2, 3, 3, 1, 1, 5, 1.05 1.249 — —
Paper, newsprint, at regional storage 1, 1, 3, 1, 1, 5, 1.05 1.235 — — — —
Plastic mixture with extrusion — — 2, 3, 3, 1, 3, 5, 1.05 1.333 — —
Polycarbonate / Acrylonitrile‐butadiene‐styrene 1, 1, 3, 1, 1, 5, 1.05 1.235 — — — —
Polyethylene, LDPE, granulate, at plant — — 2, 3, 3, 1, 1, 5, 1.05 1.249 — —
Polyethylene terephthalate, granulate, amorphous, at plant 1, 1, 3, 1, 1, 5, 1.05 1.235 — — — —
Polypropylene, granulate, at plant 1, 1, 3, 1, 1, 5, 1.05 1.235 2, 3, 3, 1, 1, 5, 1.05 1.249 2, 3, 3, 1, 1, 5, 1.05 1.249
Polystyrene, general purpose, GPPS, at plant 1, 1, 3, 1, 1, 5, 1.05 1.235 — — — —
Polyurethane, rigid foam, at plant 1, 1, 3, 1, 1, 5, 1.05 1.235 — — — —

27
Airblade™ XLERATOR®, standard dryer,
paper towels Cotton roll towels
Unit process Quality levels GSD Quality levels GSD Quality levels GSD
Materials (cont’d)
Polyvinylchloride, at regional storage 1, 1, 3, 1, 1, 5, 1.05 1.235 — — — —
Stainless steel sheet 1, 1, 3, 1, 1, 5, 1.05 1.235 — — — —
Steel, converter, chromium steel 18/8, at plant 1, 1, 3, 1, 1, 5, 1.05 1.235 2, 3, 3, 1, 1, 5, 1.05 1.249 2, 3, 3, 1, 1, 5, 1.05 1.249
Sulphate pulp, ECF bleached, at plant — — 2, 3, 3, 1, 1, 5, 1.05 1.249 — —
Pulp from waste paper — — 2, 3, 3, 1, 1, 5, 1.05 1.249 — —
Synthetic rubber, at plant 1, 1, 3, 1, 1, 5, 1.05 1.235 — — — —
Zinc, primary, at regional storage — — 2, 3, 3, 1, 1, 5, 1.05 1.249 — —
Printed wiring board, through‐hole, lead‐free surface, at plant 1, 1, 3, 1, 1, 5, 1.05 1.235 — — — —
Sawn timber, softwood, planed, kiln dried, at plant — — 2, 3, 3, 1, 1, 5, 1.05 1.249 — —
Corrugated board, fresh fibre, single wall, at plant — — 2, 3, 3, 1, 1, 5, 1.05 1.249 2, 3, 3, 1, 1, 5, 1.05 1.249
Corrugated board, recycling fibre, single wall, at plant 1, 1, 3, 1, 1, 5, 1.05 1.235 2, 3, 3, 1, 1, 5, 1.05 1.249 — —
Packaging film, LDPE, at plant — — 2, 3, 3, 1, 1, 5, 1.05 1.249 2, 3, 3, 1, 1, 5, 1.05 1.249
Manufacturing
Electricity, medium voltage, at grid (China) 1, 1, 3, 1, 1, 5, 1.05 1.235 2, 3, 3, 1, 1, 5, 1.05 1.249 — —
Electricity, medium voltage, at grid (US) — — 2, 3, 3, 1, 1, 5, 1.05 1.249 — —
Natural gas, burned in industrial furnace low‐NOx >100kW — — 2, 3, 3, 1, 1, 5, 1.05 1.249 — —
Water, unspecified natural origin 1, 1, 3, 1, 1, 5, 1.05 1.235 2, 3, 3, 1, 1, 5, 1.05 1.249 — —
Treatment, sewage, to wastewater treatment, class 3 1, 1, 3, 1, 1, 5, 1.05 1.235 1, 1, 3, 1, 1, 5, 1.05 1.235 — —
Extrusion, plastic film — — 2, 3, 3, 1, 1, 5, 1.05 1.249 — —
Extrusion, plastic pipes — — 2, 3, 3, 1, 1, 5, 1.05 1.249 — —
Spinning cotton fiber — — — — 2, 3, 3, 1, 1, 5, 1.05 1.249
Sizing — — — — 2, 3, 3, 1, 1, 5, 1.05 1.249
Weaving — — — — 2, 3, 3, 1, 1, 5, 1.05 1.249
De‐sizing / scouring / bleaching — — — — 2, 3, 3, 1, 1, 5, 1.05 1.249
Use
Electricity, low voltage, at grid (US) 2, 3, 3, 1, 1, 5, 1.05 1.249 2, 3, 3, 1, 1, 5, 1.05 1.249 2, 3, 3, 3, 1, 5, 1.05 1.25
Laundering — — — — 2, 3, 3, 3, 1, 5, 1.05 1.25

28
Airblade™ XLERATOR®, standard dryer,
paper towels Cotton roll towels
Unit process Quality levels GSD Quality levels GSD Quality levels GSD
End‐of‐life
Recycling cardboard 2, 3, 3, 1, 1, 5, 1.05 1.249 2, 3, 3, 1, 1, 5, 1.05 1.249 2, 3, 3, 1, 1, 5, 1.05 1.249
Disposal, municipal solid waste, to landfill, methane energy recovery 2, 3, 3, 1, 1, 5, 1.05 1.249 2, 3, 3, 1, 1, 5, 1.05 1.249 2, 3, 3, 1, 1, 5, 1.05 1.249
Disposal, municipal solid waste, to incineration, energy recovery 2, 3, 3, 1, 1, 5, 1.05 1.249 2, 3, 3, 1, 1, 5, 1.05 1.249 2, 3, 3, 1, 1, 5, 1.05 1.249
Transportation
Transport, lorry >16t, fleet average 2, 3, 3, 1, 1, 5, 2 2.067 2, 3, 3, 1, 1, 5, 2 2.067 2, 3, 3, 1, 1, 5, 2 2.067
Transport, transoceanic freight ship 2, 3, 3, 1, 1, 5, 1.05 1.249 2, 3, 3, 1, 1, 5, 1.05 1.249 2, 3, 3, 1, 1, 5, 1.05 1.249
Transport, freight, rail, diesel 2, 3, 3, 1, 1, 5, 1.05 1.249 2, 3, 3, 1, 1, 5, 1.05 1.249 2, 3, 3, 1, 1, 5, 1.05 1.249
Transport, lorry >32t, EURO3 2, 3, 3, 1, 1, 5, 2 2.067 2, 3, 3, 1, 1, 5, 2 2.067 2, 3, 3, 1, 1, 5, 2 2.067
Transport, lorry 16‐32t, EURO3 2, 3, 3, 1, 1, 5, 2 2.067 2, 3, 3, 1, 1, 5, 2 2.067 2, 3, 3, 1, 1, 5, 2 2.067
Transport, lorry 3.5‐7.5t, EURO3 — — — — 2, 3, 3, 3, 1, 5, 2 2.068
Transport, lorry 7.5‐16t, EURO3 2, 3, 3, 1, 1, 5, 2 2.067 2, 3, 3, 1, 1, 5, 2 2.067 2, 3, 3, 1, 1, 5, 2 2.067

29
4 Parameter Values for Scenario Uncertainty Analysis Table 27 summarizes the independent parameters considered in the scenario uncertainty analysis. A
uniform distribution is assumed for all the parameters due to lack of information on actual distributions.
The first five parameters in the table concern lifetime usage, which is represented as the number of
pairs of hands dried before the product is disposed. These parameters are uncorrelated in this
uncertainty analysis because there is no reason to expect a standard dryer will last as long as an
XLERATOR® dryer or vice versa. Thus, five independent variables are used in the analysis, one for each
dryer system, plus two more for the towel dispensers and waste bin. The number of times the cotton
towel itself can be laundered and reused is also included in the analysis.
The next set of parameters concern manufacturing and use phase electric grid mixes. Manufacturing
grid mixes are assumed to be independent (i.e. uncorrelated) for each drying system because there is no
reason to expect that products will be manufactured in the same region. Use grid mixes, however, are
perfectly correlated across the systems because the systems’ use phases take place in the same
washroom (or at most 100‐km away, as is the case for cotton roll towel laundering). Keeping dryers and
cotton roll towels on the same grid also ensures a consistent comparative basis for the use phase.
The uncertainty analysis represents grid mix as a continuous variable of kg CO2 eq per kWh; it is not
necessary to define the exact fractions of coal, natural gas, hydropower, etc. required to generate that
kilowatt‐hour of electricity because only the grid’s GWP matters in the calculations. The minimum and
maximum values for the grid mix parameters are estimated based on the GWPs of the hypothetical all‐
hydropower and all‐coal grids.
Drying system use intensity is decoupled for dryers and towels under the assumption that the average
user treats hand dryers, cotton roll towels, and paper towels differently. For instance, a user who only
spends a few seconds in front of a hand dryer may nonetheless grab three paper towels to dry his hands
quickly. Towel usage is assumed to vary continuously between one and two cotton roll towel pulls or
between one and three paper towels. Two sets of dry times are defined for dryer use intensity—as
introduced in the paper. The first represents drying‐driven usage in which users hold their hands in the
air stream until a desired dryness is achieved. The dry time ranges for this drying‐driven usage pattern
are defined as 50% below to 25% above measured baseline dry times. The second set of dry time ranges
represents time‐driven usage, in which users wait the same length of time for their hands to dry,
regardless of dryer type, before leaving. Parameter limits for this time‐driven usage pattern are
approximated to represent the range of “reasonable” drying‐driven usage times. A lower limit of 5
seconds was chosen based on the Dyson Airblade™ hand dryer’s minimum dry time in the drying‐driven
scenario, and an upper limit of 30 seconds as the maximum time users are likely to wait for their hands
to dry. In both cases, dry times are perfectly correlated across dryers.

30
Table 27 Parameter ranges and distributions in Monte Carlo simulation.
Independent parameters Drying systems Baseline Range Distribution
Lifetime usage Airblade™ 350,000 150k – 550k pairs of hands over 5 yrs
Uniform
Lifetime usage XLERATOR® 350,000 150k – 550k pairs of hands over 5 yrs
Uniform
Lifetime usage Standard dryer 350,000 150k – 550k pairs of hands over 5 yrs
Uniform
Lifetime usage Cotton roll towel
(dispenser) 350,000
150k – 550k pairs of hands over 5 yrs
Uniform
Lifetime usage Paper towel
(dispenser and bin) 350,000
150k – 550k pairs of hands over 5 yrs
Uniform
Number of reuses Cotton roll towel 103 70 – 130 launderings
and reuses Uniform
Manufacturing grid mix Airblade™ CN average 0.019 – 1.44
kg CO2 eq / kWh Uniform
Manufacturing grid mix XLERATOR® CN average 0.019 – 1.44
kg CO2 eq / kWh Uniform
Manufacturing grid mix Standard dryer CN average 0.019 – 1.44
kg CO2 eq / kWh Uniform
Manufacturing grid mix Cotton roll towels CN average 0.019 – 1.44
kg CO2 eq / kWh Uniform
Manufacturing grid mix Paper towels US average 0.011 – 1.22
kg CO2 eq / kWh Uniform
Use grid mix
Airblade™ XLERATOR®
Standard dryer Cotton roll towels
US average 0.016 – 1.32
kg CO2 eq / kWh Uniform
Use intensity Airblade™ XLERATOR®
Standard dryer
12 seconds 20 seconds 31 seconds
Drying‐driven: ‐50% to +25% of
measured baseline; Time‐driven: 5 – 30 seconds
Uniform
Use intensity Cotton roll towels 1 towel 1 – 2 towels Uniform
Use intensity Paper towels 2 towels 1 – 3 towels Uniform
MSW incineration fraction
All 19% 0% – 100% Uniform
Compost Paper towels,
Cotton roll towels N Y, N Binary

31
The last two parameters in Table 27 concern the end‐of‐life stage. The first, municipal solid waste
(MSW) incineration fraction, applies to all hand‐drying systems and specifies the percent of each system
that is incinerated after disposal (the remainder is assumed to be sent to a landfill). While applying the
same scenario to both dryers and paper towels may not be wholly realistic given that dryers are
disposed after a life span of five years whereas paper towels are disposed only after a single use, the
incineration fraction is not anticipated to change within so short a time frame. As a case in point, the
fraction of US waste incinerated after recovery for recycling has changed very little since 1990 when the
US incinerated around 17.2% of its waste. Finally, composting indicates whether the towels are
composted or incinerated and/or sent to a landfill.
Parameters not listed in Table 27 are assumed to be the same as in the baseline scenario. For example,
ECF‐bleached sulfate pulp is assumed for paper towels manufactured from virgin content, and the cut‐
off strategy for allocating recycled content assumed for paper towels containing such content.
5 Significance testing of probabilistic analyses Table 28. Test for significance in difference in sample means. Values reported represent p‐value from t‐test on difference of natural logarithm of sample means for the two alternatives listed A and B. In all cases, log transform of data passes chi‐squared test of normality. * represents a p‐value <0.001.
Drying system A Drying system B
p value, t‐test, µGWPA ≠ µGWPB (bold fail at α=0.05)
1: Baseline assumptions, measured dry
times
2: Baseline assumptions, reported dry
times
3: Consistent PWB unit
process, reported dry times
High-speed hands-in dryer High-speed hands-under dryer * * 0.39 High-speed hands-in dryer Hands-under dryer * * * High-speed hands-in dryer Cotton roll towels * * * High-speed hands-in dryer Paper towels * * * High-speed hands-under dryer Hands-under dryer * * * High-speed hands-under dryer Cotton roll towels * * * High-speed hands-under dryer Paper towels * * * Cotton roll towels Hands-under dryer * * * Cotton roll towels Paper towels * * * Paper towels Hands-under dryer 0.003 0.01 0.08

32
Table 29. Sign test on difference in sample medians. Values reported represent p‐value from sign test on sample medians for the probabilistic scenario analysis of two alternatives listed A and B. * represents a p‐value <0.001.
Drying system A
Drying system B
p value, Sign test on difference in medians, P(GWPA > GWPB) ≠ 0.5 (bold fail at α=0.05)
1. Drying-driven,
correlated use,
different PWB
2. Drying-driven,
uncorrelated use,
different PWB
3. Drying-driven,
uncorrelated use,
same PWB
4. Time-driven,
correlated use,
different PWB
5. Time-driven,
uncorrelated use,
different PWB
6. Time-driven,
uncorrelated use,
same PWB
HSHI dryer HSHU dryer
* * * * * 0.14
HSHI dryer HU dryer * * * * * *
HSHI dryer Cotton roll towels
* * * * * *
HSHI dryer Paper towels
* * * * * *
HSHU dryer
HU dryer * * * * * *
HSHU dryer
Cotton roll towels
* * * * * *
HSHU dryer
Paper towels
* * * * * *
Cotton roll towels
HU dryer * * * * * *
Cotton roll towels
Paper towels
* * * * * *
Paper towels
HU dryer * * * * * *

33
Table 30. Steel‐Dwass variant of Kruskal‐Wallis test on difference in sample means. Values reported represent p‐value from Steel‐Dwass test on sample means for the probabilistic scenario analysis of two alternatives listed A and B. * represents a p‐value <0.001.
Drying system A
Drying system B
p value, Steel‐Dwass variant of Kruskal‐Wallis test on diff. in means, µGWPA ≠ µGWPB
(bold fail at α=0.05)
1. Drying-driven,
correlated use,
different PWB
2. Drying-driven,
uncorrelated use,
different PWB
3. Drying-driven,
uncorrelated use,
same PWB
4. Time-driven,
correlated use,
different PWB
5. Time-driven,
uncorrelated use,
different PWB
6. Time-driven,
uncorrelated use,
same PWB
HSHI dryer HSHU dryer
* * * * * 0.35
HSHI dryer HU dryer * * * * * *
HSHI dryer Cotton roll towels
* * * * * *
HSHI dryer Paper towels
* * * * * *
HSHU dryer
HU dryer * * * * * *
HSHU dryer
Cotton roll towels
* * * * * *
HSHU dryer
Paper towels
* * * * * *
Cotton roll towels
HU dryer * * * * * *
Cotton roll towels
Paper towels
* * * * * *
Paper towels
HU dryer * * * * * *
6 References Archibald LK, Jarvis WR (2011) A study of bacterial contamination of high‐touch areas and hand drying
practices in public washrooms. Unpublished. Blower T (2011), Dyson Ltd., personal communication. Dettling J (2009) Comparative Environmental Life Cycle Assessment of Hand Drying Systems: The
XLERATOR Hand Dryer, Conventional Hand Dryers and Paper Towel Systems. Quantis US, Boston, US. http://www.exceldryer.com/PDFs/LCAFinal9‐091.pdf.
Dyson Airblade Technical Specifications. http://www.dysonairblade.co.uk/specification/default.asp?product=AB01‐AIRBLADE.
Eberle U, Möller M (2006) Life Cycle Analysis of Hand‐Drying Systems. A comparison of cotton towels and paper towels. Öko‐Institut e.V., Freiburg, Germany. http://www.etsa‐europe.org/news/documents/ETSALCAbrochureoncottonrolltowelsJuly06EN.pdf.
Environmental Resources Management (2001) Streamlined Life Cycle Assessment Study. Oxford, UK. http://www.airdri.com/script/AirdriBobrick.pdf.
Excel Dryer XLERATOR Hand Dryer Specifications. http://www.exceldryer.com/products_xlerator.php.

34
Frischknecht R, Jungbluth N, Althaus H‐J, Doka G, Dones R, Heck T, Hellweg S, Hischier R, Nemecek T, Rebitzer G, Spielmann M, Wernet G (2007) Overview and Methodology. ecoinvent Report No. 1. Swiss Centre for Life Cycle Inventories, Dübendorf, Switzerland. http://www.ecoinvent.org/fileadmin/documents/en/01_OverviewAndMethodology.pdf.
International Organisation for Standardisation (2006) ISO/FDIS 14044 Environmental management ‐ Life cycle assessment ‐ Requirements and guidelines.
Madsen J (2007) Life Cycle Assessment of Tissue Products. Environmental Resources Management. http://www2.kimberly‐clark.com/pdfs/LifeCycleAssessment.pdf.
Montalbo T, Gregory J, Kirchain R (2011) Life Cycle Assessment of Hand Drying Systems. Massachusetts Institute of Technology, Cambridge, US. http://msl.mit.edu/publications/HandDryingLCA‐Report.pdf.
NSF (2007) NSF Protocol P335: Hygienic Commercial Hand Dryers. Ann Arbor, MI The Athena Institute and the National Renewable Energy Laboratory (2010) U.S. LCI Database Overview
and Data Submission Requirements, Version (Draft) 2. Weber C, Hendrickson C, Jaramillo P, Matthews HS, Nagengast A, Nealer R (2008) Life Cycle Comparison
of Traditional Retail and E‐commerce Logistics for Electronic Products: A Case Study of buy.com. Green Design Institute, Carnegie Mellon University, Pittsburgh, PA, USA. http://www.ce.cmu.edu/~greendesign/research/Buy_com_report_final_030209.pdf.