Embed Size (px)
Citation preview

Supplementary appendixThis appendix formed part of the original submission and has been peer reviewed. We post it as supplied by the authors.
Supplement to: Cipriani A, Zhou X, Del Giovane C, et al. Comparative efficacy and tolerability of antidepressants for major depressive disorder in children and adolescents: a network meta-analysis. Lancet 2016; published online June 8. http://dx.doi.org/10.1016/S0140-6736(16)30385-3.

Comparative efficacy and tolerability of antidepressants for major depressive
disorder in children and adolescents: a network meta-analysis
Andrea Cipriani, Xinyu Zhou, Cinzia Del Giovane, Sarah E. Hetrick, Bin Qin, Craig Whittington, David
Coghill, Yuqing Zhang, Philip Hazell, Stefan Leucht, Pim Cuijpers, Juncai Pu, David Cohen, Arun V.
Ravindran, Yiyun Liu, Kurt D. Michael, Lining Yang, Lanxiang Liu, Peng Xie
Supplementary appendix to the manuscript

1
Contents of Supplementary appendix
Appendix 1 Published protocol and changes made to the protocol Page 2
Appendix 2 Search strategy and results Page 4
Appendix 3 Hierarchy of depressive scales Page 6
Appendix 4 Network meta-analysis model Page 8
Appendix 5 Categorisation of symptom severity with cut-off scores Page 12
Appendix 6 References for included trials Page 14
Appendix 7 Risk of bias assessment Page 18
Appendix 8 Network plot for each outcome Page 22
Appendix 9 Results from pairwise meta-analysis for each outcome: numbers,
estimates and heterogeneity
Page 25
Appendix 10 The results of network meta-analysis for secondary outcomes Page 34
Appendix 11 Assessment of inconsistency results for each outcome: global, local and
from the node-splitting model
Page 36
Appendix 12 Comparison-adjusted funnel plot for each outcome from the network
meta-analysis
Page 44
Appendix 13 Treatment ranking and SUCRA plot for each outcome Page 48
Appendix 14 Contribution matrix and contributions summary of risk of bias
assessments for each outcome
Page 54
Appendix 15 Evaluation of the quality of evidence using GRADE framework for
primary outcomes
Page 77
Appendix 16 Subgroup network meta-analyses for primary outcomes Page 87
Appendix 17 Sensitivity network meta-analyses Page 92

2
Appendix 1
Published protocol and changes made to the protocol

3
The protocol has been registered in PROSPERO (No. CRD42015016023) and published in BMJ Open –
available at http://bmjopen.bmj.com/content/5/9/e007768.full.pdf+html
Here below some changes and clarifications to the published protocol:
1. In order to obtain more comprehensive data, we also searched additional international trial registers,
including Australian New Zealand Clinical Trials Registry, Chinese Clinical Trial Register, UMIN
Clinical Trials Registry in Japan, the International Standard Randomised Controlled Trial Number, and
the Netherlands Trial Register. We also added to hand-search key journals, and conference proceedings.
2. Outcomes measures
The primary outcomes were efficacy (i.e. the mean overall change in total scores from baseline to
endpoint on standardised depressive rating scales) and tolerability (i.e. the proportion of patients who
discontinued treatment due to adverse events). Secondary outcomes included response rate, measured as
the proportion of patients whose total score on the depression rating scales reduced by at least 50% from
baseline to endpoint, or who scored much improved or very much improved on the clinical global
impression (CGI); and when ‘response’ was not reported, we used ‘remission’), and all-cause
discontinuation (i.e. the proportion of patients who discontinued treatment for any reason). We also
examined suicide-related outcome, measured as the reported cases of definitive and suicidal behavior or
suicidal ideation during the acute of treatment. The definition of suicide-related outcome was based on
the primary study report and the Columbia Classification Algorithm of Suicide Assessment.
3. We added our intention to perform meta-analysis of pairwise comparisons for all outcomes, and
assessment of the heterogeneity and publication bias of pairwise comparisons for all outcomes.
4. As reported in the original protocol, we used the Cochrane Collaboration’s tool for assessing risk of
bias; however, after discussion within the review team before conducting the final statistical analyses,
we decided to revise the criteria for rating study quality, as follows: high risk study (2 or more items
rated as high risk of bias); low risk study (5 or more items rated as low risk and no more than one as
high risk); moderate risk study (all remaining situations).
5. We added the assessment of the quality of evidence of network estimates for primary outcomes by
using the GRADE framework, which characterizes the quality of a body of evidence on the basis of the
study limitations, imprecision, inconsistency, indirectness, and publication bias.
6. We had planned to conduct subgroup analyses, sensitivity analyses and meta-regressions, while we
have adjusted some analyses according to the number of trials. We changed the subgroups analysis with
the type of trials (published trials vs unpublished trials) as the sensitivity analysis for primary outcomes
by omitting the unpublished trials. We added to perform a sensitivity network meta-analysis for
response rate outcome by omitting the trials where only data on ‘remission’, but not on ‘response’ was
reported. Due to the limited number of trials in subgroups, we did not perform subgroup analyses by
using the meta-regression model, and calculate Somer’s D (a correlation coefficient for a dichotomous
and an ordinal variable). Thus, we performed network subgroup analyses in Winbugs 1.4.3 with
Markov Chains Monte Carlo method.

4
APPENDIX 2
Search strategy and results
5
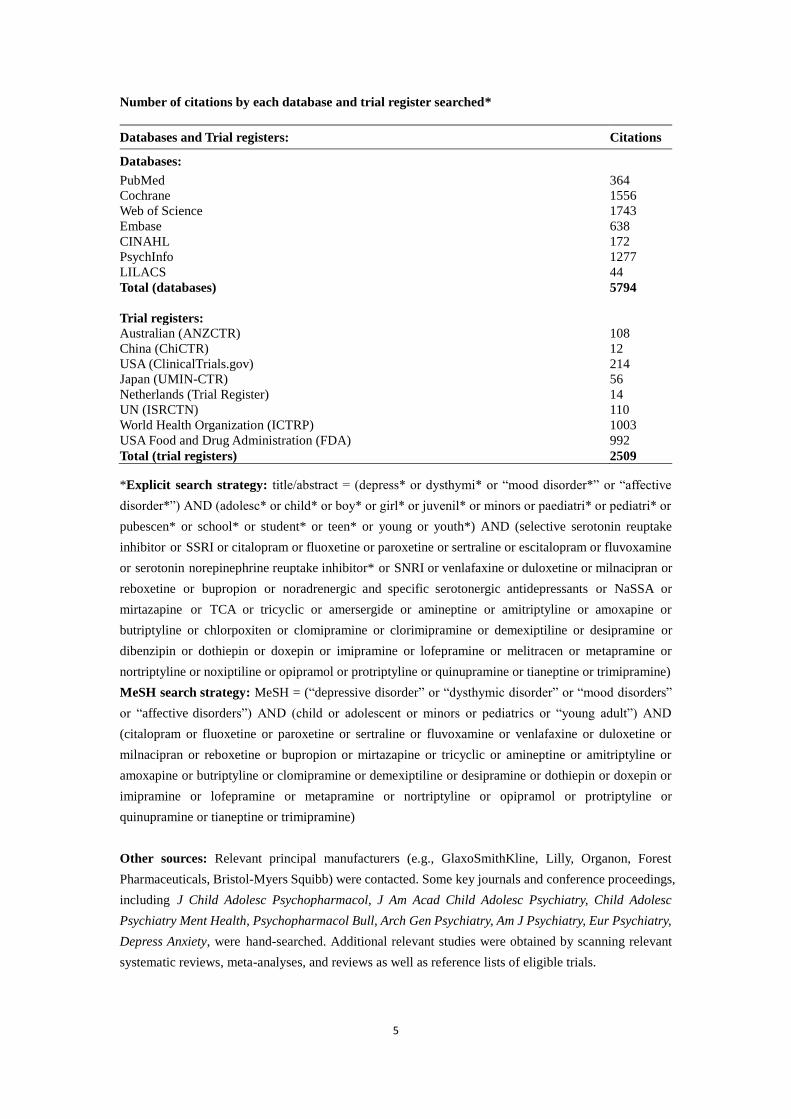
Number of citations by each database and trial register searched*
Databases and Trial registers: Citations
Databases:
PubMed 364
Cochrane 1556
Web of Science 1743
Embase 638
CINAHL 172
PsychInfo 1277
LILACS 44
Total (databases) 5794
Trial registers:
Australian (ANZCTR) 108
China (ChiCTR) 12
USA (ClinicalTrials.gov) 214
Japan (UMIN-CTR) 56
Netherlands (Trial Register) 14
UN (ISRCTN) 110
World Health Organization (ICTRP) 1003
USA Food and Drug Administration (FDA) 992
Total (trial registers) 2509
*Explicit search strategy: title/abstract = (depress* or dysthymi* or “mood disorder*” or “affective
disorder*”) AND (adolesc* or child* or boy* or girl* or juvenil* or minors or paediatri* or pediatri* or
pubescen* or school* or student* or teen* or young or youth*) AND (selective serotonin reuptake
inhibitor or SSRI or citalopram or fluoxetine or paroxetine or sertraline or escitalopram or fluvoxamine
or serotonin norepinephrine reuptake inhibitor* or SNRI or venlafaxine or duloxetine or milnacipran or
reboxetine or bupropion or noradrenergic and specific serotonergic antidepressants or NaSSA or
mirtazapine or TCA or tricyclic or amersergide or amineptine or amitriptyline or amoxapine or
butriptyline or chlorpoxiten or clomipramine or clorimipramine or demexiptiline or desipramine or
dibenzipin or dothiepin or doxepin or imipramine or lofepramine or melitracen or metapramine or
nortriptyline or noxiptiline or opipramol or protriptyline or quinupramine or tianeptine or trimipramine)
MeSH search strategy: MeSH = (“depressive disorder” or “dysthymic disorder” or “mood disorders”
or “affective disorders”) AND (child or adolescent or minors or pediatrics or “young adult”) AND
(citalopram or fluoxetine or paroxetine or sertraline or fluvoxamine or venlafaxine or duloxetine or
milnacipran or reboxetine or bupropion or mirtazapine or tricyclic or amineptine or amitriptyline or
amoxapine or butriptyline or clomipramine or demexiptiline or desipramine or dothiepin or doxepin or
imipramine or lofepramine or metapramine or nortriptyline or opipramol or protriptyline or
quinupramine or tianeptine or trimipramine)
Other sources: Relevant principal manufacturers (e.g., GlaxoSmithKline, Lilly, Organon, Forest
Pharmaceuticals, Bristol-Myers Squibb) were contacted. Some key journals and conference proceedings,
including J Child Adolesc Psychopharmacol, J Am Acad Child Adolesc Psychiatry, Child Adolesc
Psychiatry Ment Health, Psychopharmacol Bull, Arch Gen Psychiatry, Am J Psychiatry, Eur Psychiatry,
Depress Anxiety, were hand-searched. Additional relevant studies were obtained by scanning relevant
systematic reviews, meta-analyses, and reviews as well as reference lists of eligible trials.

6
APPENDIX 3
Hierarchy of depressive scales

7
Hierarchy of depression symptom severity measurement scales
Hierarchy Depressive scales Abbreviation
1 Children’s Depression Rating Scale CDRS
2 Hamilton Depression Rating Scale HAMD
3 Montgomery Asberg Depression Rating Scale MADRS
4 Beck Depression Inventory BDI
5 Children’s Depression Inventory CDI
6 Schedule for Affective Disorders and Schizophrenia for School
Aged Children
K-SADS
7 Mood and Feeling Questionnaire MFQ
8 Reynolds Adolescent Depression Scale RADS
9 Bellevue Index of Depression BID
10 Child Depression Scale CDS
11 Centre for Epidemiologic Studies Depression Scale CES-D
12 Child Assessment Schedule CAS
13 Child Behavior Checklist-Depression CBCL-D
Note: where different depression symptom severity rating scales were used, for the purpose of pooling
results, we chose the single best available outcome measure according to a hierarchy based on
psychometric properties and appropriateness for use with children and adolescents.

8
APPENDIX 4
Network meta-analysis model

9
NMA model description
1. Random Effects Model for Continuous Data in WinBUGS
y=a table of the arm-means, sd=a table of the arm sd, n=a table of the arm sample size, t=a table with
the names (numbers) of treatments, na=a vector with the number of arms in each study, ref=a number
specifying which is the reference treatment
model{
for(i in 1:ns){
w[i,1] <- 0
delta[i,t[i,1]]<-0
u[i] ~ dnorm(0,.0001)
for (k in 1:na[i]) {
se[i,t[i,k]]<- sd[i,t[i,k]]/sqrt(n[i,t[i,k]])
var[i,t[i,k]]<- se[i,t[i,k]]*se[i,t[i,k]]
prec[i,t[i,k]]<- 1/var[i,t[i,k]]
#normal likelihood
y[i,t[i,k]] ~ dnorm(phi[i,t[i,k]],prec[i,t[i,k]])
phi[i,t[i,k]]<- (u[i]+delta[i,t[i,k]])*pooled.sd[i]
#calculate the pooled SD
nom1[i,k]<- n[i,t[i,k]]*sd[i,t[i,k]]*sd[i,t[i,k]] #nominator for the pooled sd
}
ss[i]<- sum(n[i,1:nt])-nt+na[i] #total sample size in a study
nom[i]<- sum(nom1[i,1:na[i]]) #nominator for the pooled sd
pooled.sd[i]<- sqrt(nom[i]/(ss[i]-na[i])) #pooled sd
for (k in 2:na[i]) {
delta[i,t[i,k]] ~ dnorm(md[i,t[i,k]],taud[i,t[i,k]]) # trial-specific SMD distributions
md[i,t[i,k]]<- d[t[i,k]]-d[t[i,1]]+sw[i,k] # mean of SMD distributions
taud[i,t[i,k]]<- tau*2*(k-1)/k #precision of SMD distributions
w[i,k] <- (delta[i,t[i,k]]-d[t[i,k]]+d[t[i,1]]) #adjustment, multi-arm RCTs
sw[i,k] <- sum(w[i,1:k-1])/(k-1) } # cumulative adjustment for multi-arm trials
}
d[ref]<-0
for (k in 2:nt) {d[k] ~ dnorm(0,.0001) }
SD~dunif(0,1) #vague prior for random effects standard deviation
tau<-1/pow(SD,2)

10
# Collection of results#
# pairwise SMDs
# for all comparisons
for (c in 1:(nt-1)) { for (k in (c+1):nt) { SMD[c,k] <- d[c] - d[k] } #to have negative values
}
#Fit of the Model#
for(i in 1:ns) {
for(k in 1:na[i]) {
Darm[i,k]<-(y[i,t[i,k]]-phi[i,t[i,k]])*(y[i,t[i,k]]-phi[i,t[i,k]])/var[i,t[i,k]]
}
D[i]<- sum(Darm[i,1:na[i]])
}
D.bar<- sum(D[])
}
2. Random Effects Model for Dichotomous Data in WinBUGS
r= a table of the number of events, n=a table of the arm sample size, t=a table with the names (numbers)
of treatments, na=a vector with the number of arms in each study, ref=a number specifying which is the
reference treatment
model {
for(i in 1:ns) {
w[i,1]<- 0
delta[i,t[i,1]]<- 0
#Binomial Likelihood#
for (k in 1:na[i]) {
r[i,t[i,k]] ~ dbin(p[i,t[i,k]],n[i,t[i,k]])
}
#Parameterization of the model#
logit(p[i,t[i,1]])<- mu[i]
for (k in 2:na[i]) {
logit(p[i,t[i,k]])<- mu[i] + delta[i,t[i,k]]
delta[i,t[i,k]] ~ dnorm(md[i,t[i,k]],taud[i,t[i,k]])
taud[i,t[i,k]]<- tau *2*(k-1)/k
md[i,t[i,k]]<-d[t[i,k]] - d[t[i,1]] + sw[i,k]
w[i,k]<- (delta[i,t[i,k]] - d[t[i,k]] + d[t[i,1]])
sw[i,k]<- sum(w[i,1:k-1])/(k-1)
}
}
#Priors#
sd ~ dnorm(0,1)I(0,1)

11
tau<- 1/pow(sd,2)
for(k in 1:(ref-1)) {
d[k] ~ dnorm(0,.0001)
}
for(k in (ref+1):nt) {
d[k] ~ dnorm(0,.0001)
}
for(i in 1:ns) {
mu[i] ~ dnorm(0,.0001)
}
# Collection of results#
#Estimated & Predicted Odds Ratios#
d[ref]<- 0
for(i in 1:(nt-1)) {
for (j in (i+1):nt) {
OR[i,j]<- exp(d[i] - d[j])
LOR[i,j]<- d[i] - d[j]
}
}
#Fit of the Model#
for(i in 1:ns) {
for (k in 1:na[i]) {
Darm[i,k]<- -2*( r[i,t[i,k]] *log(n[i,t[i,k]]*p[i,t[i,k]]/ r[i,t[i,k]])+(n[i,t[i,k]] -
r[i,t[i,k]])*log((n[i,t[i,k]]-n[i,t[i,k]]* p[i,t[i,k]])/(n[i,t[i,k]]- r[i,t[i,k]])))
}
D[i]<- sum(Darm[i,1:na[i]])
}
D.bar<- sum(D[])
}

12
APPENDIX 5
Categorisation of depressive symptom severity with cut-off scores

13
Categorisation of depressive symptoms severity with cut-off scores
No. Depressive rating scales Abbreviation
Cut-off scores
Mild Moderate Severe
1
Children’s Depression Rating
Scale-Revised
CDRS-R 29-40 ≥ 40
2 The Hamilton Rating Scale for
Depression-17/21 item HAMD-17/21 7-17 18-23 ≥ 24
3
Montgomery–Asberg Depression
Rating Scale
MADRS 15-24 25-30 ≥ 31
4
Children Depression Inventory CDI < 20 20-36 ≥ 36
5
Beck Depression Inventory BDI 10-20 21-30 ≥ 31
6 The Clinical Global Impression –
Severity scale CGI-S 3 4-5 ≥ 6
References:
1. Poznanski EO, Freeman LN, Mokros HB. Children's depression rating scale – revised.
Psychopharmacol Bull 1985; 21: 979-989.
2. Hamilton, M. A rating scale for depression. Journal of Neurology, Neurosurgery and Psychiatry
1960; 23: 56-62.
3. Montgomery SA, A sberg M. A new depression scale designed to be sensitive to change.Br J
Psychiatry. 1979;134:382 – 389.
4.Kovacs, M. The Children's Depression Inventory. Unpublished manuscript, University of Pittsburgh
School of Medicine. 1983
5. Beck AT, Steer RA, Garbin MG. Psychometric properties of the Beck Depression Inventory:
twenty-five years of evaluation. ClinPsycholRev 1988; 8: 77-100.
6. Guy WE. CDEU Assessment Manual for Psychopharmacology. National Institute of Mental Health,
Psychopharmacology Research Branch, Rockville, Maryland. 1976.

14
APPENDIX 6
References for included trials

15
1. Organon Pharmaceuricals USA Inc. A multicenter, randomized, double-blind, placebo-controlled,
efficacy and safety study of Remeron in outpatient children and adolescents with major
depressive disorder.
http://www.fda.gov/downloads/Drugs/DevelopmentApprovalProcess/DevelopmentResource
s/ UCM164066.pdf (accessed May 20, 2015).
2. Almeida-Montes LG, Friederichsen A. Treatment of major depressive disorder with fluoxetine in
children and adolescents. A double-blind, placebo-controlled study. Psiquiatria Biologica
2005; 12: 198-205.
3. Atkinson SD, Prakash A, Zhang Q, et al. A double-blind efficacy and safety study of duloxetine
flexible dosing in children and adolescents with major depressive disorder. J Child Adolesc
Psychopharmacol 2014; 24: 180-9.
4. Attari A, Moghaddam FY, Hasanzadeh A, Soltani M, Mahmoodi M. Comparison of efficacy of
fluoxetine with nortriptyline in treatment of major depression in children and adolescents: A
double-blind study. Journal of Research in Medical Sciences 2006; 11: 24-30.
5. B1Y-MC-HCCJ. Fluoxetine: fluoxetine versus placebo in adolescent depressed patients. 17
November 2004. www.lillytrials.com/results/Prozac.pdf (accessed April 17, 2015).
6. Berard R, Fong R, Carpenter DJ, Thomason C, Wilkinson C. An international, multicenter,
placebo-controlled trial of paroxetine in adolescents with major depressive disorder. J Child
Adolesc Psychopharmacol 2006; 16: 59-75.
7. Braconnier A, Le Coent R, Cohen D, DEROXADO Study Group. Paroxetine versus clomipramine in
adolescents with severe major depression: a double-blind, randomized, multicenter trial. J
Am Acad Child Adolesc Psychiatry 2003; 42: 22-9.
8. Bristol-Myer Squibb. Review and evaluation of clinical data. http://www.fda.gov/downloads/Drugs/
DevelopmentApproval Process/DevelopmentResources/UCM164073.pdf (accessed August
25, 2014)
9. Emslie GJ, Rush AJ, Weinberg WA, et al. A double-blind, randomized, placebo-controlled trial of
fluoxetine in children and adolescents with depression. Arch Gen Psychiatry 1997; 54:
1031-7.
10. Emslie GJ, Heiligenstein JH, Wagner KD, et al. Fluoxetine for acute treatment of depression in
children and adolescents: a placebo-controlled, randomized clinical trial. J Am Acad Child
Adolesc Psychiatry 2002; 41: 1205-15.
11. Emslie GJ, Findling RL, Rynn MA, et al. Efficacy and Safety of Nefazadone in the Treatment of
Adolescents with Major Depressive Disorder. J Child Adolesc Psychopharmacol 2002; 12:
299.
12. Emslie GJ, Wagner KD, Kutcher S, et al. Paroxetine treatment in children and adolescents with
major depressive disorder: a randomized, multicenter, double-blind, placebo-controlled trial.
J Am Acad Child Adolesc Psychiatry 2006; 45: 709-19.
13. Emslie GJ, Findling RL, Yeung PP, Kunz NR, Li Y. Venlafaxine ER for the treatment of pediatric
subjects with depression: results of two placebo-controlled trials. J Am Acad Child Adolesc
Psychiatry 2007; 46: 479-88.
14. Emslie GJ, Ventura D, Korotzer A, Tourkodimitris S. Escitalopram in the treatment of adolescent
depression: a randomized placebo-controlled multisite trial. J Am Acad Child Adolesc
Psychiatry 2009; 48: 721-9.
15. Emslie GJ, Prakash A, Zhang Q, Pangallo BA, Bangs ME, March JS. A double-blind efficacy and

16
safety study of duloxetine fixed doses in children and adolescents with major depressive
disorder. J Child Adolesc Psychopharmacol 2014; 24: 170-9.
16. Findling RL, Pagano ME, McNamara NK, et al. The short-term safety and efficacy of fluoxetine in
depressed adolescents with alcohol and cannabis use disorders: a pilot randomized
placebo-controlled trial. Child Adolesc Psychiatry Ment Health 2009; 3: 11.
17. Geller B, Cooper TB, Graham DL, Marsteller FA, Bryant DM. Double-blind placebo-controlled
study of nortriptyline in depressed adolescents using a "fixed plasma level" design.
Psychopharmacol Bull 1990; 26: 85-90.
18. Geller B, Cooper TB, Graham DL, Fetner HH, Marsteller FA, Wells JM. Pharmacokinetically
designed double-blind placebo-controlled study of nortriptyline in 6- to 12-year-olds with
major depressive disorder. J Am Acad Child Adolesc Psychiatry 1992; 31: 34-44.
19. Hongfen C, Weidong J, Guoquan Z, et al. A randomized and double-blind clinical trial of
venlafaxine hydrochloride sustained release capsules for treating juvenile depression. Eur
Psychiatry 2009; 24: S502.
20. Hughes CW, Preskorn SH, Weller E, Weller R, Hassanein R, Tucker S. The effect of concomitant
disorders in childhood depression on predicting treatment response. Psychopharmacol Bull
1990; 26: 235-8.
21. Keller MB, Ryan ND, Strober M, et al. Efficacy of paroxetine in the treatment of adolescent major
depression: a randomized, controlled trial. J Am Acad Child Adolesc Psychiatry 2001; 40:
762-72.
22. Klein RG1, Mannuzza S, Koplewicz HS, et al. Adolescent depression: controlled desipramine
treatment and atypical features. Depress Anxiety 1998; 7: 15-31.
23. Kutcher S, Boulos C, Ward B, et al. Response to desipramine treatment in adolescent depression: a
fixed-dose, placebo-controlled trial. J Am Acad Child Adolesc Psychiatry 1994; 33: 686-94.
24. Kye CH, Waterman GS, Ryan ND, et al. A randomized, controlled trial of amitriptyline in the acute
treatment of adolescent major depression. J Am Acad Child Adolesc Psychiatry 1996; 35:
1139-44.
25. March J, Silva S, Petrycki S, et al. Fluoxetine, cognitive-behavioral therapy, and their combination
for adolescents with depression: Treatment for Adolescents With Depression Study (TADS)
randomized controlled trial. JAMA 2004; 292: 807-20.
26. Paxil Japanese post marketing paediatric study in depression (double-blind, placebo controlled
study) [clinical trial]. ClinicalTrials.gov Identifier: NCT00812812.
www.clinicaltrials.gov/ct2/show/study/NCT00812812?term=A+randomised%2C+double-bli
nd%2C+placebo+controlled%2C+parallel+group%2C+flexible+dose+study+to+evaluate+th
e+efficacy+and+safety+of+Paxil%C2%AE+Tablets+in+children+and+adolescents+with+M
ajor+Depressive+Disorder&rank=1 (accessed May 22, 2015).
27. Puig-Antich J, Perel JM, Lupatkin W, et al. Imipramine in prepubertal major depressive disorders.
Arch Gen Psychiatry 1987; 44: 81-9.
28. von Knorring AL, Olsson GI, Thomsen PH, Lemming OM, Hultén A. A randomized, double-blind,
placebo-controlled study of citalopram in adolescents with major depressive disorder. J Clin
Psychopharmacol 2006; 26: 311-5.
29. Wagner KD, Ambrosini P, Rynn M, et al. Efficacy of sertraline in the treatment of children and
adolescents with major depressive disorder: two randomized controlled trials. JAMA 2003;
290: 1033-41.

17
30. Wagner KD, Robb AS, Findling RL, Jin J, Gutierrez MM, Heydorn WE. A randomized,
placebo-controlled trial of citalopram for the treatment of major depression in children and
adolescents. Am J Psychiatry 2004; 161: 1079-83.
31. Wagner KD, Jonas J, Findling RL, Ventura D, Saikali K. A double-blind, randomized,
placebo-controlled trial of escitalopram in the treatment of pediatric depression. J Am Acad
Child Adolesc Psychiatry 2006; 45: 280-8.

18
APPENDIX 7
Risk of bias assessment

19
Risk of bias graph: it is a plot of the distribution of judgments (Yes, No, Unclear) across studies
for each risk of bias entry

20

21
Risk of bias summary: it is a summary table of review authors’ judgments for each risk of bias
entriy for each study

22
APPENDIX 8
Network plot for each outcome

23
Network of eligible comparisons for discontinuation due to adverse events (tolerability)
Network of eligible comparisons for response rate.

24
Network of eligible comparisons for all-cause discontinuation (acceptability)
Network of eligible comparisons for suicidal behavior or ideation (suicide-related outcome)

25
APPENDIX 9
Results from pairwise meta-analysis for each outcome:
numbers, estimates and heterogeneity
26
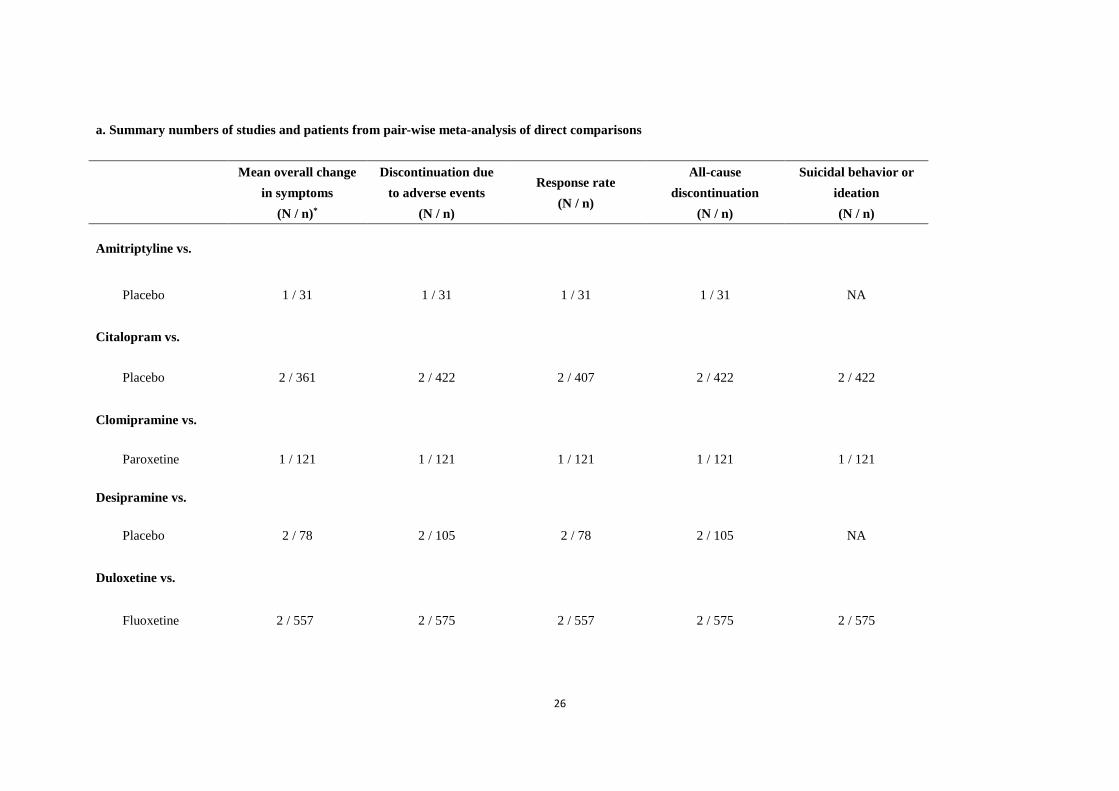
a. Summary numbers of studies and patients from pair-wise meta-analysis of direct comparisons
Mean overall change
in symptoms
(N / n)*
Discontinuation due
to adverse events
(N / n)
Response rate
(N / n)
All-cause
discontinuation
(N / n)
Suicidal behavior or
ideation
(N / n)
Amitriptyline vs.
Placebo 1 / 31 1 / 31 1 / 31 1 / 31 NA
Citalopram vs.
Placebo 2 / 361 2 / 422 2 / 407 2 / 422 2 / 422
Clomipramine vs.
Paroxetine 1 / 121 1 / 121 1 / 121 1 / 121 1 / 121
Desipramine vs.
Placebo 2 / 78 2 / 105 2 / 78 2 / 105 NA
Duloxetine vs.
Fluoxetine 2 / 557 2 / 575 2 / 557 2 / 575 2 / 575
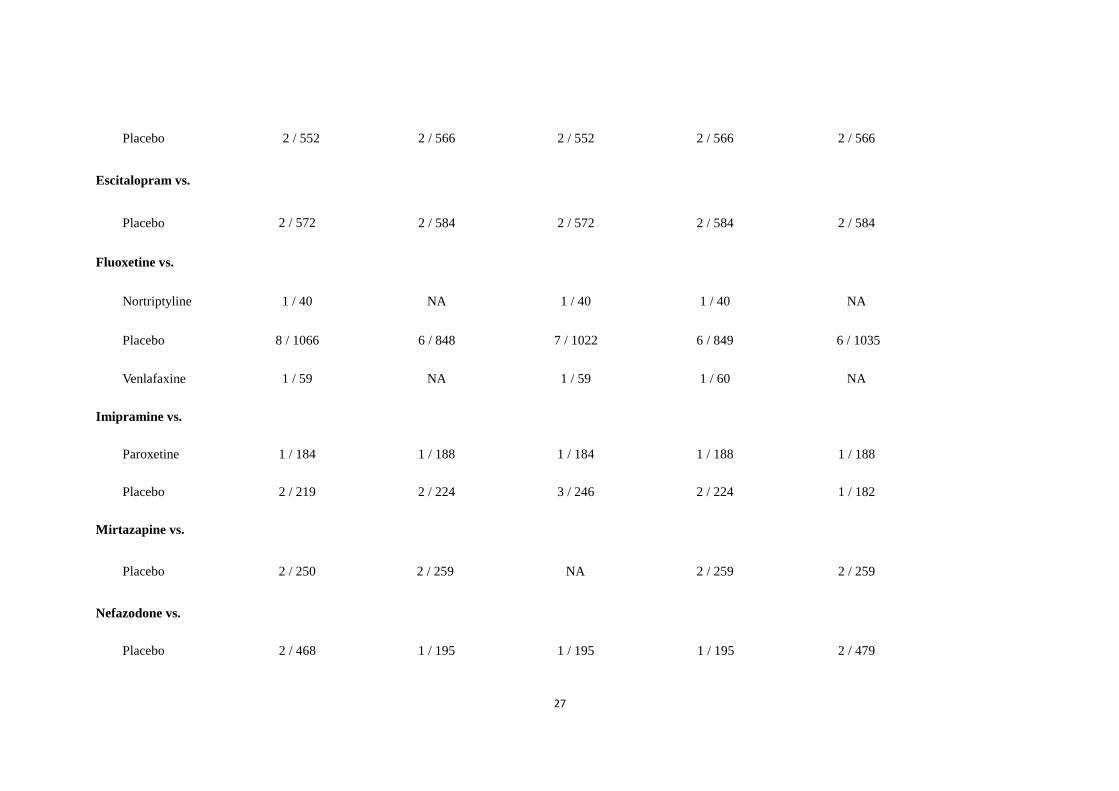
27
Placebo 2 / 552 2 / 566 2 / 552 2 / 566 2 / 566
Escitalopram vs.
Placebo 2 / 572 2 / 584 2 / 572 2 / 584 2 / 584
Fluoxetine vs.
Nortriptyline 1 / 40 NA 1 / 40 1 / 40 NA
Placebo 8 / 1066 6 / 848 7 / 1022 6 / 849 6 / 1035
Venlafaxine 1 / 59 NA 1 / 59 1 / 60 NA
Imipramine vs.
Paroxetine 1 / 184 1 / 188 1 / 184 1 / 188 1 / 188
Placebo 2 / 219 2 / 224 3 / 246 2 / 224 1 / 182
Mirtazapine vs.
Placebo 2 / 250 2 / 259 NA 2 / 259 2 / 259
Nefazodone vs.
Placebo 2 / 468 1 / 195 1 / 195 1 / 195 2 / 479

28
* N= number of studies; n= number of patients;
NA= not available.
Nortriptyline vs.
Placebo 2 / 81 NA 2 / 81 1 / 60 NA
Paroxetine vs.
Placebo 4 / 702 4 / 728 4 / 702 4 / 728 4 / 728
Sertraline vs.
Placebo 2 / 364 2 / 376 2 / 364 2 / 376 2 / 376
Venlafaxine vs.
Placebo 2 / 334 2 / 367 2 / 328 2 / 367 2 / 367

29
b. Summary estimates from pair-wise meta-analysis of direct comparisons*
Mean overall change
in symptoms
SMD (95% CI)
Discontinuation due
to adverse events
OR (95% CI)
Response rate
OR (95% CI)
All-cause
discontinuation
OR (95% CI)
Suicidal behavior or
ideation
OR (95% CI)
Amitriptyline vs.
Placebo 0·09 (-0·63 to 0·80) 0·71 (0·04 to 12·43) 0·47 (0·08 to 2·94) 1·67 (0·33 to 8·42) NA
Citalopram vs.
Placebo -0·18 (-0·51 to 0·15) 1·32 (0·64 to 2·72) 1·05 (0·71 to 1·56) 0·99 (0·65 to 1·51) 1·39 (0·48 to 4·01)
Clomipramine vs.
Paroxetine 0·49 (0·13 to 0·85) 1·01 (0·43 to 2·38) 0·50 (0·24 to 1·04) 1·52 (0·72 to 3·20) 0·82 (0·29 to 2·38)
Desipramine vs.
Placebo -0·46 (-1·48 to 0·57)# 2·52 (0·10 to 65·72) 1·76 (0·70 to 4·42) 2·38 (0·80 to 7·02) NA
Duloxetine vs.
Fluoxetine -0·09 (-0·26 to 0·08) 3·17 (0·61 to 16·57) 1·34 (0·93 to 1·91) 1·15 (0·78 to 1·68) 0·92 (0·56 to 1·51)

30
Placebo -0·11 (-0·30 to 0·08) 2·75 (1·18 to 6·44) 1·39 (0·97 to 1·99) 1·31 (0·71 to 2·40) 0·90 (0·55 to 1·48)
Escitalopram vs.
Placebo -0·17 (-0·34 to -0·01) 1·90 (0·44 to 8·28) 1·58 (1·13 to 2·20) 1·47 (0·96 to 2·24) 0·99 (0·47 to 2·08)
Fluoxetine vs.
Nortriptyline -4·33 (-5·48 to -3·17) NA 9·00 (1·64 to 49·45) 0·44 (0·07 to 2·76) NA
Placebo -0·26 (-0·50 to -0·03) 1·09 (0·44 to 2·72) 1·69 (1·11 to 2·58) 0·87 (0·54 to 1·40) 1·12 (0·72 to 1·73)
Venlafaxine 0·00 (-0·51 to 0·51) NA 0·81 (0·27 to 2·43) 1·00 (0·06 to 16·76) NA
Imipramine vs.
Paroxetine 0·27 (-0·02 to 0·56) 4·31 (1·91 to 9·71) 0·57 (0·32 to 1·04) 1·72 (0·93 to 3·17) 0·48 (0·09 to 2·68)
Placebo 0·00 (-0·27 to 0·26) 6·23 (2·45 to 15·88) 1·03 (0·62 to 1·70) 2·74 (0·78to 9·57) 1·85 (0·17 to 20·76)
Mirtazapine vs.
Placebo -0·23 (-0·52 to 0·05) 1·51 (0·39 to 5·88) NA 0·91 (0·48 to 1·74) 1·58 (0·06 to 39·29)
Nefazodone vs.
Placebo -0·14 (-0·39 to 0·11) 1·98 (0·35 to 11·06) 2·25 (1·27 to 3·99) 0·55 (0·30 to 1·00) NA

31
Significant results are bolded and underscored. SMD=standardized mean difference, OR=odds ratio, CI=confidence interval, NA= not available.
*DerSimonian R, Laird N. Metaanalysis in clinical trials. Control Clin Trials 1986; 7: 177–87.
#: for Kutcher 1994 we used the following standard deviations (7.56 for desipramine and 7.38 for placebo) rather than the standard deviations used in the Cochrane review by
Hazell & Mirzaie, 2013 (4.61 and 4.32, respectively), as reported in the original publication of the trial and confirmed by the study author.
Nortriptyline vs.
Placebo -0·11 (-0·55 to 0·34) NA 1·11 (0·19 to 6·59) 0·62 (0·16 to 2·45) NA
Paroxetine vs.
Placebo -0·10 (-0·26 to 0·05) 1·68 (0·91 to 3·09) 1·33 (0·98 to 1·80) 1·28 (0·91 to 1·79) 1·44 (0·44 to 4·74)
Sertraline vs.
Placebo -0·23 (-0·44 to -0·03) 3·60 (1·30 to 9·96) 1·52 (1·00 to 2·31) 1·52 (0·48 to 4·82) 1·92 (0·33 to 11·06)
Venlafaxine vs.
Placebo -0·14 (-0·36 to 0·07) 3·86 (1·40 to 10·63) 1·08 (0·69 to 1·67) 1·26 (0·80 to 1·97) 9·11 (1·14 to 73·00)

32
c. Heterogeneity test result, I2 and heterogeneity estimate
Mean overall change in symptoms (efficacy)
No. of studies P-value I2 τ2
Citalopram vs Placebo* 2 0·1109 60·7% 0·0345
Desipramine vs Placebo* 2 0·0275 79·40% 0·4333
Duloxetine vs Placebo 2 0·2723 17·00% 0·0033
Duloxetine vs Fluoxetine 2 0·6900 0·0% 0·0000
Escitalopram vs Placebo 2 0·6070 0·0% 0·0000
Fluoxetine vs Placebo* 8 0·0031 67·4% 0·0679
Imipramine vs Placebo 2 0·6430 0·0% 0·0000
Mirtazapine vs Placebo 2 0·2810 14·0% 0·0058
Nefazodone vs Placebo 2 0·1845 43·2% 0·0141
Nortriptyline vs Placebo 2 0·3214 0·0% 0·0000
Paroxetine vs Placebo 4 0·3927 0·0% 0·0000
Sertraline vs Placebo 2 0·7951 0·0% 0·0000
Venlafaxine vs Placebo 2 0·9094 0·0% 0·0000
* The comparisons between citalopram and placebo, between desipramine and placebo, and between
fluoxetine and placebo had higher I2 values than the other comparisons.
Discontinuation due to adverse events (tolerability)
No. of studies P-value I2 τ2
Citalopram vs Placebo 2 0·4895 0·0% 0·0000
Desipramine vs Placebo* 2 0·0463 74·8% 4·1445
Duloxetine vs Placebo 2 0·9857 0·0% 0·0000
Duloxetine vs Fluoxetine* 2 0·1311 56·1% 0·8710
Escitalopram vs Placebo 2 0·3594 0·0% 0·0000
Fluoxetine vs Placebo 5 0·2413 27·0% 0·2926
Mirtazapine vs Placebo 2 0·4774 0·0% 0·0000
Paroxetine vs Placebo 4 0·4038 0·0% 0·0000
* The comparisons between desipramine and placebo, duloxetine and fluoxetine had higher I2 values
than the other comparisons.

33
Respnse rate
No. of studies P-value I2 τ2
Citalopram vs Placebo 2 0·8360 0·0% 0·0000
Desipramine vs Placebo 2 0·8019 0·0% 0·0000
Duloxetine vs Placebo 2 0·6381 0·0% 0·0000
Duloxetine vs Fluoxetine 2 0·6504 0·0% 0·0000
Escitalopram vs Placebo 2 0·9054 0·0% 0·0000
Fluoxetine vs Placebo* 7 0·0395 54·7% 0·1585
Imipramine vs Placebo 3 0·6500 0·0% 0·0000
Nortriptyline vs Placebo 2 0·1710 46·6% 0·8253
Paroxetine vs Placebo 4 0·3958 0·0% 0·0000
Venlafaxine vs Placebo 2 0·7899 0·0% 0·0000
* The comparison between fluoxetine and placebo had a higher I2 value than the other comparisons.
All-cause discontinuation
No. of studies P-value I2 τ2
Citalopram vs Placebo 2 0·6071 0·0% 0·0000
Desipramine vs Placebo 2 0·2480 25·1% 0·1567
Duloxetine vs Placebo* 2 0·1379 54·6% 0·1074
Duloxetine vs Fluoxetine 2 0·8322 0·0% 0·0000
Escitalopram vs Placebo 2 0·6838 0·0% 0·0000
Fluoxetine vs Placebo* 8 0·0215 57·4% 0·2378
Imipramine vs Placeb 2 0·2529 23·5% 0·3740
Mirtazapine vs Placebo 2 0·5374 0·0% 0·0000
Paroxetine vs Placebo 4 0·7785 0·0% 0·0000
Sertraline vs Placebo* 2 0·0279 79·3% 0·5501
* The comparisons between duloxetine and placebo, between fluoxetine and placebo, sertraline and
placebo had higher I2 values than the other comparisons.
Suicidal behavior or ideation
No. of studies P-value I2 τ2
Citalopram vs Placebo 2 0·3090 3·4% 0·0325
Duloxetine vs Placebo 2 0·9188 0·0% 0·0000
Duloxetine vs Fluoxetine 2 0·8295 0·0% 0·0000
Escitalopram vs Placebo 2 0·4711 0·0% 0·0000
Fluoxetine vs Placebo 6 0·5271 0·0% 0·0000
Paroxetine vs Placebo 4 0·3127 15·8% 0·2427
Sertraline vs Placebo 2 0·2947 8·9% 0·1630
Venlafaxine vs Placebo 2 0·8789 0·0% 0·0000

34
Appendix 10
The results of network meta-analysis for secondary outcomes
35
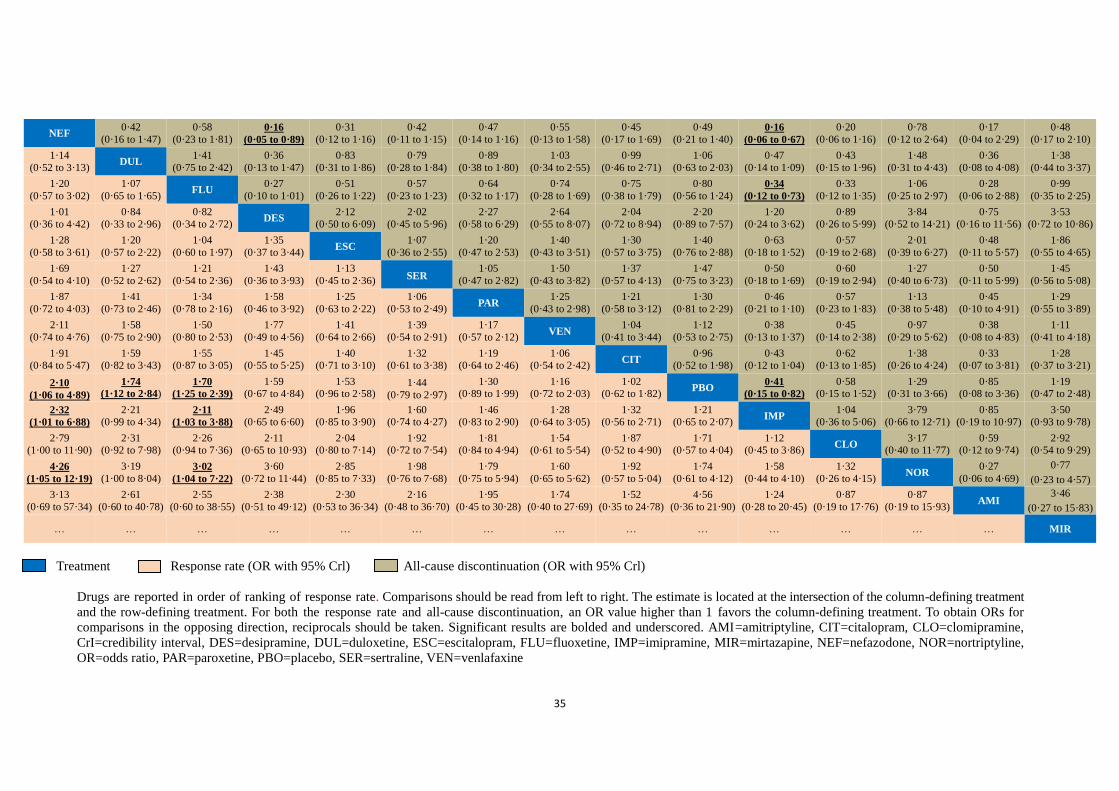
Treatment Response rate (OR with 95% Crl) All-cause discontinuation (OR with 95% Crl)
Drugs are reported in order of ranking of response rate. Comparisons should be read from left to right. The estimate is located at the intersection of the column-defining treatment
and the row-defining treatment. For both the response rate and all-cause discontinuation, an OR value higher than 1 favors the column-defining treatment. To obtain ORs for
comparisons in the opposing direction, reciprocals should be taken. Significant results are bolded and underscored. AMI=amitriptyline, CIT=citalopram, CLO=clomipramine,
CrI=credibility interval, DES=desipramine, DUL=duloxetine, ESC=escitalopram, FLU=fluoxetine, IMP=imipramine, MIR=mirtazapine, NEF=nefazodone, NOR=nortriptyline,
OR=odds ratio, PAR=paroxetine, PBO=placebo, SER=sertraline, VEN=venlafaxine
NEF 0·42
(0·16 to 1·47)
0·58
(0·23 to 1·81) 0·16
(0·05 to 0·89)
0·31
(0·12 to 1·16)
0·42
(0·11 to 1·15)
0·47
(0·14 to 1·16)
0·55
(0·13 to 1·58)
0·45
(0·17 to 1·69)
0·49
(0·21 to 1·40) 0·16
(0·06 to 0·67)
0·20
(0·06 to 1·16)
0·78
(0·12 to 2·64)
0·17
(0·04 to 2·29)
0·48
(0·17 to 2·10)
1·14
(0·52 to 3·13) DUL
1·41
(0·75 to 2·42)
0·36
(0·13 to 1·47)
0·83
(0·31 to 1·86)
0·79
(0·28 to 1·84)
0·89
(0·38 to 1·80)
1·03
(0·34 to 2·55)
0·99
(0·46 to 2·71)
1·06
(0·63 to 2·03)
0·47
(0·14 to 1·09)
0·43
(0·15 to 1·96)
1·48
(0·31 to 4·43)
0·36
(0·08 to 4·08)
1·38
(0·44 to 3·37)
1·20
(0·57 to 3·02)
1·07
(0·65 to 1·65) FLU
0·27
(0·10 to 1·01)
0·51
(0·26 to 1·22)
0·57
(0·23 to 1·23)
0·64
(0·32 to 1·17)
0·74
(0·28 to 1·69)
0·75
(0·38 to 1·79)
0·80
(0·56 to 1·24) 0·34
(0·12 to 0·73)
0·33
(0·12 to 1·35)
1·06
(0·25 to 2·97)
0·28
(0·06 to 2·88)
0·99
(0·35 to 2·25)
1·01
(0·36 to 4·42)
0·84
(0·33 to 2·96)
0·82
(0·34 to 2·72) DES
2·12
(0·50 to 6·09)
2·02
(0·45 to 5·96)
2·27
(0·58 to 6·29)
2·64
(0·55 to 8·07)
2·04
(0·72 to 8·94)
2·20
(0·89 to 7·57)
1·20
(0·24 to 3·62)
0·89
(0·26 to 5·99)
3·84
(0·52 to 14·21)
0·75
(0·16 to 11·56)
3·53
(0·72 to 10·86)
1·28
(0·58 to 3·61)
1·20
(0·57 to 2·22)
1·04
(0·60 to 1·97)
1·35
(0·37 to 3·44) ESC
1·07
(0·36 to 2·55)
1·20
(0·47 to 2·53)
1·40
(0·43 to 3·51)
1·30
(0·57 to 3·75)
1·40
(0·76 to 2·88)
0·63
(0·18 to 1·52)
0·57
(0·19 to 2·68)
2·01
(0·39 to 6·27)
0·48
(0·11 to 5·57)
1·86
(0·55 to 4·65)
1·69
(0·54 to 4·10)
1·27
(0·52 to 2·62)
1·21
(0·54 to 2·36)
1·43
(0·36 to 3·93)
1·13
(0·45 to 2·36) SER 1·05
(0·47 to 2·82)
1·50
(0·43 to 3·82)
1·37
(0·57 to 4·13)
1·47
(0·75 to 3·23)
0·50
(0·18 to 1·69)
0·60
(0·19 to 2·94)
1·27
(0·40 to 6·73)
0·50
(0·11 to 5·99)
1·45
(0·56 to 5·08)
1·87
(0·72 to 4·03)
1·41
(0·73 to 2·46)
1·34
(0·78 to 2·16)
1·58
(0·46 to 3·92)
1·25
(0·63 to 2·22)
1·06
(0·53 to 2·49) PAR
1·25
(0·43 to 2·98)
1·21
(0·58 to 3·12)
1·30
(0·81 to 2·29)
0·46
(0·21 to 1·10)
0·57
(0·23 to 1·83)
1·13
(0·38 to 5·48)
0·45
(0·10 to 4·91)
1·29
(0·55 to 3·89)
2·11
(0·74 to 4·76)
1·58
(0·75 to 2·90)
1·50
(0·80 to 2·53)
1·77
(0·49 to 4·56)
1·41
(0·64 to 2·66)
1·39
(0·54 to 2·91)
1·17
(0·57 to 2·12) VEN
1·04
(0·41 to 3·44)
1·12
(0·53 to 2·75)
0·38
(0·13 to 1·37)
0·45
(0·14 to 2·38)
0·97
(0·29 to 5·62)
0·38
(0·08 to 4·83)
1·11
(0·41 to 4·18)
1·91 (0·84 to 5·47)
1·59 (0·82 to 3·43)
1·55 (0·87 to 3·05)
1·45 (0·55 to 5·25)
1·40 (0·71 to 3·10)
1·32 (0·61 to 3·38)
1·19 (0·64 to 2·46)
1·06 (0·54 to 2·42)
CIT 0·96
(0·52 to 1·98) 0·43
(0·12 to 1·04) 0·62
(0·13 to 1·85) 1·38
(0·26 to 4·24) 0·33
(0·07 to 3·81) 1·28
(0·37 to 3·21)
2·10
(1·06 to 4·89)
1·74
(1·12 to 2·84) 1·70
(1·25 to 2·39)
1·59 (0·67 to 4·84)
1·53 (0·96 to 2·58)
1·44
(0·79 to 2·97)
1·30 (0·89 to 1·99)
1·16 (0·72 to 2·03)
1·02 (0·62 to 1·82)
PBO 0·41
(0·15 to 0·82)
0·58 (0·15 to 1·52)
1·29 (0·31 to 3·66)
0·85 (0·08 to 3·36)
1·19 (0·47 to 2·48)
2·32
(1·01 to 6·88)
2·21
(0·99 to 4·34) 2·11
(1·03 to 3·88)
2·49
(0·65 to 6·60)
1·96
(0·85 to 3·90)
1·60
(0·74 to 4·27)
1·46
(0·83 to 2·90)
1·28
(0·64 to 3·05)
1·32
(0·56 to 2·71)
1·21
(0·65 to 2·07) IMP
1·04
(0·36 to 5·06)
3·79
(0·66 to 12·71)
0·85
(0·19 to 10·97)
3·50
(0·93 to 9·78)
2·79 (1·00 to 11·90)
2·31 (0·92 to 7·98)
2·26 (0·94 to 7·36)
2·11 (0·65 to 10·93)
2·04 (0·80 to 7·14)
1·92 (0·72 to 7·54)
1·81 (0·84 to 4·94)
1·54 (0·61 to 5·54)
1·87 (0·52 to 4·90)
1·71 (0·57 to 4·04)
1·12 (0·45 to 3·86)
CLO 3·17
(0·40 to 11·77) 0·59
(0·12 to 9·74) 2·92
(0·54 to 9·29)
4·26
(1·05 to 12·19)
3·19
(1·00 to 8·04) 3·02
(1·04 to 7·22)
3·60
(0·72 to 11·44)
2·85
(0·85 to 7·33)
1·98
(0·76 to 7·68)
1·79
(0·75 to 5·94)
1·60
(0·65 to 5·62)
1·92
(0·57 to 5·04)
1·74
(0·61 to 4·12)
1·58
(0·44 to 4·10)
1·32
(0·26 to 4·15) NOR
0·27
(0·06 to 4·69)
0·77
(0·23 to 4·57)
3·13
(0·69 to 57·34)
2·61
(0·60 to 40·78)
2·55
(0·60 to 38·55)
2·38
(0·51 to 49·12)
2·30
(0·53 to 36·34)
2·16
(0·48 to 36·70)
1·95
(0·45 to 30·28)
1·74
(0·40 to 27·69)
1·52
(0·35 to 24·78)
4·56
(0·36 to 21·90)
1·24
(0·28 to 20·45)
0·87
(0·19 to 17·76)
0·87
(0·19 to 15·93) AMI
3·46
(0·27 to 15·83)
… … … … … … … … … … … … … … MIR

36
APPENDIX 11
Assessment of inconsistency results for each outcome:
global, local and from the node-splitting model
37
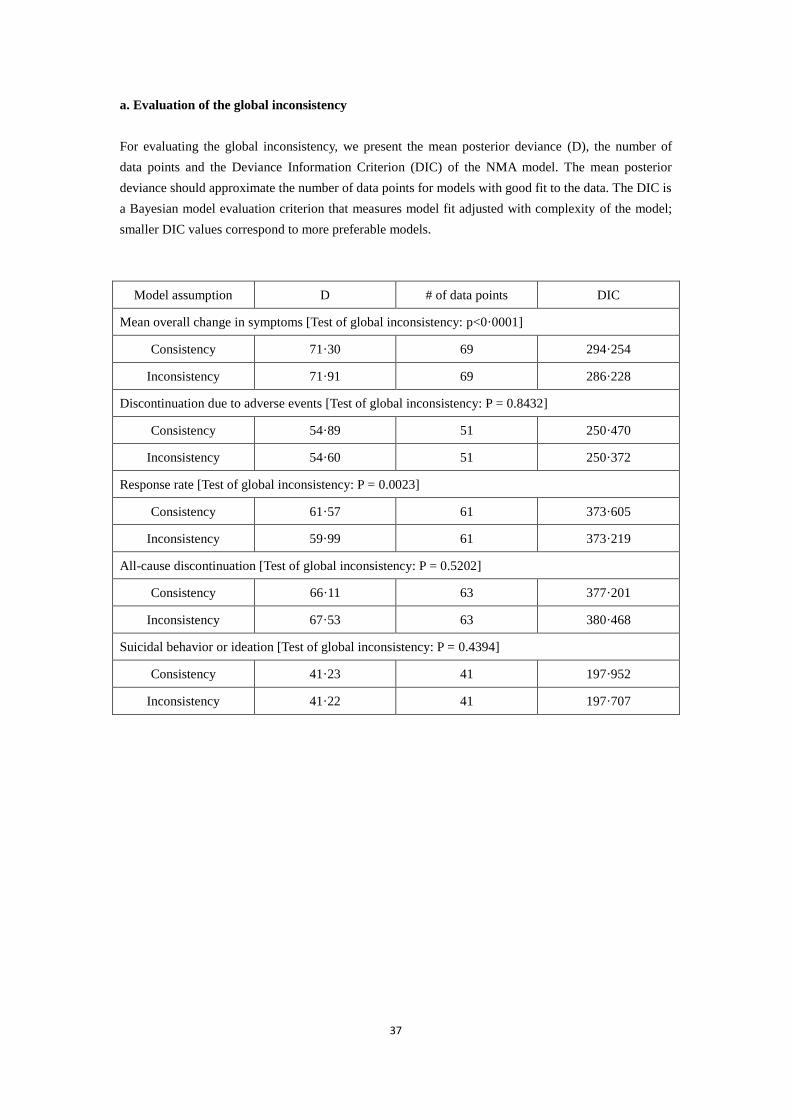
a. Evaluation of the global inconsistency
For evaluating the global inconsistency, we present the mean posterior deviance (D), the number of
data points and the Deviance Information Criterion (DIC) of the NMA model. The mean posterior
deviance should approximate the number of data points for models with good fit to the data. The DIC is
a Bayesian model evaluation criterion that measures model fit adjusted with complexity of the model;
smaller DIC values correspond to more preferable models.
Model assumption D # of data points DIC
Mean overall change in symptoms [Test of global inconsistency: p<0·0001]
Consistency 71·30 69 294·254
Inconsistency 71·91 69 286·228
Discontinuation due to adverse events [Test of global inconsistency: P = 0.8432]
Consistency 54·89 51 250·470
Inconsistency 54·60 51 250·372
Response rate [Test of global inconsistency: P = 0.0023]
Consistency 61·57 61 373·605
Inconsistency 59·99 61 373·219
All-cause discontinuation [Test of global inconsistency: P = 0.5202]
Consistency 66·11 63 377·201
Inconsistency 67·53 63 380·468
Suicidal behavior or ideation [Test of global inconsistency: P = 0.4394]
Consistency 41·23 41 197·952
Inconsistency 41·22 41 197·707

38
b. Evaluation of the local inconsistency
Tests of local inconsistency revealed that the percentages for inconsistent loops were to be expected
according to empirical data with the methods of Veroniki et al (Int J Epidemiol 2013; 42:332-45).
Mean overall change in symptoms
Loop IF z-value P-value 95%CI τ²
FLU-NOR-PBO 4·191 5·868 <0·0001 (2·79,5·59) 0·0650
DUL-FLU-PBO 0·429 2·167 0·0302 (0·04,0·82) 0·0100
IMP-PAR-PBO 0·220 0·999 0·3177 (0·00,0·65) 0·0000
FLU-PBO-VEN 0·124 0·299 0·7653 (0·00,0·94) 0·0532

39
Discontinuation due to adverse events
Loop RoR z-value P-value 95%CI τ²
DUL-FLU-PBO 1·261 0·210 0·8337 (1·00,10·95) 0·342
IMP-PAR-PBO 1·246 0·298 0·7655 (1·00,5·28) 0·000
Response rate
Loop RoR z-value P-value 95%CI τ²
FLU-NEF-PBO 6·827 1·601 0·1094 (1·00,71·71) 0·173
DUL-FLU-PBO 2·412 2·785 0·0053 (1·30,4·48) 0·000
FLU-PBO-VEN 1·945 0·880 0·3791 (1·00,8·57) 0·114
IMP-PAR-PBO 1·566 1·026 0·3047 (1·00,3·69) 0·000

40
All-cause discontinuation
Loop RoR z-value P-value 95%CI τ²
FLU-NOR-PBO 3·189 0·837 0·4027 (1·00,48·25) 0·238
DUL-FLU-PBO 1·615 0·836 0·4030 (1·00,4·96) 0·135
FLU-PBO-VEN 1·439 0·222 0·8242 (1·00,35·76) 0·238
IMP-PAR-PBO 1·014 0·028 0·9776 (1·00,2·64) 0·000
Suicidal behavior or ideation
Loop RoR z-value P-value 95%CI τ²
IMP-PAR-PBO 3·514 0·767 0·4432 (1·00,87·33) 0·000
DUL-FLU-PBO 1·505 0·768 0·4425 (1·00,4·28) 0·000

41
c. Evaluation of the inconsistency by node-splitting model
Tests of inconsistency by node-splitting method fitted the node-splitting model of Dias et al (Stat Med
2010; 29:932-44). The results reported the estimated direct and indirect treatment effects and their
difference; the P-value for the difference is the test of consistency.
Mean overall change in symptoms
Comparisons Direct Indirect Difference τ²
SMD SE SMD SE SMD SE P-value
Placebo vs Amitriptyline … … … … … … … …
Placebo vs Citalopram … … … … … … … …
Paroxetine vs Clomipramine -0·49 0·33 -0·31 63·24 -0·18 63·25 0.9977 0·2777
Placebo vs Desipramine … … … … … … … …
Fluoxetine vs Duloxetine 0·10 0·10 -0·87 0·26 0·96 0·28 0·0006 0·0804
Placebo vs Duloxetine 0·11 0·11 1·07 0·26 -0·96 0·28 0·0006 0·0804
Placebo vs Escitalopram … … … … … … … …
Nortriptyline vs Fluoxetine 4·22 0·61 0·15 0·26 4·07 0·66 <0·0001 0·1427
Placebo vs Fluoxetine 0·26 0·14 1·41 0·47 -1·15 0·50 0·0215 0·3305
Venlafaxine vs Fluoxetine 0·00 0·41 0·25 0·28 -0·25 0·50 0·6164 0·3118
Paroxetine vs Imipramine -0·27 0·34 0·04 0·45 -0·31 0·56 0·5796 0·3030
Placebo vs Imipramine 0·03 0·28 -0·32 0·73 0·36 0·78 0·6477 0·3130
Placebo vs Mirtazapine … … … … … … … …
Placebo vs Nefazodone … … … … … … … …
Placebo vs Nortriptyline 0·11 0·25 -3·96 0·62 4·07 0·66 <0·0001 0·1427
Placebo vs Paroxetine 0·14 0·18 0·57 1·07 -0·44 1·09 0·6866 0·3053
Placebo vs Sertraline … … … … … … … …
Placebo vs Venlafaxine 0·14 0·25 0·39 0·43 -0·25 0·50 0·6164 0·3118
Discontinuation due to adverse events
Comparisons Direct Indirect Difference
τ² LogOR SE LogOR SE LogOR SE P-value
Placebo vs Amitriptyline … … … … … … … …
Placebo vs Citalopram … … … … … … … …
Paroxetine vs Clomipramine -0·01 0·44 0·99 151·89 -1·00 151·89 0·9948 0·0000
Placebo vs Desipramine … … … … … … … …
Fluoxetine vs Duloxetine -0·83 0·44 -1·22 1·30 0·39 1·46 0·7898 0·0000
Placebo vs Duloxetine -0·99 0·43 -0·60 1·31 -0·39 1·46 0·7898 0·0000
Placebo vs Escitalopram … … … … … … … …
Placebo vs Fluoxetine … … … … … … … …
Paroxetine vs Imipramine -1·48 0·43 -0·65 1·16 -0·83 1·28 0·5172 0·1284
Placebo vs Imipramine -1·73 0·50 -2·33 1·19 0·60 1·39 0·6662 0·1628

42
Placebo vs Mirtazapine … … … … … … … …
Placebo vs Nefazodone … … … … … … … …
Placebo vs Paroxetine -0·52 0·31 3·12 4·10 -3·64 4·12 0·3765 0·0000
Placebo vs Sertraline … … … … … … … …
Placebo vs Venlafaxine … … … … … … … …
Response rate
Comparisons Direct Indirect Difference
τ² LogOR SE LogOR SE LogOR SE P-value
Placebo vs Amitriptyline … … … … … … … …
Placebo vs Citalopram … … … … … … … …
Paroxetine vs Clomipramine 0·69 0·42 0·58 127·73 0·11 127·73 0·9993 0·1907
Placebo vs Desipramine … … … … … … … …
Fluoxetine vs Duloxetine -0·30 0·18 1·38 0·48 -1·68 0·52 0·0012 0·0000
Placebo vs Duloxetine -0·33 0·18 -2·01 0·48 1·68 0·52 0·0012 0·0000
Placebo vs Escitalopram … … … … … … … …
Nortriptyline vs Fluoxetine -2·20 0·89 -0·18 0·63 -2·02 1·09 0·0633 0·1733
Placebo vs Fluoxetine -0·52 0·16 -0·56 0·56 0·04 0·58 0·9455 0·2028
Venlafaxine vs Fluoxetine 0·21 0·59 -0·49 0·31 0·70 0·67 0·2956 0·1946
Paroxetine e vs Imipramin 0·55 0·36 0·15 0·51 0·40 0·63 0·5218 0·1877
Placebo vs Imipramine -0·00 0·29 0·98 0·74 -0·98 0·80 0·2167 0·1653
Placebo vs Nefazodone … … … … … … … …
Placebo vs Nortriptyline -0·31 0·61 1·71 0·90 -2·02 1·09 0·0633 0·1733
Placebo vs Paroxetine -0·30 0·19 0·31 1·23 -0·61 1·24 0·6243 0·2000
Placebo vs Sertraline … … … … … … … …
Placebo vs Venlafaxine -0·07 0·26 -0·77 0·61 0·70 0·67 0·2956 0·1946
All-cause discontinuation
Comparisons Direct Indirect Difference
τ² LogOR SE LogOR SE LogOR SE P-value
Placebo vs Amitriptyline … … … … … … … …
Placebo vs Citalopram … … … … … … … …
Paroxetine vs Clomipramine -0·42 0·47 0·54 131·44 -0·96 131·44 0·9942 0·2771
Placebo vs Desipramine … … … … … … … …
Fluoxetine vs Duloxetine -0·13 0·24 -1·26 0·61 1·13 0·67 0·0908 0·1885
Placebo vs Duloxetine -0·24 0·25 0·89 0·61 -1·13 0·67 0·0908 0·1885
Placebo vs Escitalopram … … … … … … … …
Nortriptyline vs Fluoxetine 0·81 0·97 -0·30 0·78 1·11 1·25 0·3749 0·2830
Placebo vs Fluoxetine 0·19 0·19 0·69 0·96 -0·49 0·97 0·6138 0·2848
Venlafaxine vs Fluoxetine 0·00 1·47 0·45 0·41 -0·45 1·52 0·7692 0·2814
Paroxetine vs Imipramine -0·54 0·44 -0·85 0·88 0·32 0·99 0·7497 0·3088
Placebo vs Imipramine -0·88 0·44 -0·89 0·96 0·01 1·07 0·9932 0·3095

43
Placebo vs Mirtazapine … … … … … … … …
Placebo e vs Nefazodon … … … … … … … …
Placebo vs Nortriptyline 0·49 0·76 -0·62 0·99 1·11 1·25 0·3749 0·2830
Placebo vs Paroxetine -0·25 0·23 -3·72 3·18 3·47 3·19 0·2769 0·2761
Placebo vs Sertraline … … … … … … … …
Placebo vs Venlafaxine -0·23 0·36 0·22 1·48 -0·45 1·52 0·7692 0·2814
Suicidal behavior or ideation
Comparisons Direct Indirect Difference
τ² LogOR SE LogOR SE LogOR SE P-value
Placebo vs Citalopram … … … … … … … …
Paroxetine vs Clomipramine 0·19 0·54 0·80 186·66 -0·60 186·66 0·9974 0·0000
Fluoxetine vs Duloxetine 0·08 0·25 0·88 0·91 -0·80 0·96 0·4040 0·0000
Placebo vs Duloxetine 0·99 0·25 -0·70 0·91 0·80 0·96 0·4040 0·0000
Placebo vs Escitalopram … … … … … … … …
Placebo vs Fluoxetine … … … … … … … …
Paroxetine vs Imipramine 0·74 0·88 -1·78 2·53 2·51 2·58 0·3301 0·0000
Placebo vs Imipramine -0·61 1·23 1·90 2·03 -2·51 2·58 0·3301 0·0000
Placebo vs Mirtazapine … … … … … … … …
Placebo vs Nefazodone … … … … … … … …
Placebo vs Paroxetine -0·39 0·55 -0·09 93·36 -0·30 93·36 0·9974 0·0000
Placebo vs Sertraline … … … … … … … …
Placebo vs Venlafaxine … … … … … … … …

44
APPENDIX 12
Comparison-adjusted funnel plot for each outcome from the network
meta-analysis

45
Comparison-adjusted funnel plot for mean overall change in symptoms in all comparisons
Comparison-adjusted funnel plot for discontinuation due to adverse events in all comparisons
46
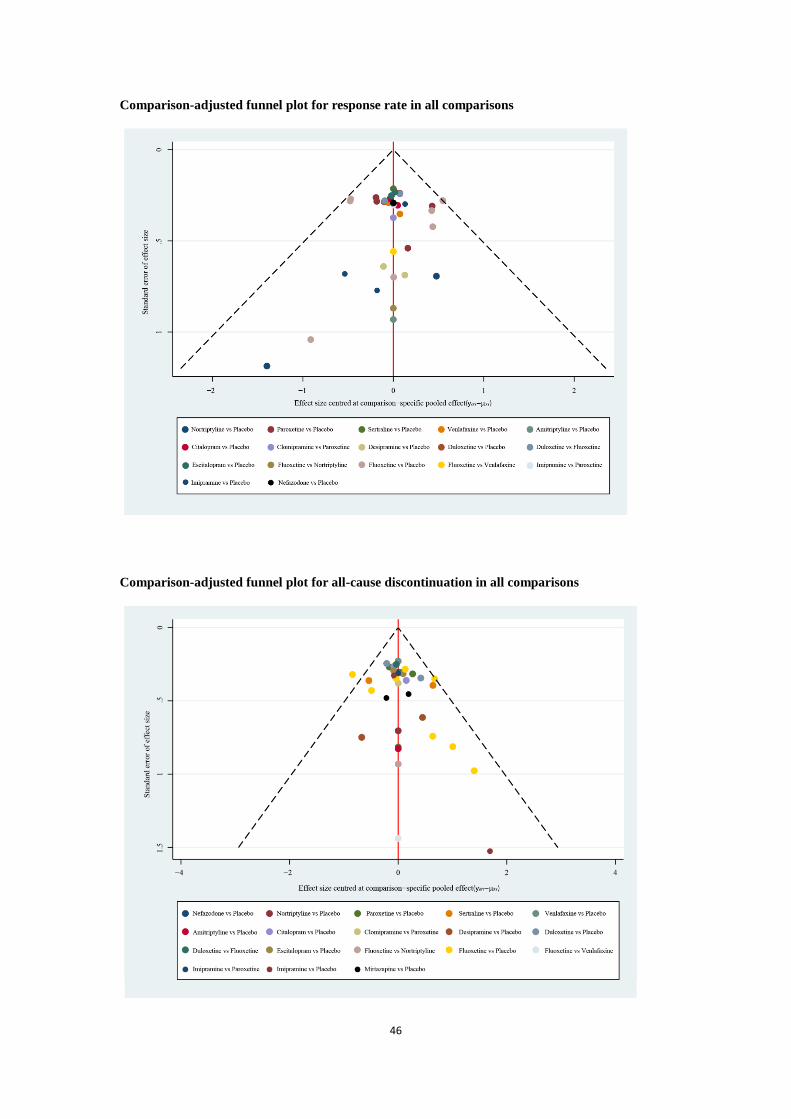
Comparison-adjusted funnel plot for response rate in all comparisons
Comparison-adjusted funnel plot for all-cause discontinuation in all comparisons

47
Comparison-adjusted funnel plot for suicidal behavior or ideation in all comparisons

48
Appendix 13
Treatment ranking and SUCRA plot for each outcome
49
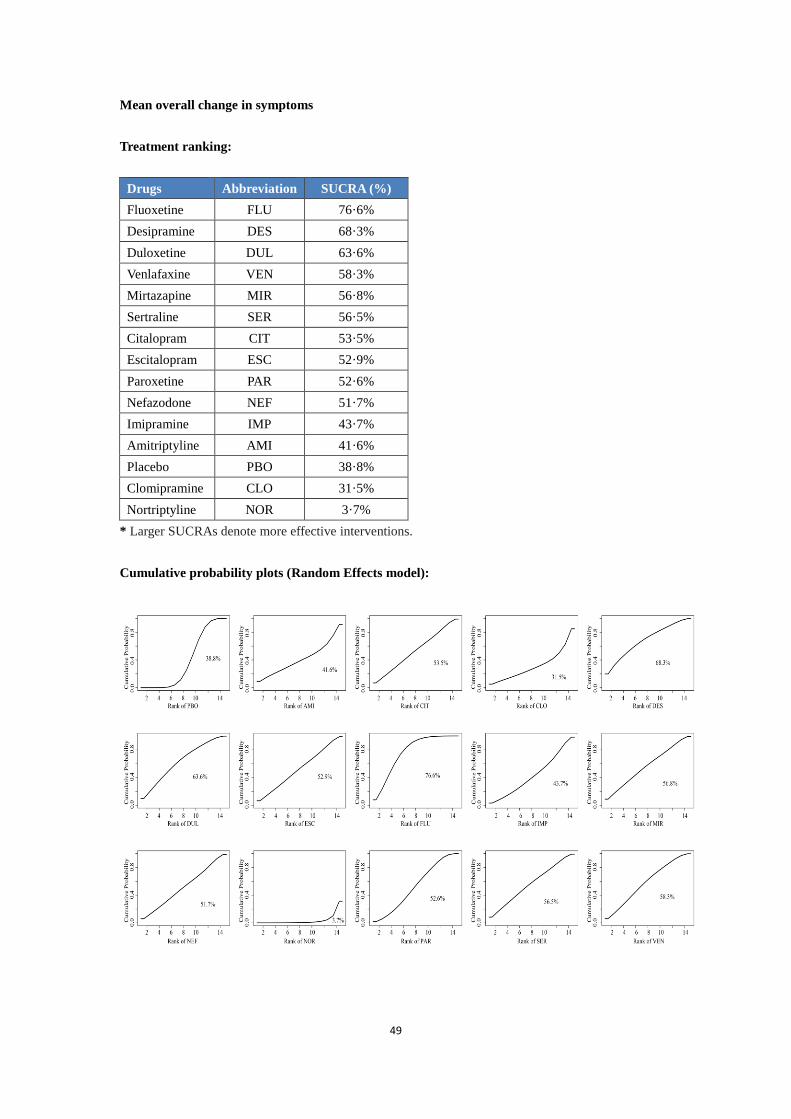
Mean overall change in symptoms
Treatment ranking:
Drugs Abbreviation SUCRA (%)
Fluoxetine FLU 76·6%
Desipramine DES 68·3%
Duloxetine DUL 63·6%
Venlafaxine VEN 58·3%
Mirtazapine MIR 56·8%
Sertraline SER 56·5%
Citalopram CIT 53·5%
Escitalopram ESC 52·9%
Paroxetine PAR 52·6%
Nefazodone NEF 51·7%
Imipramine IMP 43·7%
Amitriptyline AMI 41·6%
Placebo PBO 38·8%
Clomipramine CLO 31·5%
Nortriptyline NOR 3·7%
* Larger SUCRAs denote more effective interventions.
Cumulative probability plots (Random Effects model):

50
Discontinuation due to adverse events
Treatment ranking:
Drugs Abbreviation SUCRA (%)
Placebo PBO 82·5%
Fluoxetine FLU 75·7%
Amitriptyline AMI 72·8%
Citalopram CIT 69·2%
Paroxetine PAR 57·7%
Clomipramine CLO 57·2%
Mirtazapine MIR 55·5%
Nefazodone NEF 48·9%
Escitalopram ESC 47·3%
Duloxetine DUL 33·9%
Desipramine DES 29·6%
Sertraline SER 29·6%
Venlafaxine VEN 27·0%
Imipramine IMP 13·1%
* Larger SUCRAs denote more tolerabale interventions.
Cumulative probability plots (Random Effects model):
51
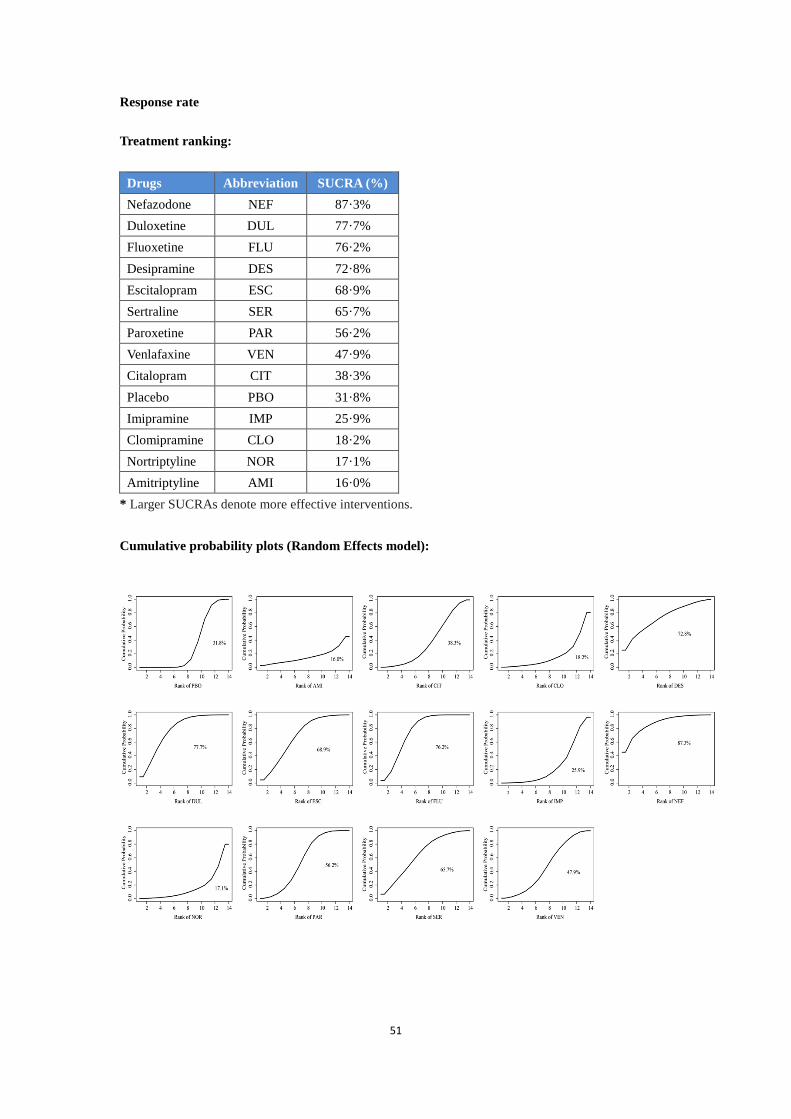
Response rate
Treatment ranking:
Drugs Abbreviation SUCRA (%)
Nefazodone NEF 87·3%
Duloxetine DUL 77·7%
Fluoxetine FLU 76·2%
Desipramine DES 72·8%
Escitalopram ESC 68·9%
Sertraline SER 65·7%
Paroxetine PAR 56·2%
Venlafaxine VEN 47·9%
Citalopram CIT 38·3%
Placebo PBO 31·8%
Imipramine IMP 25·9%
Clomipramine CLO 18·2%
Nortriptyline NOR 17·1%
Amitriptyline AMI 16·0%
* Larger SUCRAs denote more effective interventions.
Cumulative probability plots (Random Effects model):

52
All-cause discontinuation
Treatment ranking:
Drugs Abbreviation SUCRA (%)
Nefazodone NEF 90·4%
Fluoxetine FLU 80·1%
Mirtazapine MIR 68·3%
Placebo PBO 66·1%
Nortriptyline NOR 64·1%
Citalopram CIT 63·5%
Duloxetine DUL 57·6%
Venlafaxine VEN 50·8%
Paroxetine PAR 44·0%
Escitalopram ESC 38·2%
Amitriptyline AMI 36·6%
Sertraline SER 35·3%
Clomipramine CLO 25·4%
Desipramine DES 17·1%
Imipramine IMP 12·5%
* Larger SUCRAs denote more tolerabale interventions.
Cumulative probability plots (Random Effects model):
53
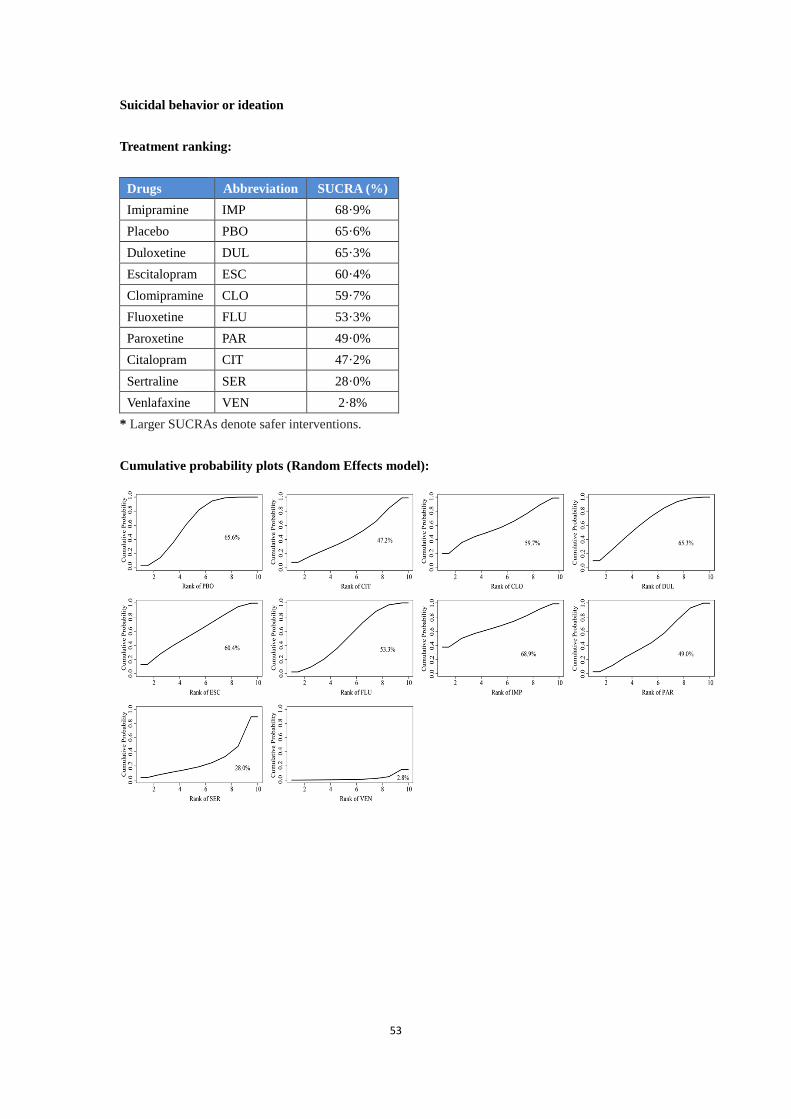
Suicidal behavior or ideation
Treatment ranking:
Drugs Abbreviation SUCRA (%)
Imipramine IMP 68·9%
Placebo PBO 65·6%
Duloxetine DUL 65·3%
Escitalopram ESC 60·4%
Clomipramine CLO 59·7%
Fluoxetine FLU 53·3%
Paroxetine PAR 49·0%
Citalopram CIT 47·2%
Sertraline SER 28·0%
Venlafaxine VEN 2·8%
* Larger SUCRAs denote safer interventions.
Cumulative probability plots (Random Effects model):

54
APPENDIX 14
Contribution matrix and contributions summary of risk of bias assessments for
each outcome

55
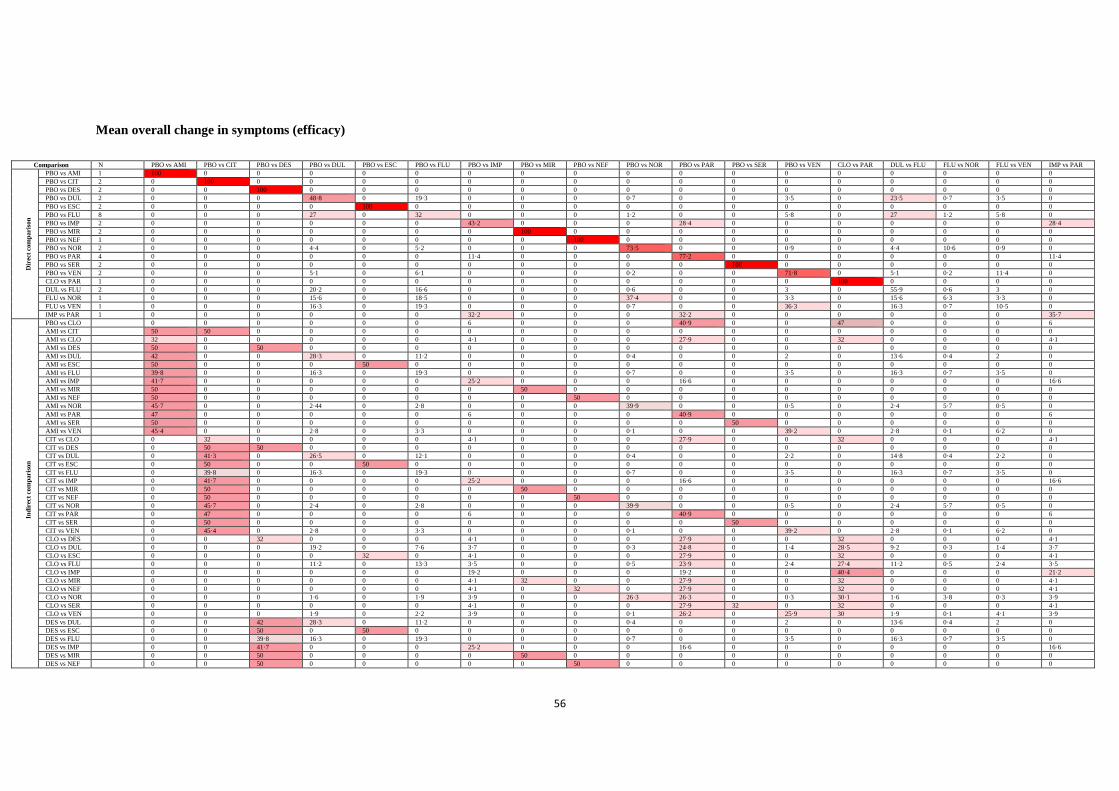
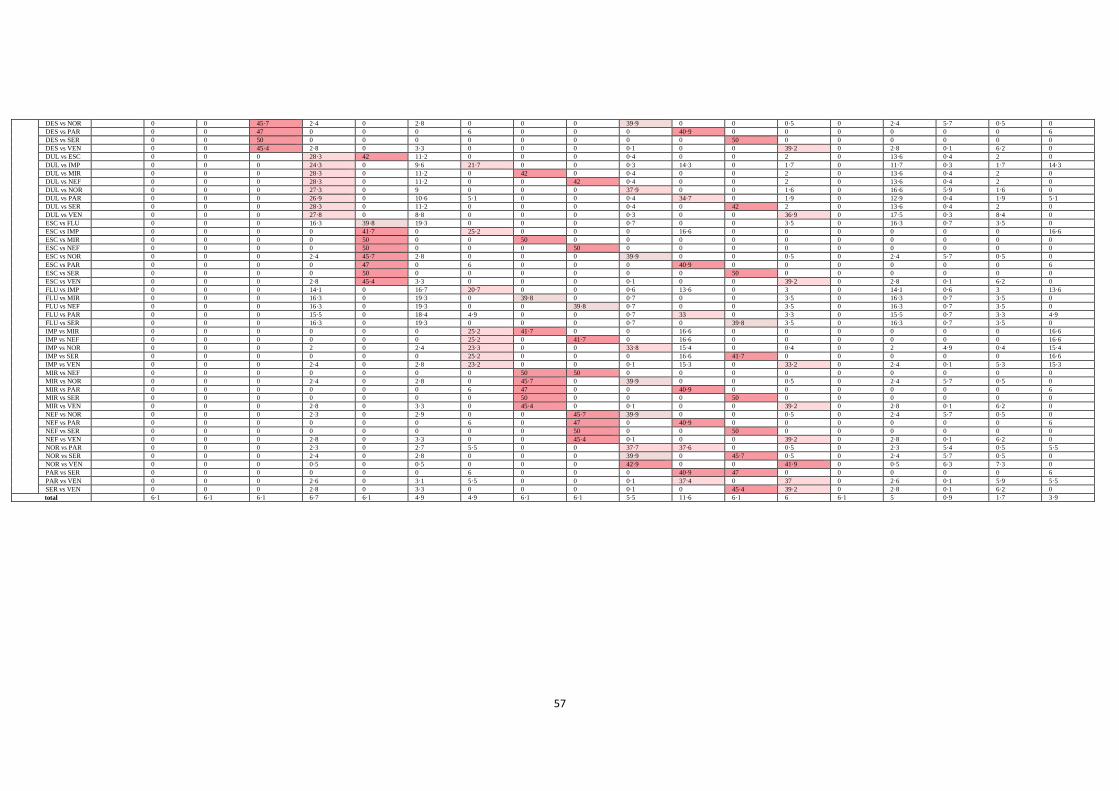
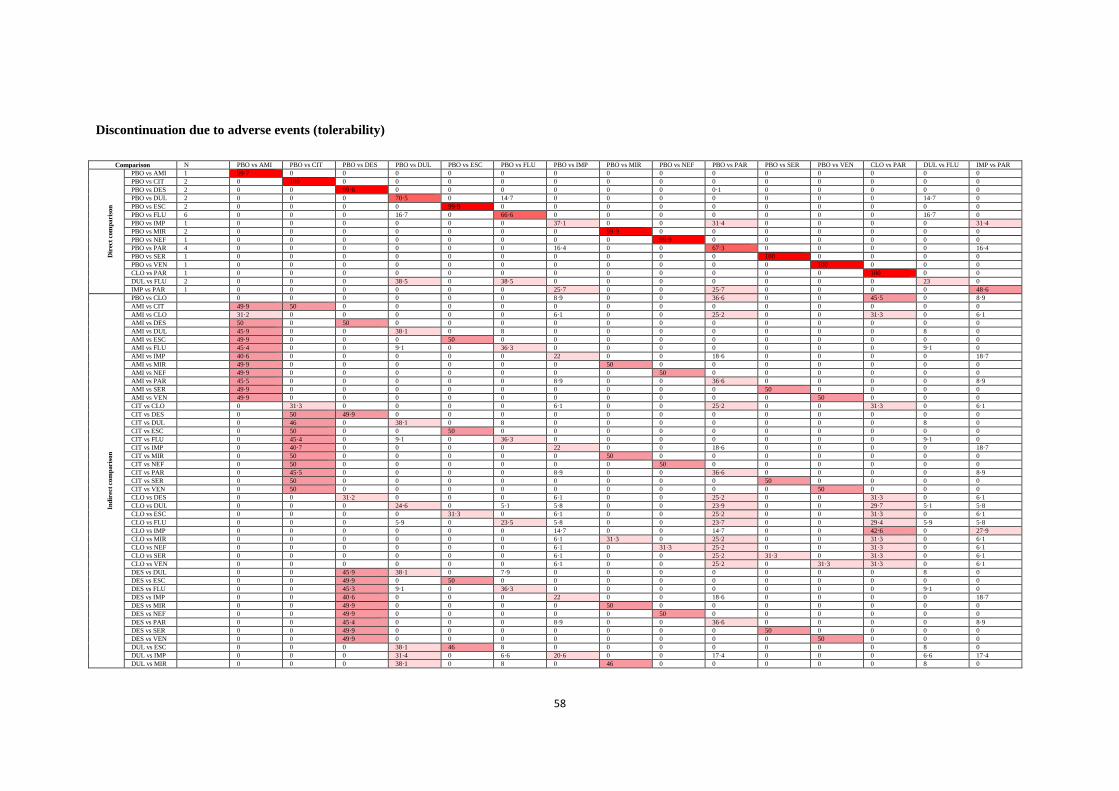
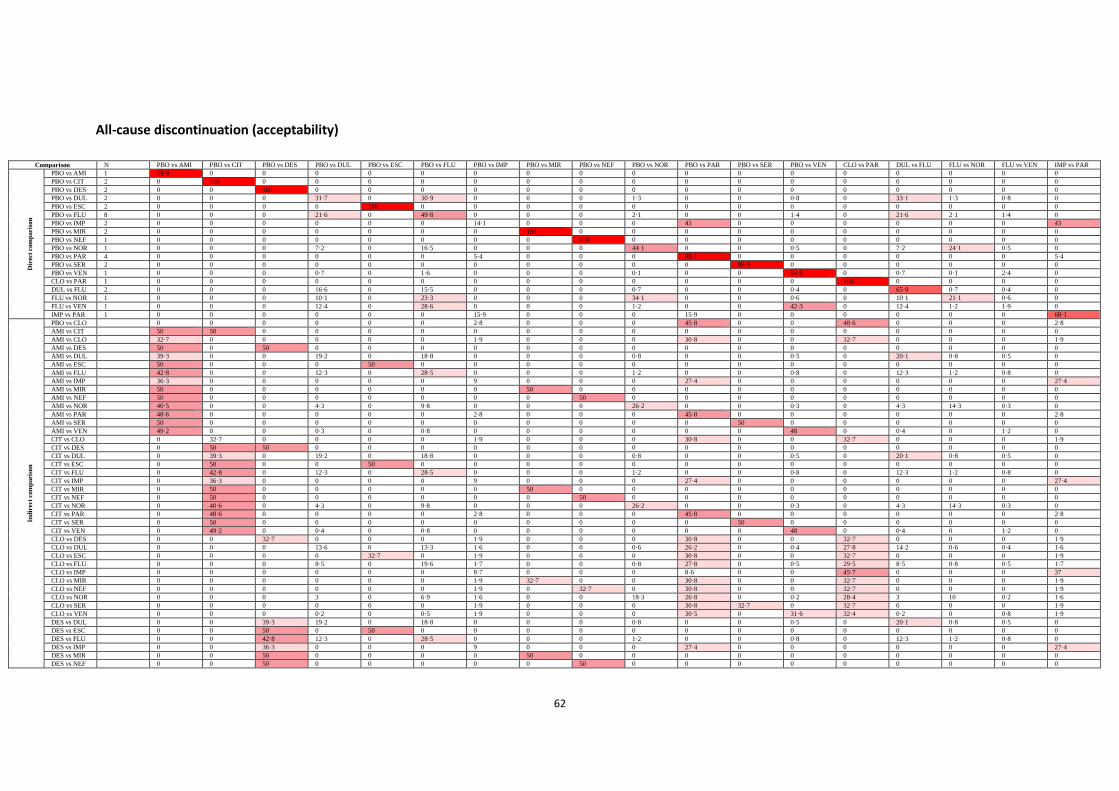
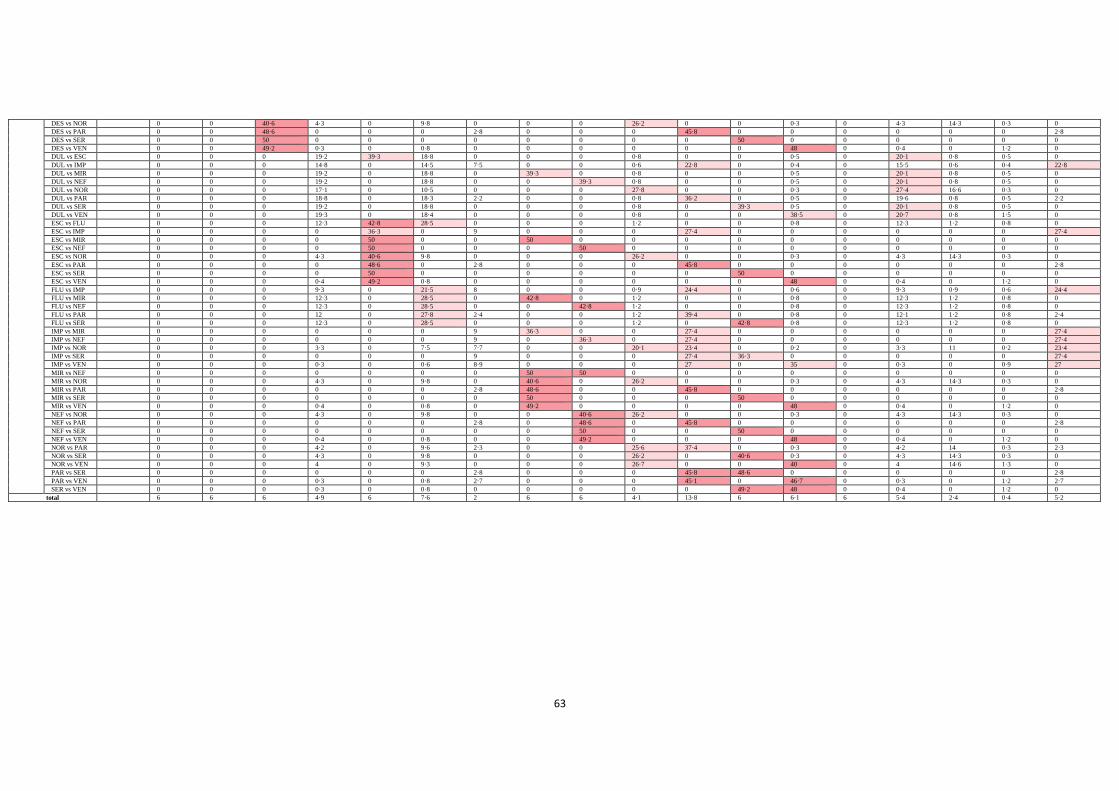
a. The contribution matrix for each outcome
The contributions (expressed as percentage) of direct comparisons (column) to the effect estimates of
mixed or indirect comparisons (row) were calculated with the methods of Chaimani et al (PLoS ONE
8(10): e76654).
AMI=amitriptyline, CIT=citalopram, CLO=clomipramine, DES=desipramine, DUL=duloxetine,
ESC=escitalopram, FLU=fluoxetine, IMP=imipramine, MIR=mirtazapine, NEF=nefazodone,
NOR=nortriptyline, PAR=paroxetine, SER=sertraline, VEN=venlafaxine, PBO=placebo
56
Mean overall change in symptoms (efficacy)
Comparison N PBO vs AMI PBO vs CIT PBO vs DES PBO vs DUL PBO vs ESC PBO vs FLU PBO vs IMP PBO vs MIR PBO vs NEF PBO vs NOR PBO vs PAR PBO vs SER PBO vs VEN CLO vs PAR DUL vs FLU FLU vs NOR FLU vs VEN IMP vs PAR
Dir
ect
com
paris
on
PBO vs AMI 1 100 0 0 0 0 0 0 0 0 0 0 0 0 0 0 0 0 0
PBO vs CIT 2 0 100 0 0 0 0 0 0 0 0 0 0 0 0 0 0 0 0
PBO vs DES 2 0 0 100 0 0 0 0 0 0 0 0 0 0 0 0 0 0 0
PBO vs DUL 2 0 0 0 48·8 0 19·3 0 0 0 0·7 0 0 3·5 0 23·5 0·7 3·5 0
PBO vs ESC 2 0 0 0 0 100 0 0 0 0 0 0 0 0 0 0 0 0 0
PBO vs FLU 8 0 0 0 27 0 32 0 0 0 1·2 0 0 5·8 0 27 1·2 5·8 0
PBO vs IMP 2 0 0 0 0 0 0 43·2 0 0 0 28·4 0 0 0 0 0 0 28·4
PBO vs MIR 2 0 0 0 0 0 0 0 100 0 0 0 0 0 0 0 0 0 0
PBO vs NEF 1 0 0 0 0 0 0 0 0 100 0 0 0 0 0 0 0 0 0
PBO vs NOR 2 0 0 0 4·4 0 5·2 0 0 0 73·5 0 0 0·9 0 4·4 10·6 0·9 0
PBO vs PAR 4 0 0 0 0 0 0 11·4 0 0 0 77·2 0 0 0 0 0 0 11·4
PBO vs SER 2 0 0 0 0 0 0 0 0 0 0 0 100 0 0 0 0 0 0
PBO vs VEN 2 0 0 0 5·1 0 6·1 0 0 0 0·2 0 0 71·8 0 5·1 0·2 11·4 0
CLO vs PAR 1 0 0 0 0 0 0 0 0 0 0 0 0 0 100 0 0 0 0
DUL vs FLU 2 0 0 0 20·2 0 16·6 0 0 0 0·6 0 0 3 0 55·9 0·6 3 0
FLU vs NOR 1 0 0 0 15·6 0 18·5 0 0 0 37·4 0 0 3·3 0 15·6 6·3 3·3 0
FLU vs VEN 1 0 0 0 16·3 0 19·3 0 0 0 0·7 0 0 36·3 0 16·3 0·7 10·5 0
IMP vs PAR 1 0 0 0 0 0 0 32·2 0 0 0 32·2 0 0 0 0 0 0 35·7
In
dir
ect
co
mp
aris
on
PBO vs CLO
0 0 0 0 0 0 6 0 0 0 40·9 0 0 47 0 0 0 6
AMI vs CIT
50 50 0 0 0 0 0 0 0 0 0 0 0 0 0 0 0 0
AMI vs CLO
32 0 0 0 0 0 4·1 0 0 0 27·9 0 0 32 0 0 0 4·1
AMI vs DES
50 0 50 0 0 0 0 0 0 0 0 0 0 0 0 0 0 0
AMI vs DUL
42 0 0 28·3 0 11·2 0 0 0 0·4 0 0 2 0 13·6 0·4 2 0
AMI vs ESC
50 0 0 0 50 0 0 0 0 0 0 0 0 0 0 0 0 0
AMI vs FLU
39·8 0 0 16·3 0 19·3 0 0 0 0·7 0 0 3·5 0 16·3 0·7 3·5 0
AMI vs IMP
41·7 0 0 0 0 0 25·2 0 0 0 16·6 0 0 0 0 0 0 16·6
AMI vs MIR
50 0 0 0 0 0 0 50 0 0 0 0 0 0 0 0 0 0
AMI vs NEF
50 0 0 0 0 0 0 0 50 0 0 0 0 0 0 0 0 0
AMI vs NOR
45·7 0 0 2·44 0 2·8 0 0 0 39·9 0 0 0·5 0 2·4 5·7 0·5 0
AMI vs PAR
47 0 0 0 0 0 6 0 0 0 40·9 0 0 0 0 0 0 6
AMI vs SER
50 0 0 0 0 0 0 0 0 0 0 50 0 0 0 0 0 0
AMI vs VEN
45·4 0 0 2·8 0 3·3 0 0 0 0·1 0 0 39·2 0 2·8 0·1 6·2 0
CIT vs CLO
0 32 0 0 0 0 4·1 0 0 0 27·9 0 0 32 0 0 0 4·1
CIT vs DES
0 50 50 0 0 0 0 0 0 0 0 0 0 0 0 0 0 0
CIT vs DUL
0 41·3 0 26·5 0 12·1 0 0 0 0·4 0 0 2·2 0 14·8 0·4 2·2 0
CIT vs ESC
0 50 0 0 50 0 0 0 0 0 0 0 0 0 0 0 0 0
CIT vs FLU
0 39·8 0 16·3 0 19·3 0 0 0 0·7 0 0 3·5 0 16·3 0·7 3·5 0
CIT vs IMP
0 41·7 0 0 0 0 25·2 0 0 0 16·6 0 0 0 0 0 0 16·6
CIT vs MIR
0 50 0 0 0 0 0 50 0 0 0 0 0 0 0 0 0 0
CIT vs NEF
0 50 0 0 0 0 0 0 50 0 0 0 0 0 0 0 0 0
CIT vs NOR
0 45·7 0 2·4 0 2·8 0 0 0 39·9 0 0 0·5 0 2·4 5·7 0·5 0
CIT vs PAR
0 47 0 0 0 0 6 0 0 0 40·9 0 0 0 0 0 0 6
CIT vs SER
0 50 0 0 0 0 0 0 0 0 0 50 0 0 0 0 0 0
CIT vs VEN
0 45·4 0 2·8 0 3·3 0 0 0 0·1 0 0 39·2 0 2·8 0·1 6·2 0
CLO vs DES
0 0 32 0 0 0 4·1 0 0 0 27·9 0 0 32 0 0 0 4·1
CLO vs DUL
0 0 0 19·2 0 7·6 3·7 0 0 0·3 24·8 0 1·4 28·5 9·2 0·3 1·4 3·7
CLO vs ESC
0 0 0 0 32 0 4·1 0 0 0 27·9 0 0 32 0 0 0 4·1
CLO vs FLU
0 0 0 11·2 0 13·3 3·5 0 0 0·5 23·9 0 2·4 27·4 11·2 0·5 2·4 3·5
CLO vs IMP
0 0 0 0 0 0 19·2 0 0 0 19·2 0 0 40·4 0 0 0 21·2
CLO vs MIR
0 0 0 0 0 0 4·1 32 0 0 27·9 0 0 32 0 0 0 4·1
CLO vs NEF
0 0 0 0 0 0 4·1 0 32 0 27·9 0 0 32 0 0 0 4·1
CLO vs NOR
0 0 0 1·6 0 1·9 3·9 0 0 26·3 26·3 0 0·3 30·1 1·6 3·8 0·3 3·9
CLO vs SER
0 0 0 0 0 0 4·1 0 0 0 27·9 32 0 32 0 0 0 4·1
CLO vs VEN
0 0 0 1·9 0 2·2 3·9 0 0 0·1 26·2 0 25·9 30 1·9 0·1 4·1 3·9
DES vs DUL
0 0 42 28·3 0 11·2 0 0 0 0·4 0 0 2 0 13·6 0·4 2 0
DES vs ESC
0 0 50 0 50 0 0 0 0 0 0 0 0 0 0 0 0 0
DES vs FLU
0 0 39·8 16·3 0 19·3 0 0 0 0·7 0 0 3·5 0 16·3 0·7 3·5 0
DES vs IMP
0 0 41·7 0 0 0 25·2 0 0 0 16·6 0 0 0 0 0 0 16·6
DES vs MIR
0 0 50 0 0 0 0 50 0 0 0 0 0 0 0 0 0 0
DES vs NEF
0 0 50 0 0 0 0 0 50 0 0 0 0 0 0 0 0 0
57
DES vs NOR
0 0 45·7 2·4 0 2·8 0 0 0 39·9 0 0 0·5 0 2·4 5·7 0·5 0
DES vs PAR
0 0 47 0 0 0 6 0 0 0 40·9 0 0 0 0 0 0 6
DES vs SER
0 0 50 0 0 0 0 0 0 0 0 50 0 0 0 0 0 0
DES vs VEN
0 0 45·4 2·8 0 3·3 0 0 0 0·1 0 0 39·2 0 2·8 0·1 6·2 0
DUL vs ESC
0 0 0 28·3 42 11·2 0 0 0 0·4 0 0 2 0 13·6 0·4 2 0
DUL vs IMP
0 0 0 24·3 0 9·6 21·7 0 0 0·3 14·3 0 1·7 0 11·7 0·3 1·7 14·3
DUL vs MIR
0 0 0 28·3 0 11·2 0 42 0 0·4 0 0 2 0 13·6 0·4 2 0
DUL vs NEF
0 0 0 28·3 0 11·2 0 0 42 0·4 0 0 2 0 13·6 0·4 2 0
DUL vs NOR
0 0 0 27·3 0 9 0 0 0 37·9 0 0 1·6 0 16·6 5·9 1·6 0
DUL vs PAR
0 0 0 26·9 0 10·6 5·1 0 0 0·4 34·7 0 1·9 0 12·9 0·4 1·9 5·1
DUL vs SER
0 0 0 28·3 0 11·2 0 0 0 0·4 0 42 2 0 13·6 0·4 2 0
DUL vs VEN
0 0 0 27·8 0 8·8 0 0 0 0·3 0 0 36·9 0 17·5 0·3 8·4 0
ESC vs FLU
0 0 0 16·3 39·8 19·3 0 0 0 0·7 0 0 3·5 0 16·3 0·7 3·5 0
ESC vs IMP
0 0 0 0 41·7 0 25·2 0 0 0 16·6 0 0 0 0 0 0 16·6
ESC vs MIR
0 0 0 0 50 0 0 50 0 0 0 0 0 0 0 0 0 0
ESC vs NEF
0 0 0 0 50 0 0 0 50 0 0 0 0 0 0 0 0 0
ESC vs NOR
0 0 0 2·4 45·7 2·8 0 0 0 39·9 0 0 0·5 0 2·4 5·7 0·5 0
ESC vs PAR
0 0 0 0 47 0 6 0 0 0 40·9 0 0 0 0 0 0 6
ESC vs SER
0 0 0 0 50 0 0 0 0 0 0 50 0 0 0 0 0 0
ESC vs VEN
0 0 0 2·8 45·4 3·3 0 0 0 0·1 0 0 39·2 0 2·8 0·1 6·2 0
FLU vs IMP
0 0 0 14·1 0 16·7 20·7 0 0 0·6 13·6 0 3 0 14·1 0·6 3 13·6
FLU vs MIR
0 0 0 16·3 0 19·3 0 39·8 0 0·7 0 0 3·5 0 16·3 0·7 3·5 0
FLU vs NEF
0 0 0 16·3 0 19·3 0 0 39·8 0·7 0 0 3·5 0 16·3 0·7 3·5 0
FLU vs PAR
0 0 0 15·5 0 18·4 4·9 0 0 0·7 33 0 3·3 0 15·5 0·7 3·3 4·9
FLU vs SER
0 0 0 16·3 0 19·3 0 0 0 0·7 0 39·8 3·5 0 16·3 0·7 3·5 0
IMP vs MIR
0 0 0 0 0 0 25·2 41·7 0 0 16·6 0 0 0 0 0 0 16·6
IMP vs NEF
0 0 0 0 0 0 25·2 0 41·7 0 16·6 0 0 0 0 0 0 16·6
IMP vs NOR
0 0 0 2 0 2·4 23·3 0 0 33·8 15·4 0 0·4 0 2 4·9 0·4 15·4
IMP vs SER
0 0 0 0 0 0 25·2 0 0 0 16·6 41·7 0 0 0 0 0 16·6
IMP vs VEN
0 0 0 2·4 0 2·8 23·2 0 0 0·1 15·3 0 33·2 0 2·4 0·1 5·3 15·3
MIR vs NEF
0 0 0 0 0 0 0 50 50 0 0 0 0 0 0 0 0 0
MIR vs NOR
0 0 0 2·4 0 2·8 0 45·7 0 39·9 0 0 0·5 0 2·4 5·7 0·5 0
MIR vs PAR
0 0 0 0 0 0 6 47 0 0 40·9 0 0 0 0 0 0 6
MIR vs SER
0 0 0 0 0 0 0 50 0 0 0 50 0 0 0 0 0 0
MIR vs VEN
0 0 0 2·8 0 3·3 0 45·4 0 0·1 0 0 39·2 0 2·8 0·1 6·2 0
NEF vs NOR
0 0 0 2·3 0 2·9 0 0 45·7 39·9 0 0 0·5 0 2·4 5·7 0·5 0
NEF vs PAR
0 0 0 0 0 0 6 0 47 0 40·9 0 0 0 0 0 0 6
NEF vs SER
0 0 0 0 0 0 0 0 50 0 0 50 0 0 0 0 0 0
NEF vs VEN
0 0 0 2·8 0 3·3 0 0 45·4 0·1 0 0 39·2 0 2·8 0·1 6·2 0
NOR vs PAR
0 0 0 2·3 0 2·7 5·5 0 0 37·7 37·6 0 0·5 0 2·3 5·4 0·5 5·5
NOR vs SER
0 0 0 2·4 0 2·8 0 0 0 39·9 0 45·7 0·5 0 2·4 5·7 0·5 0
NOR vs VEN
0 0 0 0·5 0 0·5 0 0 0 42·9 0 0 41·9 0 0·5 6·3 7·3 0
PAR vs SER
0 0 0 0 0 0 6 0 0 0 40·9 47 0 0 0 0 0 6
PAR vs VEN
0 0 0 2·6 0 3·1 5·5 0 0 0·1 37·4 0 37 0 2·6 0·1 5·9 5·5
SER vs VEN
0 0 0 2·8 0 3·3 0 0 0 0·1 0 45·4 39·2 0 2·8 0·1 6·2 0
total
6·1 6·1 6·1 6·7 6·1 4·9 4·9 6·1 6·1 5·5 11·6 6·1 6 6·1 5 0·9 1·7 3·9
58
Discontinuation due to adverse events (tolerability)
Comparison N PBO vs AMI PBO vs CIT PBO vs DES PBO vs DUL PBO vs ESC PBO vs FLU PBO vs IMP PBO vs MIR PBO vs NEF PBO vs PAR PBO vs SER PBO vs VEN CLO vs PAR DUL vs FLU IMP vs PAR
Dir
ect
com
paris
on
PBO vs AMI 1 99·7 0 0 0 0 0 0 0 0 0 0 0 0 0 0
PBO vs CIT 2 0 100 0 0 0 0 0 0 0 0 0 0 0 0 0
PBO vs DES 2 0 0 99·6 0 0 0 0 0 0 0·1 0 0 0 0 0
PBO vs DUL 2 0 0 0 70·5 0 14·7 0 0 0 0 0 0 0 14·7 0
PBO vs ESC 2 0 0 0 0 99·9 0 0 0 0 0 0 0 0 0 0
PBO vs FLU 6 0 0 0 16·7 0 66·6 0 0 0 0 0 0 0 16·7 0
PBO vs IMP 1 0 0 0 0 0 0 37·1 0 0 31·4 0 0 0 0 31·4
PBO vs MIR 2 0 0 0 0 0 0 0 99·9 0 0 0 0 0 0 0
PBO vs NEF 1 0 0 0 0 0 0 0 0 99·9 0 0 0 0 0 0
PBO vs PAR 4 0 0 0 0 0 0 16·4 0 0 67·3 0 0 0 0 16·4
PBO vs SER 1 0 0 0 0 0 0 0 0 0 0 100 0 0 0 0
PBO vs VEN 1 0 0 0 0 0 0 0 0 0 0 0 100 0 0 0
CLO vs PAR 1 0 0 0 0 0 0 0 0 0 0 0 0 100 0 0
DUL vs FLU 2 0 0 0 38·5 0 38·5 0 0 0 0 0 0 0 23 0
IMP vs PAR 1 0 0 0 0 0 0 25·7 0 0 25·7 0 0 0 0 48·6
Ind
irect
co
mp
aris
on
PBO vs CLO
0 0 0 0 0 0 8·9 0 0 36·6 0 0 45·5 0 8·9
AMI vs CIT
49·9 50 0 0 0 0 0 0 0 0 0 0 0 0 0
AMI vs CLO
31·2 0 0 0 0 0 6·1 0 0 25·2 0 0 31·3 0 6·1
AMI vs DES
50 0 50 0 0 0 0 0 0 0 0 0 0 0 0
AMI vs DUL
45·9 0 0 38·1 0 8 0 0 0 0 0 0 0 8 0
AMI vs ESC
49·9 0 0 0 50 0 0 0 0 0 0 0 0 0 0
AMI vs FLU
45·4 0 0 9·1 0 36·3 0 0 0 0 0 0 0 9·1 0
AMI vs IMP
40·6 0 0 0 0 0 22 0 0 18·6 0 0 0 0 18·7
AMI vs MIR
49·9 0 0 0 0 0 0 50 0 0 0 0 0 0 0
AMI vs NEF
49·9 0 0 0 0 0 0 0 50 0 0 0 0 0 0
AMI vs PAR
45·5 0 0 0 0 0 8·9 0 0 36·6 0 0 0 0 8·9
AMI vs SER
49·9 0 0 0 0 0 0 0 0 0 50 0 0 0 0
AMI vs VEN
49·9 0 0 0 0 0 0 0 0 0 0 50 0 0 0
CIT vs CLO
0 31·3 0 0 0 0 6·1 0 0 25·2 0 0 31·3 0 6·1
CIT vs DES
0 50 49·9 0 0 0 0 0 0 0 0 0 0 0 0
CIT vs DUL
0 46 0 38·1 0 8 0 0 0 0 0 0 0 8 0
CIT vs ESC
0 50 0 0 50 0 0 0 0 0 0 0 0 0 0
CIT vs FLU
0 45·4 0 9·1 0 36·3 0 0 0 0 0 0 0 9·1 0
CIT vs IMP
0 40·7 0 0 0 0 22 0 0 18·6 0 0 0 0 18·7
CIT vs MIR
0 50 0 0 0 0 0 50 0 0 0 0 0 0 0
CIT vs NEF
0 50 0 0 0 0 0 0 50 0 0 0 0 0 0
CIT vs PAR
0 45·5 0 0 0 0 8·9 0 0 36·6 0 0 0 0 8·9
CIT vs SER
0 50 0 0 0 0 0 0 0 0 50 0 0 0 0
CIT vs VEN
0 50 0 0 0 0 0 0 0 0 0 50 0 0 0
CLO vs DES
0 0 31·2 0 0 0 6·1 0 0 25·2 0 0 31·3 0 6·1
CLO vs DUL
0 0 0 24·6 0 5·1 5·8 0 0 23·9 0 0 29·7 5·1 5·8
CLO vs ESC
0 0 0 0 31·3 0 6·1 0 0 25·2 0 0 31·3 0 6·1
CLO vs FLU
0 0 0 5·9 0 23·5 5·8 0 0 23·7 0 0 29·4 5·9 5·8
CLO vs IMP
0 0 0 0 0 0 14·7 0 0 14·7 0 0 42·6 0 27·9
CLO vs MIR
0 0 0 0 0 0 6·1 31·3 0 25·2 0 0 31·3 0 6·1
CLO vs NEF
0 0 0 0 0 0 6·1 0 31·3 25·2 0 0 31·3 0 6·1
CLO vs SER
0 0 0 0 0 0 6·1 0 0 25·2 31·3 0 31·3 0 6·1
CLO vs VEN
0 0 0 0 0 0 6·1 0 0 25·2 0 31·3 31·3 0 6·1
DES vs DUL
0 0 45·9 38·1 0 7·9 0 0 0 0 0 0 0 8 0
DES vs ESC
0 0 49·9 0 50 0 0 0 0 0 0 0 0 0 0
DES vs FLU
0 0 45·3 9·1 0 36·3 0 0 0 0 0 0 0 9·1 0
DES vs IMP
0 0 40·6 0 0 0 22 0 0 18·6 0 0 0 0 18·7
DES vs MIR
0 0 49·9 0 0 0 0 50 0 0 0 0 0 0 0
DES vs NEF
0 0 49·9 0 0 0 0 0 50 0 0 0 0 0 0
DES vs PAR
0 0 45·4 0 0 0 8·9 0 0 36·6 0 0 0 0 8·9
DES vs SER
0 0 49·9 0 0 0 0 0 0 0 50 0 0 0 0
DES vs VEN
0 0 49·9 0 0 0 0 0 0 0 0 50 0 0 0
DUL vs ESC
0 0 0 38·1 46 8 0 0 0 0 0 0 0 8 0
DUL vs IMP
0 0 0 31·4 0 6·6 20·6 0 0 17·4 0 0 0 6·6 17·4
DUL vs MIR
0 0 0 38·1 0 8 0 46 0 0 0 0 0 8 0

59
DUL vs NEF
0 0 0 38·1 0 8 0 0 46 0 0 0 0 8 0
DUL vs PAR
0 0 0 34·9 0 7·3 8·3 0 0 34 0 0 0 7·3 8·3
DUL vs SER
0 0 0 38·1 0 8 0 0 0 0 46 0 0 8 0
DUL vs VEN
0 0 0 38·1 0 8 0 0 0 0 0 46 0 8 0
ESC vs FLU
0 0 0 9·1 45·4 36·3 0 0 0 0 0 0 0 9·1 0
ESC vs IMP
0 0 0 0 40·7 0 22 0 0 18·6 0 0 0 0 18·7
ESC vs MIR
0 0 0 0 50 0 0 50 0 0 0 0 0 0 0
ESC vs NEF
0 0 0 0 50 0 0 0 50 0 0 0 0 0 0
ESC vs PAR
0 0 0 0 45·5 0 8·9 0 0 36·6 0 0 0 0 8·9
ESC vs SER
0 0 0 0 50 0 0 0 0 0 50 0 0 0 0
ESC vs VEN
0 0 0 0 50 0 0 0 0 0 0 50 0 0 0
FLU vs IMP
0 0 0 7·5 0 30·1 20·4 0 0 17·2 0 0 0 7·5 17·2
FLU vs MIR
0 0 0 9·1 0 36·3 0 45·4 0 0 0 0 0 9·1 0
FLU vs NEF
0 0 0 9·1 0 36·3 0 0 45·4 0 0 0 0 9·1 0
FLU vs PAR
0 0 0 8·4 0 33·4 8·2 0 0 33·6 0 0 0 8·4 8·2
FLU vs SER
0 0 0 9·1 0 36·3 0 0 0 0 45·4 0 0 9·1 0
FLU vs VEN
0 0 0 9·1 0 36·3 0 0 0 0 0 45·4 0 9·1 0
IMP vs MIR
0 0 0 0 0 0 22 40·7 0 18·6 0 0 0 0 18·7
IMP vs NEF
0 0 0 0 0 0 22 0 40·6 18·6 0 0 0 0 18·7
IMP vs SER
0 0 0 0 0 0 22 0 0 18·6 40·7 0 0 0 18·7
IMP vs VEN
0 0 0 0 0 0 22 0 0 18·6 0 40·7 0 0 18·7
MIR vs NEF
0 0 0 0 0 0 0 50 50 0 0 0 0 0 0
MIR vs PAR
0 0 0 0 0 0 8·9 45·5 0 36·6 0 0 0 0 8·9
MIR vs SER
0 0 0 0 0 0 0 50 0 0 50 0 0 0 0
MIR vs VEN
0 0 0 0 0 0 0 50 0 0 0 50 0 0 0
NEF vs PAR
0 0 0 0 0 0 8·9 0 45·5 36·6 0 0 0 0 8·9
NEF vs SER
0 0 0 0 0 0 0 0 50 0 50 0 0 0 0
NEF vs VEN
0 0 0 0 0 0 0 0 50 0 0 50 0 0 0
PAR vs SER
0 0 0 0 0 0 8·9 0 0 36·6 45·5 0 0 0 8·9
PAR vs VEN
0 0 0 0 0 0 8·9 0 0 36·6 0 45·5 0 0 8·9
SER vs VEN
0 0 0 0 0 0 0 0 0 0 50 50 0 0 0
total
6·8 6·8 6·7 6·7 6·8 6·4 5·7 6·8 6·8 12·2 6·8 6·8 6·8 2·5 5·5

60
Response rate
Comparison N PBO vs AMI PBO vs CIT PBO vs DES PBO vs DUL PBO vs ESC PBO vs FLU PBO vs IMP PBO vs NEF PBO vs NOR PBO vs PAR PBO vs SER PBO vs VEN CLO vs PAR DUL vs FLU FLU vs NOR FLU vs VEN IMP vs PAR
Dir
ect
com
paris
on
PBO vs AMI 1 99·9 0 0 0 0 0 0 0 0 0 0 0 0 0 0 0 0
PBO vs CIT 2 0 100 0 0 0 0 0 0 0 0 0 0 0 0 0 0 0
PBO vs DES 2 0 0 100 0 0 0 0 0 0 0 0 0 0 0 0 0 0
PBO vs DUL 2 0 0 0 50·6 0 20 0 0 0·6 0 0 2·5 0 23·1 0·6 2·5 0
PBO vs ESC 1 0 0 0 0 100 0 0 0 0 0 0 0 0 0 0 0 0
PBO vs FLU 7 0 0 0 25·5 0 37·3 0 0 1·1 0 0 4·7 0 25·5 1·1 4·7 0
PBO vs IMP 3 0 0 0 0 0 0 46·8 0 0 26·6 0 0 0 0 0 0 26·6
PBO vs NEF 1 0 0 0 0 0 0 0 100 0 0 0 0 0 0 0 0 0
PBO vs NOR 2 0 0 0 11·1 0 16·2 0 0 28·1 0 0 2·1 0 11·1 29·4 2·1 0
PBO vs PAR 3 0 0 0 0 0 0 11·8 0 0 76·4 0 0 0 0 0 0 11·8
PBO vs SER 2 0 0 0 0 0 0 0 0 0 0 100 0 0 0 0 0 0
PBO vs VEN 2 0 0 0 4·4 0 6·4 0 0 0·2 0 0 73·6 0 4·4 0·2 10·9 0
CLO vs PAR 1 0 0 0 0 0 0 0 0 0 0 0 0 100 0 0 0 0
DUL vs FLU 2 0 0 0 23·2 0 20 0 0 0·6 0 0 2·5 0 50·6 0·6 2·5 0
FLU vs NOR 1 0 0 0 10·6 0 15·5 0 0 28 0 0 2 0 10·6 31·3 2 0
FLU vs VEN 1 0 0 0 15 0 21·9 0 0 0·6 0 0 37·5 0 15 0·6 9·3 0
IMP vs PAR 1 0 0 0 0 0 0 33·5 0 0 33·5 0 0 0 0 0 0 33
Ind
irect
co
mp
aris
on
PBO vs CLO 0 0 0 0 0 0 6·3 0 0 40·6 0 0 46·9 0 0 0 6·3
AMI vs CIT 50 50 0 0 0 0 0 0 0 0 0 0 0 0 0 0 0
AMI vs CLO 31·9 0 0 0 0 0 4·3 0 0 27·6 0 0 31·9 0 0 0 4·3
AMI vs DES 50 0 50 0 0 0 0 0 0 0 0 0 0 0 0 0 0
AMI vs DUL 42·4 0 0 29·1 0 11·5 0 0 0·3 0 0 1·5 0 13·3 0·3 1·5 0
AMI vs ESC 49·9 0 0 0 50 0 0 0 0 0 0 0 0 0 0 0 0
AMI vs FLU 40·7 0 0 15·1 0 22·1 0 0 0·6 0 0 2·8 0 15·1 0·6 2·8 0
AMI vs IMP 42·3 0 0 0 0 0 27 0 0 15·3 0 0 0 0 0 0 15·4
AMI vs NEF 50 0 0 0 0 0 0 50 0 0 0 0 0 0 0 0 0
AMI vs NOR 36·5 0 0 7·1 0 10·3 0 0 17·8 0 0 1·3 0 7·1 18·7 1·3 0
AMI vs PAR 46·8 0 0 0 0 0 6·3 0 0 40·6 0 0 0 0 0 0 6·3
AMI vs SER 50 0 0 0 0 0 0 0 0 0 50 0 0 0 0 0 0
AMI vs VEN 45·8 0 0 2·4 0 3·5 0 0 0·1 0 0 39·9 0 2·4 0·1 5·9 0
CIT vs CLO 0 31·9 0 0 0 0 4·3 0 0 27·6 0 0 31·9 0 0 0 4·3
CIT vs DES 0 50 50 0 0 0 0 0 0 0 0 0 0 0 0 0 0
CIT vs DUL 0 42·4 0 29·1 0 11·5 0 0 0·3 0 0 1·5 0 13·3 0·3 1·5 0
CIT vs ESC 0 50 0 0 50 0 0 0 0 0 0 0 0 0 0 0 0
CIT vs FLU 0 40·7 0 15·1 0 22·1 0 0 0·6 0 0 2·8 0 15·1 0·6 2·8 0
CIT vs IMP 0 42·3 0 0 0 0 27 0 0 15·4 0 0 0 0 0 0 15·4
CIT vs NEF 0 50 0 0 0 0 0 50 0 0 0 0 0 0 0 0 0
CIT vs NOR 0 36·5 0 7·1 0 10·3 0 0 17·8 0 0 1·3 0 7·1 18·7 1·3 0
CIT vs PAR 0 46·9 0 0 0 0 6·3 0 0 40·6 0 0 0 0 0 0 6·3
CIT vs SER 0 50 0 0 0 0 0 0 0 0 50 0 0 0 0 0 0
CIT vs VEN 0 45·8 0 2·4 0 3·5 0 0 0·1 0 0 39·9 0 2·4 0·1 5·9 0
CLO vs DES 0 0 31·9 0 0 0 4·3 0 0 27·6 0 0 31·9 0 0 0 4·3
CLO vs DUL 0 0 0 19·7 0 7·8 3·8 0 0·2 24·8 0 1 28·7 9 0·2 1 3·8
CLO vs ESC 0 0 0 0 31·9 0 4·3 0 0 27·6 0 0 31·9 0 0 0 4·3
CLO vs FLU 0 0 0 10·4 0 15·1 3·7 0 0·4 24·1 0 1·9 27·8 10·4 0·4 1·9 3·7
CLO vs IMP 0 0 0 0 0 0 20·1 0 0 20·1 0 0 39·9 0 0 0 19·8
CLO vs NEF 0 0 0 0 0 0 4·3 31·9 0 27·6 0 0 31·9 0 0 0 4·3
CLO vs NOR 0 0 0 5 0 7·3 3·5 0 12·6 22·4 0 0·9 25·8 5 13·2 0·9 3·5

61
CLO vs SER 0 0 0 0 0 0 4·3 0 0 27·6 31·9 0 31·9 0 0 0 4·3
CLO vs VEN 0 0 0 1·6 0 2·3 4 0 0·1 26·1 0 26·2 30·1 1·6 0·1 3·9 4
DES vs DUL 0 0 42·4 29·1 0 11·5 0 0 0·3 0 0 1·5 0 13·3 0·3 1·5 0
DES vs ESC 0 0 50 0 50 0 0 0 0 0 0 0 0 0 0 0 0
DES vs FLU 0 0 40·7 15·1 0 22·1 0 0 0·6 0 0 2·8 0 15·1 0·6 2·8 0
DES vs IMP 0 0 42·3 0 0 0 27 0 0 15·3 0 0 0 0 0 0 15·4
DES vs NEF 0 0 50 0 0 0 0 50 0 0 0 0 0 0 0 0 0
DES vs NOR 0 0 36·5 7·1 0 10·3 0 0 17·8 0 0 1·3 0 7·1 18·7 1·3 0
DES vs PAR 0 0 46·9 0 0 0 6·3 0 0 40·6 0 0 0 0 0 0 6·3
DES vs SER 0 0 50 0 0 0 0 0 0 0 50 0 0 0 0 0 0
DES vs VEN 0 0 45·8 2·4 0 3·5 0 0 0·1 0 0 39·9 0 2·4 0·1 5·9 0
DUL vs ESC 0 0 0 29·1 42·4 11·5 0 0 0·3 0 0 1·5 0 13·3 0·3 1·5 0
DUL vs IMP 0 0 0 25·2 0 10 23·4 0 0·3 13·3 0 1·3 0 11·5 0·3 1·3 13·3
DUL vs NEF 0 0 0 29·1 0 11·5 0 42·4 0·3 0 0 1·5 0 13·3 0·3 1·5 0
DUL vs NOR 0 0 0 24·5 0 0·5 0 0 23·9 0 0 0·1 0 25·2 25·8 0·1 0
DUL vs PAR 0 0 0 27·6 0 10·9 5·4 0 0·3 34·8 0 1·4 0 12·6 0·3 1·4 5·4
DUL vs SER 0 0 0 29·1 0 11·5 0 0 0·3 0 42·4 1·5 0 13·3 0·3 1·5 0
DUL vs VEN 0 0 0 28·7 0 8·9 0 0 0·3 0 0 37·9 0 16·6 0·3 7·4 0
ESC vs FLU 0 0 0 15·1 40·7 22·1 0 0 0·6 0 0 2·8 0 15·1 0·6 2·8 0
ESC vs IMP 0 0 0 0 42·3 0 27 0 0 15·3 0 0 0 0 0 0 15·4
ESC vs NEF 0 0 0 0 50 0 0 50 0 0 0 0 0 0 0 0 0
ESC vs NOR 0 0 0 7·1 36·5 10·3 0 0 17·8 0 0 1·3 0 7·1 18·7 1·3 0
ESC vs PAR 0 0 0 0 46·9 0 6·3 0 0 40·6 0 0 0 0 0 0 6·3
ESC vs SER 0 0 0 0 50 0 0 0 0 0 50 0 0 0 0 0 0
ESC vs VEN 0 0 0 2·4 45·8 3·5 0 0 0·1 0 0 39·9 0 2·4 0·1 5·9 0
FLU vs IMP 0 0 0 13·2 0 19·3 22·6 0 0·6 12·9 0 2·4 0 13·2 0·6 2·4 12·9
FLU vs NEF 0 0 0 15·1 0 22·1 0 40·7 0·6 0 0 2·8 0 15·1 0·6 2·8 0
FLU vs PAR 0 0 0 14·4 0 21 5·2 0 0·6 33·4 0 2·7 0 14·4 0·6 2·7 5·2
FLU vs SER 0 0 0 15·1 0 22·1 0 0 0·6 0 40·7 2·8 0 15·1 0·6 2·8 0
IMP vs NEF 0 0 0 0 0 0 27 42·3 0 15·4 0 0 0 0 0 0 15·4
IMP vs NOR 0 0 0 6·2 0 9·1 20·5 0 15·7 11·7 0 1·2 0 6·2 16·5 1·2 11·7
IMP vs SER 0 0 0 0 0 0 27 0 0 15·4 42·3 0 0 0 0 0 15·4
IMP vs VEN 0 0 0 2 0 3 25 0 0·1 14·2 0 34·2 0 2 0·1 5·1 14·2
NEF vs NOR 0 0 0 7·1 0 10·3 0 36·5 17·8 0 0 1·3 0 7·1 18·7 1·3 0
NEF vs PAR 0 0 0 0 0 0 6·3 46·9 0 40·6 0 0 0 0 0 0 6·3
NEF vs SER 0 0 0 0 0 0 0 50 0 0 50 0 0 0 0 0 0
NEF vs VEN 0 0 0 2·4 0 3·5 0 45·8 0·1 0 0 39·9 0 2·4 0·1 5·9 0
NOR vs PAR 0 0 0 6·7 0 9·8 4·7 0 17 30·1 0 1·2 0 6·7 17·8 1·2 4·7
NOR vs SER 0 0 0 7·1 0 10·3 0 0 17·8 0 36·5 1·3 0 7·1 18·7 1·3 0
NOR vs VEN 0 0 0 5·7 0 8·3 0 0 19·5 0 0 33·5 0 5·7 20·6 6·6 0
PAR vs SER 0 0 0 0 0 0 6·3 0 0 40·6 46·9 0 0 0 0 0 6·3
PAR vs VEN 0 0 0 2·2 0 3·3 5·8 0 0·1 37·4 0 37·6 0 2·2 0·1 5·6 5·8
SER vs VEN 0 0 0 2·4 0 3·5 0 0 0·1 0 45·8 39·9 0 2·4 0·1 5·9 0
total 6·4 6·4 6·4 7·4 6·4 6·5 5·4 6·4 3·3 11·8 6·4 6·2 6·4 5·7 3·4 1·6 3·9
62
All-cause discontinuation (acceptability)
Comparison N PBO vs AMI PBO vs CIT PBO vs DES PBO vs DUL PBO vs ESC PBO vs FLU PBO vs IMP PBO vs MIR PBO vs NEF PBO vs NOR PBO vs PAR PBO vs SER PBO vs VEN CLO vs PAR DUL vs FLU FLU vs NOR FLU vs VEN IMP vs PAR
Dir
ect
com
paris
on
PBO vs AMI 1 99·9 0 0 0 0 0 0 0 0 0 0 0 0 0 0 0 0 0
PBO vs CIT 2 0 100 0 0 0 0 0 0 0 0 0 0 0 0 0 0 0 0
PBO vs DES 2 0 0 100 0 0 0 0 0 0 0 0 0 0 0 0 0 0 0
PBO vs DUL 2 0 0 0 31·7 0 30·9 0 0 0 1·3 0 0 0·8 0 33·1 1·3 0·8 0
PBO vs ESC 2 0 0 0 0 100 0 0 0 0 0 0 0 0 0 0 0 0 0
PBO vs FLU 8 0 0 0 21·6 0 49·8 0 0 0 2·1 0 0 1·4 0 21·6 2·1 1·4 0
PBO vs IMP 2 0 0 0 0 0 0 14·1 0 0 0 43 0 0 0 0 0 0 43
PBO vs MIR 2 0 0 0 0 0 0 0 100 0 0 0 0 0 0 0 0 0 0
PBO vs NEF 1 0 0 0 0 0 0 0 0 100 0 0 0 0 0 0 0 0 0
PBO vs NOR 1 0 0 0 7·2 0 16·5 0 0 0 44·1 0 0 0·5 0 7·2 24·1 0·5 0
PBO vs PAR 4 0 0 0 0 0 0 5·4 0 0 0 89·1 0 0 0 0 0 0 5·4
PBO vs SER 2 0 0 0 0 0 0 0 0 0 0 0 99·9 0 0 0 0 0 0
PBO vs VEN 1 0 0 0 0·7 0 1·6 0 0 0 0·1 0 0 94·5 0 0·7 0·1 2·4 0
CLO vs PAR 1 0 0 0 0 0 0 0 0 0 0 0 0 0 100 0 0 0 0
DUL vs FLU 2 0 0 0 16·6 0 15·5 0 0 0 0·7 0 0 0·4 0 65·8 0·7 0·4 0
FLU vs NOR 1 0 0 0 10·1 0 23·3 0 0 0 34·1 0 0 0·6 0 10·1 21·1 0·6 0
FLU vs VEN 1 0 0 0 12·4 0 28·6 0 0 0 1·2 0 0 42·3 0 12·4 1·2 1·9 0
IMP vs PAR 1 0 0 0 0 0 0 15·9 0 0 0 15·9 0 0 0 0 0 0 68·1
Ind
irect
co
mp
aris
on
PBO vs CLO
0 0 0 0 0 0 2·8 0 0 0 45·8 0 0 48·6 0 0 0 2·8
AMI vs CIT
50 50 0 0 0 0 0 0 0 0 0 0 0 0 0 0 0 0
AMI vs CLO
32·7 0 0 0 0 0 1·9 0 0 0 30·8 0 0 32·7 0 0 0 1·9
AMI vs DES
50 0 50 0 0 0 0 0 0 0 0 0 0 0 0 0 0 0
AMI vs DUL
39·3 0 0 19·2 0 18·8 0 0 0 0·8 0 0 0·5 0 20·1 0·8 0·5 0
AMI vs ESC
50 0 0 0 50 0 0 0 0 0 0 0 0 0 0 0 0 0
AMI vs FLU
42·8 0 0 12·3 0 28·5 0 0 0 1·2 0 0 0·8 0 12·3 1·2 0·8 0
AMI vs IMP
36·3 0 0 0 0 0 9 0 0 0 27·4 0 0 0 0 0 0 27·4
AMI vs MIR
50 0 0 0 0 0 0 50 0 0 0 0 0 0 0 0 0 0
AMI vs NEF
50 0 0 0 0 0 0 0 50 0 0 0 0 0 0 0 0 0
AMI vs NOR
40·5 0 0 4·3 0 9·8 0 0 0 26·2 0 0 0·3 0 4·3 14·3 0·3 0
AMI vs PAR
48·6 0 0 0 0 0 2·8 0 0 0 45·8 0 0 0 0 0 0 2·8
AMI vs SER
50 0 0 0 0 0 0 0 0 0 0 50 0 0 0 0 0 0
AMI vs VEN
49·2 0 0 0·3 0 0·8 0 0 0 0 0 0 48 0 0·4 0 1·2 0
CIT vs CLO
0 32·7 0 0 0 0 1·9 0 0 0 30·8 0 0 32·7 0 0 0 1·9
CIT vs DES
0 50 50 0 0 0 0 0 0 0 0 0 0 0 0 0 0 0
CIT vs DUL
0 39·3 0 19·2 0 18·8 0 0 0 0·8 0 0 0·5 0 20·1 0·8 0·5 0
CIT vs ESC
0 50 0 0 50 0 0 0 0 0 0 0 0 0 0 0 0 0
CIT vs FLU
0 42·8 0 12·3 0 28·5 0 0 0 1·2 0 0 0·8 0 12·3 1·2 0·8 0
CIT vs IMP
0 36·3 0 0 0 0 9 0 0 0 27·4 0 0 0 0 0 0 27·4
CIT vs MIR
0 50 0 0 0 0 0 50 0 0 0 0 0 0 0 0 0 0
CIT vs NEF
0 50 0 0 0 0 0 0 50 0 0 0 0 0 0 0 0 0
CIT vs NOR
0 40·6 0 4·3 0 9·8 0 0 0 26·2 0 0 0·3 0 4·3 14·3 0·3 0
CIT vs PAR
0 48·6 0 0 0 0 2·8 0 0 0 45·8 0 0 0 0 0 0 2·8
CIT vs SER
0 50 0 0 0 0 0 0 0 0 0 50 0 0 0 0 0 0
CIT vs VEN
0 49·2 0 0·4 0 0·8 0 0 0 0 0 0 48 0 0·4 0 1·2 0
CLO vs DES
0 0 32·7 0 0 0 1·9 0 0 0 30·8 0 0 32·7 0 0 0 1·9
CLO vs DUL
0 0 0 13·6 0 13·3 1·6 0 0 0·6 26·2 0 0·4 27·8 14·2 0·6 0·4 1·6
CLO vs ESC
0 0 0 0 32·7 0 1·9 0 0 0 30·8 0 0 32·7 0 0 0 1·9
CLO vs FLU
0 0 0 8·5 0 19·6 1·7 0 0 0·8 27·8 0 0·5 29·5 8·5 0·8 0·5 1·7
CLO vs IMP
0 0 0 0 0 0 8·7 0 0 0 8·6 0 0 45·7 0 0 0 37
CLO vs MIR
0 0 0 0 0 0 1·9 32·7 0 0 30·8 0 0 32·7 0 0 0 1·9
CLO vs NEF
0 0 0 0 0 0 1·9 0 32·7 0 30·8 0 0 32·7 0 0 0 1·9
CLO vs NOR
0 0 0 3 0 6·9 1·6 0 0 18·3 26·8 0 0·2 28·4 3 10 0·2 1·6
CLO vs SER
0 0 0 0 0 0 1·9 0 0 0 30·8 32·7 0 32·7 0 0 0 1·9
CLO vs VEN
0 0 0 0·2 0 0·5 1·9 0 0 0 30·5 0 31·6 32·4 0·2 0 0·8 1·9
DES vs DUL
0 0 39·3 19·2 0 18·8 0 0 0 0·8 0 0 0·5 0 20·1 0·8 0·5 0
DES vs ESC
0 0 50 0 50 0 0 0 0 0 0 0 0 0 0 0 0 0
DES vs FLU
0 0 42·8 12·3 0 28·5 0 0 0 1·2 0 0 0·8 0 12·3 1·2 0·8 0
DES vs IMP
0 0 36·3 0 0 0 9 0 0 0 27·4 0 0 0 0 0 0 27·4
DES vs MIR
0 0 50 0 0 0 0 50 0 0 0 0 0 0 0 0 0 0
DES vs NEF
0 0 50 0 0 0 0 0 50 0 0 0 0 0 0 0 0 0
63
DES vs NOR
0 0 40·6 4·3 0 9·8 0 0 0 26·2 0 0 0·3 0 4·3 14·3 0·3 0
DES vs PAR
0 0 48·6 0 0 0 2·8 0 0 0 45·8 0 0 0 0 0 0 2·8
DES vs SER
0 0 50 0 0 0 0 0 0 0 0 50 0 0 0 0 0 0
DES vs VEN
0 0 49·2 0·3 0 0·8 0 0 0 0 0 0 48 0 0·4 0 1·2 0
DUL vs ESC
0 0 0 19·2 39·3 18·8 0 0 0 0·8 0 0 0·5 0 20·1 0·8 0·5 0
DUL vs IMP
0 0 0 14·8 0 14·5 7·5 0 0 0·6 22·8 0 0·4 0 15·5 0·6 0·4 22·8
DUL vs MIR
0 0 0 19·2 0 18·8 0 39·3 0 0·8 0 0 0·5 0 20·1 0·8 0·5 0
DUL vs NEF
0 0 0 19·2 0 18·8 0 0 39·3 0·8 0 0 0·5 0 20·1 0·8 0·5 0
DUL vs NOR
0 0 0 17·1 0 10·5 0 0 0 27·8 0 0 0·3 0 27·4 16·6 0·3 0
DUL vs PAR
0 0 0 18·8 0 18·3 2·2 0 0 0·8 36·2 0 0·5 0 19·6 0·8 0·5 2·2
DUL vs SER
0 0 0 19·2 0 18·8 0 0 0 0·8 0 39·3 0·5 0 20·1 0·8 0·5 0
DUL vs VEN
0 0 0 19·3 0 18·4 0 0 0 0·8 0 0 38·5 0 20·7 0·8 1·5 0
ESC vs FLU
0 0 0 12·3 42·8 28·5 0 0 0 1·2 0 0 0·8 0 12·3 1·2 0·8 0
ESC vs IMP
0 0 0 0 36·3 0 9 0 0 0 27·4 0 0 0 0 0 0 27·4
ESC vs MIR
0 0 0 0 50 0 0 50 0 0 0 0 0 0 0 0 0 0
ESC vs NEF
0 0 0 0 50 0 0 0 50 0 0 0 0 0 0 0 0 0
ESC vs NOR
0 0 0 4·3 40·6 9·8 0 0 0 26·2 0 0 0·3 0 4·3 14·3 0·3 0
ESC vs PAR
0 0 0 0 48·6 0 2·8 0 0 0 45·8 0 0 0 0 0 0 2·8
ESC vs SER
0 0 0 0 50 0 0 0 0 0 0 50 0 0 0 0 0 0
ESC vs VEN
0 0 0 0·4 49·2 0·8 0 0 0 0 0 0 48 0 0·4 0 1·2 0
FLU vs IMP
0 0 0 9·3 0 21·5 8 0 0 0·9 24·4 0 0·6 0 9·3 0·9 0·6 24·4
FLU vs MIR
0 0 0 12·3 0 28·5 0 42·8 0 1·2 0 0 0·8 0 12·3 1·2 0·8 0
FLU vs NEF
0 0 0 12·3 0 28·5 0 0 42·8 1·2 0 0 0·8 0 12·3 1·2 0·8 0
FLU vs PAR
0 0 0 12 0 27·8 2·4 0 0 1·2 39·4 0 0·8 0 12·1 1·2 0·8 2·4
FLU vs SER
0 0 0 12·3 0 28·5 0 0 0 1·2 0 42·8 0·8 0 12·3 1·2 0·8 0
IMP vs MIR
0 0 0 0 0 0 9 36·3 0 0 27·4 0 0 0 0 0 0 27·4
IMP vs NEF
0 0 0 0 0 0 9 0 36·3 0 27·4 0 0 0 0 0 0 27·4
IMP vs NOR
0 0 0 3·3 0 7·5 7·7 0 0 20·1 23·4 0 0·2 0 3·3 11 0·2 23·4
IMP vs SER
0 0 0 0 0 0 9 0 0 0 27·4 36·3 0 0 0 0 0 27·4
IMP vs VEN
0 0 0 0·3 0 0·6 8·9 0 0 0 27 0 35 0 0·3 0 0·9 27
MIR vs NEF
0 0 0 0 0 0 0 50 50 0 0 0 0 0 0 0 0 0
MIR vs NOR
0 0 0 4·3 0 9·8 0 40·6 0 26·2 0 0 0·3 0 4·3 14·3 0·3 0
MIR vs PAR
0 0 0 0 0 0 2·8 48·6 0 0 45·8 0 0 0 0 0 0 2·8
MIR vs SER
0 0 0 0 0 0 0 50 0 0 0 50 0 0 0 0 0 0
MIR vs VEN
0 0 0 0·4 0 0·8 0 49·2 0 0 0 0 48 0 0·4 0 1·2 0
NEF vs NOR
0 0 0 4·3 0 9·8 0 0 40·6 26·2 0 0 0·3 0 4·3 14·3 0·3 0
NEF vs PAR
0 0 0 0 0 0 2·8 0 48·6 0 45·8 0 0 0 0 0 0 2·8
NEF vs SER
0 0 0 0 0 0 0 0 50 0 0 50 0 0 0 0 0 0
NEF vs VEN
0 0 0 0·4 0 0·8 0 0 49·2 0 0 0 48 0 0·4 0 1·2 0
NOR vs PAR
0 0 0 4·2 0 9·6 2·3 0 0 25·6 37·4 0 0·3 0 4·2 14 0·3 2·3
NOR vs SER
0 0 0 4·3 0 9·8 0 0 0 26·2 0 40·6 0·3 0 4·3 14·3 0·3 0
NOR vs VEN
0 0 0 4 0 9·3 0 0 0 26·7 0 0 40 0 4 14·6 1·3 0
PAR vs SER
0 0 0 0 0 0 2·8 0 0 0 45·8 48·6 0 0 0 0 0 2·8
PAR vs VEN
0 0 0 0·3 0 0·8 2·7 0 0 0 45·1 0 46·7 0 0·3 0 1·2 2·7
SER vs VEN
0 0 0 0·3 0 0·8 0 0 0 0 0 49·2 48 0 0·4 0 1·2 0
total
6 6 6 4·9 6 7·6 2 6 6 4·1 13·8 6 6·1 6 5·4 2·4 0·4 5·2

64
Suicidal behavior or ideation
Comparison N PBO vs CIT PBO vs DUL PBO vs ESC PBO vs FLU PBO vs IMP PBO vs PAR PBO vs SER PBO vs VEN CLO vs PAR DUL vs FLU IMP vs PAR
Dir
ect
com
paris
on
PBO vs CIT 2 100 0 0 0 0 0 0 0 0 0 0
PBO vs DUL 2 0 47·1 0 26·4 0 0 0 0 0 26·4 0
PBO vs ESC 2 0 0 100 0 0 0 0 0 0 0 0
PBO vs FLU 6 0 21·9 0 56·2 0 0 0 0 0 21·9 0
PBO vs IMP 1 0 0 0 0 27·1 36·4 0 0 0 0 36·4
PBO vs PAR 4 0 0 0 0 12 76 0 0 0 0 12
PBO vs SER 2 0 0 0 0 0 0 99·9 0 0 0 0
PBO vs VEN 2 0 0 0 0 0 0 0 99·9 0 0 0
CLO vs PAR 1 0 0 0 0 0 0 0 0 100 0 0
DUL vs FLU 2 0 26·5 0 26·5 0 0 0 0 0 47 0
IMP vs PAR 1 0 0 0 0 22·5 22·5 0 0 0 0 55
Ind
irect
co
mp
aris
on
PBO vs CLO 0 0 0 0 6·4 40·4 0 0 46·8 0 6·4
CIT vs CLO 31·9 0 0 0 4·3 27·5 0 0 31·9 0 4·3
CIT vs DUL 42·4 27·2 0 15·2 0 0 0 0 0 15·2 0
CIT vs ESC 50 0 50 0 0 0 0 0 0 0 0
CIT vs FLU 43·8 12·3 0 31·5 0 0 0 0 0 12·3 0
CIT vs IMP 38·9 0 0 0 16·6 22·3 0 0 0 0 22·3
CIT vs PAR 46·8 0 0 0 6·4 40·4 0 0 0 0 6·4
CIT vs SER 50 0 0 0 0 0 50 0 0 0 0
CIT vs VEN 50 0 0 0 0 0 0 50 0 0 0
CLO vs DUL 0 18·3 0 10·3 3·9 24·7 0 0 28·6 10·3 3·9
CLO vs ESC 0 0 31·9 0 4·3 27·5 0 0 31·9 0 4·3
CLO vs FLU 0 8·2 0 21·1 4 25·3 0 0 29·3 8·2 4
CLO vs IMP 0 0 0 0 12·7 12·7 0 0 43·7 0 31
CLO vs SER 0 0 0 0 4·3 27·5 31·9 0 31·9 0 4·3
CLO vs VEN 0 0 0 0 4·3 27·5 0 31·9 31·9 0 4·4
DUL vs ESC 0 27·2 42·4 15·2 0 0 0 0 0 15·2 0
DUL vs IMP 0 21·9 0 12·2 14·6 19·5 0 0 0 12·3 19·5
DUL vs PAR 0 25·7 0 14·4 5·5 34·6 0 0 0 14·4 5·5
DUL vs SER 0 27·2 0 15·2 0 0 42·4 0 0 15·2 0
DUL vs VEN 0 27·2 0 15·2 0 0 0 42·4 0 15·2 0
ESC vs FLU 0 12·3 43·8 31·5 0 0 0 0 0 12·3 0
ESC vs IMP 0 0 38·9 0 16·6 22·3 0 0 0 0 22·3
ESC vs PAR 0 0 46·8 0 6·4 40·4 0 0 0 0 6·4
ESC vs SER 0 0 50 0 0 0 50 0 0 0 0
ESC vs VEN 0 0 50 0 0 0 0 50 0 0 0
FLU vs IMP 0 9·8 0 25·2 15 20·1 0 0 0 9·8 20·1
FLU vs PAR 0 11·6 0 29·8 5·6 35·7 0 0 0 11·6 5·6
FLU vs SER 0 12·3 0 31·5 0 0 43·8 0 0 12·3 0
FLU vs VEN 0 12·3 0 31·5 0 0 0 43·8 0 12·3 0
IMP vs SER 0 0 0 0 16·6 22·3 38·9 0 0 0 22·3
IMP vs VEN 0 0 0 0 16·6 22·3 0 38·9 0 0 22·3
PAR vs SER 0 0 0 0 6·4 40·4 46·8 0 0 0 6·4
PAR vs VEN 0 0 0 0 6·4 40·4 0 46·8 0 0 6·4
SER vs VEN 0 0 0 0 0 0 50 50 0 0 0
total 9·3 8 9·3 9·3 5·6 17·2 9·3 9·3 9·3 5·9 7·6

65
b· Contributions summary of risk of bias assessments for each outcome
Risk of bias assessment* for any direct comparisons included in the network for each outcome
Mean overall change
in symptoms
Discontinuation due
to adverse events Response rate
All-cause
discontinuation
Suicidal behavior
or ideation
AMI vs PBO Moderate Moderate Moderate Moderate NA
CIT vs PBO High High High High High
CLO vs PAR Low Low Low Low Low
DES vs PBO Moderate Moderate Moderate Moderate NA
DUL vs PBO Low Low Low Low Low
DUL vs FLU Low Low Low Low Low
ESC vs PBO Moderate Moderate Moderate Moderate Moderate
FLU vs NOR Moderate NA Moderate Moderate NA
FLU vs PBO Moderate Moderate Moderate Moderate Moderate
FLU vs VEN Moderate NA Moderate Moderate NA
IMP vs PBO High High High High High
IMP vs PAR High High High High High
MIR vs PBO High Moderate NA Moderate NA
NEF vs PBO Moderate Moderate Moderate Moderate NA
NOR vs PBO Moderate NA Moderate Moderate NA
PAR vs PBO Moderate Moderate Moderate Moderate Moderate
SER vs PBO High High High High High
VEN vs PBO High High High High High
*The overall risk of bias for each direct comparison was based on the risk of bias of individual studies contributing to that comparison,
and was classified as high, moderate or low·

66
AMI=amitriptyline, CIT=citalopram, CLO=clomipramine, DES=desipramine, DUL=duloxetine, ESC=escitalopram, FLU=fluoxetine,
IMP=imipramine, MIR=mirtazapine, NEF=nefazodone, NOR=nortriptyline, PAR=paroxetine, SER=sertraline, VEN=venlafaxine,
PBO=placebo, NA= no available·

67
The contribution of direct comparisons to mixed or indirect comparisons by risk of bias classification and outcome*
Mean overall change in
symptoms
Discontinuation due to adverse
events Response rate All-cause discontinuation Suicidal behavior or ideation
Low
(%)
Moderate
(%)
High
(%)
Low
(%)
Moderate
(%)
High
(%)
Low
(%)
Moderate
(%)
High
(%)
Low
(%)
Moderate
(%)
High
(%)
Low
(%)
Moderate
(%)
High
(%)
PBO vs AMI 0 100 0 0 99·7 0 0 99·9 0 0 99·9 0 ··· ··· ···
PBO vs CIT 0 0 100 0 0 100 0 0 100 0 0 100 0 0 100
PBO vs DES 0 100 0 0 99·7 0 0 100 0 0 100 0 ··· ··· ···
PBO vs DUL 72·3 24·2 3·5 85·2 14·7 0 73·7 23·7 2·5 64·8 34·3 0·8 73·5 26·4 0
PBO vs ESC 0 100 0 0 99·9 0 0 100 0 0 100 0 0 100 0
PBO vs FLU 54 40·2 5·8 33·4 66·6 0 51 44·2 4·7 43·2 55·4 1·4 43·8 56·2 0
PBO vs IMP 0 28·4 71·6 0 31·4 68·5 0 26·6 73·4 0 43 57·1 0 36·4 63·5
PBO vs MIR 0 0 100 0 99·9 0 ··· ··· ··· 0 100 0 ··· ··· ···
PBO vs NEF 0 100 0 0 99·9 0 0 100 0 0 100 0 ··· ··· ···
PBO vs NOR 8·8 90·2 0·9 ··· ··· ··· 22·2 75·8 2·1 14·4 85·2 0·5 ··· ··· ···
PBO vs PAR 0 77·2 22·8 0 67·3 32·8 0 76·4 23·6 0 89·1 10·8 0 76 24
PBO vs SER 0 0 100 0 0 100 0 0 100 0 0 99·9 0 0 99·9
PBO vs VEN 10·2 17·9 71·8 0 0 100 8·8 17·7 73·6 1·4 4·2 94·5 0 0 99·9
CLO vs PAR 100 0 0 100 0 0 100 0 0 100 0 0 100 0 0
DUL vs FLU 76·1 20·8 3 61·5 38·5 0 73·8 23·7 2·5 82·4 17·3 0·4 73·5 26·5 0
FLU vs NOR 31·2 65·5 3·3 ··· ··· ··· 21·2 76·8 2 20·2 79·1 0·6 ··· ··· ···
FLU vs VEN 32·6 31·2 36·3 18·2 36·3 45·4 30 32·4 37·5 24·8 32·9 42·3 24·6 31·5 43·8

68
IMP vs PAR 0 32·2 67·9 0 25·7 74·3 0 33·5 66·5 0 15·9 84 0 22·5 77·5
PBO vs CLO 47 40·9 12 45·5 36·6 17·8 46·9 40·6 12·6 48·6 45·8 5·6 46·8 40·4 12·8
AMI vs CIT 0 50 50 0 49·9 50 0 50 50 0 50 50 ··· ··· ···
AMI vs CLO 32 59·9 8·2 31·3 56·4 12·2 31·9 59·5 8·6 32·7 63·5 3·8 ··· ··· ···
AMI vs DES 0 100 0 0 100 0 0 100 0 0 100 0 ··· ··· ···
AMI vs DUL 41·9 56 2 46·1 53·9 0 42·4 56 1·5 39·3 60·2 0·5 ··· ··· ···
AMI vs ESC 0 100 0 0 99·9 0 0 99·9 0 0 100 0 ··· ··· ···
AMI vs FLU 32·6 64 3·5 18·2 81·7 0 30·2 66·8 2·8 24·6 74·5 0·8 ··· ··· ···
AMI vs IMP 0 58·3 41·8 0 59·2 40·7 0 57·6 42·4 0 63·7 36·4 ··· ··· ···
AMI vs MIR 0 50 50 0 99·9 0 ··· ··· ··· 0 100 0 ··· ··· ···
AMI vs NEF 0 100 0 0 99·9 0 0 100 0 0 100 0 ··· ··· ···
AMI vs NOR 4·8 94·6 0·5 ··· ··· ··· 14·2 84·6 1·3 8·6 91·1 0·3 ··· ··· ···
AMI vs PAR 0 87·9 12 0 82·1 17·8 0 87·4 12·6 0 94·4 5·6 ··· ··· ···
AMI vs SER 0 50 50 0 49·9 50 0 50 50 0 50 50 ··· ··· ···
AMI vs VEN 5·6 55·1 39·2 0 49·9 50 4·8 55·4 39·9 0·7 51·2 48 ··· ··· ···
CIT vs CLO 32 27·9 40·2 31·3 25·2 43·5 31·9 27·6 40·5 32·7 30·8 36·5 31·9 27·5 40·5
CIT vs DES 0 50 50 0 49·9 50 0 50 50 0 50 50 ··· ··· ···
CIT vs DUL 41·9 14 44 46·1 8 46 42·4 13·6 43·9 39·3 20·9 39·8 42·4 15·2 42·4
CIT vs ESC 0 50 50 0 50 50 0 50 50 0 50 50 0 50 50
CIT vs FLU 32·6 24·2 43·3 18·2 36·3 45·4 30·2 26·1 43·5 24·6 31·7 43·6 24·6 31·5 43·8
CIT vs IMP 0 16·6 83·5 0 18·6 81·4 0 15·4 84·7 0 27·4 72·7 0 22·3 77·8
CIT vs MIR 0 0 100 0 50 50 ··· ··· ··· 0 50 50 ··· ··· ···
CIT vs NEF 0 50 50 0 50 50 0 50 50 0 50 50 ··· ··· ···

69
CIT vs NOR 4·8 48·9 46·2 ··· ··· ··· 14·2 48·1 37·8 8·6 50·6 40·9 ··· ··· ···
CIT vs PAR 0 40·9 59 0 36·6 63·3 0 40·6 59·5 0 45·8 54·2 0 40·4 59·6
CIT vs SER 0 0 100 0 0 100 0 0 100 0 0 100 0 0 100
CIT vs VEN 5·6 9·7 84·6 0 0 100 4·8 9·6 85·7 0·8 2 97·2 0 0 100
CLO vs DES 32 59·9 8·2 31·3 56·4 12·2 31·9 59·5 8·6 32·7 63·5 3·8 ··· ··· ···
CLO vs DUL 56·9 34·4 8·8 59·4 29 11·6 57·4 34 8·6 55·6 41·1 3·6 57·2 35 7·8
CLO vs ESC 32 59·9 8·2 31·3 56·5 12·2 31·9 59·5 8·6 32·7 63·5 3·8 31·9 59·4 8·6
CLO vs FLU 49·8 40·6 9·4 41·2 47·2 11·6 48·6 41·9 9·3 46·5 49·5 3·9 45·7 46·4 8
CLO vs IMP 40·4 19·2 40·4 42·6 14·7 42·6 39·9 20·1 39·9 45·7 8·6 45·7 43·7 12·7 43·7
CLO vs MIR 32 27·9 40·2 31·3 56·5 12·2 ··· ··· ··· 32·7 63·5 3·8 ··· ··· ···
CLO vs NEF 32 59·9 8·2 31·3 56·5 12·2 31·9 59·5 8·6 32·7 63·5 3·8 ··· ··· ···
CLO vs NOR 33·3 58·6 8·1 ··· ··· ··· 35·8 56·4 7·9 34·4 62·2 3·4 ··· ··· ···
CLO vs SER 32 27·9 40·2 31·3 25·2 43·5 31·9 27·6 40·5 32·7 30·8 36·5 31·9 27·5 40·5
CLO vs VEN 33·8 32·7 33·7 31·3 25·2 43·5 33·3 32·5 34·2 32·8 31·8 35·4 31·9 27·5 40·6
DES vs DUL 41·9 56 2 46·1 53·8 0 42·4 56 1·5 39·3 60·2 0·5 ··· ··· ···
DES vs ESC 0 100 0 0 99·9 0 0 100 0 0 100 0 ··· ··· ···
DES vs FLU 32·6 64 3·5 18·2 81·6 0 30·2 66·8 2·8 24·6 74·5 0·8 ··· ··· ···
DES vs IMP 0 58·3 41·8 0 59·2 40·7 0 57·6 42·4 0 63·7 36·4 ··· ··· ···
DES vs MIR 0 50 50 0 99·9 0 ··· ··· ··· 0 100 0 ··· ··· ···
DES vs NEF 0 100 0 0 99·9 0 0 100 0 0 100 0 ··· ··· ···
DES vs NOR 4·8 94·6 0·5 ··· ··· ··· 14·2 84·6 1·3 8·6 91·2 0·3 ··· ··· ···
DES vs PAR 0 87·9 12 0 82 17·8 0 87·5 12·6 0 94·4 5·6 ··· ··· ···
DES vs SER 0 50 50 0 49·9 50 0 50 50 0 50 50 ··· ··· ···

70
DES vs VEN 5·6 55·1 39·2 0 49·9 50 4·8 55·4 39·9 0·7 51·2 48 ··· ··· ···
DUL vs ESC 41·9 56 2 46·1 54 0 42·4 56 1·5 39·3 60·2 0·5 42·4 57·6 0
DUL vs IMP 36 26·2 37·7 38 24 38 36·7 25·2 38 30·3 38·9 30·7 34·2 31·7 34·1
DUL vs MIR 41·9 14 44 46·1 54 0 ··· ··· ··· 39·3 60·2 0·5 ··· ··· ···
DUL vs NEF 41·9 56 2 46·1 54 0 42·4 56 1·5 39·3 60·2 0·5 ··· ··· ···
DUL vs NOR 43·9 54·4 1·6 ··· ··· ··· 49·7 50·3 0·1 44·5 55·2 0·3 ··· ··· ···
DUL vs PAR 39·8 48 12·1 42·2 41·3 16·6 40·2 47·7 12·2 38·4 56·6 4·9 40·1 49 11
DUL vs SER 41·9 14 44 46·1 8 46 42·4 13·6 43·9 39·3 20·9 39·8 42·4 15·2 42·4
DUL vs VEN 45·3 17·8 36·9 46·1 8 46 45·3 16·9 37·9 40 21·5 38·5 42·4 15·2 42·4
ESC vs FLU 32·6 64 3·5 18·2 81·7 0 30·2 66·8 2·8 24·6 74·5 0·8 24·6 75·3 0
ESC vs IMP 0 58·3 41·8 0 59·3 40·7 0 57·6 42·4 0 63·7 36·4 0 61·2 38·9
ESC vs MIR 0 50 50 0 100 0 ··· ··· ··· 0 100 0 ··· ··· ···
ESC vs NEF 0 100 0 0 100 0 0 100 0 0 100 0 ··· ··· ···
ESC vs NOR 4·8 94·6 0·5 ··· ··· ··· 14·2 84·6 1·3 8·6 91·2 0·3 ··· ··· ···
ESC vs PAR 0 87·9 12 0 82·1 17·8 0 87·5 12·6 0 94·4 5·6 0 87·2 12·8
ESC vs SER 0 50 50 0 50 50 0 50 50 0 50 50 0 50 50
ESC vs VEN 5·6 55·1 39·2 0 50 50 4·8 55·4 39·9 0·8 51·2 48 0 50 50
FLU vs IMP 28·2 34·5 37·3 15 47·3 37·6 26·4 35·8 37·9 18·6 48·3 33 19·6 45·3 35·1
FLU vs MIR 32·6 24·2 43·3 18·2 81·7 0 ··· ··· ··· 24·6 74·5 0·8 ··· ··· ···
FLU vs NEF 32·6 64 3·5 18·2 81·7 0 30·2 66·8 2·8 24·6 74·5 0·8 ··· ··· ···
FLU vs PAR 31 56·1 13·1 16·8 67 16·4 28·8 58·3 13·1 24·1 70·4 5·6 23·2 65·5 11·2
FLU vs SER 32·6 24·2 43·3 18·2 36·3 45·4 30·2 26·1 43·5 24·6 31·7 43·6 24·6 31·5 43·8
IMP vs MIR 0 16·6 83·5 0 59·3 40·7 ··· ··· ··· 0 63·7 36·4 ··· ··· ···

71
IMP vs NEF 0 58·3 41·8 0 59·2 40·7 0 57·7 42·4 0 63·7 36·4 ··· ··· ···
IMP vs NOR 4 56·9 39·1 ··· ··· ··· 12·4 54·2 33·4 6·6 62·2 31·3 ··· ··· ···
IMP vs SER 0 16·6 83·5 0 18·6 81·4 0 15·4 84·7 0 27·4 72·7 0 22·3 77·8
IMP vs VEN 4·8 23·6 71·7 0 18·6 81·4 4 22·5 73·4 0·6 28·5 70·9 0 22·3 77·8
MIR vs NEF 0 50 50 0 100 0 ··· ··· ··· 0 100 0 ··· ··· ···
MIR vs NOR 4·8 48·9 46·2 ··· ··· ··· ··· ··· ··· 8·6 91·2 0·3 ··· ··· ···
MIR vs PAR 0 40·9 59 0 82·1 17·8 ··· ··· ··· 0 94·4 5·6 ··· ··· ···
MIR vs SER 0 0 100 0 50 50 ··· ··· ··· 0 50 50 ··· ··· ···
MIR vs VEN 5·6 9·7 84·6 0 50 50 ··· ··· ··· 0·8 51·2 48 ··· ··· ···
NEF vs NOR 4·8 94·6 0·5 ··· ··· ··· 14·2 84·6 1·3 8·6 91·2 0·3 ··· ··· ···
NEF vs PAR 0 87·9 12 0 82·1 17·8 0 87·5 12·6 0 94·4 5·6 ··· ··· ···
NEF vs SER 0 50 50 0 50 50 0 50 50 0 50 50 ··· ··· ···
NEF vs VEN 5·6 55·1 39·2 0 50 50 4·8 55·4 39·9 0·8 51·2 48 ··· ··· ···
NOR vs PAR 4·6 83·9 11·5 ··· ··· ··· 13·4 75·9 10·6 8·4 86·9 4·9 ··· ··· ···
NOR vs SER 4·8 48·9 46·2 ··· ··· ··· 14·2 48·1 37·8 8·6 50·6 40·9 ··· ··· ···
NOR vs VEN 1 57 41·9 ··· ··· ··· 11·4 55 33·5 8 51·9 40 ··· ··· ···
PAR vs SER 0 40·9 59 0 36·6 63·3 0 40·6 59·5 0 45·8 54·2 0 40·4 59·6
PAR vs VEN 5·2 46·6 48 0 36·6 63·3 4·4 46·5 49·2 0·6 47·1 52·1 0 40·4 59·6
SER vs VEN 5·6 9·7 84·6 0 0 100 4·8 9·6 85·7 0·7 2 97·2 0 0 100
Total Network 17·8 49 33·1 16 52·5 31·6 19·5 52·2 28·3 16·3 58·3 25·3 23·2 35·8 41·1
*Contributions of direct comparisons at high, moderate or low risk of bias to mixed or indirect comparisons were calculated as the sum of direct comparisons with corresponding
risks of bias, weighted by the contribution matrix; AMI=amitriptyline, CIT=citalopram, CLO=clomipramine, DES=desipramine, DUL=duloxetine, ESC=escitalopram,
FLU=fluoxetine, IMP=imipramine, MIR=mirtazapine, NEF=nefazodone, NOR=nortriptyline, PAR=paroxetine, SER=sertraline, VEN=venlafaxine, PBO=placebo

72
Contributions summary of direct comparisons for each risk of bias assessment for the mean
overall change in symptoms
Legend: AMI=amitriptyline, CIT=citalopram, CLO=clomipramine, DES=desipramine,
DUL=duloxetine, ESC=escitalopram, FLU=fluoxetine, IMP=imipramine, MIR=mirtazapine,
NEF=nefazodone, NOR=nortriptyline, PAR=paroxetine, SER=sertraline, VEN=venlafaxine,
PBO=placebo
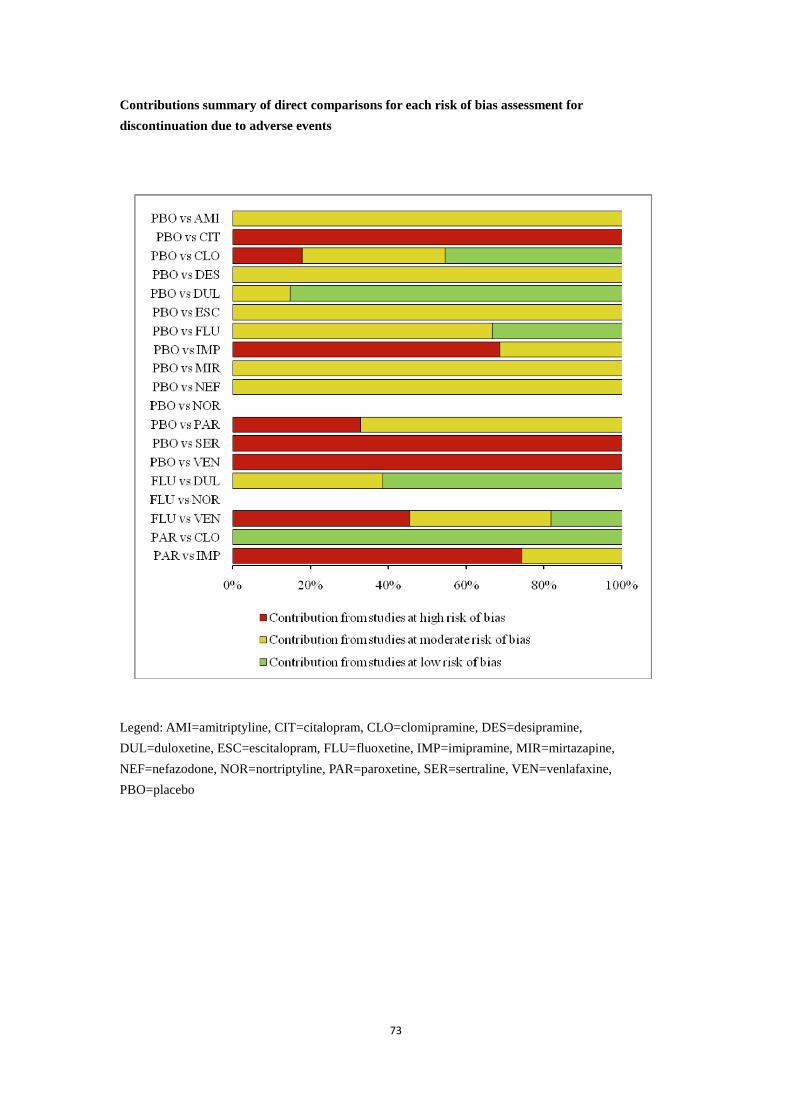
73
Contributions summary of direct comparisons for each risk of bias assessment for
discontinuation due to adverse events
Legend: AMI=amitriptyline, CIT=citalopram, CLO=clomipramine, DES=desipramine,
DUL=duloxetine, ESC=escitalopram, FLU=fluoxetine, IMP=imipramine, MIR=mirtazapine,
NEF=nefazodone, NOR=nortriptyline, PAR=paroxetine, SER=sertraline, VEN=venlafaxine,
PBO=placebo
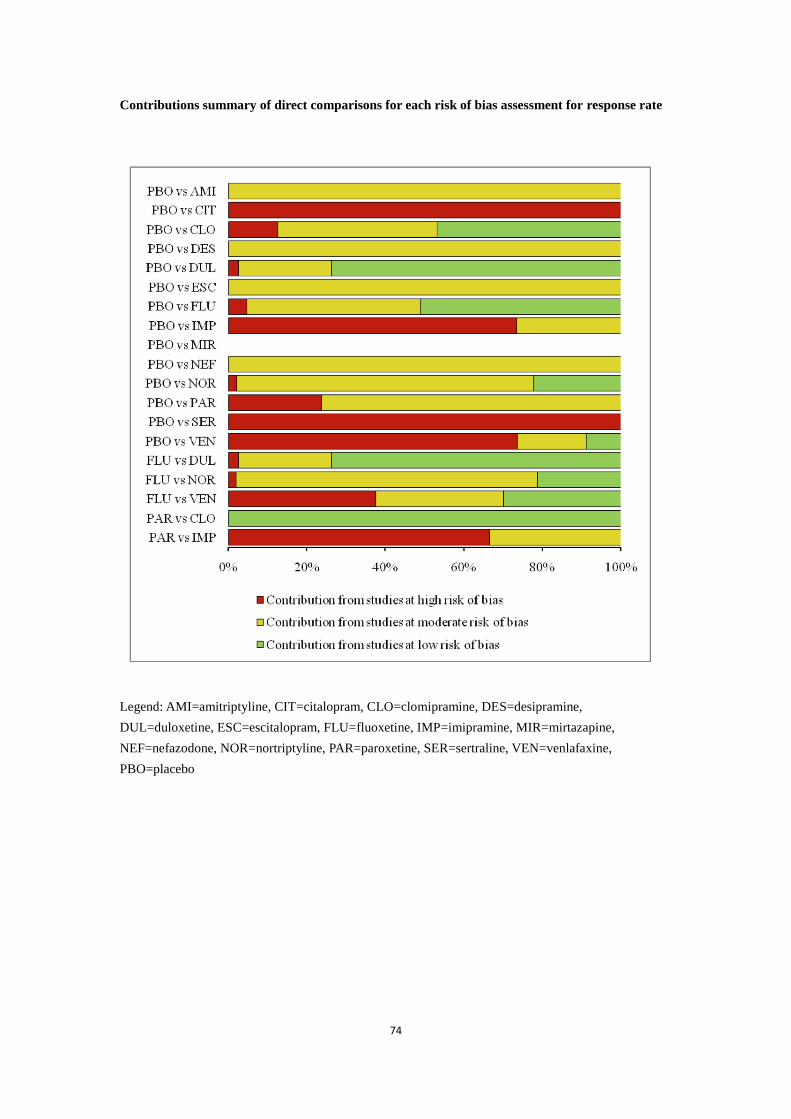
74
Contributions summary of direct comparisons for each risk of bias assessment for response rate
Legend: AMI=amitriptyline, CIT=citalopram, CLO=clomipramine, DES=desipramine,
DUL=duloxetine, ESC=escitalopram, FLU=fluoxetine, IMP=imipramine, MIR=mirtazapine,
NEF=nefazodone, NOR=nortriptyline, PAR=paroxetine, SER=sertraline, VEN=venlafaxine,
PBO=placebo
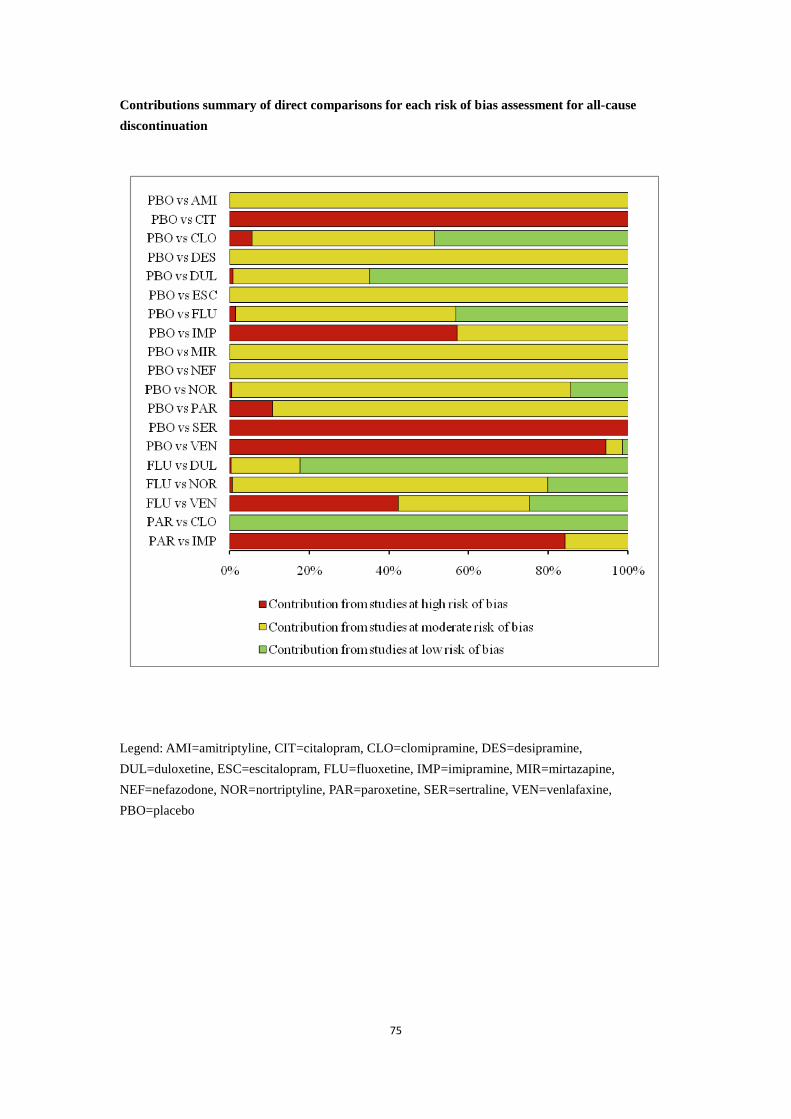
75
Contributions summary of direct comparisons for each risk of bias assessment for all-cause
discontinuation
Legend: AMI=amitriptyline, CIT=citalopram, CLO=clomipramine, DES=desipramine,
DUL=duloxetine, ESC=escitalopram, FLU=fluoxetine, IMP=imipramine, MIR=mirtazapine,
NEF=nefazodone, NOR=nortriptyline, PAR=paroxetine, SER=sertraline, VEN=venlafaxine,
PBO=placebo
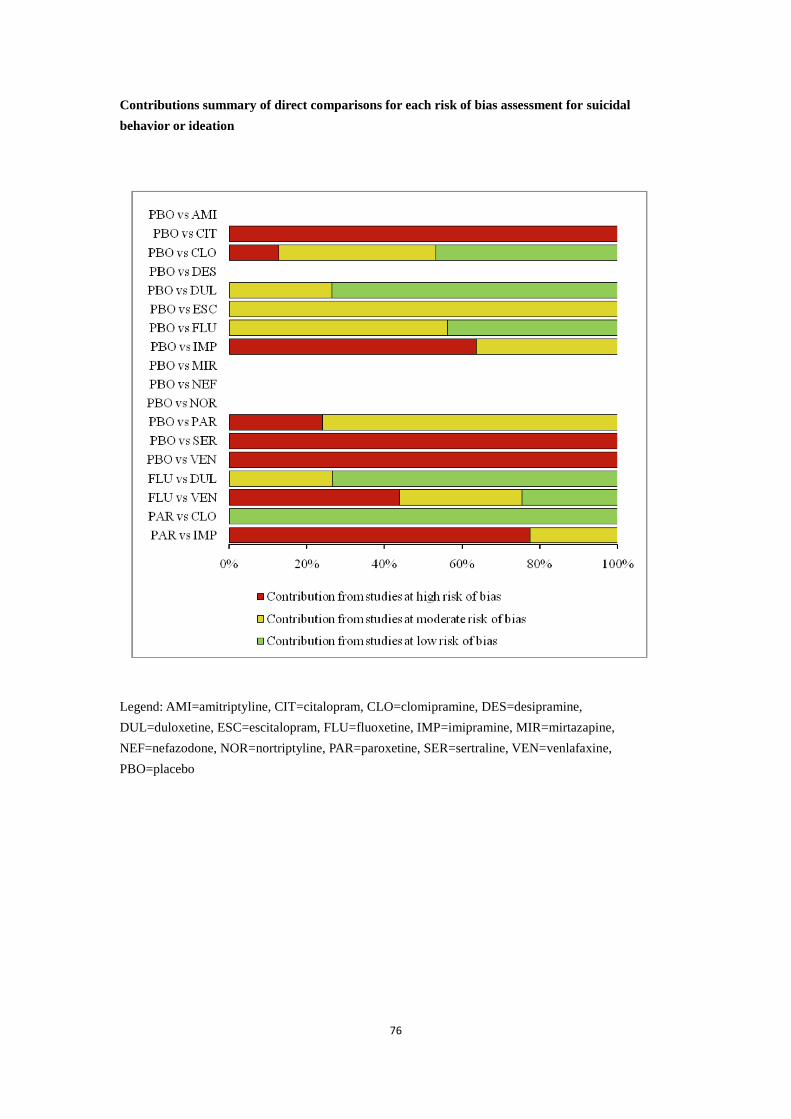
76
Contributions summary of direct comparisons for each risk of bias assessment for suicidal
behavior or ideation
Legend: AMI=amitriptyline, CIT=citalopram, CLO=clomipramine, DES=desipramine,
DUL=duloxetine, ESC=escitalopram, FLU=fluoxetine, IMP=imipramine, MIR=mirtazapine,
NEF=nefazodone, NOR=nortriptyline, PAR=paroxetine, SER=sertraline, VEN=venlafaxine,
PBO=placebo

77
APPENDIX 15
Evaluation of the quality of evidence using GRADE framework for primary
outcomes
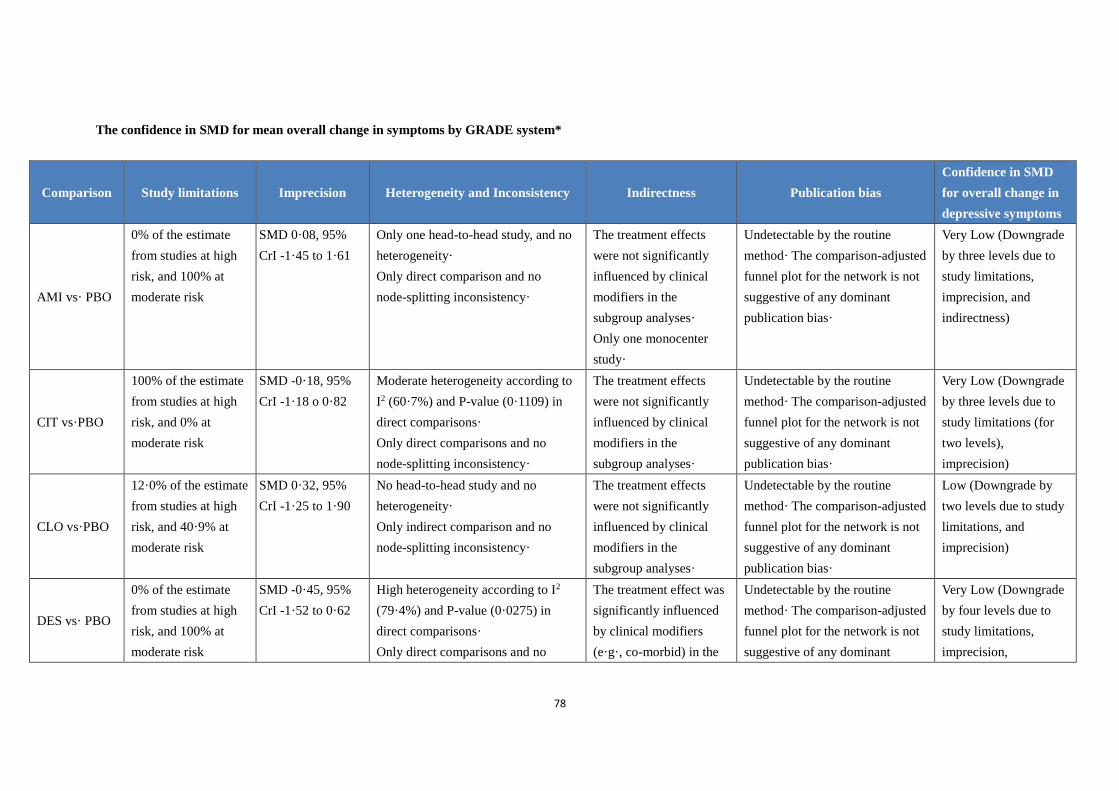
78
The confidence in SMD for mean overall change in symptoms by GRADE system*
Comparison Study limitations Imprecision Heterogeneity and Inconsistency Indirectness Publication bias
Confidence in SMD
for overall change in
depressive symptoms
AMI vs· PBO
0% of the estimate
from studies at high
risk, and 100% at
moderate risk
SMD 0·08, 95%
CrI -1·45 to 1·61
Only one head-to-head study, and no
heterogeneity·
Only direct comparison and no
node-splitting inconsistency·
The treatment effects
were not significantly
influenced by clinical
modifiers in the
subgroup analyses·
Only one monocenter
study·
Undetectable by the routine
method· The comparison-adjusted
funnel plot for the network is not
suggestive of any dominant
publication bias·
Very Low (Downgrade
by three levels due to
study limitations,
imprecision, and
indirectness)
CIT vs·PBO
100% of the estimate
from studies at high
risk, and 0% at
moderate risk
SMD -0·18, 95%
CrI -1·18 o 0·82
Moderate heterogeneity according to
I2 (60·7%) and P-value (0·1109) in
direct comparisons·
Only direct comparisons and no
node-splitting inconsistency·
The treatment effects
were not significantly
influenced by clinical
modifiers in the
subgroup analyses·
Undetectable by the routine
method· The comparison-adjusted
funnel plot for the network is not
suggestive of any dominant
publication bias·
Very Low (Downgrade
by three levels due to
study limitations (for
two levels),
imprecision)
CLO vs·PBO
12·0% of the estimate
from studies at high
risk, and 40·9% at
moderate risk
SMD 0·32, 95%
CrI -1·25 to 1·90
No head-to-head study and no
heterogeneity·
Only indirect comparison and no
node-splitting inconsistency·
The treatment effects
were not significantly
influenced by clinical
modifiers in the
subgroup analyses·
Undetectable by the routine
method· The comparison-adjusted
funnel plot for the network is not
suggestive of any dominant
publication bias·
Low (Downgrade by
two levels due to study
limitations, and
imprecision)
DES vs· PBO
0% of the estimate
from studies at high
risk, and 100% at
moderate risk
SMD -0·45, 95%
CrI -1·52 to 0·62
High heterogeneity according to I2
(79·4%) and P-value (0·0275) in
direct comparisons·
Only direct comparisons and no
The treatment effect was
significantly influenced
by clinical modifiers
(e·g·, co-morbid) in the
Undetectable by the routine
method· The comparison-adjusted
funnel plot for the network is not
suggestive of any dominant
Very Low (Downgrade
by four levels due to
study limitations,
imprecision,

79
node-splitting inconsistency· subgroup analyses· publication bias· heterogeneity and
indirectness)
DUL vs· PBO
3·5% of the estimate
from studies at high
risk, and 24··2% at
moderate risk
SMD -0·35, 95%
CrI -1·24 to 0·54
Mild heterogeneity according to I2
(17·0%) and P-value (0·2723) in
direct comparisons·
There is an inconsistency between the
direct and indirect estimate
(Node-split p=0·000 and tau
=0·0804)·
The treatment effects
were not significantly
influenced by clinical
modifiers in the
subgroup analyses·
Undetectable by the routine
method· The comparison-adjusted
funnel plot for the network is not
suggestive of any dominant
publication bias·
Low (Downgrade by
two levels due to
imprecision and
inconsistency)
ESC vs· PBO
0% of the estimate
from studies at high
risk, and 100% at
moderate risk
SMD -0·17, 95%
CrI -1·15 to 0·81
Mild heterogeneity according to I2
(0%) and P-value (0·6070) in direct
comparisons·
Only direct comparisons and no
node-splitting inconsistency·
The treatment effects
were not significantly
influenced by clinical
modifiers in the
subgroup analyses·
Undetectable by the routine
method· The comparison-adjusted
funnel plot for the network is not
suggestive of any dominant
publication bias·
Low (Downgrade by
two levels due to study
limitations and
imprecision)
FLU vs· PBO
5·8% of the estimate
from studies at high
risk, and 40·2% at
moderate risk
SMD -0·51, 95%
CrI -0·99 to -0·03
Moderate heterogeneity according to
I2 (67·4%) and P-value (0·0031) in
direct comparisons· There is an
inconsistency between direct and
indirect estimate (Node-split
p=0·0215 and tau= 0·3305)
The treatment effects
were significantly
influenced by some
clinical modifiers in the
subgroup analyses·
Undetectable by the routine
method· The comparison-adjusted
funnel plot for the network is not
suggestive of any dominant
publication bias·
Very Low (Downgrade
by four levels due to
study limitations,
heterogeneity and
inconsistency, and
indirectness)
IMP vs· PBO
71·6% of the estimate
from studies at high
risk, and 28·4% at
moderate risk
SMD -0·01, 95%
CrI -0·98 to 0·95
Mild heterogeneity according to I2
(0%) and P-value (0·6430) in direct
comparisons·
No inconsistency between the direct
and indirect estimate (Node-split p=
0·6477 and tau= 0·3130)·
The treatment effects
were not significantly
influenced by clinical
modifiers in the
subgroup analyses·
Undetectable by the routine
method· The comparison-adjusted
funnel plot for the network is not
suggestive of any dominant
publication bias·
Very Low (Downgrade
by three levels due to
study limitations (for
two levels),
imprecision)

80
MIR vs·PBO
100% of the estimate
from studies at high
risk, and 0% at
moderate risk
SMD -0·24, 95%
CrI -1·25 to 0·77
Mild heterogeneity according to I2
(14·0%) and P-value (0·2810) in
direct comparisons·
Only direct comparison, and no
node-splitting inconsistency·
The treatment effects
were not significantly
influenced by clinical
modifiers in the
subgroup analyses·
Undetectable by the routine
method· The comparison-adjusted
funnel plot for the network is not
suggestive of any dominant
publication bias·
Very Low (Downgrade
by three levels due to
study limitations (for
two levels),
imprecision)
NEF vs·PBO
0% of the estimate
from studies at high
risk, and 100% at
moderate risk
SMD -0·15, 95%
CrI -1·14 to 0·85
Moderate heterogeneity according to
I2 (43·2%) and P-value (0·1845) in
direct comparisons·
Only direct comparisons, and no
node-splitting inconsistency·
The treatment effects
were not significantly
influenced by clinical
modifiers in the
subgroup analyses·
Undetectable by the routine
method· The comparison-adjusted
funnel plot for the network is not
suggestive of any dominant
publication bias·
Low (Downgrade by
two levels due to study
limitations and
imprecision)
NOR vs· PBO
0·9% of the estimate
from studies at high
risk, and 90·2% at
moderate risk
SMD 1·14, 95%
CrI 0·25 to 2·02
Mild heterogeneity according to I2
(0%) and P-value (0·3214) in direct
comparisons· There is an
inconsistency between direct and
indirect estimate (Node-split p<
0·0001 and tau= 0·1427)·
The treatment effects
were significantly
influenced by most
clinical modifiers in the
subgroup analyses·
Undetectable by the routine
method· The comparison-adjusted
funnel plot for the network is not
suggestive of any dominant
publication bias·
Very Low (Downgrade
by three levels due to
tudy limitations,
inconsistency and
indirectness)
PAR vs·PBO
22·8% of the estimate
from studies at high
risk, and 77·2% at
moderate risk
SMD -0·16, 95%
CrI -0·86 to 0·54
Mild heterogeneity according to I2
(0%) and P-value (0·3927) in direct
comparisons·
No inconsistency between direct and
indirect estimate (Node-split p=
0·6866 and tau= 0·3053)·
The treatment effects
were not significantly
influenced by clinical
modifiers in the
subgroup analyses·
Undetectable by the routine
method· The comparison-adjusted
funnel plot for the network is not
suggestive of any dominant
publication bias·
Low (Downgrade by
two levels due to study
limitations, and
imprecision)
SER vs· PBO
100% of the estimate
from studies at high
risk, and 0% at
moderate risk
SMD -0·23, 95%
CrI -1·21 to 0·77
Mild heterogeneity according to I2
(0%) and P-value (0·7951) in direct
comparisons·
Only direct comparisons, and no
The treatment effects
were not significantly
influenced by clinical
modifiers in the
Undetectable by the routine
method· The comparison-adjusted
funnel plot for the network is not
suggestive of any dominant
Very Low (Downgrade
by three levels due to
study limitations (for
two levels),

81
node-splitting inconsistency· subgroup analyses· publication bias· imprecision)
VEN vs· PBO
71·8% of the
estimate from studies
at high risk, and
17·9% at moderate
risk
SMD -0·26, 95%
CrI -1·10 to 0·58
Mild heterogeneity according to I2
(0%) and P-value (0·9094) in direct
comparisons·
No inconsistency between direct and
indirect estimate (Node-split
p=0·6164 and tau= 0·3118)·
The treatment effects
were not significantly
influenced by clinical
modifiers in the
subgroup analyses·
Undetectable by the routine
method· The comparison-adjusted
funnel plot for the network is not
suggestive of any dominant
publication bias·
Very Low (Downgrade
by three levels due to
study limitations (for
two levels) and
imprecision)
FLU vs· DUL
3% of the estimate
from studies at high
risk, and 20·8% at
moderate risk
SMD -0·16, 95%
CrI -1·05 to 0·72
Mild heterogeneity according to I2
(0%) and P-value (0·6900) in direct
comparisons· There is an
inconsistency between direct and
indirect estimate (Node-split p=
0·0006 and tau= 0·0804)·
The treatment effects
were not significantly
influenced by clinical
modifiers in the
subgroup analyses
Undetectable by the routine
method· The comparison-adjusted
funnel plot for the network is not
suggestive of any dominant
publication bias·
Low (Downgrade by
two levels due to
imprecision and
inconsistency)
FLU vs· NOR
3·3% of the estimate
from studies at high
risk, and 65·5% at
moderate risk
SMD -1·65, 95%
CrI -2·57 to -0·72
Only one head-to-head study and no
heterogeneity· There is an
inconsistency between direct and
indirect estimate (Node-split
p<0·0001 and tau= 0·1427)·
Treatment effects not
significantly influenced
by clinical modifiers in
subgroup analyses· Only
one monocenter study·
Undetectable by the routine
method· The comparison-adjusted
funnel plot for the network is not
suggestive of any dominant
publication bias·
Very Low (Downgrade
by three levels due to
study limitations,
inconsistency, and
indirectness)
FLU vs· VEN
36·3% of the estimate
from studies at high
risk, and 31·2% at
moderate risk
SMD -0·25, 95%
CrI -1·13 to 0·64
Only one head-to-head study and no
heterogeneity· No inconsistency
between direct and indirect estimate
(Node-split p= 0·6164 and tau=
0·3118)·
The treatment effect was
significantly influenced
by clinical modifiers
(e·g·, risk bias) in the
subgroup analyses·
Undetectable by the routine
method· The comparison-adjusted
funnel plot for the network is not
suggestive of any dominant
publication bias·
Very Low (downgrade
by three levels due to
study limitations,
imprecision and
indirectness)
PAR vs· CLO
0% of the estimate
from studies at high
risk, and 0% at
SMD -0·48, 95%
CrI -1·90 to 0·93
Only one head-to-head study and no
heterogeneity· No inconsistency
between direct and indirect estimate
The treatment effects
were not significantly
influenced by clinical
Undetectable by the routine
method· The comparison-adjusted
funnel plot for the network is not
Moderate (Downgrade
by one level due to
imprecision)

82
moderate risk (Node-split p= 0·9977 and tau=
0·2777)·
modifiers in the
subgroup analyses·
suggestive of any dominant
publication bias·
PAR vs· IMP
67·9% of the estimate
from studies at high
risk, and 32·2% at
moderate risk
SMD -0·15, 95%
CrI -1·21 to 0·91
Only one head-to-head study and no
heterogeneity· No inconsistency
between direct and indirect estimate
(Node-split p= 0·5796 and tau=
0·3030)·
The treatment effects
were significantly
influenced by some
clinical modifiers in the
subgroup analyses·
Undetectable by the routine
method· The comparison-adjusted
funnel plot for the network is not
suggestive of any dominant
publication bias·
Very Low (Downgrade
by four levels due to
study limitations (two
levels), imprecision
and indirectness)
Ranking of
treatment
33·1% from studies
at high risk, and
49·0% at moderate
risk
SUCRA plots
suggested the
imprecision in a
ranking of
treatments·
Mild heterogeneity for mean overall
change in symptoms in network
meta-analyses according to global I2
(33·2%)· But, there is a significant
inconsistency in test of global
inconsistency (p<0·0001) and few
inconsistency in local inconsistency·
The overall effects were
not significantly
influenced by clinical
modifiers in the
subgroup analyses·
The network funnel plot
suggested no dominant
publication bias
Very low (Downgrade
by three levels due to
study limitations,
imprecision and
inconsistency)
* Salanti G, Del Giovane C, Chaimani A, Caldwell DM, Higgins JP· Evaluating the quality of evidence from a network meta-analysis· PLoS One· 2014 Jul 3;9(7):e99682

83
The confidence in OR for discontinuation due to adverse events by GRADE system*
Comparison Study limitations Imprecision Heterogeneity and
Inconsistency Indirectness Publication bias
Confidence in OR for
discontinuation due to
adverse events
AMI vs· PBO
0% of the estimate
from studies at high
risk, and 99·7% at
moderate risk
OR 0·10, 95%
CrI 0·02 to 32·16
Only one head-to-head study, and
no heterogeneity· Only direct
comparison, and no node-splitting
inconsistency·
The treatment effects were
not significantly
influenced by clinical
modifiers in the subgroup
analyses·
Only one monocenter
study·
Undetectable by routine
method· The comparison-adjusted
funnel plot for the network is not
suggestive of any dominant
publication bias·
Very Low (Downgrade
by three levels due to
study limitations,
imprecision, and
indirectness)
CIT vs·PBO
100% of the estimate
from studies at high
risk, and 0% at
moderate risk
OR 1·13, 95%
CrI 0·45 to 3·66
Mild heterogeneity according to I2
(0%) and P-value (0·4895) in
direct comparisons· Only direct
comparisons, and no
node-splitting inconsistency·
The treatment effect was
significantly influenced by
clinical modifiers (e·g·,
mean age) in the subgroup
analyses·
Undetectable by the routine
method· The comparison-adjusted
funnel plot for the network is not
suggestive of any dominant
publication bias·
Very Low (Downgrade
by four levels due to
study limitations (two
levels), imprecision and
indirectness)
CLO vs·PBO
17·8% of the estimate
from studies at high
risk, and 36·6% at
moderate risk
OR 1·27, 95%
CrI 0·36 to 8·33
No head-to-head study and no
heterogeneity· Only indirect
comparison, and no node-splitting
inconsistency·
The treatment effects were
not significantly
influenced by clinical
modifiers in the subgroup
analyses·
Undetectable by routine
method· The comparison-adjusted
funnel plot for the network is not
suggestive of any dominant
publication bias·
Low (Downgrade by two
levels due to study
limitations, and
imprecision)
DES vs· PBO
0% of the estimate
from studies at high
risk, and 99·7% at
moderate risk
OR 2·85, 95%
CrI 0·83 to 21·80
Moderate heterogeneity according
to I2 (74·8%) and P-value
(0·0463) in direct comparisons·
Only direct comparisons, and no
The treatment effect was
significantly influenced by
clinical modifiers (e·g·,
co-morbid) in the
Undetectable by the routine
method· The comparison-adjusted
funnel plot for the network is not
suggestive of any dominant
Very Low (Downgrade
by four levels due to
study limitations,
imprecision,
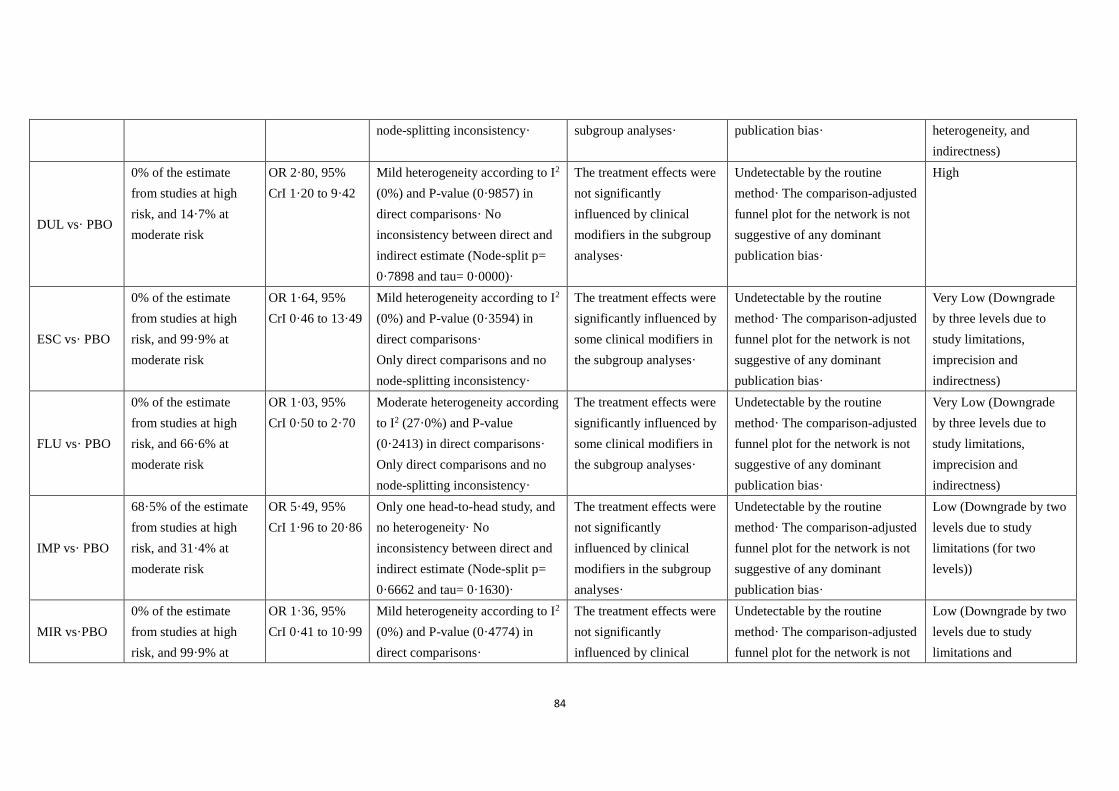
84
node-splitting inconsistency· subgroup analyses· publication bias· heterogeneity, and
indirectness)
DUL vs· PBO
0% of the estimate
from studies at high
risk, and 14·7% at
moderate risk
OR 2·80, 95%
CrI 1·20 to 9·42
Mild heterogeneity according to I2
(0%) and P-value (0·9857) in
direct comparisons· No
inconsistency between direct and
indirect estimate (Node-split p=
0·7898 and tau= 0·0000)·
The treatment effects were
not significantly
influenced by clinical
modifiers in the subgroup
analyses·
Undetectable by the routine
method· The comparison-adjusted
funnel plot for the network is not
suggestive of any dominant
publication bias·
High
ESC vs· PBO
0% of the estimate
from studies at high
risk, and 99·9% at
moderate risk
OR 1·64, 95%
CrI 0·46 to 13·49
Mild heterogeneity according to I2
(0%) and P-value (0·3594) in
direct comparisons·
Only direct comparisons and no
node-splitting inconsistency·
The treatment effects were
significantly influenced by
some clinical modifiers in
the subgroup analyses·
Undetectable by the routine
method· The comparison-adjusted
funnel plot for the network is not
suggestive of any dominant
publication bias·
Very Low (Downgrade
by three levels due to
study limitations,
imprecision and
indirectness)
FLU vs· PBO
0% of the estimate
from studies at high
risk, and 66·6% at
moderate risk
OR 1·03, 95%
CrI 0·50 to 2·70
Moderate heterogeneity according
to I2 (27·0%) and P-value
(0·2413) in direct comparisons·
Only direct comparisons and no
node-splitting inconsistency·
The treatment effects were
significantly influenced by
some clinical modifiers in
the subgroup analyses·
Undetectable by the routine
method· The comparison-adjusted
funnel plot for the network is not
suggestive of any dominant
publication bias·
Very Low (Downgrade
by three levels due to
study limitations,
imprecision and
indirectness)
IMP vs· PBO
68·5% of the estimate
from studies at high
risk, and 31·4% at
moderate risk
OR 5·49, 95%
CrI 1·96 to 20·86
Only one head-to-head study, and
no heterogeneity· No
inconsistency between direct and
indirect estimate (Node-split p=
0·6662 and tau= 0·1630)·
The treatment effects were
not significantly
influenced by clinical
modifiers in the subgroup
analyses·
Undetectable by the routine
method· The comparison-adjusted
funnel plot for the network is not
suggestive of any dominant
publication bias·
Low (Downgrade by two
levels due to study
limitations (for two
levels))
MIR vs·PBO
0% of the estimate
from studies at high
risk, and 99·9% at
OR 1·36, 95%
CrI 0·41 to 10·99
Mild heterogeneity according to I2
(0%) and P-value (0·4774) in
direct comparisons·
The treatment effects were
not significantly
influenced by clinical
Undetectable by the routine
method· The comparison-adjusted
funnel plot for the network is not
Low (Downgrade by two
levels due to study
limitations and

85
moderate risk Only direct comparisons, and no
node-splitting inconsistency·
modifiers in the subgroup
analyses·
suggestive of any dominant
publication bias·
imprecision)
NEF vs·PBO
0% of the estimate
from studies at high
risk, and 99·9% at
moderate risk
OR 1·29, 95%
CrI 0·30 to 21·89
Only one head-to-head study, and
no heterogeneity· Only direct
comparison, and no node-splitting
inconsistency·
Treatment effects not
significantly influenced by
clinical modifiers in
subgroup analyses·
Undetectable by the routine
method· The comparison-adjusted
funnel plot is not suggestive of
any dominant publication bias·
Low (Downgrade by two
levels due to study
limitations, imprecision)
PAR vs·PBO
32·8% of the estimate
from studies at high
risk, and 67·3% at
moderate risk
OR 1·59, 95%
CrI 0·77 to 3·95
Mild heterogeneity according to I2
(0%) and P-value (0·4038) in
direct comparisons· No
inconsistency between direct and
indirect estimate (Node-split p=
0·3765 and tau= 0·0000)·
The treatment effects were
significantly influenced by
some clinical modifiers in
the subgroup analyses·
Undetectable by the routine
method· The comparison-adjusted
funnel plot for the network is not
suggestive of any dominant
publication bias·
Very Low (Downgrade
by three levels due to
study limitations,
imprecision and
indirectness)
SER vs· PBO
100% of the estimate
from studies at high
risk, and 0% at
moderate risk
OR 2·94, 95%
CrI 0·94 to 17·19
Only one head-to-head study, and
no heterogeneity· Only direct
comparison, and no node-splitting
inconsistency·
The treatment effects were
significantly influenced by
some clinical modifiers in
the subgroup analyses·
Undetectable by the routine
method· The comparison-adjusted
funnel plot for the network is not
suggestive of any dominant
publication bias·
Very Low (Downgrade
by four levels due to
study limitations (for two
levels), imprecision and
indirectness)
VEN vs· PBO
100% of the estimate
from studies at high
risk, and 0% at
moderate risk
OR 3·19, 95%
CrI 1·01 to 18·70
Only one head-to-head study, and
no heterogeneity· Only direct
comparison, and no node-splitting
inconsistency·
Treatment effects not
significantly influenced by
clinical modifiers in the
subgroup analyses·
Undetectable by the routine
method· The comparison-adjusted
funnel plot is not suggestive of
any dominant publication bias·
Low (Downgrade by two
levels due to study
limitations (for two
levels))
FLU vs· DUL
0% of the estimate
from studies at high
risk, and 38·5% at
moderate risk
OR 0·31, 95%
CrI 0·13 to 0·95
Moderate heterogeneity according
to I2 (56·1%) and P-value
(0·1312) in direct
comparisons· No inconsistency
between the direct and indirect
The treatment effects were
significantly influenced by
some clinical modifiers in
the subgroup analyses·
Undetectable by the routine
method· The comparison-adjusted
funnel plot for the network is not
suggestive of any dominant
publication bias·
Moderate (Downgrade
by one level due to
indirectness)

86
estimate (Node-split p= 0·7898
and tau= 0·0000)·
FLU vs· VEN
45·4% of the estimate
from studies at high
risk, and 36·3% at
moderate risk
OR 0·39, 95%
CrI 0·05 to 1·47
No head-to-head study and no
heterogeneity· Only indirect
comparison, and no node-splitting
inconsistency·
The treatment effects were
not significantly
influenced by clinical
modifiers in the subgroup
analyses·
Undetectable by the routine
method· The comparison-adjusted
funnel plot for the network is not
suggestive of any dominant
publication bias·
Low (Downgrade by two
levels due to study
limitations and
imprecision)
PAR vs· CLO
0% of the estimate
from studies at high
risk, and 0% at
moderate risk
OR 0·79, 95%
CrI 0·26 to 3·77
Only one head-to-head study, and
no heterogeneity· No
inconsistency betweendirect and
indirect estimate (Node-split p=
0·9948 and tau= 0·0000)·
The treatment effects were
not significantly
influenced by clinical
modifiers in the subgroup
analyses·
Undetectable by the routine
method· The comparison-adjusted
funnel plot for the network is not
suggestive of any dominant
publication bias·
Moderate (Downgrade
by one level due to
imprecision)
PAR vs· IMP
74·3% of the estimate
from studies at high
risk, and 25·7% at
moderate risk
OR 0·22, 95%
CrI 0·08 to 0·87
Only one head-to-head study and
no heterogeneity· No
inconsistency between direct and
indirect estimate (Node-split p=
0·5172 and tau= 0·1284)·
The treatment effects were
not significantly
influenced by clinical
modifiers in the subgroup
analyses·
Undetectable by the routine
method· The comparison-adjusted
funnel plot for the network is not
suggestive of any dominant
publication bias·
Low (Downgrade by two
levels due to study
limitations (for two
levels))
Ranking of
treatment
31·6% from studies at
high risk, and 52·5% at
moderate risk
SUCRA plots
suggested the
imprecision in a
ranking of
treatments·
Mild heterogeneity for
discontinuation due to adverse
events in network meta-analyses
according to global I2 (0%)· No
significant inconsistency in test of
global inconsistency (P = 0·8432),
and few inconsistency in local
inconsistency·
The overall effects were
not significantly
influenced by clinical
modifiers in the subgroup
analyses·
The network funnel plot
suggested no dominant
publication bias·
Low (Downgrade by two
levels due to study
limitations and
imprecision)
* Salanti G, Del Giovane C, Chaimani A, Caldwell DM, Higgins JP· Evaluating the quality of evidence from a network meta-analysis· PLoS One· 2014 Jul 3;9(7):e99682·

87
Appendix 16
Subgroup network meta-analyses for primary outcomes

88
Subgroup network meta-analyses of each drug for mean improvement in symptom compared with placebo with standardized mean difference (95% CrI)*
Characteristics Fluoxetine Desipramine Duloxetine Venlafaxine Mirtazapine Sertraline Citalopram Escitalopram Paroxetine Nefazodone Imipramine Amitriptyline Clomipramine Nortriptyline
All trials -0·51
(-0·99 to -0·03)
-0·45
(-1·52 to 0·62)
-0·35
(-1·24 to 0·54)
-0·26
(-1·10 to 0·58)
-0·24
(-1·25 to 0·77)
-0·23
(-1·21 to 0·77)
-0·18
(-1·18 to 0·82)
-0·17
(-1·15 to 0·81)
-0·16
(-0·86 to 0·54)
-0·15
(-1·14 to 0·85)
-0·01
(-0·98 to 0·95)
0·08
(-1·45 to 1·61)
0·32
(-1·25 to 1·90)
1·14
(0·25 to 2·02)
Sex Ratioa
Male-to-
female ratio < 1
-0·03
(-0·26 to 0·19)
-0·43
(-0·89 to 0·01)
-0·12
(-0·34 to 0·11) ···
-0·23
(-0·54 to 0·07)
-0·23
(-0·48 to 0·03)
-0·35
(-0·71 to 0·01)
-0·17
(-0·40 to 0·05)
-0·18
(-0·40 to 0·04)
-0·28
(-0·63 to 0·08)
0·06
(-0·27 to 0·39) ···
0·31
(-0·16 to 0·77) ···
Male-to-
female ratio > 1
-0·37
(-0·71 to 0·06) ··· ···
-0·19
(-0·64 to 0·25) ··· ··· ··· ···
0·05
(-0·66 to 0·77) ···
-0·14
(-1·02 to 0·74)
0·09
(-0·83 to 1·02) ···
-0·13
(-0·76 to 0·48)
Mean Age
< 13 years -0·80
(-1·62 to 0·01) …
-0·56
(-2·06 to 0·94)
-0·14
(-1·33 to 1·05)
-0·23
(-1·43 to 0·96)
-0·21
(-1·89 to 1·47)
-0·35
(-2·03 to 1·33)
-0·12
(-1·80 to 1·55)
0·05
(-1·63 to 1·72) ···
-0·13
(-1·90 to 1·63) … ···
1·72
(0·42 to 3·01)
≥ 13 years -0·11
(-0·54 to 0·35)
-0·45
(-1·15 to 0·25)
-0·08
(-0·83 to 0·68)
-0·12
(-1·13 to 0·93) ···
-0·34
(-1·18 to 0·51)
-0·01
(-0·85 to 0·82)
-0·21
(-1·04 to 0·62)
-0·20
(-0·71 to 0·29) ···
0·05
(-0·73 to 0·81)
0·09
(-0·94 to 1·12)
0·28
(-0·72 to 1·27)
-0·39
(-1·40 to 0·63)
Treatment durations
< 8 weeks -0·21
(-1·20 to 0·77)
-0·44
(-1·39 to 0·49) ··· ··· ··· ··· ··· ··· ··· ···
-0·13
(-1·46 to 1·19) ··· ··· ···
≥8 weeks -0·58
(-1·14 to -0·01) ···
-0·38
(-1·34 to 0·57)
-0·28
(-1·18 to 0·61)
-0·24
(-1·31 to 0·84)
-0·23
(-1·29 to 0·83)
-0·18
(-1·24 to 0·88)
-0·17
(-1·22 to 0·89)
-0·15
(-0·90 to 0·60)
-0·15
(-1·20 to 0·90)
0·08
(-1·27 to 1·41)
0·08
(-1·54 to 1·69)
0·34
(-1·34 to 2·04)
1·11
(0·18 to 2·05)
Symptoms Severity
Mild to moderate … … … … … … … … -0·15
(-0·88 to 0·57) …
0·07
(-0·89 to 1·04)
0·08
(-1·09 to 1·24) … …
Moderate to
severe
-0·54
(-1·08 to 0·00)
-0·45
(-1·59 to 0·70)
-0·36
(-1·33 to 0·61)
-0·27
(-1·19 to 0·65)
-0·24
(-1·34 to 0·86)
-0·23
(-1·32 to 0·86)
-0·18
(-1·27 to 0·91)
-0·17
(-1·25 to 0·91)
-0·14
(-1·24 to 0·97)
-0·15
(-1·23 to 0·94) … …·
0·35
(-1·55 to 2·25)
1·13
(0·17 to 2·08)
Co-morbid
No co-morbidity -0·18
(-0·61 to 0·27)
0·05
(-0·65 to 0·75) ···
-0·15
(-0·46 to 0·16)
-0·23
(-0·60 to 0·13) ···
-0·17
(-0·51 to 0·16) ···
-0·35
(-0·97 to 0·29)
-0·14
(-0·47 to 0·18) ···
0·09
(-0·67 to 0·85)
0·14
(-0·66 to 0·96)
4·04
(3·22 to 4·86)
With co-morbidity -0·27 -0·96 -0·24 ··· ··· -0·23 ··· -0·17 -0·10 ··· 0·04 ··· ··· -0·13

89
(-0·49 to -0·05) (-1·72 to -0·21) (-0·55 to 0·08) (-0·59 to 0·13) (-0·51 to 0·17) (-0·39 to 0·18) (-0·36 to 0·42) (-0·64 to 0·39)
Risk bias
Low and unclear
risk bias
-0·53
(-1·16 to 0·08)
-0·45
(-1·68 to 0·78)
-0·36
(-1·42 to 0·70)
-0·54
(-2·36 to 1·27)
-0·38
(-2·04 to 1·29) … …
-0·17
(-1·34 to 1·00)
-0·11
(-1·08 to 0·85)
-0·15
(-1·32 to 1·02)
-0·14
(-1·88 to 1·60)
0·09
(-1·68 to 1·87)
0·37
(-1·55 to 2·30)
1·13
(0·10 to 2·16)
High risk bias -0·57
(-1·15 to 0·01) … …
-0·14
(-0·55 to 0·28)
-0·09
(-0·71 to 0·52)
-0·23
(-0·64 to 0·18)
-0·18
(-0·59 to 0·24) …
-0·24
(-0·83 to 0·34) …
0·03
(-0·56 to 0·62) … … …
Sample Size
≥ 100 -0·26
(-0·47 to -0·05) ···
-0·23
(-0·50 to 0·04)
-0·14
(-0·46 to 0·18)
-0·24
(-0·59 to 0·11)
-0·23
(-0·54 to 0·08)
-0·18
(-0·49 to 0·13)
-0·17
(-0·46 to 0·12)
-0·09
(-0·33 to 0·16)
-0·14
(-0·44 to 0·15)
0·10
(-0·30 to 0·50) ···
0·40
(-0·15 to 0·94) ···
< 100 -0·80
(-1·68 to 0·07)
-0·46
(-1·78 to 0·87) ···
-0·81
(-2·84 to 1·23) ··· ··· ··· ···
-0·34
(-2·18 to 1·50) ···
-0·14
(-2·01 to 1·73)
0·08
(-1·81 to 1·97) ···
1·03
(-0·08 to 2·15)
Sponsors
Without industry
sponsors
-1·17
(-2·13 to -0·21)
-0·45
(-1·76 to 0·86) …
-1·17
(-3·23 to 0·88) … … … … … …
-0·14
(-1·99 to 1·72)
0·09
(-1·78 to 1·96) …
0·91
(-0·20 to 2·02)
With industry
sponsors
-0·15
(-0·36 to 0·06) …
-0·18
(-0·43 to 0·09)
-0·14
(-0·44 to 0·16)
-0·23
(-0·57 to 0·10)
-0·23
(-0·53 to 0·07)
-0·17
(-0·47 to 0·12)
-0·17
(-0·44 to 0·10)
-0·12
(-0·34 to 0·10)
-0·14
(-0·42 to 0·14)
0·09
(-0·29 to 0·47) …
0·37
(-0·15 to 0·88) …
*Negative effect sizes indicate superiority of the specific intervention against placebo control·
a We excluded the trials with male-to-female ratio= 1
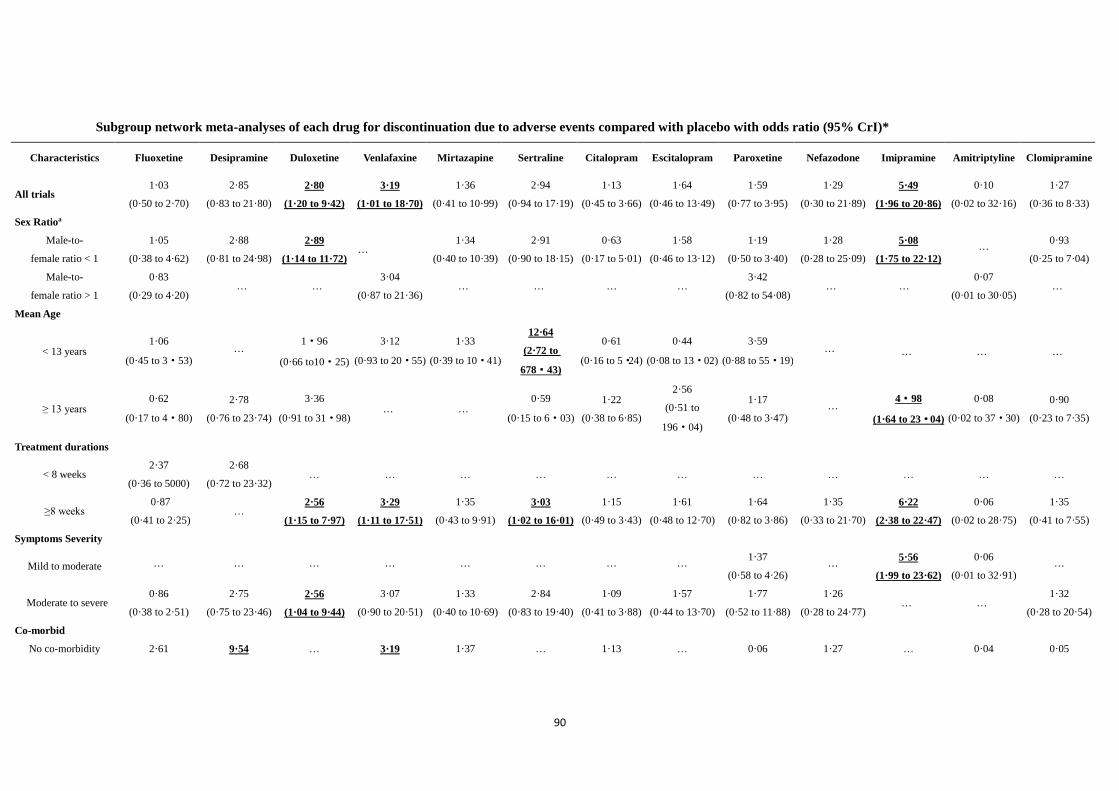
90
Subgroup network meta-analyses of each drug for discontinuation due to adverse events compared with placebo with odds ratio (95% CrI)*
Characteristics Fluoxetine Desipramine Duloxetine Venlafaxine Mirtazapine Sertraline Citalopram Escitalopram Paroxetine Nefazodone Imipramine Amitriptyline Clomipramine
All trials 1·03
(0·50 to 2·70)
2·85
(0·83 to 21·80)
2·80
(1·20 to 9·42)
3·19
(1·01 to 18·70)
1·36
(0·41 to 10·99)
2·94
(0·94 to 17·19)
1·13
(0·45 to 3·66)
1·64
(0·46 to 13·49)
1·59
(0·77 to 3·95)
1·29
(0·30 to 21·89)
5·49
(1·96 to 20·86)
0·10
(0·02 to 32·16)
1·27
(0·36 to 8·33)
Sex Ratioa
Male-to-
female ratio < 1
1·05
(0·38 to 4·62)
2·88
(0·81 to 24·98)
2·89
(1·14 to 11·72) ···
1·34
(0·40 to 10·39)
2·91
(0·90 to 18·15)
0·63
(0·17 to 5·01)
1·58
(0·46 to 13·12)
1·19
(0·50 to 3·40)
1·28
(0·28 to 25·09)
5·08
(1·75 to 22·12) ···
0·93
(0·25 to 7·04)
Male-to-
female ratio > 1
0·83
(0·29 to 4·20) ··· ···
3·04
(0·87 to 21·36) ··· ··· ··· ···
3·42
(0·82 to 54·08) ··· ···
0·07
(0·01 to 30·05) ···
Mean Age
< 13 years 1·06
(0·45 to 3·53) ···
1·96
(0·66 to10·25)
3·12
(0·93 to 20·55)
1·33
(0·39 to 10·41)
12·64
(2·72 to
678·43)
0·61
(0·16 to 5·24)
0·44
(0·08 to 13·02)
3·59
(0·88 to 55·19) ··· ··· ··· ···
≥ 13 years 0·62
(0·17 to 4·80)
2·78
(0·76 to 23·74)
3·36
(0·91 to 31·98) ··· ···
0·59
(0·15 to 6·03)
1·22
(0·38 to 6·85)
2·56
(0·51 to
196·04)
1·17
(0·48 to 3·47) ···
4·98
(1·64 to 23·04)
0·08
(0·02 to 37·30)
0·90
(0·23 to 7·35)
Treatment durations
< 8 weeks 2·37
(0·36 to 5000)
2·68
(0·72 to 23·32) … … … … … … … … … … …
≥8 weeks 0·87
(0·41 to 2·25) …
2·56
(1·15 to 7·97)
3·29
(1·11 to 17·51)
1·35
(0·43 to 9·91)
3·03
(1·02 to 16·01)
1·15
(0·49 to 3·43)
1·61
(0·48 to 12·70)
1·64
(0·82 to 3·86)
1·35
(0·33 to 21·70)
6·22
(2·38 to 22·47)
0·06
(0·02 to 28·75)
1·35
(0·41 to 7·55)
Symptoms Severity
Mild to moderate ··· ··· ··· ··· ··· ··· ··· ··· 1·37
(0·58 to 4·26) ···
5·56
(1·99 to 23·62)
0·06
(0·01 to 32·91) ···
Moderate to severe 0·86
(0·38 to 2·51)
2·75
(0·75 to 23·46)
2·56
(1·04 to 9·44)
3·07
(0·90 to 20·51)
1·33
(0·40 to 10·69)
2·84
(0·83 to 19·40)
1·09
(0·41 to 3·88)
1·57
(0·44 to 13·70)
1·77
(0·52 to 11·88)
1·26
(0·28 to 24·77) ··· ···
1·32
(0·28 to 20·54)
Co-morbid
No co-morbidity 2·61 9·54 … 3·19 1·37 … 1·13 … 0·06 1·27 … 0·04 0·05

91
(0·41 to 5977) (2·03 to 585) (1·01 to 18·29) (0·42 to 10·00) (0·45 to 3·62) (0·01 to 6·33) (0·29 to 21·20) (0·01 to 35·77) (0·01 to 8·37)
With co-morbidity 0·87
(0·40 to 2·37)
0·04
(0·01 to 5·97)
2·55
(1·10 to 8·57) … …
3·01
(0·96 to 17·77) …
1·61
(0·46 to 12·74)
1·88
(0·90 to 5·06) …
6·63
(2·41 to 27·25) … …
Risk bias
Low and unclear
risk bias
1·39
(0·56 to 4·81)
2·76
(0·75 to 23·48)
3·32
(1·28 to 13·06) …
0·64
(0·14 to 12·21) … …
1·55
(0·44 to 13·95)
1·67
(0·67 to 5·51)
1·25
(0·27 to 24·57) …
0·06
(0·02 to 40·98)
1·26
(0·31 to 11·65)
High risk bias 0·38
(0·11 to 2·39) … …
3·17
(0·99 to 18·96)
1·92
(0·39 to 138·93)
2·96
(0·92 to 17·74)
1·12
(0·45 to 3·58) …
1·11
(0·33 to 6·95) …
5·18
(1·68 to 28·29) … …
Sample Size
≥ 100 0·65
(0·28 to 1·82) …
2·24
(0·99 to 6·80)
3·32
(1·13 to 17·10)
1·33
(0·42 to 9·77)
3·09
(1·06 to 15·80)
1·16
(0·50 to 3·38)
1·62
(0·48 to 12·72)
1·88
(0·94 to 4·70)
1·32
(0·31 to 20·36)
6·75
(2·66 to 25·00) …
1·56
(0·48 to 8·96)
< 100 2·84
(0·74 to 35·75)
2·71
(0·73 to 24·41) … … … … … …
0·03
(0·01 to 6·60) … …
0·05
(0·01 to 34·08) …
Sponsors
Without industry
sponsors
2·65
(0·49 to 257)
2·65
(0·71 to 23·33) … … … … ··· … … … …
0·03
(0·02 to 31·54) …
With industry
sponsors
0·81
(0·37 to 2·24) …
2·47
(1·11 to 7·60)
3·33
(1·15 to 16·75)
1·36
(0·42 to 9·30)
3·05
(1·05 to 15·81)
1·16
(0·50 to 3·38)
1·61
(0·47 to 12·91)
1·65
(0·83 to 3·82)
1·35
(0·33 to 19·81)
6·23
(2·44 to 21·99) …
1·36
(0·43 to 7·50)
*OR<1 indicate superiority of the specific intervention against placebo control·
a We excluded the trials with male-to-female ratio= 1

92
Appendix 17
Sensitivity network meta-analyses

93
Sensitivity network meta-analysis for response rate outcome by omitting the trials where only data on ‘remission’, but not on ‘response’ was reported
Treatment Response rate (OR with 95% Crl)
Drugs are reported in order of ranking of response rate· Comparisons should be read from left to right· The estimate is located at the intersection of the column-defining
treatment and the row-defining treatment· An OR value higher than 1 favors the column-defining treatment· To obtain ORs for comparisons in the opposing direction,
reciprocals should be taken· Significant results are bolded and underscored· AMI=amitriptyline, CIT=citalopram, CLO=clomipramine, CrI=credibility interval,
DES=desipramine, DUL=duloxetine, ESC=escitalopram, FLU=fluoxetine, IMP=imipramine, NEF=nefazodone, OR=odds ratio, PAR=paroxetine, PBO=placebo,
SER=sertraline, VEN=venlafaxine
NEF
1·19
(0·55 to 3·09) DUL
1·02
(0·36 to 4·11)
0·81
(0·33 to 2·79) DES
1·28
(0·62 to 3·09)
1·09
(0·68 to 1·65)
1·28
(0·41 to 3·10) FLU
1·31
(0·60 to 3·42)
1·16
(0·58 to 2·10)
1·36
(0·40 to 3·41)
1·00
(0·59 to 1·82) ESC
1·68
(0·57 to 3·89)
1·23
(0·53 to 2·45)
1·43
(0·38 to 3·84)
1·14
(0·53 to 2·16)
1·12
(0·47 to 2·26) SER
1·86
(0·74 to 3·88)
1·37
(0·72 to 2·35)
1·59
(0·48 to 3·90)
1·27
(0·74 to 2·02)
1·24
(0·65 to 2·18)
1·07
(0·55 to 2·40) PAR
2·11
(0·78 to 4·64)
1·54
(0·75 to 2·80)
1·80
(0·51 to 4·58)
1·43
(0·78 to 2·39)
1·40
(0·66 to 2·62)
1·39
(0·57 to 2·84)
1·18
(0·59 to 2·10) VEN
1·93
(0·88 to 5·31)
1·55
(0·83 to 3·25)
1·47
(0·57 to 5·22)
1·47
(0·84 to 2·86)
1·40
(0·74 to 3·01)
1·32
(0·64 to 3·27)
1·19
(0·66 to 2·44)
1·05
(0·55 to 2·32) CIT
2·12
(1·09 to 4·74)
1·70
(1·11 to 2·71) 1·62
(0·69 to 4·85) 1·62
(1·20 to 2·24)
1·53 (0·99 to 2·53)
1·45
(0·81 to 2·86)
1·31 (0·90 to 1·97)
1·16 (0·73 to 1·97)
1·02 (0·63 to 1·77)
PBO
2·33
(1·04 to 6·64)
2·13 (0·97 to 4·09)
2·49 (0·67 to 6·52)
1·98 (0·97 to 3·59)
1·94 (0·87 to 3·79)
1·60 (0·75 to 4·09)
1·46 (0·84 to 2·79)
1·27 (0·65 to 2·95)
1·31 (0·57 to 2·61)
1·20 (0·65 to 2·02)
IMP
2·85
(1·04 to 11·27)
2·28 (0·93 to 7·39)
2·18 (0·71 to 10·74)
2·18 (0·92 to 6·66)
2·06 (0·83 to 6·82)
1·95 (0·74 to 7·19)
1·83 (0·85 to 4·79)
1·56 (0·62 to 5·27)
1·86 (0·54 to 4·70)
1·70 (0·59 to 3·88)
1·14 (0·46 to 3·75)
CLO
3·25 (0·72 to 56·37)
2·62 (0·62 to 38·70)
2·52 (0·56 to 46·77)
2·50 (0·60 to 36·82)
2·37 (0·54 to 36·01)
2·24 (0·52 to 36·58)
2·01 (0·48 to 30·11)
1·78 (0·41 to 27·41)
1·57 (0·36 to 24·91)
4·75 (0·37 to 21·72)
1·29 (0·29 to 20·47)
0·91 (0·20 to 17·17)
AMI
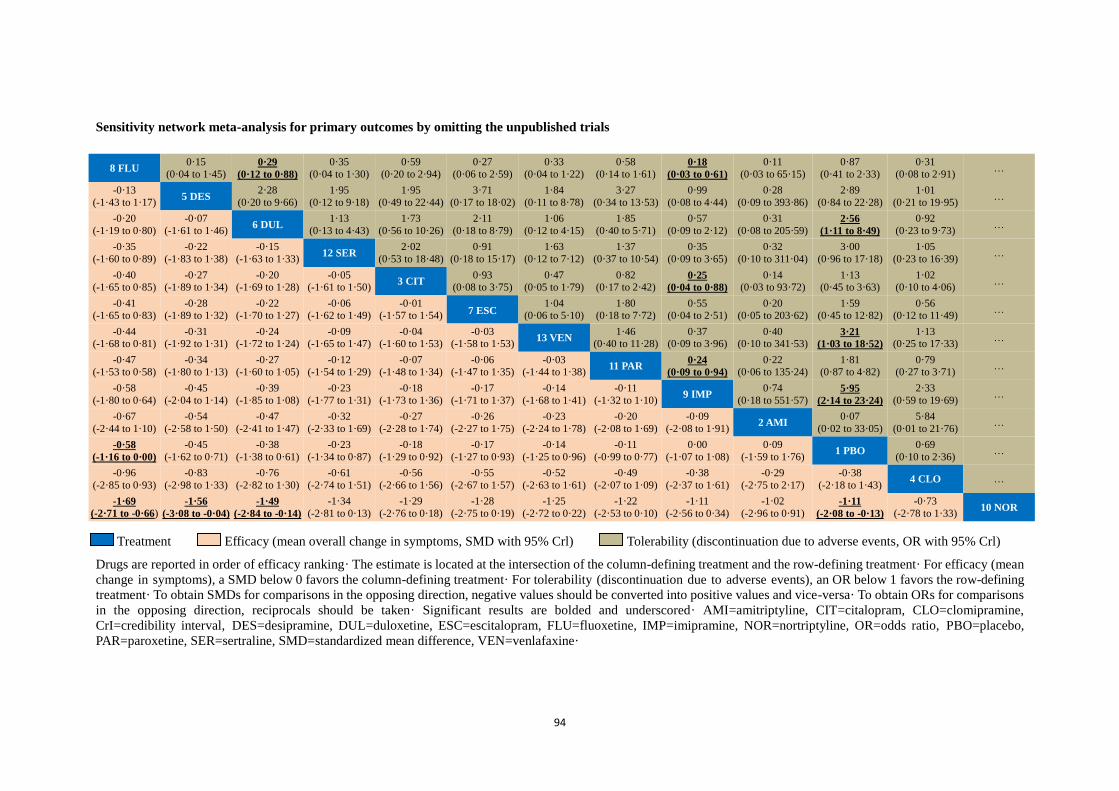
94
Sensitivity network meta-analysis for primary outcomes by omitting the unpublished trials
Treatment Efficacy (mean overall change in symptoms, SMD with 95% Crl) Tolerability (discontinuation due to adverse events, OR with 95% Crl)
Drugs are reported in order of efficacy ranking· The estimate is located at the intersection of the column-defining treatment and the row-defining treatment· For efficacy (mean
change in symptoms), a SMD below 0 favors the column-defining treatment· For tolerability (discontinuation due to adverse events), an OR below 1 favors the row-defining
treatment· To obtain SMDs for comparisons in the opposing direction, negative values should be converted into positive values and vice-versa· To obtain ORs for comparisons
in the opposing direction, reciprocals should be taken· Significant results are bolded and underscored· AMI=amitriptyline, CIT=citalopram, CLO=clomipramine,
CrI=credibility interval, DES=desipramine, DUL=duloxetine, ESC=escitalopram, FLU=fluoxetine, IMP=imipramine, NOR=nortriptyline, OR=odds ratio, PBO=placebo,
PAR=paroxetine, SER=sertraline, SMD=standardized mean difference, VEN=venlafaxine·
8 FLU 0·15
(0·04 to 1·45) 0·29
(0·12 to 0·88)
0·35
(0·04 to 1·30)
0·59
(0·20 to 2·94)
0·27
(0·06 to 2·59)
0·33
(0·04 to 1·22)
0·58
(0·14 to 1·61) 0·18
(0·03 to 0·61)
0·11
(0·03 to 65·15)
0·87
(0·41 to 2·33)
0·31
(0·08 to 2·91) …
-0·13
(-1·43 to 1·17) 5 DES
2·28
(0·20 to 9·66)
1·95
(0·12 to 9·18)
1·95
(0·49 to 22·44)
3·71
(0·17 to 18·02)
1·84
(0·11 to 8·78)
3·27
(0·34 to 13·53)
0·99
(0·08 to 4·44)
0·28
(0·09 to 393·86)
2·89
(0·84 to 22·28)
1·01
(0·21 to 19·95) …
-0·20
(-1·19 to 0·80)
-0·07
(-1·61 to 1·46) 6 DUL
1·13
(0·13 to 4·43)
1·73
(0·56 to 10·26)
2·11
(0·18 to 8·79)
1·06
(0·12 to 4·15)
1·85
(0·40 to 5·71)
0·57
(0·09 to 2·12)
0·31
(0·08 to 205·59) 2·56
(1·11 to 8·49)
0·92
(0·23 to 9·73) …
-0·35
(-1·60 to 0·89)
-0·22
(-1·83 to 1·38)
-0·15
(-1·63 to 1·33) 12 SER
2·02
(0·53 to 18·48)
0·91
(0·18 to 15·17)
1·63
(0·12 to 7·12)
1·37
(0·37 to 10·54)
0·35
(0·09 to 3·65)
0·32
(0·10 to 311·04)
3·00
(0·96 to 17·18)
1·05
(0·23 to 16·39) …
-0·40 (-1·65 to 0·85)
-0·27 (-1·89 to 1·34)
-0·20 (-1·69 to 1·28)
-0·05 (-1·61 to 1·50)
3 CIT 0·93
(0·08 to 3·75) 0·47
(0·05 to 1·79) 0·82
(0·17 to 2·42) 0·25
(0·04 to 0·88)
0·14 (0·03 to 93·72)
1·13 (0·45 to 3·63)
1·02 (0·10 to 4·06)
…
-0·41 (-1·65 to 0·83)
-0·28 (-1·89 to 1·32)
-0·22 (-1·70 to 1·27)
-0·06 (-1·62 to 1·49)
-0·01 (-1·57 to 1·54) 7 ESC
1·04 (0·06 to 5·10)
1·80 (0·18 to 7·72)
0·55 (0·04 to 2·51)
0·20 (0·05 to 203·62)
1·59 (0·45 to 12·82)
0·56 (0·12 to 11·49)
…
-0·44 (-1·68 to 0·81)
-0·31 (-1·92 to 1·31)
-0·24 (-1·72 to 1·24)
-0·09 (-1·65 to 1·47)
-0·04 (-1·60 to 1·53)
-0·03 (-1·58 to 1·53)
13 VEN 1·46
(0·40 to 11·28) 0·37
(0·09 to 3·96) 0·40
(0·10 to 341·53) 3·21
(1·03 to 18·52)
1·13 (0·25 to 17·33)
…
-0·47 (-1·53 to 0·58)
-0·34 (-1·80 to 1·13)
-0·27 (-1·60 to 1·05)
-0·12 (-1·54 to 1·29)
-0·07 (-1·48 to 1·34)
-0·06 (-1·47 to 1·35)
-0·03 (-1·44 to 1·38)
11 PAR 0·24
(0·09 to 0·94)
0·22 (0·06 to 135·24)
1·81 (0·87 to 4·82)
0·79 (0·27 to 3·71)
…
-0·58
(-1·80 to 0·64)
-0·45
(-2·04 to 1·14)
-0·39
(-1·85 to 1·08)
-0·23
(-1·77 to 1·31)
-0·18
(-1·73 to 1·36)
-0·17
(-1·71 to 1·37)
-0·14
(-1·68 to 1·41)
-0·11
(-1·32 to 1·10) 9 IMP
0·74
(0·18 to 551·57) 5·95
(2·14 to 23·24)
2·33
(0·59 to 19·69) …
-0·67
(-2·44 to 1·10)
-0·54
(-2·58 to 1·50)
-0·47
(-2·41 to 1·47)
-0·32
(-2·33 to 1·69)
-0·27
(-2·28 to 1·74)
-0·26
(-2·27 to 1·75)
-0·23
(-2·24 to 1·78)
-0·20
(-2·08 to 1·69)
-0·09
(-2·08 to 1·91) 2 AMI
0·07
(0·02 to 33·05)
5·84
(0·01 to 21·76) …
-0·58
(-1·16 to 0·00)
-0·45
(-1·62 to 0·71)
-0·38
(-1·38 to 0·61)
-0·23
(-1·34 to 0·87)
-0·18
(-1·29 to 0·92)
-0·17
(-1·27 to 0·93)
-0·14
(-1·25 to 0·96)
-0·11
(-0·99 to 0·77)
0·00
(-1·07 to 1·08)
0·09
(-1·59 to 1·76) 1 PBO
0·69
(0·10 to 2·36) …
-0·96
(-2·85 to 0·93)
-0·83
(-2·98 to 1·33)
-0·76
(-2·82 to 1·30)
-0·61
(-2·74 to 1·51)
-0·56
(-2·66 to 1·56)
-0·55
(-2·67 to 1·57)
-0·52
(-2·63 to 1·61)
-0·49
(-2·07 to 1·09)
-0·38
(-2·37 to 1·61)
-0·29
(-2·75 to 2·17)
-0·38
(-2·18 to 1·43) 4 CLO …
-1·69
(-2·71 to -0·66) -1·56
(-3·08 to -0·04)
-1·49
(-2·84 to -0·14)
-1·34
(-2·81 to 0·13)
-1·29
(-2·76 to 0·18)
-1·28
(-2·75 to 0·19)
-1·25
(-2·72 to 0·22)
-1·22
(-2·53 to 0·10)
-1·11
(-2·56 to 0·34)
-1·02
(-2·96 to 0·91) -1·11
(-2·08 to -0·13)
-0·73
(-2·78 to 1·33) 10 NOR


![Supplementary appendix - thelancet.com et al., Lancet Neurology 2018, Appendix Page . 2. of . 27. 30) NCL [Neurological Centre of Latium (Gruppo NEUROMED)] Centro Studi Clinici Malattia](https://img.dokumen.tips/doc/110x75/5b1ee74d7f8b9a36678c20d2/supplementary-appendix-et-al-lancet-neurology-2018-appendix-page-2-of-.jpg)