Embed Size (px)
Citation preview

ATTACHMENT C
Supplemental Soil and Groundwater Investigations

Pontoon Construction Project
Supplemental Soil and Groundwater Investigation
Report Anderson & Middleton Property
Aberdeen Log Yard Property
Prepared for
Washington State Department of Transportation Federal Highway Administration
Prepared by
CH2M HILL
April 2010

Contents
Abbreviations and Acronyms...........................................................................................v 1. Introduction ........................................................................................................1-1 2. Field Investigation ..............................................................................................2-1
2.1 Groundwater Sampling .............................................................................2-22.2 Soil Sampling ...........................................................................................2-42.3 Analytical Methods ..................................................................................2-6
3. Investigation Results ..........................................................................................3-1 3.1 Quality Assurance/Quality Control Review .............................................3-13.2 Evaluation Criteria .................................................................................... 3-23.3 Anderson & Middleton.............................................................................3-23.4 Aberdeen Log Yard ..................................................................................3-23.5 Pumping Well Data from Aberdeen Log Yard .........................................3-3
4. Conclusions .........................................................................................................4-1 4.1 Anderson & Middleton Property ..............................................................4-14.2 Aberdeen Log Yard Property ...................................................................4-2
5. References ...........................................................................................................5-1
Appendix A Quality Assurance/Quality Control Review of Laboratory Data
Note that figures and tables are provided in separate sections at the end of the text.
Figures 1-1 Locations and Conceptual Layouts for Project Alternative Sites
2-1 Anderson & Middleton Supplemental Groundwater Investigation, September 2009
2-2 Aberdeen Log Yard Supplemental Soil and Groundwater Investigation, September 2009
Tables 2-1 September 2009 Samples Used for Evaluation at the Anderson &
Middleton Property
2-2 September 2009 Samples Used for Evaluation at the Aberdeen Log Yard Property
iii

3-1 Groundwater Results at Anderson & Middleton Property
3-2 Soil TPH results at Aberdeen Log Yard Property
3-3 Additional Soil Results at Aberdeen Log Yard Property
3-4 Groundwater Results at Aberdeen Log Yard Property
3-5 July and August 2009 Pumping Well Groundwater Results at Aberdeen Log Yard Property
iv
Abbreviations and Acronyms
A&M Anderson & Middleton
ALY Aberdeen Log Yard
ASTM American Society for Testing and Materials
bgs below ground surface
CUL cleanup level
Ecology Washington State Department of Ecology
ESA Environmental Site Assessment
µg/L microgram per liter
mg/kg milligram per kilogram
mg/L milligrams per liter
MTCA Model Toxics Control Act
NWTPH-Dx Northwest total petroleum hydrocarbon – diesel extended range
PAH polyaromatic hydrocarbons
QA/QC quality assurance/quality control
SAP Sampling and Analysis Plan
SVOC semivolatile organic compound
SWQC surface water quality criteria
TDS total dissolved solids
TPH total petroleum hydrocarbon
TPH-Dx total petroleum hydrocarbon-diesel range
TSS total suspended solids
USCS Unified Soil Classification System
VOC volatile organic compound
WAC Washington Administrative Code
WSDOT Washington Department of Transportation
v


1. Introduction
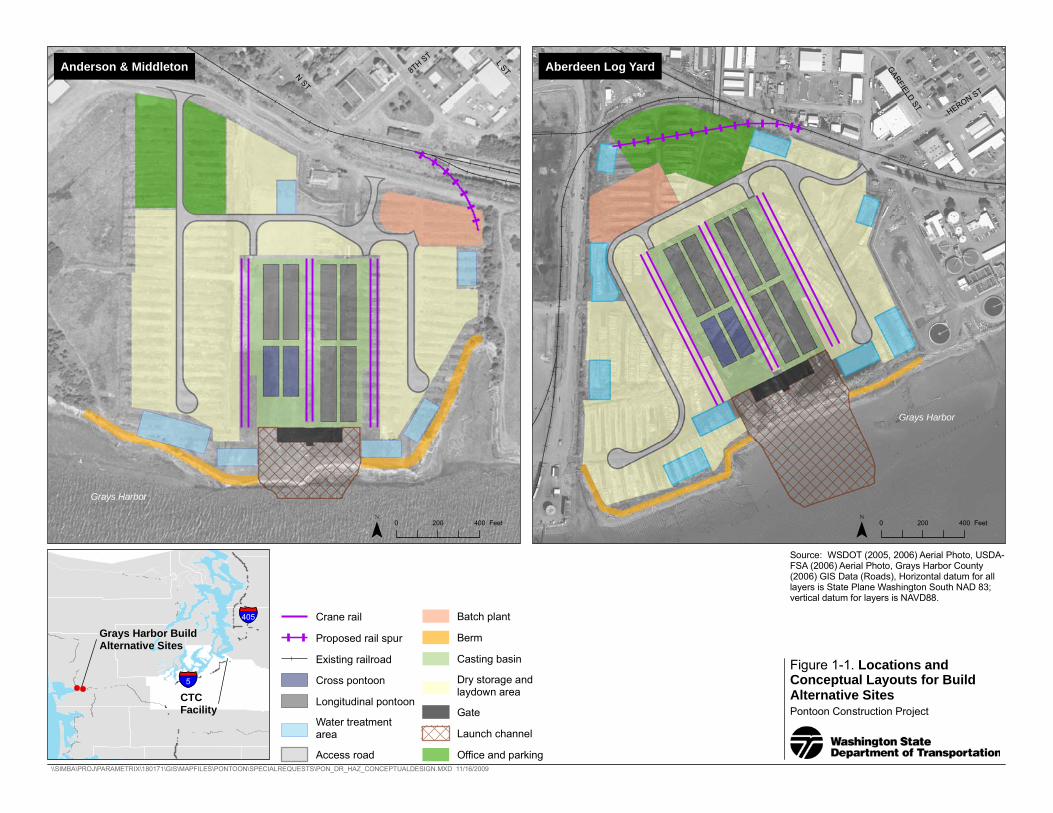
On behalf of Washington State Department of Transportation (WSDOT), CH2M HILL has prepared this Supplemental Soil and Groundwater Investigation Report (Supplemental Investigation Report) for the Anderson & Middleton (A&M) Property located at 815 8th Street in Hoquiam, Washington, and the Aberdeen Log Yard (ALY) Property located at 400 East Terminal Way in Aberdeen, Washington (Figure 1-1). The objectives of the Supplemental Investigation Report are to provide additional information about groundwater conditions and to evaluate the nature and extent of contamination in subsurface soil in select areas of the Aberdeen Log Yard from historical activities at the sites.
This supplemental soil and groundwater investigation is a follow up to the Phase II Environmental Site Assessment conducted in December 2008 and January 2009 (CH2M HILL, 2009) at both A&M and ALY. For a more detailed site description, project background, and previous findings refer to the Phase II Environmental Site Assessment (CH2M HILL 2009).
Additional samples were collected from ALY to investigate contamination observed during other evaluations. This supplemental investigation investigated potential contamination observed during the geotechnical baseline study conducted in July 2009 and the cultural resources investigation conducted in September 2009 at ALY.
In addition to the soil and groundwater sampling results from the September 2009 investigation, this report also presents the results of the groundwater samples collected on July 16, 17, and August 6, 2009 during pumping tests conducted at ALY.
Results of the above investigations conducted are reported in the following sections.
1-1


2. Field Investigation
This section describes the Supplemental Soil and Groundwater Investigation (Supplemental Investigation) field activities that were conducted at the A&M and ALY properties. The activities and analyses were conducted according to the procedures outlined in the Supplemental Soil and Groundwater Investigation Sampling and Analysis Plan (SAP) (CH2M HILL 2009) except as noted.
During the geotechnical baseline study at the ALY Property, an apparent petroleum-like odor was observed in two areas of the site: 1) near H-20P-09 and PW-2-09, and 2) near H-30P-09 and H-30PA-09. Near H-20P-09 and PW-2, located in the northern portion of the site, the petroleum-like odor appeared to be from wood encountered during the drilling. Near H-30P-09 and H-30PA-09, located in the southern portion of the site, a sheen layer floating on the groundwater surface was observed (Landau 2009).
During the cultural resources investigation a creosote odor, soil staining, and groundwater sheen were observed in a test trench at one location (ALY-TP14) and an odor was noticed an unidentifiable white viscous liquid approximately 8 feet below ground surface (bgs) at a second location (ALY-SB17) (Personal Communication 2009). In response to these observations, this investigation collected soil and groundwater samples in the areas with reported contamination.
Figures 2-1 and 2-2 show the sampling locations at A&M and ALY Properties respectively. Sample numbers, sample media, sample depths, and parameters analyzed from this sampling event are presented in Tables 2-1 and 2-2.
Washington State One-Call representatives previously marked all public utilities in areas of proposed boring locations prior to conducting intrusive subsurface sampling. A private utility locator was not requested by this investigation to locate existing private utilities because test pits for geotechnical and archeological studies were currently being excavated at the sites.
The following subsections describe groundwater sampling at the A&M and ALY Properties and soil sampling at the ALY Property.
2-1
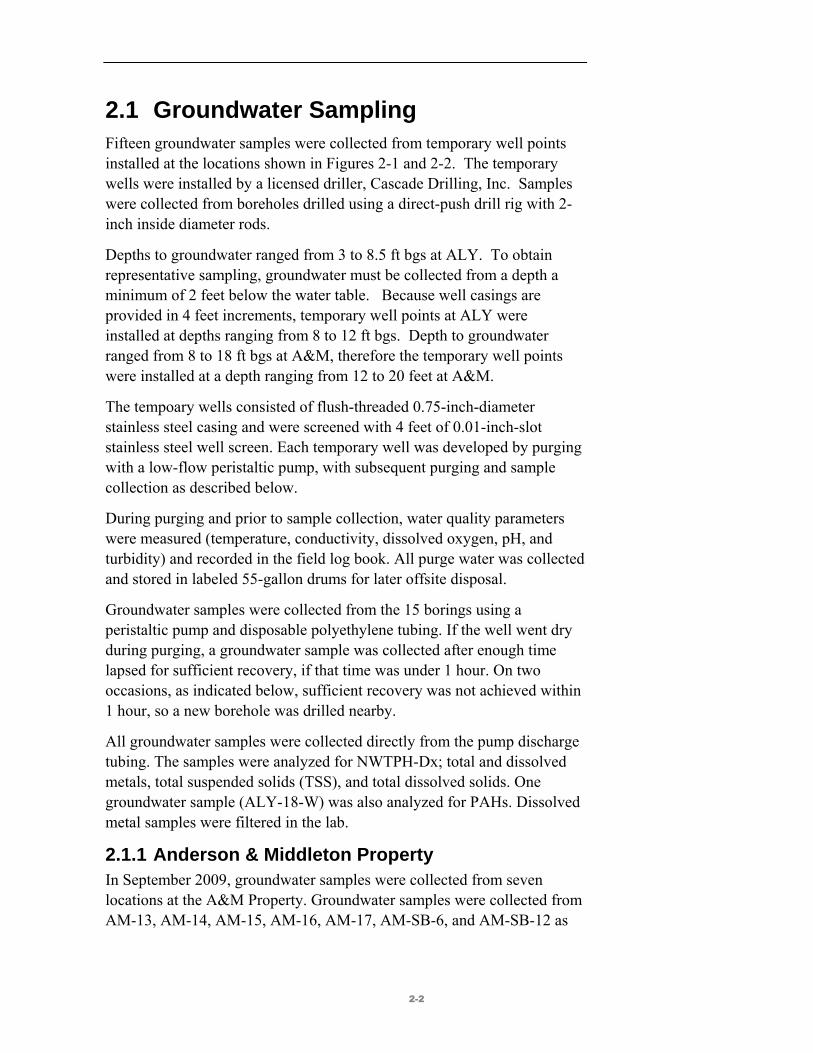
2.1 Groundwater Sampling Fifteen groundwater samples were collected from temporary well points installed at the locations shown in Figures 2-1 and 2-2. The temporary wells were installed by a licensed driller, Cascade Drilling, Inc. Samples were collected from boreholes drilled using a direct-push drill rig with 2-inch inside diameter rods.
Depths to groundwater ranged from 3 to 8.5 ft bgs at ALY. To obtain representative sampling, groundwater must be collected from a depth a minimum of 2 feet below the water table. Because well casings are provided in 4 feet increments, temporary well points at ALY were installed at depths ranging from 8 to 12 ft bgs. Depth to groundwater ranged from 8 to 18 ft bgs at A&M, therefore the temporary well points were installed at a depth ranging from 12 to 20 feet at A&M.
The tempoary wells consisted of flush-threaded 0.75-inch-diameter stainless steel casing and were screened with 4 feet of 0.01-inch-slot stainless steel well screen. Each temporary well was developed by purging with a low-flow peristaltic pump, with subsequent purging and sample collection as described below.
During purging and prior to sample collection, water quality parameters were measured (temperature, conductivity, dissolved oxygen, pH, and turbidity) and recorded in the field log book. All purge water was collected and stored in labeled 55-gallon drums for later offsite disposal.
Groundwater samples were collected from the 15 borings using a peristaltic pump and disposable polyethylene tubing. If the well went dry during purging, a groundwater sample was collected after enough time lapsed for sufficient recovery, if that time was under 1 hour. On two occasions, as indicated below, sufficient recovery was not achieved within 1 hour, so a new borehole was drilled nearby.
All groundwater samples were collected directly from the pump discharge tubing. The samples were analyzed for NWTPH-Dx; total and dissolved metals, total suspended solids (TSS), and total dissolved solids. One groundwater sample (ALY-18-W) was also analyzed for PAHs. Dissolved metal samples were filtered in the lab.
2.1.1 Anderson & Middleton Property In September 2009, groundwater samples were collected from seven locations at the A&M Property. Groundwater samples were collected from AM-13, AM-14, AM-15, AM-16, AM-17, AM-SB-6, and AM-SB-12 as
2-2

shown in Figure 2-1. The groundwater sample ID, location, and analyses are summarized in Table 2-2.
Deviations from the SAP include the following:
• Seven groundwater samples were collected instead of 8. AM-15 went dry during initial sampling. The well was allowed to recover. A sample was eventually obtained but only for total and dissolved metals (not including mercury).
• A strong odor and groundwater sheen was observed at temporary well AM-SB11 while purging. The temporary well went dry and did not recover sufficiently within 30 minutes, so a groundwater sample could not be collected. A second temporary well AM-SB11B was attempted at a location approximately 40 feet down-gradient from AM-SB11. This temporary well also went dry and did not recover. Therefore no groundwater sample was collected at this location. These borings were located in the southern portion of the property near the shore.
2.1.2 Aberdeen Log Yard Property In September 2009, eight groundwater samples were collected from geoprobe borings at the ALY Property. Groundwater samples were collected from ALY-SB3, ALY-SB12, ALY-13, ALY-14, ALY-15, ALY-16, ALY-18, and ALY-19 as shown in Figure 2-2. The groundwater sample ID, location, and analyses are summarized in Table 2-3. A field duplicate sample was also collected from boring location ALY-SB12.
Deviations from the SAP include the following:
• A groundwater sample was not obtained from location ALY-17. The well at this location went dry during initial purging. Two additional boreholes were drilled nearby. Both additional wells went dry and did not recover sufficiently enough to collect a sample. A new groundwater sample location was established downgradient (ALY-19) to better characterize the potential groundwater contamination identified in test trenches by the concurrent archeological study.
• The original groundwater sample location ALY-SB7 was not attempted. It was moved to a new location due to the contamination observed by the archeological test trench investigation. A new location was established nearby (ALY-18) to better characterize the potential downgradient groundwater contamination identified by the archeological study.
2-3

2.2 Soil Sampling Soil samples were obtained from cores collected from the southwest and northeast portions of the ALY Property where previous contamination was encountered. Soil borings were drilled to depths ranged from 8 to 24 ft bgs. The samples were collected at 4-foot intervals in an acetate liner using direct-push sampling methods and direct-push drilling provided by Cascade Drilling, Inc. of Woodinville, Washington.
Soils were visually inspected for signs of contamination as well as field-screened for volatile organic compounds (VOCs) and total petroleum hydrocarbons (TPH) using a photoionization detector. Soil samples were collected using a stainless steel spoon and analyzed for diesel range-TPH (TPH-Dx), PAHs, VOCs, and/ or SVOCs. For VOCs the soil samples were collected directly from the acetate liner using a plunger to minimize volatilization. Where multiple sample containers had to be filled, sample containers for volatile analysis were filled first. The remaining soil was then homogenized by mixing gently in a stainless steel bowl prior to filling the other sample containers. Samples from four boring locations were collected from both the near surface (0 to 4 feet bgs) and just above the groundwater table (4 to 8 feet bgs); from 4 to 8 ft bgs only at location ALY-14TP; and from 18 to 22 ft bgs only at ALY-SB17.
After the soil sample collection was complete, the boreholes were abandoned by backfilling with bentonite chips in accordance with State requirements (Washington Administrative Code [WAC] 173-160). The surface was repaired with soil or a fresh asphalt patch to match the surrounding surface.
2.2.1 Anderson & Middleton Property No soil samples were analyzed at the A&M Property. While evidence of groundwater contamination (oily sheen on purge water) was observed at AM-SB11 during groundwater sample collection, no soil was generated for examination or sampling because AM-SB11 was a temporary well point installation. A boring was drilled at AM-SB11B approximately 40 feet downgradient from AM-SB11 in an attempt to collect soil and groundwater samples. No evidence of soil contamination was observed at this location, therefore no soil samples were analyzed.
2.2.2 Aberdeen Log Yard Property Soil encountered during drilling was classified according to the Unified Soil Classification System (USCS; American Society for Testing and Materials [ASTM] D 2488). The shallow soil (3 to 12 feet bgs) at the ALY site consisted of silty-sand and sandy-silt (USCS classification SM) with
2-4
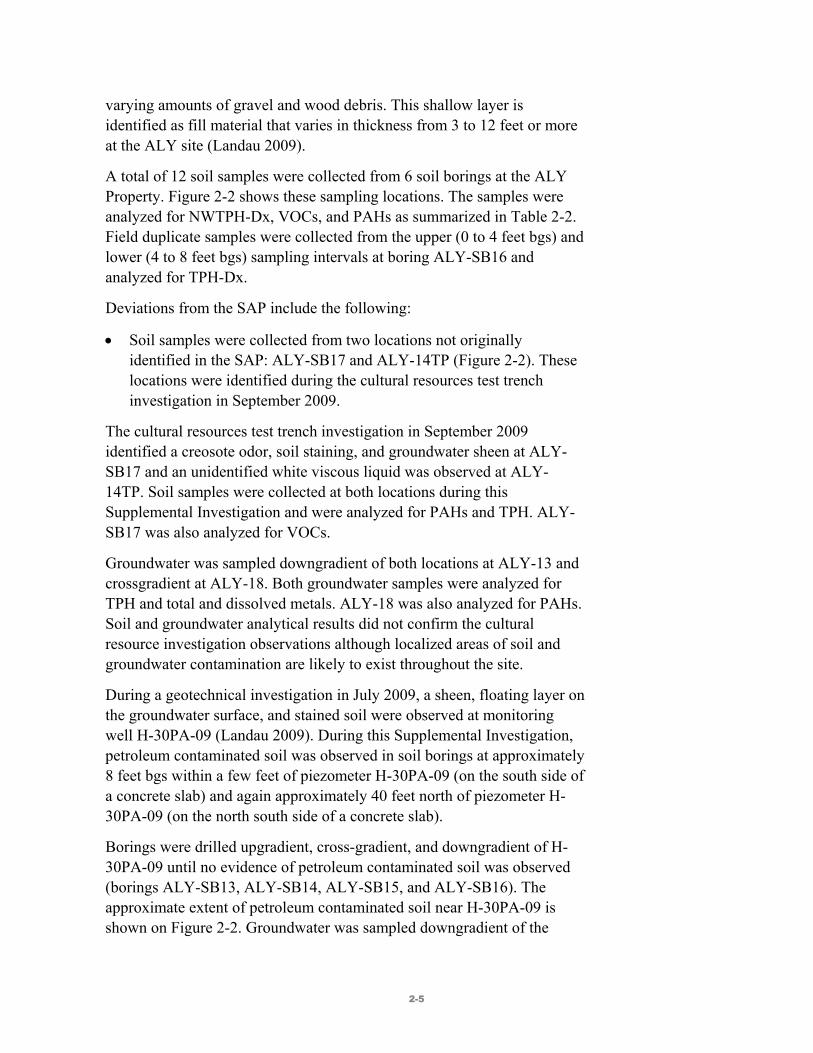
varying amounts of gravel and wood debris. This shallow layer is identified as fill material that varies in thickness from 3 to 12 feet or more at the ALY site (Landau 2009).
A total of 12 soil samples were collected from 6 soil borings at the ALY Property. Figure 2-2 shows these sampling locations. The samples were analyzed for NWTPH-Dx, VOCs, and PAHs as summarized in Table 2-2. Field duplicate samples were collected from the upper (0 to 4 feet bgs) and lower (4 to 8 feet bgs) sampling intervals at boring ALY-SB16 and analyzed for TPH-Dx.
Deviations from the SAP include the following:
• Soil samples were collected from two locations not originally identified in the SAP: ALY-SB17 and ALY-14TP (Figure 2-2). These locations were identified during the cultural resources test trench investigation in September 2009.
The cultural resources test trench investigation in September 2009 identified a creosote odor, soil staining, and groundwater sheen at ALY-SB17 and an unidentified white viscous liquid was observed at ALY-14TP. Soil samples were collected at both locations during this Supplemental Investigation and were analyzed for PAHs and TPH. ALY-SB17 was also analyzed for VOCs.
Groundwater was sampled downgradient of both locations at ALY-13 and crossgradient at ALY-18. Both groundwater samples were analyzed for TPH and total and dissolved metals. ALY-18 was also analyzed for PAHs. Soil and groundwater analytical results did not confirm the cultural resource investigation observations although localized areas of soil and groundwater contamination are likely to exist throughout the site.
During a geotechnical investigation in July 2009, a sheen, floating layer on the groundwater surface, and stained soil were observed at monitoring well H-30PA-09 (Landau 2009). During this Supplemental Investigation, petroleum contaminated soil was observed in soil borings at approximately 8 feet bgs within a few feet of piezometer H-30PA-09 (on the south side of a concrete slab) and again approximately 40 feet north of piezometer H-30PA-09 (on the north south side of a concrete slab).
Borings were drilled upgradient, cross-gradient, and downgradient of H-30PA-09 until no evidence of petroleum contaminated soil was observed (borings ALY-SB13, ALY-SB14, ALY-SB15, and ALY-SB16). The approximate extent of petroleum contaminated soil near H-30PA-09 is shown on Figure 2-2. Groundwater was sampled downgradient of the
2-5
identified petroleum contamination at ALY-13 and petroleum hydrocarbons were not detected (Figure 2-2).
2.3 Analytical Methods All groundwater samples for analysis of metals (total and dissolved) were delivered to Brooks Rand Laboratories located in Seattle, Washington. The remaining groundwater samples (analyzed for TPH-Dx, TSS, TDS, and PAHs) and all soil samples (analyzed for TPH-Dx, SVOCs, and PAHs) were delivered to Test America Laboratories located in Tacoma, Washington.
Deviations from the SAP include the following:
• Total and dissolved metals were analyzed by EPA Method 1638, Modified, Inductively Coupled Plasma - Mass Spectrometry (ICP-MS) using Dynamic Reactive Cell (DRC) technology rather than EPA Method 1640 Modified (reductive precipitation preparation with ICP-MS analysis). EPA Method 1638, Mod. ICP-MS, DRC was chosen due to the large amount of suspended solids in the samples that would interfere with the laboratory analysis of other methods.
The analytical methods used for analysis of the soil and groundwater samples included the following:
• Diesel- and oil-range TPHs using NWTPH-Dx
• Total and Dissolved Arsenic, Cadmium, Chromium, Copper, Silver, and Selenium by EPA Method 1638, Modified, using ICP-DRC-MS (groundwater samples only)
• Total and Dissolved Barium, Iron, Manganese, and Lead by EPA Method 1638, Modified, using ICP-MS with dilution (groundwater samples only)
• Total and Dissolved Mercury using EPA Method 1631 (groundwater samples only)
• VOCs using EPA Method 8260B (selected samples only)
• PAHs using EPA Method 8270 (selected samples only)
• SVOCs using EPA Method 1613B (selected samples only)
• TDS using EPA Method 160.1 (groundwater samples only)
• TSS using EPA Method 160.2 (groundwater samples only)
2-6

Samples were not analyzed for PCBs, dioxins/furans, gasoline or BETX because prior analytical results indicated that either those analytes were not detected or were detected below MTCA cleanup levels.
2-7


3. Investigation Results
Analytical results for soil and groundwater are discussed below and presented in Tables 3-1 through 3-4.
3.1 Quality Assurance/Quality Control Review A QA/QC review of the field and laboratory data procedures was conducted. The results of the QA/QC review are summarized below, and a review of the laboratory data is presented in Appendix A. Complete data reports are available in the project file.
3.1.1 Field Procedures Based on a review of the field logs, chain of custody forms, and laboratory cooler receipt forms, the field sample handling, preservation, storage, and custody were performed according to the procedures specified in the SAP with one exception: Chain of custody forms accompanying the coolers delivered to the analytical laboratories on September 17, 2009 were not signed when the samples were relinquished to the laboratories. While this is an oversight, this deviation is not expected to affect the integrity of the data.
3.1.2 Laboratory Data All groundwater samples submitted for total and dissolved metals were analyzed by Brooks Rand Labs, located in Seattle, Washington. All other groundwater and soils samples were submitted to TestAmerica laboratory, located in Tacoma, Washington. Laboratory deliverables included chain of custody forms, case narrative, measurement criteria or QA/QC summaries, and sample data.
All samples were analyzed within the holding time limits and in accordance with the analytical methods and procedures specified in the SAP. The data quality measurement criteria (that is, accuracy, precision, and completeness) reported by the analytical laboratory indicate that the sample results for all analyses should be considered appropriate for quantitative usage except for those sample results qualified as estimated. Data qualifiers assigned as a result of the QA/QC review were incorporated into this Supplemental Investigation and the project database.
3-1

3.2 Evaluation Criteria Evaluation criteria were used in this investigation for comparison purposes only. The detected soil and groundwater constituents were compared to corresponding cleanup levels (CULs) established under the Model Toxics Control Act (MTCA) (WAC 173-340), Washington State’s cleanup regulation. For this Supplemental Investigation, the soil analytical data were compared to MTCA Method B CULs for soil. If no MTCA Method B CUL exists, then the MTCA Method A CUL was used (for example, petroleum hydrocarbons).
The groundwater samples, including those collected using screened stainless steel or PVC installed temporarily in the borehole, were also compared to MTCA Method B CULs. Where a MTCA Method B CUL was not available, the Method A groundwater CUL was used.
In addition to MTCA cleanup levels, the groundwater data collected was also compared to the marine chronic surface water quality criteria (SWQC) outlined in WAC 173-201A because the groundwater sampled is representative of the water that may potentially be discharged to Grays Harbor as part of the construction dewatering operation.
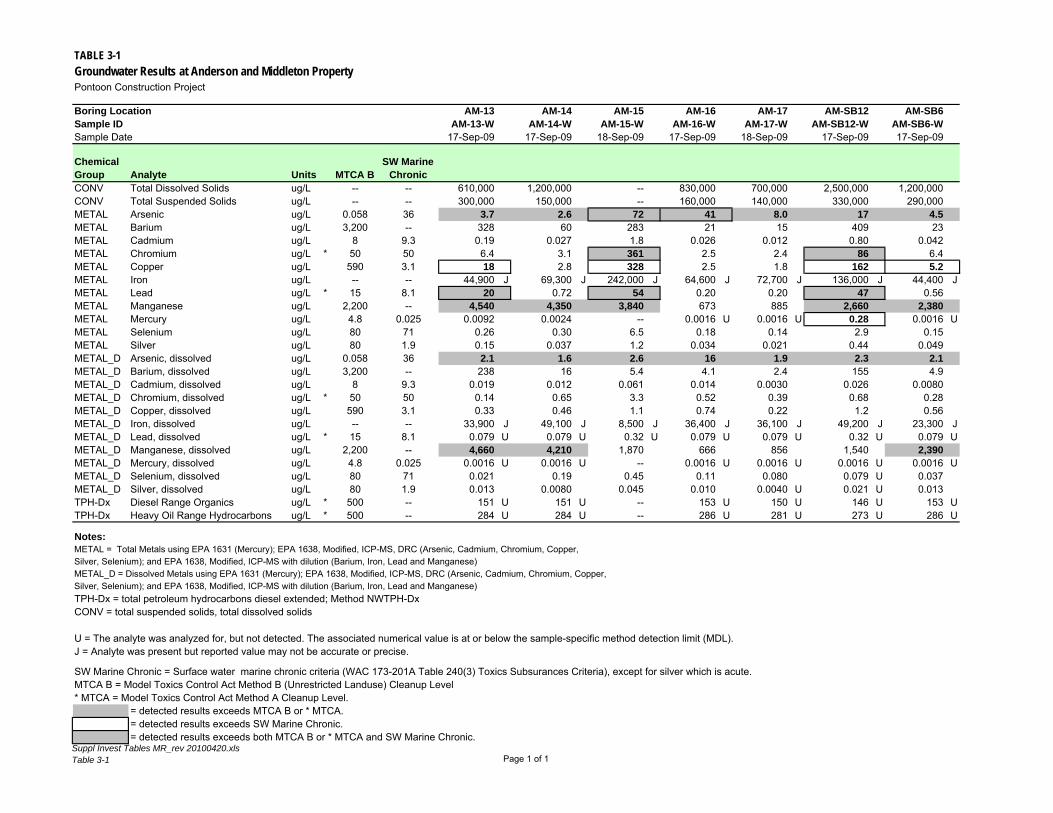
3.3 Anderson & Middleton Seven groundwater samples were collected at the A&M Property. Four total metals (arsenic, chromium, lead, and manganese) exceeded MTCA Method B CULs in one or more samples. Only two dissolved metals (arsenic and manganese) exceeded MTCA Method B CULs. None of the dissolved metals exceeded SWQC. Diesel and heavy oil were not detected in any of the samples.
No soil samples were analyzed at the A&M Property.
3.4 Aberdeen Log Yard Eight groundwater samples were collected at the ALY Property. Four total metals (arsenic, chromium, lead, and manganese) exceeded MTCA Method B CULs in one or more samples. Three dissolved metals (arsenic, lead, and manganese) exceeded MTCA Method B CULs. Dissolved copper exceeded SWQC at two sample locations (ALY-16 and ALY-18). Dissolved lead exceeded SWQC in one sample location at ALY-16. Total lead and dissolved lead concentrations exceeded MTCA Method A CUL for lead at ALY-16. Total lead also exceeded the MTCA Method A CUL at ALY-15.
3-2
Diesel-ranged petroleum hydrocarbons were detected in two samples but did not exceed the MTCA Method A CUL. At ALY-18, the only PAH detected was 1-methyl naphthalene, which does not have a MTCA Method B CUL established. No other PAHs were detected.
A total of 12 soil samples were collected and analyzed for TPH. Diesel-range TPH was detected in 5 of the 12 samples. The maximum detected concentration was 180 mg/kg, which is below the MTCA Method A CUL of 2,000 mg/kg. Heavy oil-range TPH was detected in 6 of the 12 samples. The maximum detected concentration was 252 mg/kg, which is also below the MTCA Method A CUL of 2,000 mg/kg. Two soil samples were analyzed for PAHs. Three PAHs were detected above detection limits, but were well below MTCA Method B CULs. One sample was analyzed for VOCs; no VOCs were detected.
During the July 2009 geotechnical baseline study, contamination was observed as sheen and floating layer on the groundwater surface in the southern portion of the ALY site at H-30PA-09 (Landau 2009). Soil samples were collected in the area and the approximate extent of petroleum contaminated soil was identified. Groundwater was sampled downgradient of the identified petroleum contamination and petroleum hydrocarbons were not detected. A petroleum odor was also observed during the July 2009 geotechnical investigation in the vicinity of boring H-20P-09 and pumping well PW-2 (Landau 2009). The odor appeared to be from wood encountered during drilling and so this area was not investigated during the supplemental investigation.
During the cultural resources investigation a creosote odor, soil staining, and groundwater sheen was observed in a test trench at one location and an odor at a second location (Christensen, pers. Comm. 2009). In response to these observations, soil samples were collected at these locations and groundwater samples were collected downgradient. Soil and groundwater analytical results did not confirm the cultural resource investigation observations, although localized areas of soil and groundwater contamination are likely to exist throughout the site.
3.5 Pumping Well Data from Aberdeen Log Yard
An aquifer test was conducted at the ALY Property in July 2009 at pumping well (PW-1-09) with the objective of providing drawdown and pumping data for the project Geotechnical Baseline Report (Landau 2009). The location of pumping well PW-1-09 is shown on Figure 2-2. Analytical results are presented in Table 3-5.
3-3

Two water samples were collected at Pumping Well #1 (PW-01-09) during the constant rate pumping test and submitted to Analytical Resources, Inc. (ARI) for analytical testing.
The well was screened from 65 to 80 feet. The first sample was collected on July 16 about 3 hours after pumping began and the second sample was collected on July 17 after about 24 hours of pumping. Water quality analyses included VOCs by EPA Method 8260, dissolved metals by EPA Method 200.8, alkalinity using Standard Method 2330, and hardness.
All VOCs were below or at detection limits with the exception of acetone and 2-butanone. The suspected source of acetone and 2-butanone detections are the PVC glue used during pumping well installation.
On August 6, 2009, two additional samples were collected: PW-1-F3 (from pumping well PW-1-09) and PW-1-Tank (from the on-site steel tank holding the pumped water). These samples were analyzed for VOCs. Acetone was the only analyte detected (PW-1-F3), with a concentration slightly above the detection limit.
3-4

4. Conclusions
This Supplemental Soil and Groundwater Investigation Report has been conducted to provide additional information about groundwater conditions at the A&M and ALY Properties and to evaluate the nature and extent of contamination in subsurface soil in select areas of the ALY Property from historical activities at the sites. Results of soil and groundwater samples indicate that there is evidence of localized soil and groundwater contamination on the upland portions of the properties, although these contaminants do not appear to be wide-spread as further described below.
4.1 Anderson & Middleton Property There is potential for localized area of contamination near AM-SB11 based on field observations in September 2009 when oily sheen was observed during the attempt to collect a groundwater sample. AM-SB11 is located in the southern portion of the A&M Property near the water. However, it is believed that this contamination, if present, would be limited in extent because of the following:
(1) Soil and groundwater collected in December 2008 at the same location were either not detected or were detected below MTCA Method B CULs.
(2) Additional field observations at AM-SB11B located 40 feet down-gradient from AM-SB11 showed no evidence of contamination.
It should be noted that the location of boring AM-SB11 correlates with the location of the former structures of the mill (the machine shop, blacksmith shop, a boiler, fuel bins, and several above ground storage tanks).
If localized soil contamination is encountered during any additional investigations or excavation activities at the properties, special worker protection would be required. It is recommended that WSDOT consider the potential presence of localized contamination and any potential associated costs and/or schedule delays. This includes notification in contract documents with accompanying specifications for materials handling and worker health and safety.
Groundwater results at the A&M site from this Supplemental Investigation indicate that none of the dissolved metals concentrations exceeded the SWQC, while data from the Phase II ESA indicated total and dissolved copper concentrations slightly exceeding the SWQC in one sample. The need for groundwater treatment will depend on the water treatment system
4-1
selected for the site and on the requirements of the receiving entity, which will be determined as part of the water discharge permitting process.
The results of this Supplemental Investigation are consistent with the previous Phase II ESA finding that there does not appear to be widespread adverse impact to the soil or groundwater at the Anderson & Middleton Property as a result of its past site use as a sawmill and log storage yard.
4.2 Aberdeen Log Yard Property In the southern portion of the site in the vicinity of piezometer H-30PA-09, the extent of petroleum contaminated soil has been delineated through analysis of soil samples collected from several borings (Figure 2-2). The extent of petroleum contaminated soil measured approximately 50 feet by 70 feet by 6 feet deep. Groundwater was sampled downgradient of this location and petroleum hydrocarbons were not detected. This area correlates with the nearby former locations of structures of the mill (the machine shop, blacksmith shop, a boiler, fuel bins, and refuse burner).
Additional localized areas of soil and groundwater contamination may be present based on field observations during the archeological test trench investigation conducted in September 2009. During test trench excavations two potential locations of contamination were identified based on visual observations. Soil and groundwater analytical results did not confirm the cultural resource investigation observations although localized areas of soil and groundwater contamination are likely to exist in this area of the site based on the field observations.
As discussed above, at least one localized area of soil contamination at the property has been confirmed at ALY. Contaminated soil and/or groundwater may be present in two other areas. If soil contamination is encountered during excavation activities, special worker protection would be required and soil disposal will need to occur according to applicable regulations.
It is recommended that WSDOT consider the presence of localized contamination(s) and any potential associated costs and/or schedule delays. This includes notification in contract documents and accompanying specifications for materials handling and worker health and safety.
Groundwater results at the ALY site from this Supplemental Investigation indicate that two dissolved metals (copper and lead) concentrations exceeded the SWQC at one location. The total and dissolved lead concentrations collected from the same location also exceeded MTCA
4-2

Method A CUL for lead. PAHs were either not detected or detected below MTCA Method B CULs in groundwater. Data from the Phase II ESA indicate all analytes were below SWQC. Groundwater data results from PW-1-09 did not indicate any dissolved metals concentrations above SWQC.
Laboratory analysis of groundwater samples collected during the Phase II ESA and from this Supplemental Investigation indicates that at least a portion of the groundwater pumped from the ALY Property may require additional treatment and/or offsite disposal. This is particularly true in the vicinity of H-30PA-09 (where petroleum hydrocarbons were observed during the geotechnical investigation) and at ALY-16 (where elevated metals concentrations, including lead and copper, have been detected). Groundwater treatment options will vary depending on the water treatment system selected for the site and on the requirements of the receiving entity, which will be determined as part of the water discharge permitting process.
The results of this Supplemental Investigation is consistent with previous Phase II ESA finding that there does not appear to be widespread adverse impact to the soil or groundwater at the ALY Property as a result of its past site use as a sawmill and log storage yard.
4-3


5. References
CH2M HILL. 2009a. Phase II Environmental Site Assessment. Prepared for WSDOT. June 2009.
CH2M HILL. 2009b. Sampling and Analysis Plan for Anderson & Middleton and Aberdeen Log Yard Properties Aberdeen/Hoquiam, WA. Prepared for WSDOT. September 2009.
Landau Associates. 2009. Geotechnical Baseline Report SR 520 Pontoon Construction Design-Build Project Aberdeen Log Yard, Aberdeen, Washington. Prepared for WSDOT and HDR Engineering, Inc., Seattle, Washington. September 16, 2009.
Christensen, Brian. 2009. Personal communication. Landau Inc. September 16, 2009.
U.S. Environmental Protection Agency (U.S. EPA). 2001. USEPA Contract Laboratory Program National Functional Guidelines for Organic Data Review, Final. EPA-540/R-99-008 (PB99-963506). October 1999.
U.S. Environmental Protection Agency (U.S. EPA). 2004. USEPA Contract Laboratory Program National Functional Guidelines for Inorganic Data Review, Final. EPA-540/R-04-004, OSWER 9240.1-45. October 2004.
U.S. Environmental Protection Agency (U.S. EPA). 2005. Groundwater Sampling and Monitoring with Direct Push Technologies. EPA-540/R-04-005, OSWER No. 9200.1-51. August 2005.
Washington State Department of Ecology. 1994. Natural Background Soil Metals Concentrations in Washington State. Publication No. 94-115. October, 1994.
5-1


Figures

L STN ST
8TH ST
0 200 400 Feet
Anderson & Middleton
Grays Harbor
HERON ST
GARFIELDST
¯ 0 200 400 Feet
Aberdeen Log Yard
Grays Harbor
¯
CTC Facility
§̈¦405
Grays Harbor Build Alternative Sites
§̈¦5
Crane rail
Proposed rail spur
Existing railroad
Cross pontoon
Longitudinal pontoon
Water treatment area
Access road
Batch plant
Berm
Casting basin
Dry storage and laydown area
Gate
Launch channel
Office and parking
Source: WSDOT (2005, 2006) Aerial Photo, USDA-FSA (2006) Aerial Photo, Grays Harbor County (2006) GIS Data (Roads), Horizontal datum for all layers is State Plane Washington South NAD 83; vertical datum for layers is NAVD88.
Figure 1-1. Locations and Conceptual Layouts for Build Alternative Sites Pontoon Construction Project
\\SIMBA\PROJ\PARAMETRIX\180171\GIS\MAPFILES\PONTOON\SPECIALREQUESTS\PON_DR_HAZ_CONCEPTUALDESIGN.MXD 11/16/2009

!
!
!
!
!?
!$
!$ !A !? !$
!?
!$ !$
!?
!$ !? !A !?
!<
!<
Grays Harbor
Anderson & Middleton
PUGET SOUND & PACIFIC RAILROAD
8TH
ST
MST
7TH ST
10TH ST
L ST
9TH ST
5TH ST EXT
NST
AM-SB1
AM-SB2
AM-SB3 H-5P-08 AM-SB5 AM-SB4
AM-SB6
AM-SB7 AM-SB8 AM-SB9
AM-SB10 AM-SB11
H-8P-08
AM-SB12
MW-1
MW-5
¾À105
¾À109
¾À101
Hoquiam Aberdeen
Aberdeen Log Yard
Anderson & Middleton < Monitor Well Sample Location, January 2009
A Piezometer Sample Location, January 2009
$ Direct Push Soil Sample Location, December 2009
? Direct Push Soil and Groundwater Sample Location, December 2009
Build Alternative Site
0 250 500 Feet ¯
Source: Grays Harbor County (2006) GIS Data (Waterbody and Street), WSDOT (2005) Aerial Photograph. Horizontal datum for all layers is State Plane Washington South NAD 83; vertical datum for layers is NAVD88.
Figure 2-1. Anderson & Middleton Phase II ESA Sampling Locations Pontoon Construction Project
\\JAFAR\PROJ\PARAMETRIX_400707\MAPFILES\PONTOON\SPECIALREQUESTS\HAZARDOUSMATERIALS\PHASEIIESA\PON_SR_P2ESA_SAMPLINGLOCATIONS.MXD 4/29/10

GARFIELDST
DIV
ISIO
N S
T
EA
ST
TER
MIN
AL
RD
ALY-14
ALY-15
ALY-16
ALY-18
ALY-19
ALY-SB3
ALY-13
ALY-SB12
ALY-SB11
H-3P-08
ALY-SB9
ALY-SB10
ALY-SB5
ALY-SB2
H-2P-08
ALY-SB4
ALY-SB6
ALY-SB8
ALY-SB15
ALY-SB14
ALY-SB13ALY-SB16
H-30PA-09 H-30P-09
ALY-14TP
ALY-SB17
PW-1-09
PW-2-09
H-20P-09
0 500250 Feet INTERNAL USE ONLY-DRAFT
105
109
101
Hoquiam Aberdeen
Aberdeen Log Yard
Anderson & Middleton
Groundwater Sampling Location, September 2009
Boring Location, September 2009
Pumping Well Sample Location, July and August 2009
Phase II ESA Sampling Location, December 2008 and January 2009
Geotechnical Baseline Study, Landau 2009
Approximate Extent of Petroleum Contaminated Soil, September 2009
Build Alternative Site
Source: WSDOT (2006) Aerial Photo and Grays Harbor County (2007) GIS Data (Streets). Horizontal datum for all layers is State Plane Washington South NAD 83; vertical datum for layers is NAVD88.
Figure 2-2. Aberdeen Log YardSupplemental Soil and Groundwater Investigation, September 2009
Pontoon Construction Project
\\SIMBA\PROJ\PARAMETRIX\180171\GIS\MAPFILES\PONTOON\SPECIALREQUESTS\HAZARDOUSMATERIALS\SSGR\PON_SR_HAZ_SSGR_ALY.MXD 11/2/2009


Tables


TABLE 2-1 September 2009 Samples Used for Evaluation at the Anderson & Middleton Property Pontoon Construction Project
Analytical Methods Boring Sample Sample
Sample ID Location Type Date METAL METAL_D TPH-Dx CONV Groundwater AM-13-W AM-14-W AM-15-W AM-16-W AM-17-W AM-SB6-W AM-SB12-W
AM-13 AM-14 AM-15 AM-16 AM-17 AM-SB6 AM-SB12
N N N N N N N
17-Sep-09 17-Sep-09 18-Sep-09 17-Sep-09 18-Sep-09 17-Sep-09 17-Sep-09
X X X X X X X
X X X X X X X
X X --X X X X
X X --X X X X
Notes:
METAL = Total Metals using EPA 1631 (Mercury); EPA 1638, Modified, ICP-MS, DRC (Arsenic, Cadmium, Chromium, Copper,
Silver, Selenium); and EPA 1638, Modified, ICP-MS with dilution (Barium, Iron, Lead and Manganese)
Silver, Selenium); and EPA 1638, Modified, ICP-MS with dilution (Barium, Iron, Lead and Manganese) TPH-Dx = total petroleum hydrocarbons diesel extended; Method NWTPH-Dx CONV = total suspended solids, total dissolved solids N = normal environmental sample
METAL_D = Dissolved Metals using EPA 1631 (Mercury); EPA 1638, Modified, ICP-MS, DRC (Arsenic, Cadmium, Chromium, Copper,
Suppl Invest Tables MR_rev 20100420.xls Table 2-1 Page 1 of 1


TABLE 2-2 September 2009 Samples Used for Evaluation at the Aberdeen Log Yard Property 520 Pontoon Construction Project
Analytical Methods Sample Sample Depths
Sample ID Boring Location Type (feet) Sample Date METAL METAL_D TPH-Dx CONV PAH VOC Soil ALY-SB13-0-4 ALY-SB13 N 0-4 15-Sep-09 - - X - - -ALY-SB13-4-8 ALY-SB13 N 4-8 15-Sep-09 - - X - - -ALY-SB14-0-4 ALY-SB14 N 0-4 15-Sep-09 - - X - - -ALY-SB14-4-8 ALY-SB14 N 4-8 15-Sep-09 - - X - - -ALY-SB15-0-4 ALY-SB15 N 0-4 15-Sep-09 - - X - - -ALY-SB15-4-8 ALY-SB15 N 4-8 15-Sep-09 - - X - - -ALY-SB16-0-4 ALY-SB16 N 0-4 15-Sep-09 - - X - - -ALY-SB16-4-8 ALY-SB16 N 4-8 15-Sep-09 - - X - - -ALY-SB16A-0-4 ALY-SB16 FD 0-4 15-Sep-09 - - X - - -ALY-SB16A-4-8 ALY-SB16 FD 4-8 15-Sep-09 - - X - - -ALY-SB17-18-22 ALY-SB17 N 18-22 16-Sep-09 - - X - X X ALY-14TP-4-8 ALY-14TP N 4-8 17-Sep-09 - - X - X -Groundwater ALY-SB3-W ALY-SB3 N -- 15-Sep-09 X X X X - -ALY-SB12-W ALY-SB12 N -- 15-Sep-09 X X X X - -ALY-SB12A-W ALY-SB12 FD -- 15-Sep-09 X X X X - -ALY-13-W ALY-13 N -- 15-Sep-09 X X X X - -ALY-14-W ALY-14 N -- 16-Sep-09 X X X X - -ALY-15-W ALY-15 N -- 16-Sep-09 X X X X - -ALY-16-W ALY-16 N -- 16-Sep-09 X X X X - -ALY-18-W ALY-18 N -- 17-Sep-09 X X X X X -ALY-19-W ALY-19 N -- 18-Sep-09 X X X X - -Notes: METAL = Total Metals using EPA 1631 (Mercury); EPA 1638, Modified, ICP-MS, DRC (Arsenic, Cadmium, Chromium, Copper, Silver, Selenium); and EPA 1638, Modified, ICP-MS with dilution (Barium, Iron, Lead and Manganese) METAL_D = Dissolved Metals using EPA 1631 (Mercury); EPA 1638, Modified, ICP-MS, DRC (Arsenic, Cadmium, Chromium, Copper, Silver, Selenium); and EPA 1638, Modified, ICP-MS with dilution (Barium, Iron, Lead and Manganese) TPH-Dx = total petroleum hydrocarbons diesel extended; Method NWTPH-Dx CONV = total suspended solids, total dissolved solids PAH = polycyclic aromatic hydrocarbons, Method 8270C SIM STD VOC = volatile organoc compounds, Method 8260B STD
N = normal environmental sample FD = field duplicate sample
Suppl Invest Tables MR_rev 20100420.xls Table 2-2 Page 1 of 1

--
-- --
----
TABLE 3-1 Groundwater Results at Anderson and Middleton Property Pontoon Construction Project
Boring Location AM-13 AM-14 AM-15 AM-16 AM-17 AM-SB12 AM-SB6 Sample ID AM-13-W AM-14-W AM-15-W AM-16-W AM-17-W AM-SB12-W AM-SB6-W Sample Date 17-Sep-09 17-Sep-09 18-Sep-09 17-Sep-09 18-Sep-09 17-Sep-09 17-Sep-09
Chemical SW Marine Group Analyte Units MTCA B Chronic CONV Total Dissolved Solids ug/L -- -- 610,000 1,200,000 -- 830,000 700,000 2,500,000 1,200,000CONV Total Suspended Solids ug/L -- -- 300,000 150,000 -- 160,000 140,000 330,000 290,000METAL Arsenic ug/L 0.058 36 3.7 2.6 72 41 8.0 17 4.5 METAL Barium METAL Cadmium METAL Chromium METAL Copper METAL Iron METAL Lead METAL Manganese METAL Mercury METAL Selenium METAL Silver
ug/L ug/L ug/L * ug/L ug/L ug/L * ug/L ug/L ug/L ug/L
3,200850
590
15 2,200
4.8 80 80
9.3 50 3.1
8.1
0.025 71 1.9
328 0.19 6.4 18
44,900 J
0.0092 0.26 0.15
60 0.027
3.12.8
69,300 J
0.0024 0.30
0.037
283 1.8 361 328
242,000 J
6.5 1.2
21 0.026
2.5 2.5
64,600 0.20 673
0.0016 0.18
0.034
J
U
15 0.012
2.4 1.8
72,700 0.20 885
0.0016 0.14
0.021
J
U
409 0.80
86 162
136,000 J
2.9 0.44
23 0.042
6.4 5.2
44,400 J
0.15 0.049
20 0.72 54 4,540 4,350 3,840
47 0.56 2,660 2,380
0.28 0.0016 U
METAL_D Arsenic, dissolved ug/L 0.058 36 2.1 1.6 2.6 16 1.9 2.3 2.1 METAL_D Barium, dissolved ug/L 3,200 -- 238 16 5.4 4.1 2.4 155 4.9 METAL_D Cadmium, dissolved ug/L 8 9.3 0.019 0.012 0.061 0.014 0.0030 0.026 0.0080 METAL_D Chromium, dissolved ug/L * 50 50 0.14 0.65 3.3 0.52 0.39 0.68 0.28 METAL_D Copper, dissolved ug/L 590 3.1 0.33 0.46 1.1 0.74 0.22 1.2 0.56 METAL_D Iron, dissolved ug/L -- -- 33,900 J 49,100 J 8,500 J 36,400 J 36,100 J 49,200 J 23,300 J METAL_D Lead, dissolved ug/L * 15 8.1 0.079 U 0.079 U 0.32 U 0.079 U 0.079 U 0.32 U 0.079 U METAL_D Manganese, dissolved ug/L 2,200 -- 4,660 4,210 1,870 666 856 1,540 2,390 METAL_D Mercury, dissolved ug/L 4.8 0.025 0.0016 U 0.0016 U -- 0.0016 U 0.0016 U 0.0016 U 0.0016 U METAL_D Selenium, dissolved ug/L 80 71 0.021 0.19 0.45 0.11 0.080 0.079 U 0.037 METAL_D Silver, dissolved ug/L 80 1.9 0.013 0.0080 0.045 0.010 0.0040 U 0.021 U 0.013 TPH-Dx Diesel Range Organics ug/L * 500 -- 151 U 151 U -- 153 U 150 U 146 U 153 U TPH-Dx Heavy Oil Range Hydrocarbons ug/L * 500 -- 284 U 284 U -- 286 U 281 U 273 U 286 U
Notes: METAL = Total Metals using EPA 1631 (Mercury); EPA 1638, Modified, ICP-MS, DRC (Arsenic, Cadmium, Chromium, Copper,Silver, Selenium); and EPA 1638, Modified, ICP-MS with dilution (Barium, Iron, Lead and Manganese)METAL_D = Dissolved Metals using EPA 1631 (Mercury); EPA 1638, Modified, ICP-MS, DRC (Arsenic, Cadmium, Chromium, Copper,Silver, Selenium); and EPA 1638, Modified, ICP-MS with dilution (Barium, Iron, Lead and Manganese)TPH-Dx = total petroleum hydrocarbons diesel extended; Method NWTPH-DxCONV = total suspended solids, total dissolved solids
U = The analyte was analyzed for, but not detected. The associated numerical value is at or below the sample-specific method detection limit (MDL). J = Analyte was present but reported value may not be accurate or precise.
SW Marine Chronic = Surface water marine chronic criteria (WAC 173-201A Table 240(3) Toxics Subsurances Criteria), except for silver which is acute. MTCA B = Model Toxics Control Act Method B (Unrestricted Landuse) Cleanup Level * MTCA = Model Toxics Control Act Method A Cleanup Level.
= detected results exceeds MTCA B or * MTCA. = detected results exceeds SW Marine Chronic. = detected results exceeds both MTCA B or * MTCA and SW Marine Chronic.
Suppl Invest Tables MR_rev 20100420.xls Table 3-1 Page 1 of 1

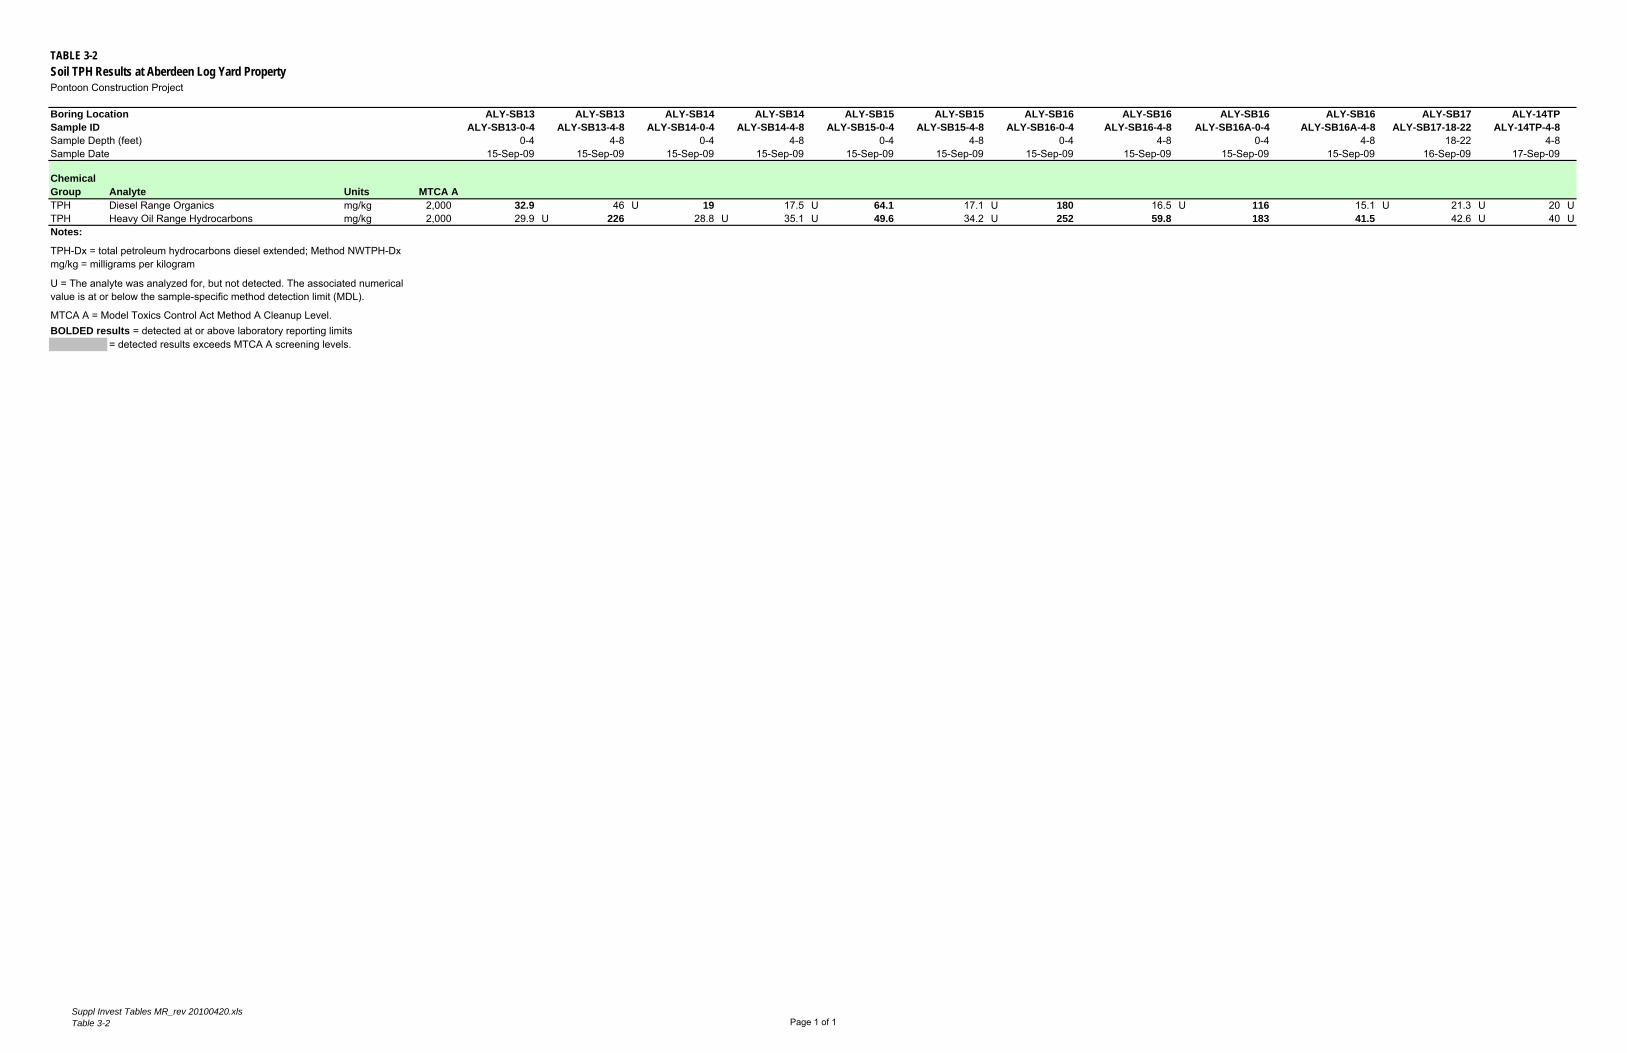
TABLE 3-2 Soil TPH Results at Aberdeen Log Yard Property Pontoon Construction Project
Boring Location Sample ID Sample Depth (feet) Sample Date
ALY-SB13 ALY-SB13-0-4
0-4 15-Sep-09
ALY-SB13 ALY-SB13-4-8
4-8 15-Sep-09
ALY-SB14 ALY-SB14-0-4
0-4 15-Sep-09
ALY-SB14 ALY-SB14-4-8
4-8 15-Sep-09
ALY-SB15 ALY-SB15-0-4
0-4 15-Sep-09
ALY-SB15 ALY-SB15-4-8
4-8 15-Sep-09
ALY-SB16 ALY-SB16-0-4
0-4 15-Sep-09
ALY-SB16 ALY-SB16-4-8
4-8 15-Sep-09
ALY-SB16 ALY-SB16A-0-4
0-4 15-Sep-09
ALY-SB16 ALY-SB16A-4-8
4-8 15-Sep-09
ALY-SB17 ALY-SB17-18-22
18-22 16-Sep-09
ALY-14TP ALY-14TP-4-8
4-8 17-Sep-09
Chemical Group TPH TPH Notes:
Analyte Diesel Range Organics Heavy Oil Range Hydrocarbons
Units mg/kg mg/kg
MTCA A 2,000 2,000
32.9 29.9 U
46 U 226
19 28.8 U
17.5 U 35.1 U
64.1 49.6
17.1 U 34.2 U
180 252
16.5 U 59.8
116 183
15.1 U 41.5
21.3 U 42.6 U
20 U 40 U
TPH-Dx = total petroleum hydrocarbons diesel extended; Method NWTPH-Dx mg/kg = milligrams per kilogram
U = The analyte was analyzed for, but not detected. The associated numerical value is at or below the sample-specific method detection limit (MDL).
MTCA A = Model Toxics Control Act Method A Cleanup Level. BOLDED results = detected at or above laboratory reporting limits
= detected results exceeds MTCA A screening levels.
Suppl Invest Tables MR_rev 20100420.xls Table 3-2 Page 1 of 1


TABLE 3-3 Additional Soil Results at Aberdeen Log Yard Property Pontoon Construction Project
Boring Location ALY-14TP ALY-SB17 Sample ID ALY-14TP-4-8 ALY-SB-17-18-22 Sample Depth (feet) 4-8 18-22 Sample Date 17-Sep-09 16-Sep-09
Chemical Group Analyte Units MTCA B PAH 1-Methylnaphthalene mg/kg -- 0.0078 U 0.0081 U PAH 2-Methylnaphthalene mg/kg 320 0.0078 U 0.0081 U PAH Acenaphthene mg/kg 4,800 0.0078 U 0.0081 U PAH Acenaphthylene mg/kg -- 0.0078 U 0.0081 U PAH Anthracene mg/kg 24,000 0.0078 U 0.0081 U PAH Benzo[a]anthracene mg/kg -- 0.0078 U 0.0081 U PAH Benzo[a]pyrene mg/kg 0.14 0.0078 U 0.0081 U PAH Benzo[b]fluoranthene mg/kg -- 0.0078 U 0.0081 U PAH Benzo[g,h,i]perylene mg/kg -- 0.0078 U 0.0081 U PAH Benzo[k]fluoranthene mg/kg -- 0.0078 U 0.0081 U PAH Chrysene mg/kg -- 0.0078 U 0.0081 U PAH Dibenz(a,h)anthracene mg/kg -- 0.0078 U 0.0081 U PAH Fluoranthene mg/kg 3,200 0.014 0.0081 U PAH Fluorene mg/kg 3,200 0.0078 U 0.0081 U PAH Indeno[1,2,3-cd]pyrene mg/kg -- 0.0078 U 0.0081 U PAH Naphthalene mg/kg 1,600 0.0078 U 0.0081 U PAH Phenanthrene mg/kg -- 0.009 0.0081 U PAH Pyrene mg/kg 2,400 0.012 0.0081 U VOC 1,1,1,2-Tetrachloroethane mg/kg 38 -- 0.12 U VOC 1,1,1-Trichloroethane mg/kg 72,000 -- 0.12 U VOC 1,1,2,2-Tetrachloroethane mg/kg 5 -- 0.031 U VOC 1,1,2-Trichloroethane mg/kg 18 -- 0.037 U VOC 1,1-Dichloroethane mg/kg 16,000 -- 0.12 U VOC 1,1-Dichloroethene mg/kg 4,000 -- 0.061 U VOC 1,1-Dichloropropene mg/kg -- -- 0.12 U VOC 1,2,3-Trichlorobenzene mg/kg -- -- 0.12 U VOC 1,2,3-Trichloropropane mg/kg 0.14 -- 0.12 U VOC 1,2,4-Trichlorobenzene mg/kg 800 -- 0.12 U VOC 1,2,4-Trimethylbenzene mg/kg 4,000 -- 0.12 U VOC 1,2-Dibromo-3-Chloropropane mg/kg 0.71 -- 0.61 U VOC 1,2-Dichlorobenzene mg/kg 7,200 -- 0.12 U VOC 1,2-Dichloroethane mg/kg 11 -- 0.12 U VOC 1,2-Dichloropropane mg/kg 15 -- 0.037 U VOC 1,3,5-Trimethylbenzene mg/kg 4,000 -- 0.12 U VOC 1,3-Dichlorobenzene mg/kg -- -- 0.12 U VOC 1,3-Dichloropropane mg/kg -- -- 0.12 U VOC 1,4-Dichlorobenzene mg/kg 42 -- 0.12 U VOC 2,2-Dichloropropane mg/kg -- -- 0.12 U VOC 2-Chlorotoluene mg/kg 1,600 -- 0.12 U VOC 4-Chlorotoluene mg/kg -- -- 0.12 U VOC 4-Isopropyltoluene mg/kg -- -- 0.12 U VOC Benzene mg/kg 18 -- 0.049 U VOC Bromobenzene mg/kg -- -- 0.12 U VOC Bromoform mg/kg 130 -- 0.12 U VOC Bromomethane mg/kg 110 -- 0.43 U VOC Carbon tetrachloride mg/kg 7.7 -- 0.061 U VOC Chlorobenzene mg/kg 1,600 -- 0.12 U VOC Chlorobromomethane mg/kg -- -- 0.12 U VOC Chlorodibromomethane mg/kg 12 -- 0.12 U VOC Chloroethane mg/kg 350 -- 1.2 U VOC Chloroform mg/kg 160 -- 0.12 U VOC Chloromethane mg/kg 77 -- 1.2 U VOC cis-1,2-Dichloroethene mg/kg 800 -- 0.12 U
Suppl Invest Tables MR_rev 20100420.xls Table 3-3 Page 5 of 12
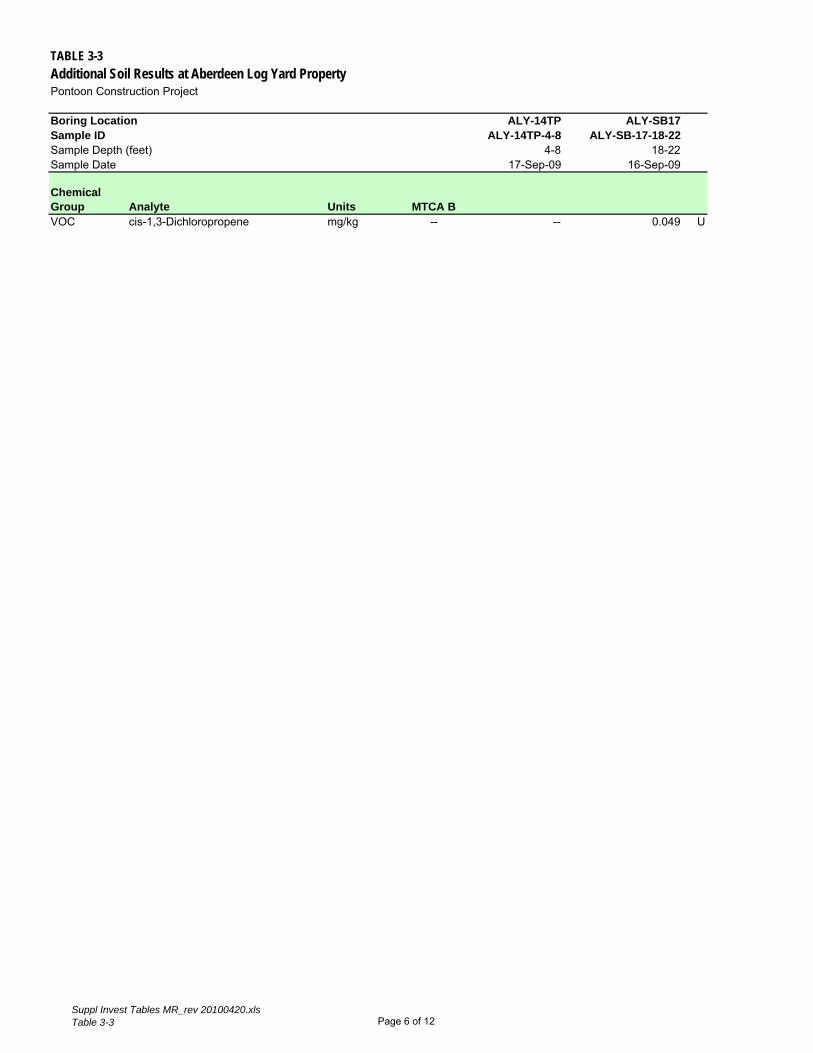
TABLE 3-3 Additional Soil Results at Aberdeen Log Yard Property Pontoon Construction Project
Boring Location ALY-14TP ALY-SB17 Sample ID ALY-14TP-4-8 ALY-SB-17-18-22 Sample Depth (feet) 4-8 18-22 Sample Date 17-Sep-09 16-Sep-09
Chemical Group Analyte Units MTCA B VOC cis-1,3-Dichloropropene mg/kg -- -- 0.049 U
Suppl Invest Tables MR_rev 20100420.xls Table 3-3 Page 6 of 12

TABLE 3-3 Additional Soil Results at Aberdeen Log Yard Property Pontoon Construction Project
Boring Location ALY-14TP ALY-SB17 Sample ID ALY-14TP-4-8 ALY-SB-17-18-22 Sample Depth (feet) 4-8 18-22 Sample Date 17-Sep-09 16-Sep-09
Chemical Group Analyte Units MTCA B VOC Dibromomethane mg/kg 800 -- 0.12 U VOC Dichlorobromomethane mg/kg 16 -- 0.12 U VOC Dichlorodifluoromethane mg/kg 16,000 -- 0.12 U VOC Ethylbenzene mg/kg 8,000 -- 0.12 U VOC Ethylene Dibromide mg/kg 0.012 -- 0.12 U VOC Hexachlorobutadiene mg/kg 13 -- 0.12 U VOC Isopropylbenzene mg/kg 8,000 -- 0.12 U VOC Methylene Chloride mg/kg 130 -- 0.12 U VOC m-Xylene & p-Xylene mg/kg 160,000 -- 0.12 U VOC Naphthalene mg/kg 1,600 -- 0.12 U VOC n-Butylbenzene mg/kg -- -- 0.12 U VOC N-Propylbenzene mg/kg -- -- 0.12 U VOC o-Xylene mg/kg 160,000 -- 0.12 U VOC sec-Butylbenzene mg/kg -- -- 0.12 U VOC Styrene mg/kg 33 -- 0.12 U VOC tert-Butylbenzene mg/kg -- -- 0.12 U VOC Tetrachloroethene mg/kg 1.9 -- 0.061 U VOC Toluene mg/kg 6,400 -- 0.12 U VOC trans-1,2-Dichloroethene mg/kg 1,600 -- 0.12 U VOC trans-1,3-Dichloropropene mg/kg -- -- 0.049 U VOC Trichloroethene mg/kg 11 -- 0.049 U VOC Trichlorofluoromethane mg/kg 24,000 -- 0.12 U VOC Vinyl chloride mg/kg 0.67 -- 0.025 U Notes:
VOC = volatile organoc compounds, Method 8260B STD PAH = polycyclic aromatic hydrocarbons, Method 8270C SIM STD
mg/kg = milligrams per kilogram U = The analyte was analyzed for, but not detected. The associated numerical value is at or below the sample-specific MDL = method detection limit
MTCA B = Model Toxics Control Act Method B (Unrestricted Landuse) Cleanup Level * MTCA = Model Toxics Control Act Method A Cleanup Level.
= detected results exceeds MTCA screening levels.
Suppl Invest Tables MR_rev 20100420.xls Table 3-3 Page 7 of 12


-- ---- --
-- ---- ---- --
TABLE 3-4 Groundwater Results at Aberdeen Log Yard Property Pontoon Construction Project
Boring Location Sample ID Sample Date
ALY-SB3 ALY-SB3-W
15-Sep-09
ALY-SB12 ALY-SB12A-W
15-Sep-09
ALY-SB12 ALY-SB12-W
15-Sep-09
ALY-13 ALY-13-W 15-Sep-09
ALY-14 ALY-14-W 16-Sep-09
ALY-15 ALY-15-W 16-Sep-09
ALY-16 ALY-16-W 16-Sep-09
ALY-18 ALY-18-W 17-Sep-09
ALY-19 ALY-19-W 18-Sep-09
PW-1-09 PW-1-09-S1
7/16/2009
PW-1-09 PW-1-09-S2
7/16/2009
Chemical Group Analyte CONV Total Dissolved Solids CONV Total Suspended Solids METAL Arsenic
Units ug/L ug/L ug/L
MTCA B ----
0.058
SW Marine Chronic
----36
980,000 120,000
1.78
1,600,000 110,000
4.07
1,600,000 110,000
4.08
1,500,000 60,000
2.43
1,100,000 56,000
2.22
930,000 450,000
11.6
2,700,000 280,000
4.71
7,600,000 190,000
3.47
--130,000
1.94
------
------
METAL Barium ug/L 3,200 -- 93.3 220 220 38.6 73 281 30.2 1,100 1,370 -- --METAL Cadmium ug/L 8 9.3 0.071 0.018 0.017 0.016
3.58 58.8 15.6 0.984 8.93 3.44 77.1 17.9 5.81 J 4.31
0.04 0.503 0.143 0.045 0.067 -- --METAL Chromium ug/L * 50 50 2.83 0.988 0.994 1.27 METAL Copper ug/L 590 3.1 2.92 2.89 2.9 1.5 METAL Iron ug/L -- -- 23,100 J 51,300 J 50,900 J 71,100 J 31,800 J 79,400 J 47,400 J 191,000 J 141,000 J -- --METAL Lead ug/L * 15 8.1 METAL Manganese ug/L 2,200 --METAL Mercury ug/L 4.8 0.025
0.885 1.13 1.21 0.158 U 0.837 16.1 623 0.333 0.316 U 2,510 2,280 2,270 12,100 3,940 3,430 2,710 25,000 4,810
0.00158 U 0.00158 U 0.00158 U 0.0003 0.00431 0.135 0.0144 0.00035 0.00158 U METAL Selenium ug/L 80 71 0.176 0.062 0.052 0.121 0.147 1.64 0.728 0.147 0.226 -- --METAL Silver ug/L 80 1.9 0.059 0.013 0.014 0.021 0.023 0.52 0.166 0.028 0.034 -- --METAL_D Arsenic, dissolved ug/L 0.058 36 0.593 1.7 1.61 1.23 0.818 1.85 1.9 1.79 0.951 0.7 0.8 METAL_D Barium, dissolved ug/L 3,200 -- 56.2 93.6 85.7 28.7 13.2 59.9 8.73 713 1,170 14 11.8 METAL_D Cadmium, dissolved ug/L 8 9.3 0.017 0.005 0.015 0.014 0.002 0.014 0.077 0.038 0.033 0.2 U 0.2 U METAL_D Chromium, dissolved ug/L * 50 50 0.18 0.189 0.183 0.521 0.315 0.488 0.107 2 U 2 U METAL_D Copper, dissolved ug/L 590 3.1 0.452 0.873 0.77 0.686 0.775 0.834 2.2 0.5 U 0.5 U METAL_D Iron, dissolved ug/L -- -- 7,400 J 30,100 J 28,900 J 59,000 J 5,210 J 9,980 J 17,600 J 152,000 J 117,000 J 5,300 5,450 METAL_D Lead, dissolved ug/L * 15 8.1 1 U 1 U METAL_D Manganese, dissolved ug/L 2,200 -- 337 318 METAL_D Mercury, dissolved ug/L 4.8 0.025 0.00158 U 0.00158 U 0.00158 U 0.00158 U 0.00016 U 0.00016 U 0.00058 0.00031 U 0.00158 U 0.1 U 0.1 U METAL_D Selenium, dissolved ug/L 80 71 0.068 0.032 U 0.046 0.051 0.066 0.066 0.371 0.139 0.112 2 U 2 METAL_D Silver, dissolved ug/L 80 1.9 0.01 0.008 U 0.01 0.008 U 0.004 U 0.006 0.094 0.021 U 0.021 U 0.2 U 0.2 U TPH-Dx Diesel Range Organics ug/L * 500 -- 250 U 250 U 250 U 248 U 151 U 491 299 150 U 151 U -- --TPH-Dx Heavy Oil Range Hydrocarbons ug/L * 500 -- 500 U 500 U 500 U 495 U 284 U 284 U 281 U 281 U 284 U -- --PAH 1-Methylnaphthalene ug/L -- -- -- -- -- -- -- -- -- 0.2 -- -- --PAH 2-Methylnaphthalene ug/L 32 -- -- -- -- -- -- -- -- 0.13 U -- -- --PAH Acenaphthene ug/L 960 -- -- -- -- -- -- -- -- 0.1 U -- -- --PAH Acenaphthylene ug/L -- -- -- -- -- -- -- -- -- 0.1 U -- -- --PAH Anthracene ug/L 4,800 -- -- -- -- -- -- -- -- 0.1 U -- -- --PAH Benzo[a]anthracene ug/L -- -- -- -- -- -- -- -- -- 0.1 U -- -- --PAH Benzo[a]pyrene ug/L 0.012 -- -- -- -- -- -- -- -- 0.2 U -- -- --PAH Benzo[b]fluoranthene ug/L -- -- -- -- -- -- -- -- -- 0.1 U -- -- --PAH Benzo[g,h,i]perylene ug/L -- -- -- -- -- -- -- -- -- 0.1 U -- -- --PAH Benzo[k]fluoranthene ug/L -- -- -- -- -- -- -- -- -- 0.1 U -- -- --PAH Chrysene ug/L -- -- -- -- -- -- -- -- -- 0.1 U -- -- --PAH Dibenz(a,h)anthracene ug/L -- -- -- -- -- -- -- -- -- 0.1 U -- -- --PAH Fluoranthene ug/L 640 -- -- -- -- -- -- -- -- 0.1 U -- -- --PAH Fluorene ug/L 640 -- -- -- -- -- -- -- -- 0.1 U -- -- --
5.5 0.085 3.14 8.17 J
0.079 U 0.158 U 0.158 U 0.158 U 0.079 U 0.083 50.4 0.316 U 0.316 U 2,340 2,230 2,240 11,700 3,800 2,980 2,360 24,400 4,760
Suppl Invest Tables MR_rev 20100420.xls Table 3-4 Page 1 of 2


TABLE 3-4 Groundwater Results at Aberdeen Log Yard Property Pontoon Construction Project
Boring Location Sample ID Sample Date
ALY-SB3 ALY-SB3-W
15-Sep-09
ALY-SB12 ALY-SB12A-W
15-Sep-09
ALY-SB12 ALY-SB12-W
15-Sep-09
ALY-13 ALY-13-W 15-Sep-09
ALY-14 ALY-14-W 16-Sep-09
ALY-15 ALY-15-W 16-Sep-09
ALY-16 ALY-16-W 16-Sep-09
ALY-18 ALY-18-W 17-Sep-09
ALY-19 ALY-19-W 18-Sep-09
PW-1-09 PW-1-09-S1
7/16/2009
PW-1-09 PW-1-09-S2
7/16/2009
Chemical SW Marine Group PAH PAH PAH PAH Notes:
Analyte Indeno[1,2,3-cd]pyrene Naphthalene Phenanthrene Pyrene
Units ug/L ug/L ug/L ug/L
MTCA B --
160 --
480
Chronic --------
--------
--------
--------
--------
--------
--------
--------
0.1 U 0.1 U 0.1 U 0.1 U
--------
--------
--------
CONV = total suspended solids, total dissolved solids METAL = Total Metals using EPA 1631 (Mercury); EPA 1638, Modified, ICP-MS, DRC (Arsenic, Cadmium, Chromium, Copper, Silver, Selenium); and EPA 1638, Modified, ICP-MS with dilution (Barium, Iron, Lead and Manganese) METAL_D = Dissolved Metals using EPA 1631 (Mercury); EPA 1638, Modified, ICP-MS, DRC (Arsenic, Cadmium, Chromium, Copper, Silver, Selenium); and EPA 1638, Modified, ICP-MS with dilution (Barium, Iron, Lead and Manganese) TPH-Dx = total petroleum hydrocarbons diesel extended; Method NWTPH-Dx PAH = polycyclic aromatic hydrocarbons, Method 8270C SIM STD
ug/L = micrograms per liter U = The analyte was analyzed for, but not detected. The associated numerical value is at or below the sample-specific method detection limit (MDL). J = Analyte was present but reported value may not be accurate or precise.
MTCA B = Model Toxics Control Act Method B (Unrestricted Landuse) Cleanup Level * MTCA = Model Toxics Control Act Method A Cleanup Level.
= detected results exceeds * MTCA or MTCA B. = detected results exceeds SW Marine Chronic. = detected results exceeds both * MTCA or MTCA B and SW Marine Chronic.
Suppl Invest Tables MR_rev 20100420.xls Table 3-4 Page 2 of 2


TABLE 3-5 July and August 2009 Pumping Well Groundwater Results at Aberdeen Log Yard Property Pontoon Construction Project
Well Location PW-1-09 PW-1-09 PW-1-09 Holding Tank Sample ID PW-1-09-S1 PW-1-09-S2 PW-1-F3 PW-1-Tank Sample Date 16-Jul-09 17-Jul-09 06-Aug-09 06-Aug-09
Chemical SW Marine Group Analyte Units MTCA B Chronic CONV Alkalinity, Total mg/L CaCO3 -- -- 437 441 -- --CONV Alkalinity as Carbonate mg/L CaCO3 -- -- 1 U 1 U -- --CONV Alkalinity as Bicarbonate mg/L CaCO3 -- -- 437 441 -- --CONV Alkalinity as Hydroxide mg/L CaCO3 -- -- 1 U 1 U -- --METAL_D Arsenic, dissolved ug/L 0.058 36 0.7 0.8 -- --METAL_D Barium, dissolved ug/L 3,200 -- 14 11.8 -- --METAL_D Cadmium, dissolved ug/L 8 9.3 0.2 U 0.2 U -- --METAL_D Chromium, dissolved ug/L 50 50 2 U 2 U -- --METAL_D Copper, dissolved ug/L 590 3.1 0.5 U 0.5 U -- --METAL_D Iron, dissolved ug/L -- -- 5,300 5,450 -- --METAL_D Lead, dissolved ug/L 15 8.1 1 U 1 U -- --METAL_D Manganese, dissolved ug/L 2,200 -- 337 318 -- --METAL_D Mercury, dissolved ug/L 4.8 0.025 0.1 U 0.1 U -- --METAL_D Selenium, dissolved ug/L 80 71 2 U 2 -- --METAL_D Silver, dissolved ug/L 80 1.9 0.2 U 0.2 U -- --VOC 1,1,1,2-Tetrachloroethane ug/L 1.7 -- 0.2 U 0.2 U 0.2 U 0.2 U VOC 1,1,1-Trichloroethane ug/L 7,200 -- 0.2 U 0.2 U 0.2 U 0.2 U VOC 1,1,2,2-Tetrachloroethane ug/L 0.22 -- 0.2 U 0.2 U 0.2 U 0.2 U VOC 1,1,2-Trichloro-1,2,2-trifluoroe ug/L 240,000 -- 0.2 U 0.2 U 0.2 U 0.2 U VOC 1,1,2-Trichloroethane ug/L 0.77 -- 0.2 U 0.2 U 0.2 U 0.2 U VOC 1,1-Dchloropropene ug/L -- -- 0.2 U 0.2 U 0.2 U 0.2 U VOC 1,1-Dichloroethane ug/L 1,600 -- 0.2 U 0.2 U 0.2 U 0.2 U VOC 1,1-Dichloroethene ug/L 400 -- 0.2 U 0.2 U 0.2 U 0.2 U VOC 1,2,3-Trichlorobenzene ug/L -- -- 0.5 U 0.5 U 0.5 U 0.5 U VOC 1,2,3-Trichloropropane ug/L 0.0063 -- 0.5 U 0.5 U 0.5 U 0.5 U VOC 1,2,4-Trichloroenzene ug/L 80 -- 0.5 U 0.5 U 0.5 U 0.5 U VOC 1,2,4-Trimethylbenzene ug/L 400 -- 0.2 U 0.2 U 0.2 U 0.2 U VOC 1,2-Dibromo-3-chloropropane ug/L 0.031 -- 0.5 U 0.5 U 0.5 U 0.5 U VOC 1,2-Dichlorobenzene ug/L 720 -- 0.2 U 0.2 U 0.2 U 0.2 U VOC 1,2-Dichloroethane ug/L 0.48 -- 0.2 U 0.2 U 0.2 U 0.2 U VOC 1,2-Dichloropropane ug/L 0.64 -- 0.2 U 0.2 U 0.2 U 0.2 U VOC 1,3,5-Trimethylbenzene ug/L 400 -- 0.2 U 0.2 U 0.2 U 0.2 U VOC 1,3-Dichlorobenzene ug/L -- -- 0.2 U 0.2 U 0.2 U 0.2 U VOC 1,3-dichloropropane ug/L -- -- 0.2 U 0.2 U 0.2 U 0.2 U VOC 1,4-Dichlorobenzene ug/L 1.8 -- 0.2 U 0.2 U 0.2 U 0.2 U VOC 2,2-dichloropropane ug/L -- -- 0.2 U 0.2 U 0.2 U 0.2 U VOC 2-Butanone ug/L 4,800 -- 600 48 5 U 5 U VOC 2-Chloroethylvinylether ug/L -- -- 1 U 1 U 1 U 1 U
Suppl Invest Tables MR_rev 20100420.xls Table 3-5 Page 1 of 3
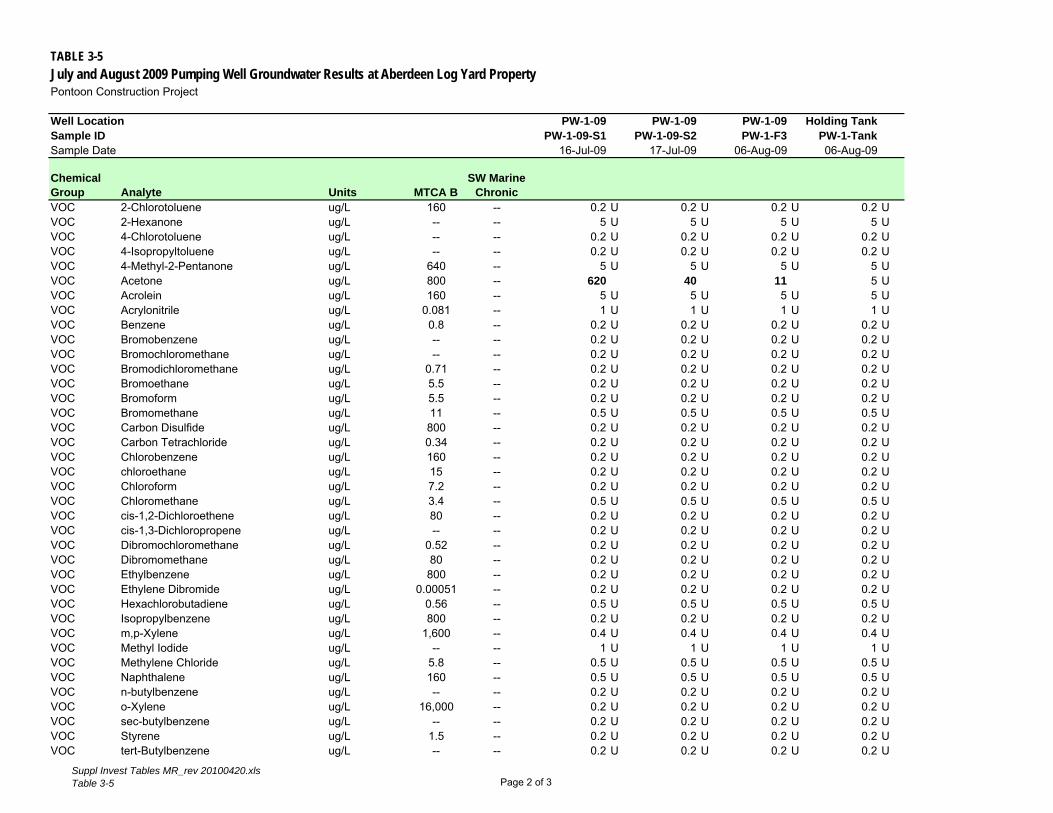
TABLE 3-5 July and August 2009 Pumping Well Groundwater Results at Aberdeen Log Yard Property Pontoon Construction Project
Well Location PW-1-09 PW-1-09 PW-1-09 Holding Tank Sample ID PW-1-09-S1 PW-1-09-S2 PW-1-F3 PW-1-Tank Sample Date 16-Jul-09 17-Jul-09 06-Aug-09 06-Aug-09
Chemical SW Marine Group Analyte Units MTCA B Chronic VOC 2-Chlorotoluene ug/L 160 -- 0.2 U 0.2 U 0.2 U 0.2 U VOC 2-Hexanone ug/L -- -- 5 U 5 U 5 U 5 U VOC 4-Chlorotoluene ug/L -- -- 0.2 U 0.2 U 0.2 U 0.2 U VOC 4-Isopropyltoluene ug/L -- -- 0.2 U 0.2 U 0.2 U 0.2 U VOC 4-Methyl-2-Pentanone ug/L 640 -- 5 U 5 U 5 U 5 U VOC Acetone ug/L 800 -- 620 40 11 5 U VOC Acrolein ug/L 160 -- 5 U 5 U 5 U 5 U VOC Acrylonitrile ug/L 0.081 -- 1 U 1 U 1 U 1 U VOC Benzene ug/L 0.8 -- 0.2 U 0.2 U 0.2 U 0.2 U VOC Bromobenzene ug/L -- -- 0.2 U 0.2 U 0.2 U 0.2 U VOC Bromochloromethane ug/L -- -- 0.2 U 0.2 U 0.2 U 0.2 U VOC Bromodichloromethane ug/L 0.71 -- 0.2 U 0.2 U 0.2 U 0.2 U VOC Bromoethane ug/L 5.5 -- 0.2 U 0.2 U 0.2 U 0.2 U VOC Bromoform ug/L 5.5 -- 0.2 U 0.2 U 0.2 U 0.2 U VOC Bromomethane ug/L 11 -- 0.5 U 0.5 U 0.5 U 0.5 U VOC Carbon Disulfide ug/L 800 -- 0.2 U 0.2 U 0.2 U 0.2 U VOC Carbon Tetrachloride ug/L 0.34 -- 0.2 U 0.2 U 0.2 U 0.2 U VOC Chlorobenzene ug/L 160 -- 0.2 U 0.2 U 0.2 U 0.2 U VOC chloroethane ug/L 15 -- 0.2 U 0.2 U 0.2 U 0.2 U VOC Chloroform ug/L 7.2 -- 0.2 U 0.2 U 0.2 U 0.2 U VOC Chloromethane ug/L 3.4 -- 0.5 U 0.5 U 0.5 U 0.5 U VOC cis-1,2-Dichloroethene ug/L 80 -- 0.2 U 0.2 U 0.2 U 0.2 U VOC cis-1,3-Dichloropropene ug/L -- -- 0.2 U 0.2 U 0.2 U 0.2 U VOC Dibromochloromethane ug/L 0.52 -- 0.2 U 0.2 U 0.2 U 0.2 U VOC Dibromomethane ug/L 80 -- 0.2 U 0.2 U 0.2 U 0.2 U VOC Ethylbenzene ug/L 800 -- 0.2 U 0.2 U 0.2 U 0.2 U VOC Ethylene Dibromide ug/L 0.00051 -- 0.2 U 0.2 U 0.2 U 0.2 U VOC Hexachlorobutadiene ug/L 0.56 -- 0.5 U 0.5 U 0.5 U 0.5 U VOC Isopropylbenzene ug/L 800 -- 0.2 U 0.2 U 0.2 U 0.2 U VOC m,p-Xylene ug/L 1,600 -- 0.4 U 0.4 U 0.4 U 0.4 U VOC Methyl Iodide ug/L -- -- 1 U 1 U 1 U 1 U VOC Methylene Chloride ug/L 5.8 -- 0.5 U 0.5 U 0.5 U 0.5 U VOC Naphthalene ug/L 160 -- 0.5 U 0.5 U 0.5 U 0.5 U VOC n-butylbenzene ug/L -- -- 0.2 U 0.2 U 0.2 U 0.2 U VOC o-Xylene ug/L 16,000 -- 0.2 U 0.2 U 0.2 U 0.2 U VOC sec-butylbenzene ug/L -- -- 0.2 U 0.2 U 0.2 U 0.2 U VOC Styrene ug/L 1.5 -- 0.2 U 0.2 U 0.2 U 0.2 U VOC tert-Butylbenzene ug/L -- -- 0.2 U 0.2 U 0.2 U 0.2 U
Suppl Invest Tables MR_rev 20100420.xls Table 3-5 Page 2 of 3

TABLE 3-5 July and August 2009 Pumping Well Groundwater Results at Aberdeen Log Yard Property Pontoon Construction Project
Well Location Sample ID Sample Date
PW-1-09 PW-1-09-S1
16-Jul-09
PW-1-09 PW-1-09-S2
17-Jul-09
PW-1-09 PW-1-F3
06-Aug-09
Holding Tank PW-1-Tank 06-Aug-09
Chemical SW Marine Group VOC VOC VOC VOC VOC VOC VOC VOC VOC
Analyte Tetrachloroethene Toluene trans-1,2-Dichloroethene trans-1,3-Dichloropropene trans-1,4-Dichloro-2-butene Trichloroethene Trichlorofluoromethane Vinyl Acetate Vinyl Chloride
Units ug/L ug/L ug/L ug/L ug/L ug/L ug/L ug/L ug/L
MTCA B 0.081 640 160 ----
0.49 2,400 8,000 0.029
Chronic ------------------
0.2 U 0.2 0.2 U 0.2 U
1 U 0.2 U 0.2 U
1 U 0.2 U
0.2 U 0.2 U 0.2 U 0.2 U
1 U 0.2 U 0.2 U
1 U 0.2 U
0.2 U 0.2 U 0.2 U 0.2 U
1 U 0.2 U 0.2 U
1 U 0.2 U
0.2 U 0.2 U 0.2 U 0.2 U
1 U 0.2 U 0.2 U
1 U 0.2 U
Notes: METAL_D = Dissolved Metals: Iron and Magnesium by EPA Method 6010B; Arsenic, Barium, Cadmium, Calcium, Chromium, Copper, Lead, Manganese, Selenium, and Silver by EPA Method 200.8; and Mercury by EPA Method 7470A.CONV = alkalinity, carbonate, bicarbonate, and hydroxide by Method SM2320VOC = volatile organic compounds, by Purge & Trap GC/MS Method SW 8260C
ug/L = micrograms per liter
U = The analyte was analyzed for, but not detected. The associated numerical value is at or below the sample-specific method detection limit (MDL).BOLDED results = detected at or above laboratory reporting limits
Suppl Invest Tables MR_rev 20100420.xls Table 3-5 Page 3 of 3


APPENDIX A
Quality Assurance/Quality Control Review of Laboratory Data
Aberdeen Log Yard and Anderson & MiddletonProperties Soil Sampling Quality Assurance/ Quality Control Review of Laboratory Data
Introduction The objective of this data quality evaluation (DQE) report is to assess the data quality of analytical results for soil samples collected at Aberdeen Log Yard and Anderson & Middleton Properties. The basis for this assessment includes individual method requirements and guidelines from the United States Environmental Protection Agency (USEPA) Contract Laboratory National Functional Guidelines for Organic Data Review (USEPA, 1999).
Analytical Data This DQE covers 10 normal samples and two field duplicates (FD). Samples were collected September 15 through September 17, 2009. A list of samples included in this DQE is included at the end of this report. These sample results were reported as three sample delivery groups listed in Table 1. The analyses were performed by TestAmerica Analytical Testing Corporation in Tacoma, Washington, (TAMT) and TestAmerica Analytical Testing Corporation in Portland, Oregon (TAMP).
Table 1 – Sample Delivery Groups
Sample Delivery Group Laboratory
580-15517 T AMT, TAMP
580-15519 T AMT, TAMP
580-15521 T AMT, TAMP
Three methods were used to analyze the environmental samples. Samples were collected and hand delivered to TAMT for analysis. TAMT was responsible for shipment of samples to TAMP. Selected samples were analyzed for one or more of the following parameters/methods:
A-1

APPENDIX A. ABERDEEN LOG YARD AND ANDERSON & MIDDLETON PROPERTIES SOIL SAMPLING QUALITY ASSURANCE/ QUALITY CONTROL REVIEW OF LABORATORY DATA
Table 2 – Analytical Parameters
Parameter Method Laboratory
Volatile Organic Compounds SW8260B TAMT
Polynuclear Aromatic Hydrocarbons SW8270C-Selected Ion Monitoring (SIM)
TAMT
Diesel and Heavy Range Hydrocarbons NWTPH-Dx TAMP
The assessment of data includes a review of: (1) the chain-of-custody documentation; (2) holding-time compliance; (3) the required field and laboratory quality control (QC) samples; (4) flagging for method blanks; (5) laboratory control sample/laboratory control sample duplicate (LCS/LCSD) recoveries and precision; (6) surrogate spike recoveries; and (7) matrix spike/matrix spike duplicate (MS/MSD) recoveries and precision.
Data flags are assigned according to the National Functional Guidelines. Multiple flags are routinely applied to specific sample method/matrix/analyte combinations, but there will be only one final flag. A final flag is applied to the data and is the most conservative of the applied validation flags. The final flag also includes matrix and blank sample impacts.
The data flags are defined below:
• J = Analyte was present but reported value may not be accurate or precise.
• R = The result was rejected.
• U = Analyte was analyzed for but not detected at the specified detection limit.
• UJ = Analyte was not detected above the detection limit objective. However, the reported detection limit is approximate and may or may not represent the actual limit of quantitation necessary to accurately and precisely measure the analyte in the sample
Findings The overall summaries of the data validation findings are contained in the following sections below and summarized in Table 3.
Holding Times All holding-time criteria were met.
Calibration Calibration information was not supplied in the Level II reports.
Method Blanks Method blanks were analyzed at the required frequency and were free of contamination.
SEA/APP A_ABERDEENLY_ANDERSON_DQE_REV2.DOC A-2
APPENDIX A. ABERDEEN LOG YARD AND ANDERSON & MIDDLETON PROPERTIES SOIL SAMPLING QUALITY ASSURANCE/ QUALITY CONTROL REVIEW OF LABORATORY DATA
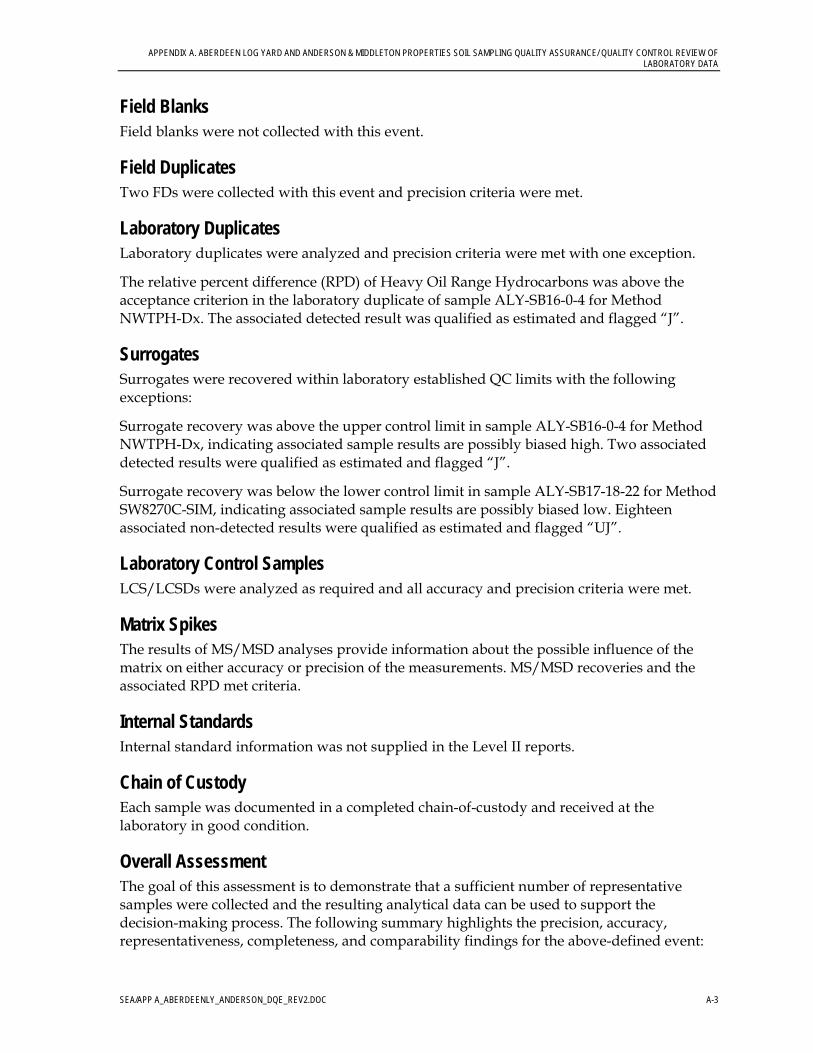
Field Blanks Field blanks were not collected with this event.
Field Duplicates Two FDs were collected with this event and precision criteria were met.
Laboratory Duplicates Laboratory duplicates were analyzed and precision criteria were met with one exception.
The relative percent difference (RPD) of Heavy Oil Range Hydrocarbons was above the acceptance criterion in the laboratory duplicate of sample ALY-SB16-0-4 for Method NWTPH-Dx. The associated detected result was qualified as estimated and flagged “J”.
Surrogates Surrogates were recovered within laboratory established QC limits with the following exceptions:
Surrogate recovery was above the upper control limit in sample ALY-SB16-0-4 for Method NWTPH-Dx, indicating associated sample results are possibly biased high. Two associated detected results were qualified as estimated and flagged “J”.
Surrogate recovery was below the lower control limit in sample ALY-SB17-18-22 for Method SW8270C-SIM, indicating associated sample results are possibly biased low. Eighteen associated non-detected results were qualified as estimated and flagged “UJ”.
Laboratory Control Samples LCS/LCSDs were analyzed as required and all accuracy and precision criteria were met.
Matrix Spikes The results of MS/MSD analyses provide information about the possible influence of the matrix on either accuracy or precision of the measurements. MS/MSD recoveries and the associated RPD met criteria.
Internal Standards Internal standard information was not supplied in the Level II reports.
Chain of Custody Each sample was documented in a completed chain-of-custody and received at the laboratory in good condition.
Overall Assessment The goal of this assessment is to demonstrate that a sufficient number of representative samples were collected and the resulting analytical data can be used to support the decision-making process. The following summary highlights the precision, accuracy, representativeness, completeness, and comparability findings for the above-defined event:
SEA/APP A_ABERDEENLY_ANDERSON_DQE_REV2.DOC A-3

APPENDIX A. ABERDEEN LOG YARD AND ANDERSON & MIDDLETON PROPERTIES SOIL SAMPLING QUALITY ASSURANCE/ QUALITY CONTROL REVIEW OF LABORATORY DATA
1. No data were rejected and completeness is 100 percent.
2. A laboratory duplicate RPD exceedance was observed for Method NWTPH-Dx; one result was qualified as estimated.
3. Surrogate recovery exceedances were observed for methods NWTPH-Dx and SW8270C-SIM; 20 results were qualified as estimated.
4. Although data were qualified as estimated due to QC exceedances as noted, overall precision and accuracy of the data, as measured by field and laboratory QC indicators suggest that data are usable for project objectives.
References U.S. Environmental Protection Agency (U.S. EPA). 1999. Contract Laboratory Program National Functional Guidelines for Organic Data Review, Final. EPA-540/R-99-008. October.
SEA/APP A_ABERDEENLY_ANDERSON_DQE_REV2.DOC A-4
APPENDIX A. ABERDEEN LOG YARD AND ANDERSON & MIDDLETON PROPERTIES SOIL SAMPLING QUALITY ASSURANCE/ QUALITY CONTROL REVIEW OF LABORATORY DATA
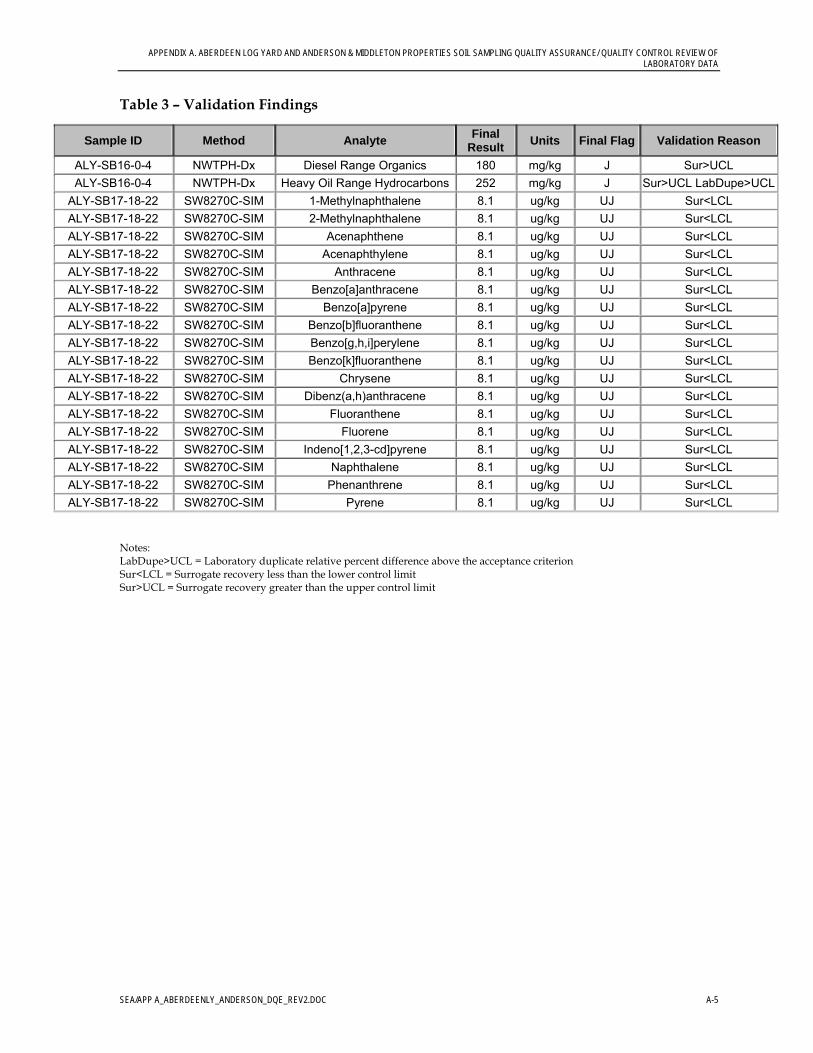
Table 3 – Validation Findings
Sample ID Method Analyte Final Result Units Final Flag Validation Reason
ALY-SB16-0-4 NWTPH-Dx Diesel Range Organics 180 mg/kg J Sur>UCL ALY-SB16-0-4 NWTPH-Dx Heavy Oil Range Hydrocarbons 252 mg/kg J Sur>UCL LabDupe>UCL
ALY-SB17-18-22 SW8270C-SIM 1-Methylnaphthalene 8.1 ug/kg UJ Sur<LCL ALY-SB17-18-22 SW8270C-SIM 2-Methylnaphthalene 8.1 ug/kg UJ Sur<LCL ALY-SB17-18-22 SW8270C-SIM Acenaphthene 8.1 ug/kg UJ Sur<LCL ALY-SB17-18-22 SW8270C-SIM Acenaphthylene 8.1 ug/kg UJ Sur<LCL ALY-SB17-18-22 SW8270C-SIM Anthracene 8.1 ug/kg UJ Sur<LCL ALY-SB17-18-22 SW8270C-SIM Benzo[a]anthracene 8.1 ug/kg UJ Sur<LCL ALY-SB17-18-22 SW8270C-SIM Benzo[a]pyrene 8.1 ug/kg UJ Sur<LCL ALY-SB17-18-22 SW8270C-SIM Benzo[b]fluoranthene 8.1 ug/kg UJ Sur<LCL ALY-SB17-18-22 SW8270C-SIM Benzo[g,h,i]perylene 8.1 ug/kg UJ Sur<LCL ALY-SB17-18-22 SW8270C-SIM Benzo[k]fluoranthene 8.1 ug/kg UJ Sur<LCL ALY-SB17-18-22 SW8270C-SIM Chrysene 8.1 ug/kg UJ Sur<LCL ALY-SB17-18-22 SW8270C-SIM Dibenz(a,h)anthracene 8.1 ug/kg UJ Sur<LCL ALY-SB17-18-22 SW8270C-SIM Fluoranthene 8.1 ug/kg UJ Sur<LCL ALY-SB17-18-22 SW8270C-SIM Fluorene 8.1 ug/kg UJ Sur<LCL ALY-SB17-18-22 SW8270C-SIM Indeno[1,2,3-cd]pyrene 8.1 ug/kg UJ Sur<LCL ALY-SB17-18-22 SW8270C-SIM Naphthalene 8.1 ug/kg UJ Sur<LCL ALY-SB17-18-22 SW8270C-SIM Phenanthrene 8.1 ug/kg UJ Sur<LCL ALY-SB17-18-22 SW8270C-SIM Pyrene 8.1 ug/kg UJ Sur<LCL
Notes: LabDupe>UCL = Laboratory duplicate relative percent difference above the acceptance criterion Sur<LCL = Surrogate recovery less than the lower control limit Sur>UCL = Surrogate recovery greater than the upper control limit
SEA/APP A_ABERDEENLY_ANDERSON_DQE_REV2.DOC A-5

APPENDIX A. ABERDEEN LOG YARD AND ANDERSON & MIDDLETON PROPERTIES SOIL SAMPLING QUALITY ASSURANCE/ QUALITY CONTROL REVIEW OF LABORATORY DATA
Samples Associated with DQE Field ID Sample Date Sample Type
ALY-14TP-4-8 09/17/2009 N ALY-SB13-0-4 09/15/2009 N ALY-SB13-4-8 09/15/2009 N ALY-SB14-0-4 09/15/2009 N ALY-SB14-4-8 09/15/2009 N ALY-SB-15-0-4 09/15/2009 N ALY-SB-15-4-8 09/15/2009 N ALY-SB16-0-4 09/15/2009 N
ALY-SB16A-0-4 09/15/2009 FD ALY-SB-16-4-8 09/15/2009 N
ALY-SB-16A-4-8 09/15/2009 FD ALY-SB17-18-22 09/16/2009 N
SEA/APP A_ABERDEENLY_ANDERSON_DQE_REV2.DOC A-6

Aberdeen Log Yard and Anderson & MiddletonProperties Groundwater Monitoring Quality Assurance/Quality Control Review of Laboratory Data
Introduction The objective of this data quality evaluation (DQE) report is to assess the data quality of analytical results for groundwater samples collected for the Groundwater Monitoring at Aberdeen Log Yard and Anderson & Middleton Properties. The basis for this assessment includes: individual method requirements, guidelines from the United States Environmental Protection Agency (USEPA) Contract Laboratory National Functional Guidelines for Organic Data Review (USEPA, 1999) and the USEPA Contract Laboratory National Functional Guidelines for Inorganic Data Review (USEPA, 2002).
Analytical Data This DQE covers 15 normal samples and one field duplicate (FD) water sample. Samples were collected September 15 through September 18, 2009. A list of samples included in this DQE is included at the end of this report. These sample results were reported as five sample delivery groups listed in Table 1. The analyses were performed by TestAmerica Analytical Testing Corporation in Tacoma, Washington, (TAMT), TestAmerica Analytical Testing Corporation in Portland, Oregon (TAMP) and Brooks Rand Labs in Seattle, Washington (BRAND).
Table 1 – Sample Delivery Groups
Sample Delivery Group Laboratory
0938030 BRAND
580-15517 T AMT, TAMP
580-15519 T AMT, TAMP
580-15521 T AMT, TAMP
580-15569 T AMT, TAMP
Six methods were used to analyze the environmental samples. Samples were collected and shipped by overnight carrier to TAMT and BRAND for analysis. TAMT was responsible for shipment of samples to TAMP. Selected samples were analyzed for one or more of the following parameters/methods:
SEA/APP A_ABERDEENLY_ANDERSON_DQE_REV2.DOC A-7

APPENDIX A. QUALITY ASSURANCE/QUALITY CONTROL REVIEW OF LABORATORY DATA
Table 2 – Analytical Parameters
Parameter Method Laboratory
Polynuclear Aromatic Hydrocarbons SW8270C-Selected Ion Monitoring
TAMT
Diesel and Heavy Range Hydrocarbons NWTPH-Dx TAMP
Total and Dissolved Metals (As, Ba, Cd, Cr, Cu, Fe, Pb, Mn, Se, Ag)
EPA 1638 BRAND
Total and Dissolved Mercury EPA 1631 BRAND
Total Dissolved Solids EPA 160.1 TAMT
Total Suspended Solids EPA 160.2 TAMT
The assessment of data includes a review of: (1) the chain-of-custody documentation; (2) holding-time compliance; (3) the required field and laboratory quality control (QC) samples; (4) flagging for method blanks; (5) laboratory control sample/laboratory control sample duplicate (LCS/LCSD) recoveries and precision; (6) surrogate spike recoveries; and (7) matrix spike/matrix spike duplicate (MS/MSD) recoveries and precision.
Data flags are assigned according to the National Functional Guidelines. Multiple flags are routinely applied to specific sample method/matrix/analyte combinations, but there will be only one final flag. A final flag is applied to the data and is the most conservative of the applied validation flags. The final flag also includes matrix and blank sample impacts.
The data flags are defined below:
• J = Analyte was present but reported value may not be accurate or precise.
• R = The result was rejected.
• U = Analyte was analyzed for but not detected at the specified detection limit.
• UJ = Analyte was not detected above the detection limit objective. However, the reported detection limit is approximate and may or may not represent the actual limit of quantitation necessary to accurately and precisely measure the analyte in the sample
Findings The overall summaries of the data validation findings are contained in the following sections below and summarized in Table 3.
Holding Times All holding-time criteria were met.
Calibration Calibration information was not supplied in the Level II reports.
SEA/APP A_ABERDEENLY_ANDERSON_DQE_REV2.DOC A-8

APPENDIX A QUALITY ASSURANCE/QUALITY CONTROL REVIEW OF LABORATORY DATA
Method Blanks Method blanks were analyzed at the required frequency and were free of contamination.
Field Blanks Field blanks were not collected with this event.
Field Duplicates A FD was collected with this event and precision criteria were met.
Laboratory Duplicates Laboratory duplicates were analyzed and precision criteria were met.
Surrogates Surrogates were recovered within laboratory established QC limits.
Laboratory Control Samples LCS/LCSDs were analyzed as required and all accuracy and precision criteria were met with the following exceptions:
The recovery of iron was below the lower control limit in a LCS for method EPA 1638, indicating associated sample results are possibly biased low. Thirty-two associated detected results were qualified as estimated and flagged “J”.
Matrix Spikes The results of MS/MSD analyses provide information about the possible influence of the matrix on either accuracy or precision of the measurements. MS/MSD recoveries and the associated RPD met criteria.
Internal Standards Internal standard information was not supplied in the Level II reports.
Total and Dissolved Metals The total copper result was less than the dissolved copper result in sample ALY-18-W and the relative percent difference was above the acceptance criterion. The laboratory noted that the dissolved copper result was possibly contaminated during analysis. The associated detected total and dissolved results were qualified as estimated and flagged “J”.
Sample Quantitation The calcium to iron ration was above the laboratory control criterion in tow samples for method EPA 1638, indicating associated detected iron results are possibly biased low due to high calcium concentrations. Two detected results were qualified as estimated and flagged “J”.
SEA/APP A_ABERDEENLY_ANDERSON_DQE_REV2.DOC A-9
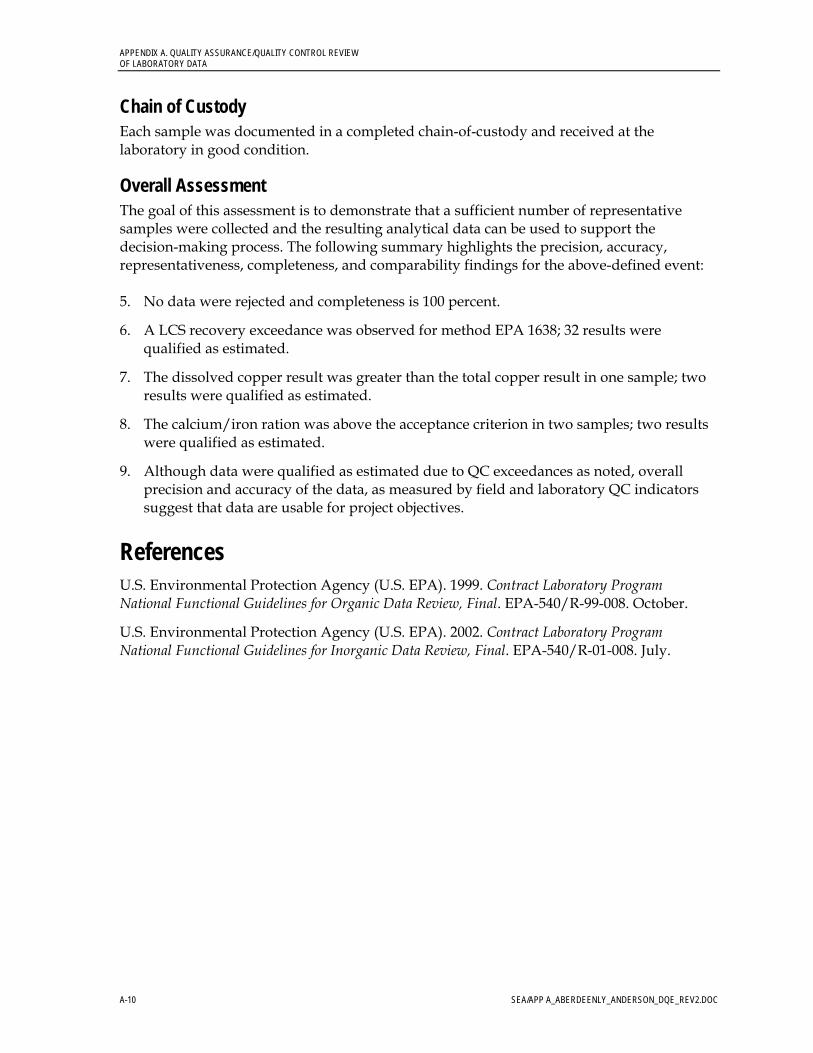
APPENDIX A. QUALITY ASSURANCE/QUALITY CONTROL REVIEW OF LABORATORY DATA
Chain of Custody Each sample was documented in a completed chain-of-custody and received at the laboratory in good condition.
Overall Assessment The goal of this assessment is to demonstrate that a sufficient number of representative samples were collected and the resulting analytical data can be used to support the decision-making process. The following summary highlights the precision, accuracy, representativeness, completeness, and comparability findings for the above-defined event:
5. No data were rejected and completeness is 100 percent.
6. A LCS recovery exceedance was observed for method EPA 1638; 32 results were qualified as estimated.
7. The dissolved copper result was greater than the total copper result in one sample; two results were qualified as estimated.
8. The calcium/iron ration was above the acceptance criterion in two samples; two results were qualified as estimated.
9. Although data were qualified as estimated due to QC exceedances as noted, overall precision and accuracy of the data, as measured by field and laboratory QC indicators suggest that data are usable for project objectives.
References U.S. Environmental Protection Agency (U.S. EPA). 1999. Contract Laboratory Program National Functional Guidelines for Organic Data Review, Final. EPA-540/R-99-008. October.
U.S. Environmental Protection Agency (U.S. EPA). 2002. Contract Laboratory Program National Functional Guidelines for Inorganic Data Review, Final. EPA-540/R-01-008. July.
SEA/APP A_ABERDEENLY_ANDERSON_DQE_REV2.DOC A-10
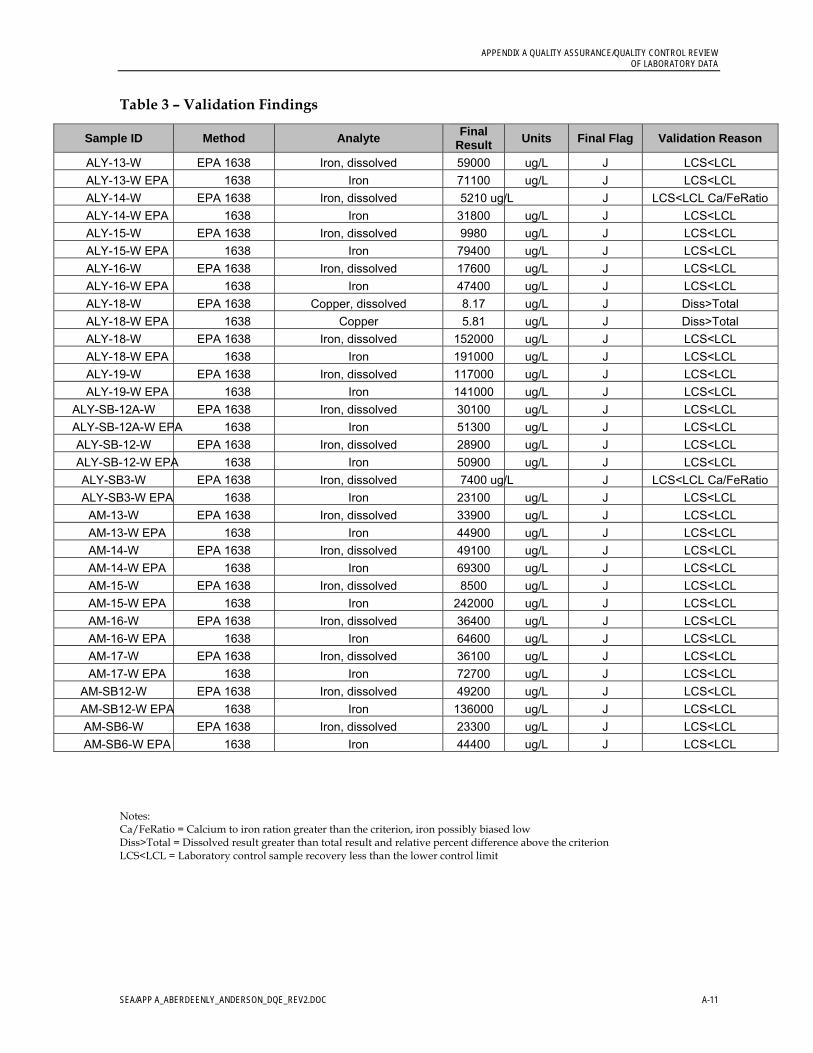
APPENDIX A QUALITY ASSURANCE/QUALITY CONTROL REVIEW OF LABORATORY DATA
Table 3 – Validation Findings
Sample ID Method Analyte Final Result Units Final Flag Validation Reason
ALY-13-W EPA 1638 Iron, dissolved 59000 ug/L J LCS<LCL ALY-13-W EPA 1638 Iron 71100 ug/L J LCS<LCL ALY-14-W EPA 1638 Iron, dissolved 5210 ug/L J LCS<LCL Ca/FeRatio ALY-14-W EPA 1638 Iron 31800 ug/L J LCS<LCL ALY-15-W EPA 1638 Iron, dissolved 9980 ug/L J LCS<LCL ALY-15-W EPA 1638 Iron 79400 ug/L J LCS<LCL ALY-16-W EPA 1638 Iron, dissolved 17600 ug/L J LCS<LCL ALY-16-W EPA 1638 Iron 47400 ug/L J LCS<LCL ALY-18-W EPA 1638 Copper, dissolved 8.17 ug/L J Diss>Total ALY-18-W EPA 1638 Copper 5.81 ug/L J Diss>Total ALY-18-W EPA 1638 Iron, dissolved 152000 ug/L J LCS<LCL ALY-18-W EPA 1638 Iron 191000 ug/L J LCS<LCL ALY-19-W EPA 1638 Iron, dissolved 117000 ug/L J LCS<LCL ALY-19-W EPA 1638 Iron 141000 ug/L J LCS<LCL
ALY-SB-12A-W EPA 1638 Iron, dissolved 30100 ug/L J LCS<LCL ALY-SB-12A-W EPA 1638 Iron 51300 ug/L J LCS<LCL ALY-SB-12-W EPA 1638 Iron, dissolved 28900 ug/L J LCS<LCL ALY-SB-12-W EPA 1638 Iron 50900 ug/L J LCS<LCL ALY-SB3-W EPA 1638 Iron, dissolved 7400 ug/L J LCS<LCL Ca/FeRatio ALY-SB3-W EPA 1638 Iron 23100 ug/L J LCS<LCL
AM-13-W EPA 1638 Iron, dissolved 33900 ug/L J LCS<LCL AM-13-W EPA 1638 Iron 44900 ug/L J LCS<LCL AM-14-W EPA 1638 Iron, dissolved 49100 ug/L J LCS<LCL AM-14-W EPA 1638 Iron 69300 ug/L J LCS<LCL AM-15-W EPA 1638 Iron, dissolved 8500 ug/L J LCS<LCL AM-15-W EPA 1638 Iron 242000 ug/L J LCS<LCL AM-16-W EPA 1638 Iron, dissolved 36400 ug/L J LCS<LCL AM-16-W EPA 1638 Iron 64600 ug/L J LCS<LCL AM-17-W EPA 1638 Iron, dissolved 36100 ug/L J LCS<LCL AM-17-W EPA 1638 Iron 72700 ug/L J LCS<LCL
AM-SB12-W EPA 1638 Iron, dissolved 49200 ug/L J LCS<LCL AM-SB12-W EPA 1638 Iron 136000 ug/L J LCS<LCL AM-SB6-W EPA 1638 Iron, dissolved 23300 ug/L J LCS<LCL AM-SB6-W EPA 1638 Iron 44400 ug/L J LCS<LCL
Notes: Ca/FeRatio = Calcium to iron ration greater than the criterion, iron possibly biased low Diss>Total = Dissolved result greater than total result and relative percent difference above the criterion LCS<LCL = Laboratory control sample recovery less than the lower control limit
SEA/APP A_ABERDEENLY_ANDERSON_DQE_REV2.DOC A-11

APPENDIX A. QUALITY ASSURANCE/QUALITY CONTROL REVIEW OF LABORATORY DATA
Samples Associated with DQE Field ID Sample Date Sample Type
ALY-13-W 09/15/2009 N ALY-14-W 09/16/2009 N ALY-15-W 09/16/2009 N ALY-16-W 09/16/2009 N ALY-18-W 09/17/2009 N ALY-19-W 09/18/2009 N
ALY-SB-12A-W 09/16/2009 FD ALY-SB-12-W 09/16/2009 N ALY-SB3-W 09/15/2009 N
AM-13-W 09/17/2009 N AM-14-W 09/17/2009 N AM-15-W 09/18/2009 N AM-16-W 09/17/2009 N AM-17-W 09/18/2009 N
AM-IDW-W 09/18/2009 N AM-SB12-W 09/17/2009 N AM-SB6-W 09/17/2009 N
SEA/APP A_ABERDEENLY_ANDERSON_DQE_REV2.DOC A-12


![aLy [&] fRaN](https://img.dokumen.tips/doc/110x75/55a30da51a28abf1308b456a/aly-fran.jpg)