Embed Size (px)
Citation preview

Molecular Cell, Volume 51
Supplemental Information
The Proto-oncometabolite Fumarate Binds Glutathione
to Amplify ROS-Dependent Signaling Lucas B. Sullivan, Eva Garcia-Martinez, Hien Nguyen, Andrew R. Mullen, Eric Dufour, Sunil Sudarshan, Jonathan D. Licht, Ralph J. Deberardinis, and Navdeep S. Chandel

Figure S1. Related to Figure 1 (A) Enzymatic FH activity from mitochondrial fractions of HEK293 and 786-O cells. (B) Relative hypoxic response element (HRE) luciferase expression measured in cv and FH-FLAG UOK262 cells. Relative intracellular ROS levels for cv and FH-FLAG UOK262 cells as measured by DCFH fluorescence (C) and amplex red fluorescence (D). (E) Western blot for HIF1α, FH, and tubulin protein in HEK293 cells expressing NS and FH shRNAs. (F) Relative intracellular ROS level as determined by DCFH fluorescence for HEK293 cells expressing NS and FH shRNAs. (G) Western blot for HIF1α, FH, and tubulin protein in HEK293 cells expressing NS and FH shRNAs treated with 1 μM TPP control or 1 μM of the mitochondrial antioxidants MCP or MVE. (H) Relative HRE luciferase expression measured in UOK262 cells treated with mock treatment, 1 μM TPP, or 1 μM MVE. In (A-D, F, H) values denote mean s.e.m. n = 3. *P < 0.05; **P < 0.01.

Figure S2. Related to Figure 2 (A) GC/MS quantitation of fumarate concentration in UOK262 cells expressing NS, OGDH, and SDHA shRNAs. (B) GC/MS quantitation of succinate concentration in UOK262 cells expressing NS, OGDH, and SDHA shRNAs. (C) Western blot for HIF1α and tubulin protein from UOK262 cells treated with mock treatment or 500 μM NPA for 4 hours. (D) The proliferative effects of treatment with mock treatment and 500 μM NPA were measured by plating cells at 1E5 cells per plate in media containing the treatment and counting cells after 48 hours and 96 hours. In (A and B) the values denote mean s.e.m. n = 3. In (D) the values denote mean +/- s.e.m. n=3. *P < 0.05; **P < 0.01.
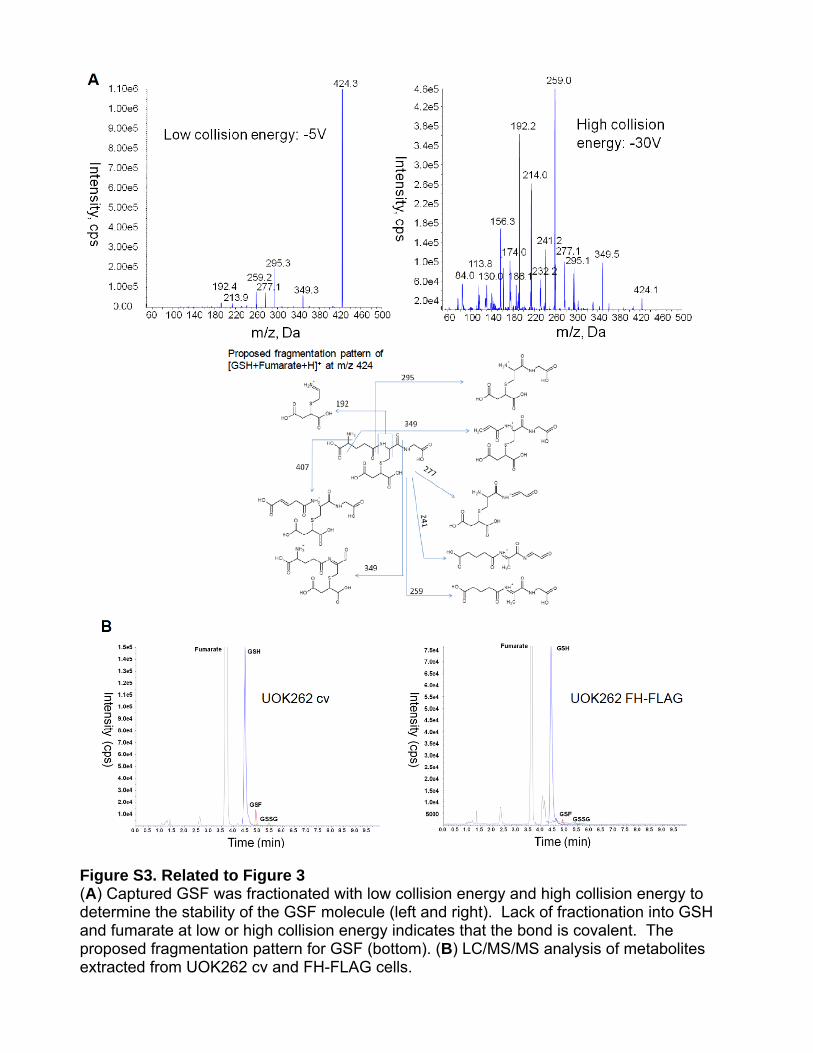
Figure S3. Related to Figure 3 (A) Captured GSF was fractionated with low collision energy and high collision energy to determine the stability of the GSF molecule (left and right). Lack of fractionation into GSH and fumarate at low or high collision energy indicates that the bond is covalent. The proposed fragmentation pattern for GSF (bottom). (B) LC/MS/MS analysis of metabolites extracted from UOK262 cv and FH-FLAG cells.

Figure S4. Related to Figure 4 (A) LC/MS/MS analysis of a solution of DMF and GSH after 1 hour demonstrates formation of GSF. (B) Control experiment monitoring NADPH concentration upon addition of mock treatment, GSH, DMF, GSF or mock no NADPH in the absence of GR. (C) GR assay

experiment monitoring NADPH concentration upon treatment of mock treatment, GSH, DMF, GSF, or mock treatment no NADPH in the presence of GR. (D) Proposed reactions of GR with GSSG and GSF. (E) Dose curve analysis for NADPH consumption by GR in various concentrations of GSF. Km and Vmax were determined from initial reaction velocities. (F) Dose curve analysis for NADPH consumption by GR in various concentrations of GSSG. Km and Vmax were determined from initial reaction velocities.

Figure S5. Related to Figure 5 (A) Western blot for NRF2 and tubulin protein and RT-PCR of NRF2 target genes from FH-FLAG UOK262 cells pretreated with mock treatment or 1 μM TPP or MVE and treated with mock treatment or 100 μM DMF. (B) Relative intracellular ROS level was determined by DCFH fluorescence for FH-FLAG UOK262 cells treated with mock treatment or 100 μM DMF. (C) Western blot for HIF1α and tubulin protein from FH-FLAG UOK262 cells pretreated with mock treatment, 1 μM TPP, or 1 μM MVE and treated with mock treatment,

100 μM DMF, or 100 μM DFO. (D) Western blot for HIF1α and tubulin protein from FH-FLAG UOK262 cells treated with mock treatment, 100 μM DMF, or 0.1 - 5.0 mM dimethylsuccinate (DMS). (E) Proposed model by which fumarate regulates NRF2 stabilization independent of ROS whereas ROS are required for fumarate induced HIF1α. In (A and B) the values denote mean s.e.m. n = 3 (A and B). *P < 0.05; **P < 0.01.
Figure S6. Related to Figure 6 Histone methyltransferases (HMTs) transfer methyl groups onto histones while Jumonji histone demethylases (JHDMs) demethylate them. Both fumarate and H2O2 can inhibit JHDM activity potentially leading to histone hypermethylation.

Figure S7. Related to Figure 7 (A) Table describing the cell line labels and their associated plasmids. (B) Mitochondrial OCR for saponin permeabilized UOK262 cell lines when treated with 10 mM glutamate and 5 mM malate. Cells were pretreated with 4 μM FCCP to obtain maximal OCRs. (C) Mitochondrial OCR for saponin permeabilized UOK262 cell lines when treated with 80 μM palmitoyl-carnitine (palm-carn) and 0.5 mM malate. Cells were pretreated with 4 μM FCCP to obtain maximal OCRs. (D) Measurement of mitochondrial ROS as determined by mitoSOX fluorescence. (E) Densitometric quantification of histone methylation markers relative to H4 loading control in UOK262 cell lines. Values denote mean s.e.m. n = 3 (D, E), n = 5 (B, C). *P < 0.05; **P < 0.01.

Supplemental Experimental Procedures Subcellular fractionation. 90% confluent plates were scraped into mitochondria isolation buffer containing 10 mM Tris-MOPS, 1.0 mM EGTA/Tris, 0.2 M Sucrose, pH 7.4. Cells were homogenized by 10 strokes in a dounce homogenizer and 6 explusions through a 27 gauge needle. Homogenates were centrifuged at 500 x g for 10 min to pellet nuclei and whole cells. The supernatant was removed and centrifuged at 18,000 x g separating the cytosolic fraction to the supernatant and mitochondrial fraction to the pellet.
Proliferation Assays. To measure proliferation rate cells were counted by Vi-Cell (Beckman Coulter) and 1x 10⁵ viable cells were plated onto 6 cm dishes. Cells were counted 48 and 96 hours post plating by Vi-cell. The percentage of viable cells was determined by trypan blue exclusion.
RT-PCR Analysis. Trizol (Invitrogen) was used to extract RNA according to manufacturer’s instructions. MMLV reverse transcriptase (Applied Biosystems) was used to convert 2 μg of RNA to cDNA. RT-PCR primers were designed using Beacon Designer 3.01 software (Premier Biosoft International). Sample cDNA was amplified using the Bio-Rad iCycler iQ system (Bio-Rad) and SYBR Green PCR Master Mix (Applied Biosystem). Cycle threshold (Ct) values were normalized by comparing to the mitochondrial ribosomal protein gene L19. Relative mRNA was calculated by the ΔCt method.
HRE Luciferase Assays. HRE luciferase plasmid and TK-Renilla control plasmid were cotransfected into cells using Mirus TransIT-LT1 transfection reagent (Mirus). After 24 hours luciferase values were collected and normalized to control TK-Renilla luciferase luminescence using Dual-Luciferase Reporter System (Promega).
Measurement of oxygen consumption. Oxygen consumption rates (OCRs) were determined on a Seahorse Bioscience Extracellular Flux Analyzer (XF24). Cells were plated in Seahorse 24 well plates at 7 x 10⁴ cells per well and allowed to incubate overnight. Mitochondrial OCR was determined as basal OCR minus OCR after treatment with rotenone (1 μM) and antimycin (1 μM). To determine complex I and complex II substrate contributions to OCR, cells changed to mitochondria assay buffer (70 mM sucrose, 220 mM mannitol, 10 mM KH2PO4, 5 mM MgCl2, 2 mM HEPES, 1.0 mM EGTA and 0.2% (w/v) fatty acid-free BSA, pH 7.2) supplemented with 4 μM FCCP and permeabilized by injecting saponin to 100 μg/ml, mixing, and monitoring until OCR dropped due to diffusion of intracellular substrates, and stabilized. Assay media was then injected with pyruvate/malate, glutamate/malate, palmitoyl-carnitine/malate, or succinate and induction of OCR was measured. In the case of measuring complex I activity, rotenone was added separately to determine rotenone sensitive vs. rotenone insensitive fraction of induced OCR.
Quantification of succinated GSH. Stock solution was prepared in water or methanol/water (50/50) at the concentration of 10 mM. Different standard solutions, ranging from 100 nM to 100 µM, were obtained from diluted stock solutions to construct calibration curves. The concentration of each analyte in cell extract samples was calculated, based on its corresponding calibration curve. Since the standard of product (decarboxyethyl glutathione, GSF) from GSH-Fumarate reaction is not commercially available, the concentration of GSF was calculated using GSH calibration curve. All results were finally normalized to the protein content, which was measured using BCA protein assay (Thermo Fisher Scientific Inc.).