Embed Size (px)
Citation preview
Supplemental Information
1) Paper title:
Corporate Environmental Performance and Political Activity
2) Filename:
Delmas-nairn-Birch-Lobbying-ARCS-2013
3) Author(s) name and affiliation:
Magali Delmas
Institute of the Environment and Sustainability and
Anderson School of Management
UCLA
Nicholas Nairn-Birch
Institute of the Environment and Sustainability
UCLA
4) Presenter name:
Magali Delmas
5) Primary contact name and e-mail (One person only):
Magali Delmas
6) Topic (10 words or less):
Corporate Environmental Performance and Political Activity
7) Preferences: Please indicate your preferences for presentation format by marking all of the formats for
which you are interested in being considered. If you mark more than one option, the Conference
Committee will match you with the format deemed best suited for your work.
Faculty and doctoral students:
X Please consider my paper for a presentation slot.
_ Please consider my paper for a Research Sketch (egg-timer session).
Additional options for doctoral students only:
_ Please consider my paper for the poster session.
_ Please consider my paper for a research roundtable on Research Questions and Hypotheses.
_ Please consider my paper for a research roundtable on Research Methods.
8) Topic (please check those that apply):
_ Accounting
_ Certification Programs
_ Creation and Development of Environmental Markets
_ Economics
_ Environmental Finance
_ Innovation and Entrepreneurship
_ Law and Ethics
X Management/Strategy: economics oriented
_ Management/Strategy: OB/OT/organizations oriented

_ Marketing
_ Operations/Supply Chain
X Public Policy
_ Real Estate
_ Sustainable Resource Management
_ Other (please specify)
9) Method (please check those that apply):
_ Analytical Model
_ De/Inductive Theory Building
_ Empirical: qualitative
X Empirical: quantitative
_ Non-Empirical: qualitative
_ Non-Empirical/Conceptual: qualitative
_ Other (please specify)
Corporate Environmental Performance and Political Activity
Magali Delmas* Institute of the Environment and Sustainability and
Anderson School of Management UCLA
Nicholas Nairn-Birch Institute of the Environment and Sustainability
UCLA
ABSTRACT
In 2008, an estimated $3.3 billion was spent on lobbying in the United States. Such spending is largely perceived as a strategy to oppose regulation by industry. Research has barely begun to investigate how firm level performance on salient political issues affects corporate political strategy. In this paper, we address this issue in the context of the recent climate change policy debate in the United States. We hypothesize a U-shaped relationship between greenhouse gas (GHG) emissions and lobbying expenditures. To test our hypotheses, the study leverages novel data on corporate GHG emissions and lobbying expenses aimed specifically at climate change legislation. Our results suggest that both dirty and clean firms are active in the public policy process, which challenges the view of adversarial corporate strategy.
Keywords: Corporate Political Activity, Lobbying, Environmental Performance, Climate Change
* Correspondence Magali Delmas, Professor of Management, UCLA Institute of the Environment and Anderson School of Management, La Kretz Hall, Suite 300 Box 951496 Los Angeles, CA 90095-1496. Phone: (310)825-9310. Email: [email protected].

1
INTRODUCTION
While many scholars would agree with the assertion that political issue salience – the importance of the
political issue to the firm – is a primary motivator of corporate political activity (CPA), the concept of issue
salience has been largely conceived as a factor external to the firm and therefore received relatively little
attention in the management literature (Bonardi & Keim, 2005; Hillman, Keim & Schuler, 2004). As such,
research has barely begun to address an issue fundamental to business strategy research: how does a firm’s
performance on a salient political issue influence its political strategies?
For a given issue, greater political salience is commonly viewed as harmful to business, that is, more likely to
provoke regulation that penalizes firms that perform poorly on the issue (Bonardi & Keim, 2005; Lyon &
Maxwell, 2008). Scholars, for example, suggest threatened industries invest in ‘self-regulation’ to preempt
attention from social and environmental advocacy groups and costly negotiations in the public policy process
that could follow (Maxwell, Lyon & Hackett, 2000). The tension between business interest and policies to
protect the common good is exemplified in the environmental policy context, where the prevailing view of
corporate political involvement is one of dirty industries opposing government threats to clean up (Cho, Patten
& Roberts, 2006; Fremeth & Richter, 2011). Strongly opposed to climate change legislation, for example, the
US Chamber of Commerce spent more than $60 million (the most of any single organization) in 2008
lobbying this issue specifically (CPI, 2011). Not surprisingly, the same year one of the highest polluting
electric power generators, Southern Company, spent an estimated $15 million and registered twice as many
lobbyists for climate change policy than any other company (Lavelle & Donald, 2011).
The view of issue salience as a threat to business at the industry level implies that firms performing well on the
issue have little interest in the policy outcome. A less adversarial view of environmental performance and
regulation, however, emphasizes the opportunity for environmentally proactive firms with strong performance
records to leverage new regulations and performance standards to gain competitive advantage over industry
rivals (Fremeth & Richter, 2011; Reinhardt, 1999; Vogel, 1995). As Baron (1995) advocates, effective
2
business strategy integrates non-market (i.e. political) and market strategies, as well as attendant firm-level
competencies (e.g. exemplary environmental performance). This suggests a strategic incentive for firms on the
opposite end of the environmental performance spectrum – those with proactive environmental strategies – to
be politically active as well. Despite being one of the greenest utilities in the nation, for example, Pacific Gas
and Electric (PG&E) spent an estimated $27.8 million (more than a ten-fold increase over the mean of all firms
lobbying the same issue) lobbying climate change at the federal level in 2008 (CPI, 2011). Meanwhile the
utility has openly supported a cap and trade system for carbon emissions, even splitting from the Chamber of
Commerce in 2009 due to the Chamber’s vociferous opposition to carbon regulation.
Notwithstanding their diverging performance records and positions on climate change policy, both Southern
Co. and PG&E were two of the issue’s most politically active firms. To explain this behavior, our study takes a
firm-level perspective of issue salience to develop and test a hypothesis on how firm performance on a public
policy issue influences its political strategies. The context for our analysis is the recent climate change policy
debate. Whether and how to mitigate climate change has been the subject of considerable political debate in
the US (Kolk & Pinkse, 2007) and is widely regarded as a critical socio-political policy issue for business
(Bonardi & Keim, 2005; Cho, Patten & Roberts, 2006; DeShazo & Freeman, 2007; Porter & Reinhardt, 2007;
Reid & Toffel, 2009). Operationalizing issue salience at the firm level, we hypothesize a U-shaped relationship
between greenhouse gas (GHG) emissions and lobbying.
To test our hypothesis we analyze novel data produced by the Center for Public Integrity (CPI) estimating
lobby expenditures aimed specifically at climate change and energy related issues in 2008 and 2009. Our
results reveal that both dirty and clean firms are active in the public policy process, which challenges the
popular view that corporate involvement in the environmental policy process is solely adversarial. Firms which
have taken the middle road with regard to environmental strategy – having neither poor nor exemplary
performance records – demonstrate the lowest levels of political activity. These findings suggest that while
dirty firms lobby to maintain the status quo greener firms view environmental regulation as an opportunity to
gain firm-level advantages.
3
Our analysis makes important theoretical and empirical contributions to the corporate political strategy
literature. We operationalize the concept of political issue salience at the firm- level and in doing so answer
calls for increased attention in this area (e.g. Hillman et al., 2004). The current literature implicitly assumes
that firms are adopting corporate political strategies for the same reasons (i.e. desired political outcome), but
does not address the question of potential diverging intentions. Indeed, firms within the same field and affected
by a widely salient issue could desire opposite political outcomes. We reveal a U-shaped relationship between
environmental performance and corporate political strategies suggesting greener firms devote resources to
promote more stringent standards.
Furthermore, to our knowledge no study has empirically examined the relationship between environmental
performance and lobbying. The extant literature relies strongly on election campaign contributions via political
action committees (PACs) to proxy political strategies and activity (de Figueiredo & Tiller, 2001; Hansen &
Mitchell, 2000; Brasher & Lowery, 2006; Kim, 2008). Lobby expenditures, which are typically an order of
magnitude higher than campaign contributions, have been markedly absent from empirical studies (de
Figueiredo & Cameron, 2009). This is surprisingly considering the dearth of credible evidence that campaign
contributions affect political outcomes and mounting evidence that lobbying is the most effective means to
influence public policy (de Figueiredo, 2002).
In the ensuing two sections we review the relevant literature and then develop our hypotheses. This is followed
by an overview of our data and analysis methods. After describing the results of our analysis, we discuss the
implications and limitation of findings, and conclude by suggesting areas for future research.
LITERATURE REVIEW
Issue Salience
The corporate political strategy literature, which focuses on the strategies firms use to shape government policy
(Baron, 1995; Baysinger, 1984; Hillman et al., 2004; Keim & Baysinger, 1988; Keim & Zeithaml, 1986), has
made important strides toward explaining firms’ rationales for developing political strategies (Baron, 2010;
4
Hillman & Hitt, 1999). Within this literature, there is general agreement amongst scholars that as the salience
of a policy debate increases firms are more likely to become politically active (Hillman & Hitt, 1999; Hillman
et al., 2004; Vogel, 1996; William & Crawford, 2011). Schuler & Rehbein (1997) define issue salience as “a
policy’s net impact of the firm’s competitive strategies and performance” (pg. 121). Getz (1997) suggests issue
salience affects the intensity of corporate political activity, while Hillman & Hitt (1999) posit issue salience
affects the likelihood of a firm to engage in collective action.
Salience has largely been conceived as varying across issues (and time) rather than across firms. Bansal &
Roth (2000), for example, infer issue salience from how an issue’s characteristics affect a generalized group of
stakeholders rather than individual firms. Focusing on the competitiveness of the political environment,
Bonardi & Keim (2005) define salience at the issue-level based on the attention it receives from the voting
public. The authors also examine the process by which an issue becomes widely salient and its strategic
implications. As many scholars have emphasized, salience is not constant across time: issues begin as fringe
concerns and a few become widely salient.1 Issues deemed widely salient (e.g. the health content of fast food
and climate change) are fully politicized and the focus of intense competition amongst interest groups to sway
policy-makers and voters to support one of two well-delineated policy options (Bonardi & Keim, 2005;
Hillman & Hitt, 1999; Rivera, 2010). Scholars note that variation in salience across issues affects the choice
and efficacy of political strategies (Bonardi & Keim, 2005; Hillman & Hitt, 1999; Rivera, 2010). Knowing an
issue is widely salient, however, does little to explain variation in political activity of individual firms (within a
similar organizational field). Such conceptualizations of salience depend primarily on the awareness and
interest of the voting public and media, distinguishing variation in salience across issues – or for a given issue
variation only over time – rather than across firms.
Schuler & Rehbein (1997) develop a theoretical model wherein salience is also the product of factors external
to the firm (e.g. political, industry and macroeconomic factors), but firm-level characteristics (i.e. organization
1 The process-based view of political issues delineates the progression of an issue’s salience into distinct stages. For a compendious overview of this literature, see Rivera (2010).

5
structure and resources, political experience, and stakeholder dependency) act to filter external cues and
ultimately determine how the costs and benefits of political involvement are idiosyncratically calculated.
Although the authors’ model explains variation in perceived salience at the firm-level, it draws from an
organizational rather than strategic perspective that, similar to issue-level conceptualizations, explains political
activity across multiple issues.
Overall, models of corporate political activity have yet to accommodate how characteristics of the firm
relevant to a contested political issue impact its perceived salience. Conceptualized as exogenous to the firm,
salience addresses whether a policy will affect an industry or set of industries and magnitude of this impact
relative to other issues. Explaining firm-level variation in political activity is then left to factors such as firm
size, age, or formalized structures (Hillman et al., 2004) that, independent of a particular issue, indicate general
propensity and/or ability to be politically active (Schuler & Rehbein, 1997). These factors offer little insight
into how a particular issue’s characteristics relate to firm strategies, however, assuming instead that all
politically active firms are unanimous in their desired political outcome.
Environmental Policy
The often politically contentious issue of environmental regulation, a consistent source of tension between
government and business, has received little attention in the corporate political strategy scholarship (Hillman et
al., 2004; Lyon & Maxwell, 2008; Richter, 2012). This is surprising considering the significant expansion of
government regulation in this area and increased political clout of environmental groups over the past several
decades (Vogel, 1995; Rivera, 2010). As such, the corporate political strategy literature has yet to adapt
existing models of political behavior to this important context.
A very small number of studies have empirically examined the relationship between environmental
performance and political activity. Cho et al. (2006) conduct one of the few empirical studies specifically
examining corporate political behavior with regard to environmental policy. The authors found corporate
political campaign spending increases as firm-level environmental performance declines and conclude that
dirtier firms use political strategies to mitigate policy pressure.
6
Focusing on climate change, Williams & Crawford (2011) find that in addition to dirty firms, those with strong
environment performance records are also likely to be political active. Contrary to Cho et al. (2006), their
findings suggests that the issue of climate change may be salient to firms for opposing reasons, that is, based
on exemplary (poor) performance green (dirty) firms see an opportunity to gain (maintain) competitive
advantage through political involvement. As their study looked only at firms targeted by climate change
resolutions in 2007 and 2008, however, their sample was restricted to only 109 observations. As the authors
point out themselves, moreover, poor performers are often targets of shareholder resolutions and thus the study
results likely reflect selectivity bias.
Finally, it is important to note an empirical limitation of corporate political activity research in general. Despite
being criticized as a poor indicator political activity (Munger 1988; Hansen & Mitchell, 2000; Hansen et al.,
2005), researchers have relied heavily on election campaign contributions through PACs to test their
hypotheses (DeFigueiredo & Tiller 2001; Hansen & Mitchel, 2000; Brasher & Lowery, 2006; Kim, 2008).
Firms spend far less on PACs relative to other tactics, especially lobbying. As Baron (2010) notes, firms spend
more on lobbying than other strategy to influence public policy. Nevertheless, lobbying has rarely been
examined in the empirical literature, no doubt due in part to the fact that data on corporate lobby expenditures
weren’t made publicly available until passage of the Lobbying Disclosure Act in 1995 (Baron, 2010).
In summary, considerable scholarly research has been devoted to evincing various antecedents of corporate
political behavior. There is little disagreement that salience is the primary motivator of political activity, but it
has not been conceptualized as a firm-level factor and therefore does little to explain firm-level variation.
Moreover, this literature has given very little attention to environmental policy, while lobbying expenditures
have been markedly absent from empirical studies.
ISSUE SALIENCE, PERFORMANCE AND CORPORATE POLITICAL ACTIVITY
In this section we develop a framework to explain political activity as a function of each firm’s performance on
a political issue (henceforth “issue performance”). Our framework applies specifically to issues that are –

7
relative to other issues – considered salient, by this we mean highly politicized issues wherein the debate has
polarized around two well-delineated policy options (Bonardi & Keim. 2005; Rivera, 2010). For such issues,
the economic implications of policy alternatives are most visible and managers are capable of a more precise
calculation of either outcome’s impact on profitability (i.e. salience) (Rivera, 2010). We thus frame the
political debate as a choice between two mutually exclusive policy options that either support the status quo or
support new legislation/regulation. We argue that issue performance modulates the salience of the issue to the
firm and thus political activity.
With only two policy options to consider, the intentions of a firm’s political activity are also more clearly
linked with its respective performance on the issue. Issue performance is the outcome of each firm’s
management philosophy and strategic choices, and thus an indication of its interest in maintaining current
regulatory order. A firm with poor performance on an issue will likely view regulation as a threat to
profitability and wish to preserve the status quo. A firm with exemplary performance, on the other hand, may
perceive regulation as an opportunity to engender market conditions that favor good performance.
As such, we posit that the salience of an issue is highest for firms approaching either end of the performance
spectrum. Firms with the least interest in the political outcome are those with average performance records,
that is, middle-of-the-road performers. Taking this perspective of salience and its relationship to issue
performance allows evaluation of how a contested policy’s impact – and thus political activity – varies within
an industry. We now narrow our focus on political issues to the context of environmental policy, which has
been a setting of considerable strategic importance for business.
Poor Performers
Scholars note that the adversarial relationship between business and government is perhaps most acutely
displayed in the environmental context (Vogel, 1996; Rivera, 2010). With vested interest in the status quo
business is typically a source of particularly well-organized resistance (Bonardi, Hillman & Keim, 2005) to
policy changes. Firms should not be in favor of internalizing social costs (Friedman, 1970) and with rare
exception should firms benefit from environmental regulation (Palmer, Oates & Portney, 1995). As such,

8
business involvement in policy process – especially with regard to social and environmental issues – is largely
viewed as a unified force of resistance to government intervention and changes to the status quo (Fremeth &
Richter, 2011; Shaffer, 1995), while firms who attempt to wield political influence are widely considered to be
‘evil’ (Richter, 2012). Indeed, scholars note that the prevailing behavior of business is to resist demands to
provide environmental protection (Rivera, 2010) and empirical research has shown that poor environmental
performance is associated with increased levels of political activity (Cho et al., 2006).
The burden of environmental regulation depends on the firm’s environmental management strategies,
capabilities and resulting level of performance (Leone, 1986; Reinhardt, 1999). Dirtier firms following a
compliance-oriented strategy have an interest in keeping environmental standards as low as possible (Russo &
Fouts, 1997). Relative to an environmentally proactive firm, one which has eschewed a strategy of managing
their environmental impacts will likely incur greater costs complying with newly imposed regulation
(Reinhardt, 1999; Richter, 2012; Vogel, 1995).
Additionally, poor performance is penalized by a broader set of stakeholders than just regulators, as policy
debates attract greater scrutiny from media, civil society and other non-market actors (Baron, 2010; Fremeth &
Richter, 2011) and threaten to usher in new norms and standards that could harm the legitimacy of poor
performing firms (Bonardi & Keim, 2005; Rivera, 2010). By preventing or forestalling environmental
regulation (i.e. maintaining the status quo), poor environmental performers protect the value of their
investments in dirtier technologies and keep demand for cleaner products and processes from otherwise rising.
These arguments suggest environmental regulatory change is most salient to poorer performing firms – those
with the most to lose by meeting higher performance standards – and thus that the salience of an environmental
policy issue increases as environmental performance declines (Cho et al., 2006).
Exemplary Performers
However, as the economic theory of regulation has for a long time argued, business can often achieve private
benefits through promoting environmental regulation, which can engender barriers to entry and other sources
of competitive advantage (Gruenspect & Lave, 1989; Peltzman, 1976; Stigler, 1971). New environmental

9
policies create both losers and winners (Leone, 1981; Shaffer, 1995). Firms with greater capabilities for
adapting to new legislation or rule-making can use public policy strategically to capture firm-specific
advantages over industry competitors (Russo & Fouts, 1997; Shaffer, 1995).
As management scholars have more recently pointed out, the asymmetric effects of environmental regulation
can be exploited by exemplary environmental performers. According to this perspective, government
intervention can create missing markets for environmental quality (Vogel 1995; Reinhardt, 2000). New
environmental regulations can also disproportionately increase the operating costs of dirtier competitors
(Leone, 1986; Moloney & McCormick, 1982; McEvily, Sutcliffe & Marcus, 1994; Reinhardt, 1999). In other
words, environmental regulation can foster competitive advantage for greener firms who are capable of
meeting the newly generated demand (from both regulators and consumers) for environmental quality at a
lower cost (Leone, 1981; Reinhardt, 1999).
A recent example of a company’s use of environmental policy to gain market advantages is Michelin’s pursuit
of government standards for ‘rolling resistance” (RR). RR is responsible for, on average, one fifth of the car’s
total fuel consumption and as such can have a significant effect on carbon emissions. In the mid-1990’s
Michelin achieved what was a considered a breakthrough innovation for reducing the RR for their tires and
used this feature as a source of environmental differentiation. To embolden its environmental differentiation
strategy and secure costly technological barriers, Michelin successfully appealed to policy makers at the
national and international level to incorporate RR ratings into environmental performance standards for
automobile carbon emissions (Hanateau, 2009). Similarly, in the mid-1980s Chrysler surprisingly opposed the
Reagan administration’s decision to lower the Corporate Average Fuel Economy (CAFÉ) standards, as the
company felt the existing higher standard would raise costs for its less efficient competitors, General Motors
and Ford (Nivola & Crandall, 1995).
As Fremeth & Richter (2011) argue, by advocating for stricter standards firms can ‘shape future policy around
existing environmental strengths’ (p. 145). Firms that have invested in costly ‘clean’ technologies, such as
renewable energy, recycling or waste prevention processes, which exceed current compliance standards, may

10
see regulation as an opportunity to enhance the value of these past investments. Such firms are also well-
positioned to receive government subsidies designed to encourage adoption and growth of clean practices
should new legislation be enacted. Similarly, some firms may also have strong performance records from
having to meet state- or local-level environmental policies, giving them an incentive to level the competitive
playing field through harmonizing local regulatory stringency at the federal level (Vogel, 1995).
For example, in the 1980s BMW’s largest US market was California, so the luxury car company acquired
considerable experience producing cars that met the state’s increasingly strict emission standards, including the
mandate that all cars be equipped with catalytic converters. As this expensive and complex technology was not
required in their domestic market, BMW realized it could maximize the value of its investment and raise costs
for domestic competitors by importing California’s standards to Europe (Vogel, 1995). Moreover,
harmonizing all European Union member markets with California’s standard meant BMW would no longer
have to differentiate its production lines and could thus reduce costs (Hanateau, 2009).
To summarize, firms with exemplary environmental characteristics regulation can: (1) raise operating costs of
poor performing competitors; (2) exploit increased demand (from regulators and consumers) for
social/environmental quality; (3) maximize return on existing investments and sunk costs; and/or, (4)
harmonize discordant institutional contexts (e.g. state versus federal regulation) (Baron, 1995; Reinhardt, 1999;
Vogel, 1995). The above arguments and supporting examples suggest that the salience of environmental
policy also increases as firms become greener.
Middle-of-the-road Performers
Environmental policy doesn’t just create losers (i.e. poor performers) and winners (i.e. exemplary performers);
there are also subsets of firms which are minimally affected. Firms which have taken the middle road with
regard to environmental strategy – having neither poor nor exemplary performance records – have the least at
stake in the policy outcome. Without a clear environmental strategy such firms are uncertain about how
proposed regulation will affect profitability and thus what side of the issue to be on (William & Crawford,
2011). Middle-of-the-road firms also likely receive little attention – either positive or negative – from media

11
and the general public regarding their environmental stance and/or impacts. Recent research suggests that both
exemplary and poor environmental performers attract the greatest media attention and public scrutiny,
rendering environmental issues relatively less important to middle-of-the-road firms (Luo, Meier, &
Oberholzer-Gee, 2012).
The small benefits these firms may gain from either supporting or opposing regulation are easily outweighed
by the costs. Moreover, as there are likely many more firms with average – rather than exceeding good or poor
– performance records, the benefit of either political outcome will be concentrated within a relatively small
number of firms on either end of the environmental performance spectrum. The benefits of a political outcome
will be diffusely distributed for firms in the middle of this spectrum, which – according to collective action
theory – suggests a strong incentive to adopt a free-riding strategy (Olson, 1965; Yoffie, 1987). As such, we
would expect that the salience of an environmental policy debate decreases as environmental performance
approaches an ambiguous middle ground, which is neither particularly poor nor exemplary.
Summary
Together these arguments imply U-shaped relationship between issue salience and performance: salience is
highest for both exemplary and poor performers, and lowest for middle-of-the road performers. This
relationship is depicted in Figure 1. As salience increases so does political activity (Getz 1997; Bonardi et al.,
2005; Bonardi & Keim, 2005; Hillman et al., 2004; Rivera, 2010; Vogel, 1996; Williams & Crawford, 2011;
Yoffie, 1987). As such, we would expect environmental performance and political activity to have a U-shaped
relationship. Stated formally:
H1: All else equal, the relationship between environmental performance and corporate political activity is U-
shaped.
Insert Figure 1 Here
12
METHODS
In this section we describe the data and methods used to test for a U-shaped relationship between
environmental performance and political activity. We focus on lobbying – a widely used tactic of an
information strategy – wherein firms directly convey to policy makers information (e.g. political, technical and
economic assessment) that supports their preferred political outcome (Hillman & Hitt, 1999; Rivera, 2010).
Scholars also note that firms are most likely to lobby when an issue has become highly politicized and when
the debate has focused on several specific policy options (Hillman & Hitt, 1999). Below we describe the data
and analysis methods used to conduct this analysis.
Data
GHG emissions data were acquired from Trucost. Trucost provides a range environmental performance data
for the socially responsible investment community and increasingly used in peer reviewed academic research
(e.g. Dawkins & Fraas, 2011; Jira & Toffel, 2012; Marquis & Toffel, 2012). Where available Trucost collects,
standardizes and validates company reported environmental data from annual reports, corporate websites
and/or other public disclosures. Where not disclosed publicly, data are calculated from global fuel use, or
imputed by conducting a detailed sector breakdown of each firm and applying a proprietary input-output (IO)
economic model based on government census and survey data, industry data and statistics and national
economic accounts. The data cover annual performance from 2004 through 2008.
Corporate lobbying expenditures on issues related to climate change and energy policy were produced and
made publically available by the Center for Public Integrity (CPI) for the years 2008 and 2009. 2 CPI examined
lobbying disclosure reports filed with the Secretary of the Senate’s Office of Public Records. The records
became available electronically for the first time in 2008, allowing for key word searches. CPI researchers
included all lobbyists registered to represent clients using the keywords “climate” and “global warming,”
and/or bill numbers and terms associated with climate change legislation during 2008 and 2009. To estimate
2 http://www.publicintegrity.org/investigations/climate_change/pages/methodology/

13
amount spent, CPI coded each disclosure record to reflect whether the lobbyist was hired for representation on
the issue of climate change exclusively or multiple issues. Expenses reported only as “less than $5,000” were
not included.3
Financial data used to construct our control variables were obtained from Compustat and Risk Metrics.
Merging these disparate data sets resulted in sample of 285 complete firm-year observations – 120 lobbying
firms in 2008 and 165 in 2009. The sample size is limited by lobbying expenditures: out of 988 possible firm-
year observations, only 285 contain lobbying expenditures.
Dependent Variable
Employing the two-step Heckman methodology (see Data Analysis section below), two dependent variables
are constructed. For the first stage a dichotomous variable Selection was coded ‘1’ if a firm spent at least
$5000 on lobbying the issue of climate change in 2008 or 2009, and ‘0’ otherwise. The dependent variable for
the second stage, Expense, is the annual amount spent on lobbying in $ US at the Federal level.
Independent Variables
Each firm’s GHG emissions include all GHG Protocol gases weighted by global warming potential factors and
measured as tons of CO2-equivalent (C02-e). We include only Scope 1 emissions as defined by the GHG
Protocol – the most commonly used international greenhouse gas accounting protocol (Ranganathan, Corbier,
Bhatia, Schmitz, Gage, & Oren, 2004). Scope 1 emissions are all GHGs emitted from sources directly owned
or operated by the responsible firm. We label this variable GHG Emissions. This variable is log transformed to
adjust for skewedness and mitigate the influence of outliers. To avoid collinearity with the square-transformed
variable it is also centered. To test the U-shaped relationship a second variable was generated by squaring
GHG Emissions. This is labeled GHG Emissions 2.
3 The Appendix contains additional descriptive statistics for these data.

14
Control Variables
Several control variables are included to account for factors other than environmental performance that affect
lobby expenditures. Firms are more likely to act collectively when the private benefits are concentrated within
a smaller group of firms (Olson, 1965). To control for this we include Concentration Ratio, calculated from
Compustat as the market share of 4 largest firms at the 3-digit naics code level. Shareholders can exert pressure
on firms to influence their stance on social and environmental issues (Reid & Toffel, 2009) and political
involvement (Schuler & Rehbein, 1997). To account for heterogeneity in shareholder activism we include a
binary Resolutions variable, which is coded ‘1’ if a firm is targeted by at least one shareholder resolution
related to climate change or other environmental issues in a given year or ‘0’ otherwise (Reid & Toffel, 2009).
Resolutions data were gathered from Risk Metrics.
Scholars note that the political behavior of firms is likely influenced by antecedent state-level political debates
and regulatory efforts (Reid & Toffel, 2009). This consideration is especially relevant to climate change, as
there is considerable variation in each state’s stance on the issue (Cragg & Kahn, 2009; DeShazo & Freeman,
2007; Reid & Toffel, 2009). According to DeShazo & Freeman (2007), this motivates firms to seek uniformity
and regulatory certainty through federal legislation. To account for heterogeneity in the state-level regulatory
setting, we include three binary variables indicating whether a firm is headquartered in a state that (at the time):
(1) has passed climate change legislation (i.e. California); (2) is a member of the Regional Greenhouse Gas
Initiative (RGGI); or (3) has enacted Renewable Portfolio Standards (RPS).4 We label these variables,
respectively: CA, RGGI, and RPS.
We include several financial variables shown in prior research to affect CPA, which are all constructed using
data from Compustat. We construct the variable Firm Size as total assets (King & Lenox, 2002). Hillman et al.
(2004) note that firms with less debt have greater organizational slack and can afford to lobby more intensely.
As such we include the variable Leverage, calculated as the ratio of total debt to total assets. Similarly, slack
4 Reid & Toffel (2009) differentiate between firms from these states in sectors that are likely to be impacted by climate change regulation from sectors less likely to be impacted.

15
resources are also affected by firm performance. We proxy Firm Performance as return on assets (ROA),
which we calculate as earning performance interest divided by total assets (King & Lenox, 2002). We also
include Capital Intensity, capital expenditures divided by total sales, to account for variation across firms in
available capital. With the exception of Firm Performance, all financial control variables are log transformed.
Finally, we include industry dummy variables based on 20 Industrial Classification Benchmark (ICB) super
sectors, as well as year dummy variables.
Data Analysis
Our model of the determinants of lobbying expenditures is as follows:
, , , , , , , ,
where , , represents lobby expenditures for firm i in industry j in year t, and GHGi,t and GHG2i,t are the linear
and quadratic-transformed GHG emissions variables, respectively. is the matrix of control variables, T
represents the year dummy variable (to control for secular changes) and represents the propensity to lobby
in a given year. We lag both independent variables, as well as Resolutions, one year behind the dependent
variable.
We use the two-step Heckman selection model, which is commonly used with lobbying data in the corporate
political strategy and related literature (Brasher & Lowery, 2006; Hansen & Mitchell, 2000; Kim, 2008). As
our sample of firms only those lobbying issues related to climate change there is a high risk of selectivity.
Selectivity is a concern if similar variables are likely to influence participation in the treatment groups (i.e. the
decision to lobby) and treatment outcome (i.e. lobbying expenditures). The Heckman methodology controls for
self-selectivity bias by estimating a two-step process. The first step estimates the propensity (of both lobbying
and non-lobbying firms) to lobby using a probit model. The estimate of propensity (i.e. the “hazard rate” or
lambda) is then included an OLS model in second step, in effect controlling for self-selectivity bias.

16
RESULTS
Table 1 displays summary statistics of lobbying expenditures and mean GHG emissions by sector. We see that
firms from almost all sectors of the economy lobbied the issue of climate change at the federal level. The
industrial goods and services, oil and gas, technology and utilities sectors appear most active in lobbying,
which is consistent with the expected economic impact of climate change legislation (Reid & Toffel, 2009).
Interestingly, firms from sectors less sensitive to carbon regulation, such as banks, financial services and
healthcare, also lobbied climate change. The mean estimated lobby expenditure across all sectors is
approximately $2.15 million with a relatively high standard deviation (approximately $3.9 million) and a
maximum of $27.8 million spent by PG&E in 2008.5
Insert Table 1 Here
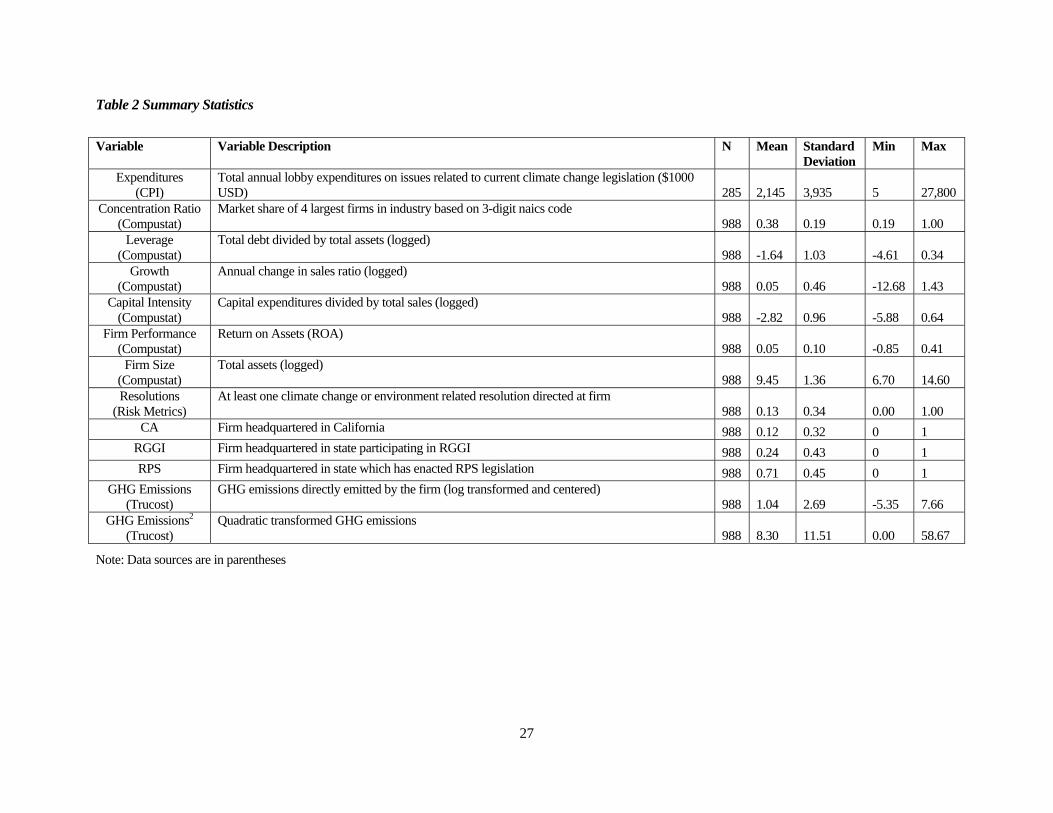
Variable descriptions and summary statistics are shown in Table 2. Variable correlations are contained in
Table 3, which also includes the binary Selection variable used in the first stage of the Heckman analysis. As
expected, Firm Size and both GHG Emissions variables are positively correlated with lobbying expenditures.
The variable Resolutions is also positively correlated to lobbying expenditures. Interestingly, while
concentration ratio shows a positive correlation with lobby expenditures there is no significant association with
the decision to lobby (i.e. Selection).
Insert Table 2 and Table 3 Here
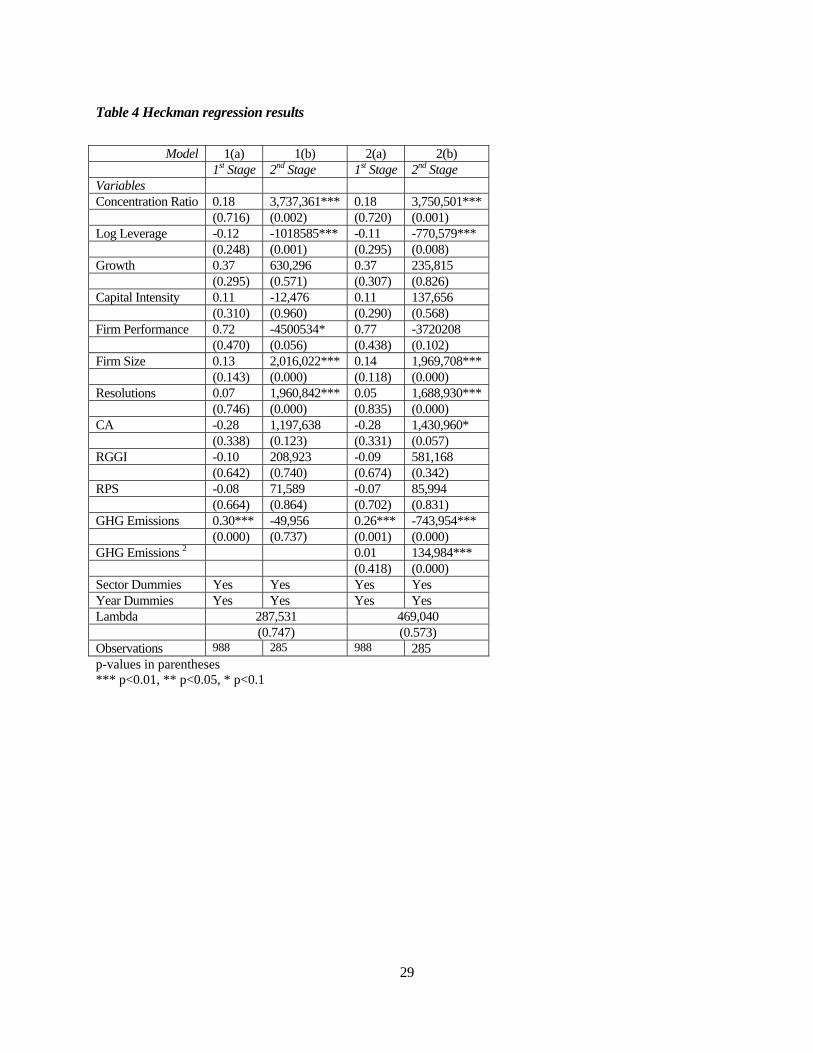
The results of the two-step Heckman regression analysis are tabulated in Table 4. The quadratic transformation
of the GHG emissions variable is added in Model 2. Columns 1(a) and 2(a) contain the results from the first
stage probit estimates for the factors influencing the likelihood of lobbying. Looking at Models 1(a) and 2(a),
we find concentration ratio to be associated with a greater likelihood of lobbying. This is consistent with
Olson’s (1965) prediction that firms are more likely to act collectively when the private benefits are
concentrated within a smaller group of firms. The results show a firm’s rate of growth (p<0.05) is also
5 In 2008, Exxon Mobil recorded the second highest amount at $26.6 million (CPI, 2011).

17
associated with an increased proclivity to lobby, as found in prior research (Kim, 2008). Although positive,
surprisingly the effect of Firm Size does not differ significantly from zero. In contrast to prior studies, this
suggests larger firms are no more likely to lobby than their smaller counterparts. The coefficient estimate for
GHG Emissions is positive and significant, indicating firms are more likely to lobby as their pollution levels
increase. Adding GHG Emissions2 in model 2(a), however, does not appear to increase likelihood of lobbying.
Insert Table 4 Here
Noteworthy differences are apparent between the first (i.e. Models 1(a) and 2(a)) and second stages (i.e.
Models 1(b) and 2(b)). Although Firm Size had no significant effect on the likelihood of lobbying, it shows a
relatively large positive effect on lobby expenditures (p < 0.01). Together this suggests firms with greater
resources spend more than smaller firms but are not necessarily more likely to become politically active.
Similarly, Leverage was insignificant in the first stage, but has a negative effect (p <0.05) on expenditures. The
negative relationship between leverage and lobby expenditures confirms a relationship similar to that of firm
size mentioned above: firms with less debt have greater organizational slack and can afford to lobby more
intensely (Hillman et al., 2004).
Focusing on model 2(b), we see Concentration Ratio displays a large and significant positive effect on lobby
expenditures. This provides evidence that firms from industries where market share is increasingly shared by
fewer firms devote more resources to influence policy (Hansen et al., 2005; Kim, 2008). Interestingly, the
coefficient for Resolutions suggests that ceteris paribus being the target of at least one shareholder resolution
increases lobbying expenditures by approximately $1.69 million. Of the variables controlling for state-level
climate change policy initiatives, the indicator variable for California is significant, which suggests that being
headquartered in California increases lobbying expenditures by approximately $1.3 million. Neither RGGI or
RPS appear to have a significant association with lobby expenditures.
Supporting our hypothesis, the quadratic GHG emissions term is positive and highly significant (p<0.01). The
model results also show that the complete effect of GHG emissions on lobby expenditures includes a negative

18
linear term (p<0.01). Holding all other variables constant, the estimated relationship between lobby
expenditures and direct greenhouse emissions is represented by the following model:
,
where is GHG emissions, and are the estimated coefficients for the linear and quadratic terms,
respectively. A graphical interpretation of these results, depicting the estimated relationship between GHG
emissions and lobby expenditures holding all other factors at their mean, is shown in Figure 2. The graph
shows a concave-up parabola with the minimum expenditure corresponding to a logged emission level
approximately 14 (i.e. 1.2 million tons). This tells us expenditures increase as GHG emissions either increase
or decrease from this value; thus, evidence of a curvilinear relationship between GHG emissions and lobby
expenditures.
Insert
Figure 2 Here
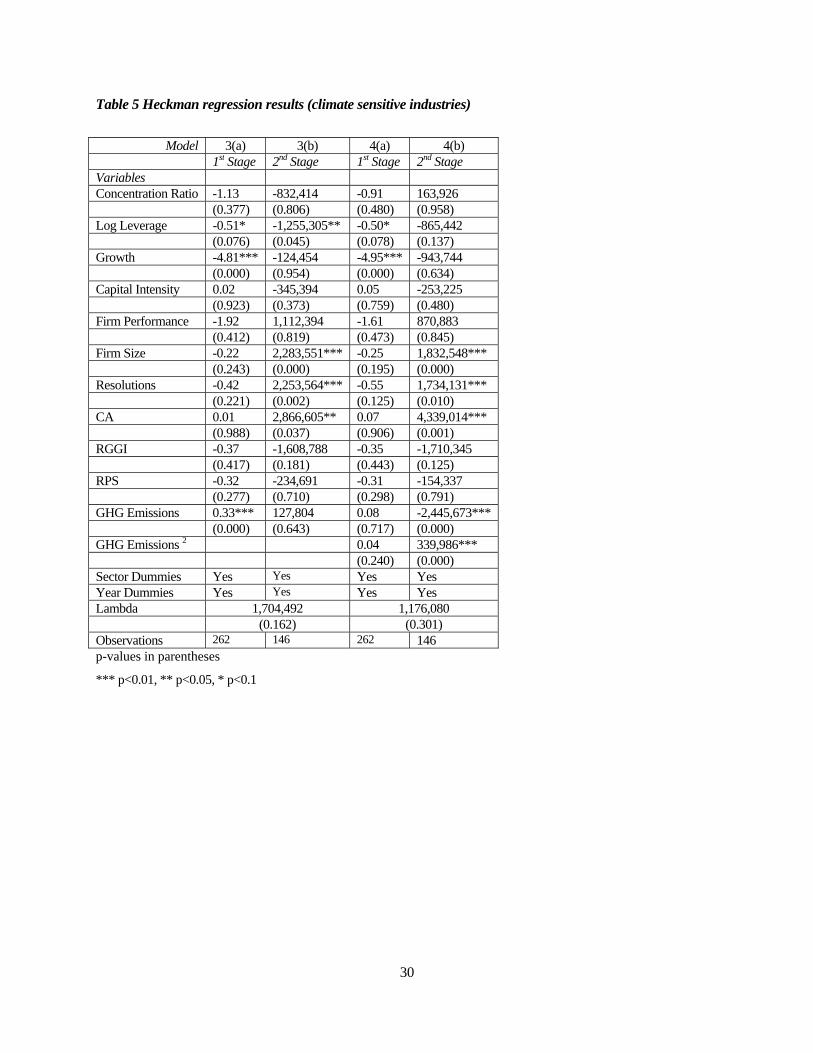
It is important to note that our analysis thus far includes all economic sectors. However, in industries with
minimal carbon intensity, such as the financial services and insurance, a firm’s motivation to influence climate
change policy likely has little to do with firm-level environmental performance. Moreover, our measure of
environmental performance – Scope 1 GHG emissions – accounts only emissions that result from processes
directly owned by each firm, that is, it excludes downstream emissions from product use. For certain
industries, firm’s interest a specific climate change policy outcome likely comes from the environmental
performance of its product(s) rather than its own processes. For example, a firm with a strategy of producing
fuel efficient cars may view a price on carbon and an increase in fuel prices as an opportunity to gain market
share. Likewise, a firm developing renewable technology may have a similar interest in encouraging
constraints on fossil fuels. The ‘greenness’ of each of these firms, however, is not necessarily captured by
Scope 1 emissions. Using such a measure, we should expect to evidence of the relationship described in the

19
hypothesis section for industries with relatively high levels of direct GHG emissions. As a robustness check,
we repeat the above analysis but restrict our sample to sectors most sensitive to climate change regulation. This
includes the five highest polluting sectors (see Table 1 for GHG emissions by sector): basic resources,
chemicals, oil and gas, travel and leisure, and utilities. The results using the restricted sample space are
displayed in Table 5, where the number of observations is reduced from 285 to 146. The results corroborate
our initial findings.
Insert Table 5 Here
Although the Heckman methodology was used to correct for anticipated selection bias in testing our
hypothesis, this appears to have been unnecessary. The coefficient for lambda (i.e. the unobserved proclivity to
lobby) included in the second is not significant. An insignificant lambda suggests the decision to lobby and
expenditures are not endogenous. Indeed that is what our results show (without looking at lambda): the results
of the 1st stage probit model (Models 1a and 2a) demonstrate the likelihood of participation increases linearly
with GHG emissions. Moreover, GHG Emissions appears to be the only significant predictor of the likelihood
of lobbying. This suggests that the proclivity to lobby isn’t necessarily an indicator of how much firms intend
to spend.
In summary, the results corroborate our hypothesis. All else equal, the likelihood of lobbying increases linearly
as a firm’s GHG emissions increase. This finding is consistent with prior research that suggests higher
polluting firms become politically active to avoid costly protective regulation (Cho et al., 2006). However, the
results from the second stage provide evidence that the likelihood of lobbying does not necessarily determine
expenditures. The findings show GHG emissions instead exhibit a curvilinear relationship with expenditures,
implying that spending increases for lobbying firms as they approach either end of the environmental
performance spectrum. Together, the results from both stages of the Heckman analysis also reveal differences
between the effect of GHG emissions on the decision to lobby and its effect on the amount subsequently spent.
This is also true for control variables (e.g. firm size and leverage) commonly thought to affect political activity
in prior research.

20
DISCUSSION AND CONCLUSION
The study’s results strongly support our hypothesis that environmental performance relates to political activity
in a U-shaped manner. We find that firms on opposite ends of the environmental performance spectrum spend
the most lobbying policy-makers, while middle-of-the-road performers – firms with neither exemplary nor
particularly poor performance records – spend the least. Below we discuss the theoretical and empirical
implications of these findings to the corporate political strategy literature.
Although it is widely accepted that greater political issue salience increases political activity, relatively little
attention been devoted to unpacking this concept at the firm-level. Prior research has largely viewed salience
as a variable external to the firm, which varies across issues and/or time. But this perspective assumes no
heterogeneity in the orientation of firms to the outcome of a given political issue. Furthermore, scholars have
largely viewed increased issue salience as a threat to business. This perspective is particularly evident in the
context of environmental policy, where politically active firms are assumed to be unanimous in their
opposition to environmental regulation. It follows from this view that green firms have little incentive to
participate in the public policy process.
A small body of theoretical work and anecdotal evidence indicate, however, that greener firms can gain
advantage vis-à-vis competitors from more stringent environmental standards. This suggests variation in issue
salience across firms for a given issue and motivates this study to conceptualize issue salience as variable at the
firm-level. By doing so, we show that firms with increasingly good or bad performance have a greater stake in
the outcome of contested environmental policy issue (i.e. greater salience). These results shed a critical light on
the perceived adversarial relationship between business and environmental policy. While confirming the
stereotype that dirtier firms are more politically active, our findings suggest that greener firms are also vying
for political influence. More generally, our results suggest that the salience of a given political issue can be
both harmful and advantageous depending on whether the firm performs negatively or positively on the issue,
respectively. These findings also support Baron’s (1995) integrated strategy perspective, which posits a
complementary relationship between non-market and market components required of an overall effective

21
strategy. That our results imply firms are adapting their political strategies to issue performance indicates firms
may indeed be integrating non-market and market strategies. More specifically, the results suggests firms may
be reacting strategically to environmental regulatory uncertainty by aligning their environmental strengths and
political strategies in the manner proposed by Fremeth & Richter (2011).
We test our hypotheses on lobbying – a political tactic that has received surprisingly little attention in the
empirical corporate political strategy literature. To the author’s knowledge, this is the first study to test the
relationship between environmental performance and lobbying. Focusing on environmental policy in general
and climate change specifically, we also address a class of political issues with considerable material
implications for business and a specific issue that is considered widely salient. To achieve this we create and
analyze a novel data set that merges multiple years of GHG emissions and estimates of lobbying expenditures
aimed at the issue of climate change.
Before highlighting avenues for future research, it is prudent to note several limitations of our study. First,
although our results suggest heterogeneity in the desired policy outcome of politically active firms, this is
inferred indirectly from environmental performance. Greater confidence in this inference could be gained from
a more direct measure of each firm’s stance on climate change. Second, the time period for our study
concluded at what could be considered a peak in public concern for climate change. Since this period climate
change legislation has stalled and public concern for climate change has flagged. This suggests a period of
temporal variation in the issue’s salience. Future research could examine how this change affects political
activity and the firm-level factors that may modulate it.
Future research could also investigate if the relationship between issue salience, issue performance and other
corporate political activities such as corporate disclosure. Such research could compare the effect of
environmental performance on information disclosure, which has been described as complementary to
lobbying (Hillman & Hitt, 1999; Cho et al., 2006), and be therefore able to assess the impact of environmental
performance on a broader set of corporate political strategies. By disclosing information related to
environmental strategies and performance, dirty firms can either demonstrate to stakeholders that they are
22
clean (i.e. through greenwashing; Lyon & Maxwell, 2011) or their intention to mitigate environmental harm
and actions taken to this end (Kolk & Pinkse, 2007; Williams & Crawford, 2011). By doing so, they send the
message that government intervention is redundant. At the same time, exemplarily performing companies
convey to voters an achievable standard by which competing firms should be held and thus increase the
legitimacy of environmental legislation (Reinhardt, 1999).
Other research avenues include a better understanding of organizational characteristics that could mediate the
relationship between environmental performance and corporate political strategy. These include how
differences in organizational functions (Hoffman, 2001; Delmas & Toffel, 2008), firms’ capabilities,
resources, and ownership structure (Darnall and Edwards, 2006; Sharma, 2000; Sharma and Vredenburg,
1998), board size (Kassinis and Vafeas, 2002), corporate identity and managerial discretion (Sharma, 2000),
and the characteristics of individual managers (Bansal and Roth, 2000; Cordano and Frieze, 2000).
REFERENCES
Ansolabehere, S., Snyder, J. Jr. & Tripathi, M. 2002. Are PAC contributions and lobbying linked? New evidence from the 1995 Lobby Disclosure Act. Business and Politics, 4(2): 131-155.
Bansal, P. & Roth, K. 2000. Why companies go green: A model of ecological responsiveness. Academy of Management Journal, 43(4): 717:736
Baron , D. 1995. Integrated Strategy: Market and nonmarket components. California Management Review, 37(2): 47-65.
Baron , D. 2010 . Business and its Environment (5th edn.). Upper Saddle River, NJ: Pearson Education Inc.
Baysinger, B. 1984. Domain maintenance as an objective of business political activity: An expanded typology. Academy of Management Review, 9: 248-258.
Bonardi, J.P., Hillman, A. & Keim, G. 2005. The attractiveness of political markets: Implications for firm strategy. Academy of Management Review, 30(2): 397-413.
Bonardi, J.P. & Keim, G. 2005. Corporate political strategies for widely salient issues. Academy of Management Review, 30(3): 555-576.
Brasher, H. & Lowery, D. 2006. The corporate context of lobbying activity. Business and Politics, 8(1): 1-23.
Chen, C.M. & Delmas, M. 2010. Measuring corporate social performance: An efficiency perspective. Production and Operations Management, 20(6): 789-804.
Cho, C. H., Patten, D. M., & Roberts, R. W. 2006. Corporate political strategy: An examination of the relation between political expenditures, environmental performance, and environmental disclosure. Journal of Business Ethics, 67: 139-154.

23
Center for Public Integrity (CPI). 2011. The climate change lobby: Who’s lobbying? Washington, DC. http://www.publicintegrity.org/investigations/climate_change/ [November 19, 2011].
Cordano, M. and Frieze, I. H. 2000. Pollution reduction preferences of US environmental managers: Applying Ajzen's theory of planned behavior. Academy of Management Journal, 43(1): 627-641.
Cragg, M. & Kahn, M.E. 2009. Carbon geography: The political economy of congressional support for legislation intended to mitigate greenhouse gas production. National Bureau of Economic Research Working Paper No. 14963.
Darnall, N. and Edwards, D. J. 2006. Predicting the cost of environmental management system adoption: The role of capabilities, resources, and ownership structure. Strategic Management Journal, 27(4): 301-320.
Dawkins, D. & Fraas, J.W. 2011. Coming clean: The impact of environmental performance and visibility on corporate climate change disclosure. Journal of Business Ethics, 100: 303-322.
Delmas, M. A. and Toffel, M. W. 2008. Organizational responses to environmental demands: Opening the black box. Strategic Management Journal 29(10): 1027-1055.
de Figueiredo, J.M. 2002. Lobbying and Information in Politics. Harvard Law School John M. Olin Center for Law, Economics and Business Discussion Paper Series. Paper 369.
de Figueiredo, J.M. & Cameron, C.M. 2009. Endogenous cost lobbying: Theory and evidence. CELS 2009 4th Annual Conference on Empirical Legal Studies Paper.
de Figueiredo, J.M. & Tiller, E. H. 2001. The structure and conduct of corporate lobbying: How firms lobby the Federal Communications Commission. Journal of Economics and Management Strategy, 10(1): 91-122.
DeShazo, J.R. & Freeman, J. 2007. Timing and form of federal regulation: The case of climate change. University of Pennsylvania Law Review, 155: 1499-1561.
Fremeth, A.R. & Richter, B.K. 2011. Profiting from environmental regulatory uncertainty: Integrated strategies for competitive advantage. California Management Review, 54(1): 145-165.
Getz, K. 1997. Research in corporate political action: Integration and assessment. Business & Society, 36: 32-72.
Grier, K., Munger, M. & Roberts, B. 1994. The determinants of industry political action, 1978-1986. The American Political Science Review, 88(4): 991-926.
Gruenspect, H.K. & Lave, L.B. 1989. The economics of health, safety and environmental regulation. In Handbook of Industrial Organization, vol. 2, edited by Richard Schmalensee and Robert D. Willig. Amersterdam: North-Holland.
Hanateau, J. 2009. Competitiveness through political environmental strategies: The case of Michelin’s green tires. Global Business and Organizational Excellence, 29(1): 32-40.
Hansen, W., Mitchell, N. & Drope, J. 2005. The logic of private and collective action. American Journal of Political Science, 42(1): 150-167.
Hansen, W. & Mitchel, N.J. 2000. Disaggregating and explaining corporate political activity: Domestic and foreign corporations in national politics. The American Political Science Review, 94(4): 891-903.
Hillman, A. J., & Hitt, M. A. (1999). Corporate political strategy formulation: A model of approach, participation, and strategy decisions. Academy of Management Review, 24: 825-842.
Hillman, A. J., Keim, G. A., & Schuler, D. (2004). Corporate political activity: A review and research agenda. Journal of Management, 30: 837-857.
Hoffman, A. J. 2001. Linking organizational and field-level analyses: The diffusion of corporate environmental practice. Organization & Environment, 14(2): 133-156.
Jira, C. & Toffel, M. 2012. Engaging supply chains in climate change. Harvard Business School Working Paper No. 12-026.
24
Kassinis, G. and Vafeas, N. 2002. Corporate boards and outside stakeholders as determinants of environmental litigation. Strategic Management Journal, 23(5): 399-415.
Keim, G., & Baysinger, B. 1988. The efficacy of business political activity: Competitive considerations in a principal agent context. Journal of Management, 14: 163–180.
Keim, G. & Zeithaml, C. 1986. Corporate political strategy and legislative decision making: A review and contingency approach. The Academy of Management Review, 11(4): 828-843.
Kim, J.H. 2008. Corporate lobbying revisited. Working Paper: Cornell University, Ithaca, NY.
King, A. & Lenox, M. 2002. Exploring the locus of profitable pollution reduction. Management Science, 48(2): 289-299.
Kolk, A., & Pinkse, J. (2007). Multinationals’ political activities on climate change. Business & Society, 46: 201-228.
Lavelle, M. & Donald, D. 2009. Southern Company dominates the climate lobbying scene. The Center for Public Integrity iWatch News. April 19. http://www.iwatchnews.org/2009/07/01/2830/southern-company-dominates-climate-lobbying-scene [November 19, 2011].
Leone, R.A. 1981. Government regulation of business: Developing the managerial perspective. Boston: Harvard University.
Leone, R.A.1986. Who profits? Winners, losers, and government regulation. New York: Basic Books.
Lowery, D. 2007. Why do organized interests lobby? A multi-goal, multi-context theory of lobbying. Northeastern Political Science Association, 39(1):29-54.
Luo, J., Meier, S. & Oberhozler-Gee, F. 2012. No news is good news: CSR strategy and newspaper coverage of negative firm events. Harvard Business School Working Paper 12-091.
Lyon, T.P. & Maxwell, J.W. 2008. Corporate social responsibility and the environment: A theoretical perspective. Review of Environmental Economics & Policy, 2(2): 240-260.
Lyon, T.P. & Maxwell, J.W. 2011. Greenwash: Corporate environmental disclosure under threat of audit. Journal of Economics & Management Strategy, 20(1): 3-41.
Maxwell, J.W., Lyon, T.P. & Hackett, S.C. 2000. Self-regulation and social welfare: The political economy of corporate environmentalism. Journal of Law of Economics, 43(2): 583-618.
Moloney, M.T. & McCormick, R.E. 1982. A positive theory of environmental quality regulation. Journal of Law and Economics, 25: 99-123.
Marquis, C. & Toffel, M. 2011. The globalization of corporate environmental disclosure: Accountability or greenwashing? Harvard Business School Working Paper, No. 11-115.
Masters, M., & Keim, G. 1985. Determinants of PAC participation among large corporations. The Journal of Politics, 47: 1158–1173.
McEvily, S., Sutcliffe, K. & Marcus, A. 1994. Explaining preferences for public policy: Strategic and contextual determinants. Academy of Management Best Papers Proceedings: 319-323.
Olson, M. 1965. The logic of collective action. Cambridge, MA: Cambridge University Press.
OpenSecrets.org. 2012. Lobbying database. Center for Responsible Politics, Washington DC. http://www.opensecrets.org/lobby/index.php [January 12, 2012].
Peltzman, S. 1976. Toward a more general theory of regulation. Journal of Law and Economics, 19(2): 211-240.
Porter, M., & Reinhardt, F. 2007. Grist: A strategic approach to climate. Forethought. Harvard Business Review, 85(10): 22-26.
Ranganathan, J., Corbier, L., Bhatia, P., Schmitz, S., Gage, P., & Oren, K. 2004. The greenhouse gas protocol – A corporate accounting and reporting standard. World Business Council for Sustainable Development and World Resources Institute.

25
Reid, E. M. and M. W. Toffel: 2009, ‘Responding to Public and Private Politics: Corporate Disclosure of Climate Change Strategies’, Strategic Management Journal, 30: 1157–1178.
Reinhardt, F. 1999. Market failure and the environmental policies of firms. Journal of Industrial Ecology, 3(1): 9 21.
Richter, B.K., 2012. ‘Good’ and ‘Evil’: The relationship between corporate social responsibility and corporate political activity. Working Paper, Richard Ivey School of Business, University of Western Ontario.
Rivera, J. 2010. Business and public policy: Response to environmental and social protection processes. New York: Cambridge University Press.
Russo M. V. & Fouts, P. A. 1997. A resource-based perspective on corporate environmental performance and profitability. Academy of Management Journal, 40(3): 534-559.
Salamon, L. & Seigfried, J. 1997. Economic power and political influence: The impact of industry structure on public policy. The American Political Science Review, 71(3): 1026-1043.
Schuler, D. and Rehbein, K. 1997. The filtering role of the firm in corporate political involvement. Business and Society, 36: 116.
Schuler, D., Rehbein, K. & Cramer, R. 2002. Pursuing strategic advantage through political means: A multivariate approach. The Academy of Management Review, 45(4): 659-672.
Shaffer, B. 1995. Firm-level responses to government regulation: Theoretical and research approaches. Journal of Management, 21: 495–514.
Sharma, S. and Vredenburg, H. 1998. Proactive corporate environmental strategy and the development of competitively valuable organizational capabilities. Strategic Management Journal, 19: 729-753.
Sharma, S. 2000. Managerial interpretations and organizational context as predictors of corporate choice of environmental strategy. Academy of Management Journal, 43: 681-697.
Stigler, G. 1971. The theory of economic regulation. The Bell Journal of Economics and Management Science, 2(1): 3-21.
Vogel, D. 1996. The study of business and politics. California Management Review, 38(3): 146–165.
Vogel, D. 1995. Trading up: Consumer and environmental regulation in a global economy. Cambridge, Mass: Harvard University Press.
Williams, C.C. & Crawford, E.P. 2011. Influencing climate change policy: The effect of shareholder pressure and firm environmental performance. Business and Society, forthcoming.
Yoffie, D. 1987. Corporate strategy for political action: A rational model. In A. Marcus, A. Kaufman, & D. Beam (Eds.), Business Strategy and public policy: 92-111. New York: Quorum Books.

26
TABLES
Table 1 Climate change lobbying expenditures & GHG emissions by sector
Sector 2008 -2009 Lobbying (USD in thousands)
GHG Emissions (Tons CO2-e)
N Mean Min Max Mean
Automobiles & Parts 7 5252 180 13,500 836,759 Banks 1 200 200 200 10,164 Basic Resources 20 1754 30 5,570 7,623,982 Chemicals 19 1324 50 5,200 3,772,340 Construction & Materials 10 473 70 2,116 441,484 Financial Services 6 1042 80 3,580 298,511 Food & Beverage 11 1109 20 6,544 933,679 Healthcare 5 794 60 1,720 131,376 Industrial Goods & Services 53 2859 6 19,600 824,359 Insurance 3 4517 1480 8,460 28,242 Investment Instruments 0 0 0 0 359 Media 3 195 136 240 24,501 Oil & Gas 37 3555 5 26,600 6,508,602 Personal & Household Goods 7 579 170 1,415 429,589 Real Estate 3 230 20 400 26,891 Retail 5 817 130 1,750 343,838 Technology 24 1173 40 5,080 123,056 Telecommunications 0 0 0 0 128,655 Travel & Leisure 7 2129 110 5,440 3,295,664 Utilities 64 2145 5 27,800 25,300,000 Overall 285 2148 5 27,800 2,847,392
27
Table 2 Summary Statistics
Variable Variable Description N Mean Standard Deviation
Min Max
Expenditures (CPI)
Total annual lobby expenditures on issues related to current climate change legislation ($1000 USD) 285 2,145 3,935 5 27,800
Concentration Ratio (Compustat)
Market share of 4 largest firms in industry based on 3-digit naics code 988 0.38 0.19 0.19 1.00
Leverage (Compustat)
Total debt divided by total assets (logged) 988 -1.64 1.03 -4.61 0.34
Growth (Compustat)
Annual change in sales ratio (logged) 988 0.05 0.46 -12.68 1.43
Capital Intensity (Compustat)
Capital expenditures divided by total sales (logged) 988 -2.82 0.96 -5.88 0.64
Firm Performance (Compustat)
Return on Assets (ROA) 988 0.05 0.10 -0.85 0.41
Firm Size (Compustat)
Total assets (logged) 988 9.45 1.36 6.70 14.60
Resolutions (Risk Metrics)
At least one climate change or environment related resolution directed at firm 988 0.13 0.34 0.00 1.00
CA Firm headquartered in California 988 0.12 0.32 0 1 RGGI Firm headquartered in state participating in RGGI 988 0.24 0.43 0 1 RPS Firm headquartered in state which has enacted RPS legislation 988 0.71 0.45 0 1
GHG Emissions (Trucost)
GHG emissions directly emitted by the firm (log transformed and centered) 988 1.04 2.69 -5.35 7.66
GHG Emissions2
(Trucost) Quadratic transformed GHG emissions
988 8.30 11.51 0.00 58.67
Note: Data sources are in parentheses

28
Table 3 Correlation matrix
1 2 3 4 5 6 7 8 10 11 12 13 14 15
1 Selection 1.00
2 Expenditures 0.05 1.00
3 Concentration Ratio
-0.04 0.17 1.00
4 Leverage 0.08 -0.05 -0.08 1.00
5 Growth 0.03 -0.03 0.00 -0.05 1.00
6 Capital Intensity
0.28 0.00 -0.07 0.14 -0.02 1.00
7 Firm Performance
-0.01 -0.01 0.02 -0.26 0.12 0.02 1.00
8 Firm Size 0.14 0.54 -0.08 0.13 -0.14 -0.07 -0.17 1.00
10 Resolutions 0.11 0.38 0.08 0.03 -0.01 0.11 0.00 0.19 1.00
11 CA -0.07 0.16 -0.15 -0.25 0.05 -0.07 0.07 -0.06 -0.05 1.00
12 RGGI -0.14 0.03 -0.04 0.01 -0.07 -0.16 -0.02 0.11 -0.02 -0.21 1.00
13 RPS -0.12 0.02 -0.05 -0.10 0.02 -0.07 0.11 -0.01 -0.01 0.23 0.36 1.00
14 GHG Emissions
0.51 0.29 0.00 0.26 0.02 0.46 0.04 0.16 0.23 -0.14 -0.21 -0.15 1.00
15 GHG
Emissions2
0.46 0.33 -0.12 0.13 0.03 0.34 -0.05 0.22 0.20 -0.10 -0.16 -0.16 0.56 1.00
* All coefficients greater in absolute value that 0.06 are significant
29
Table 4 Heckman regression results
Model 1(a) 1(b) 2(a) 2(b) 1st Stage 2nd Stage 1st Stage 2nd Stage Variables
Concentration Ratio 0.18 3,737,361*** 0.18 3,750,501*** (0.716) (0.002) (0.720) (0.001) Log Leverage -0.12 -1018585*** -0.11 -770,579*** (0.248) (0.001) (0.295) (0.008) Growth 0.37 630,296 0.37 235,815 (0.295) (0.571) (0.307) (0.826) Capital Intensity 0.11 -12,476 0.11 137,656 (0.310) (0.960) (0.290) (0.568) Firm Performance 0.72 -4500534* 0.77 -3720208 (0.470) (0.056) (0.438) (0.102) Firm Size 0.13 2,016,022*** 0.14 1,969,708*** (0.143) (0.000) (0.118) (0.000) Resolutions 0.07 1,960,842*** 0.05 1,688,930*** (0.746) (0.000) (0.835) (0.000) CA -0.28 1,197,638 -0.28 1,430,960* (0.338) (0.123) (0.331) (0.057) RGGI -0.10 208,923 -0.09 581,168 (0.642) (0.740) (0.674) (0.342) RPS -0.08 71,589 -0.07 85,994 (0.664) (0.864) (0.702) (0.831) GHG Emissions 0.30*** -49,956 0.26*** -743,954*** (0.000) (0.737) (0.001) (0.000) GHG Emissions 2 0.01 134,984*** (0.418) (0.000) Sector Dummies Yes Yes Yes Yes Year Dummies Yes Yes Yes Yes Lambda 287,531 469,040 (0.747) (0.573) Observations 988 285 988 285 p-values in parentheses *** p<0.01, ** p<0.05, * p<0.1
30
Table 5 Heckman regression results (climate sensitive industries)
Model 3(a) 3(b) 4(a) 4(b) 1st Stage 2nd Stage 1st Stage 2nd Stage Variables
Concentration Ratio -1.13 -832,414 -0.91 163,926 (0.377) (0.806) (0.480) (0.958) Log Leverage -0.51* -1,255,305** -0.50* -865,442 (0.076) (0.045) (0.078) (0.137) Growth -4.81*** -124,454 -4.95*** -943,744 (0.000) (0.954) (0.000) (0.634) Capital Intensity 0.02 -345,394 0.05 -253,225 (0.923) (0.373) (0.759) (0.480) Firm Performance -1.92 1,112,394 -1.61 870,883 (0.412) (0.819) (0.473) (0.845) Firm Size -0.22 2,283,551*** -0.25 1,832,548*** (0.243) (0.000) (0.195) (0.000) Resolutions -0.42 2,253,564*** -0.55 1,734,131*** (0.221) (0.002) (0.125) (0.010) CA 0.01 2,866,605** 0.07 4,339,014*** (0.988) (0.037) (0.906) (0.001) RGGI -0.37 -1,608,788 -0.35 -1,710,345 (0.417) (0.181) (0.443) (0.125) RPS -0.32 -234,691 -0.31 -154,337 (0.277) (0.710) (0.298) (0.791) GHG Emissions 0.33*** 127,804 0.08 -2,445,673*** (0.000) (0.643) (0.717) (0.000) GHG Emissions 2 0.04 339,986*** (0.240) (0.000) Sector Dummies Yes Yes Yes Yes Year Dummies Yes Yes Yes Yes Lambda 1,704,492 1,176,080 (0.162) (0.301) Observations 262 146 262 146 p-values in parentheses
*** p<0.01, ** p<0.05, * p<0.1

31
FIGURES
Figure 1 Diagram of political issue salience versus issue performance
Figure 2 Graphical representation of curvilinear relationship between GHG emissions and lobby expenditures
10 12 14 16 18 20
40
00
60
00
80
00
GHG Emissions (log)
Exp
en
ditu
res
($1
,00
0's
US
)

32
APPENDIX
Table A. 1 Highest 10 lobbying firms in 2009
ICB Super Sector Company Amount
1 Oil & Gas Exxon Mobil Corp. $21,998,240
2 Industrial Goods & Services General Electric Co. $19,630,000
3 Oil & Gas Chevron Corp. $16,845,000
4 Oil & Gas ConocoPhillips $13,282,079
5 Utilities Southern Co. $10,962,500
6 Industrial Boeing Co. $8,875,000
7 Oil & Gas Marathon Oil Corp. $7,740,000
8 Industrial Goods & Services United Parcel Service Inc. $7,187,632
9 Automobiles & Parts General Motors Co. $7,170,000
10 Food & Beverage Monsanto Co. $6,544,000
Table A. 2 Highest 10 lobbying firms in 2008
ICB Super Sector Company Amount
1 Utilities PG&E Corp. $27,770,000
2 Oil & Gas Exxon Mobil Corp. $26,610,000
3 Industrial Goods & Services General Electric Co. $19,100,000
4 Utilities Southern Co. $15,030,000
5 Oil & Gas Chevron Corp. $14,889,000
6 Automobiles & Parts General Motors Co. $13,471,000
7 Utilities American Electric Power Co. $12,248,938
8 Industrial Goods & Services FedEx Corp. $8,895,000
9 Insurance American International Group $8,460,000
10 Automobiles & Parts Ford Motor Co. $8,355,000

33
Figure A. 1 Total and climate change-specific lobbying expenditures by sector
0 2.0e+06 4.0e+06 6.0e+06 8.0e+06 1.0e+07Expenditures (usd)
UtilitiesTravel & Leisure
TechnologyRetail
Real EstatePersonal & Household Goods
Oil & GasMedia
InsuranceIndustrial Goods & Services
HealthcareFood & Beverage
Financial ServicesConstruction & Materials
ChemicalsBasic Resources
BanksAutomobiles & Parts
Lobbying Expenditures (mean)
Climate Change Lobbying Total Lobbying

34
Supplemental Information
1) Paper title:
Corporate Environmental Performance and Political Activity 2) Filename: Delmas-nairn-Birch-Lobbying-ARCS-2013 3) Author(s) name and affiliation: Magali Delmas Institute of the Environment and Sustainability and Anderson School of Management UCLA
Nicholas Nairn-Birch Institute of the Environment and Sustainability UCLA 4) Presenter name: Magali Delmas 5) Primary contact name and e-mail (One person only): Magali Delmas [email protected] 6) Topic (10 words or less):
Corporate Environmental Performance and Political Activity 7) Preferences: Please indicate your preferences for presentation format by marking all of the formats for which you are interested in being considered. If you mark more than one option, the Conference Committee will match you with the format deemed best suited for your work. Faculty and doctoral students: X Please consider my paper for a presentation slot. _ Please consider my paper for a Research Sketch (egg-timer session). Additional options for doctoral students only: _ Please consider my paper for the poster session. _ Please consider my paper for a research roundtable on Research Questions and Hypotheses. _ Please consider my paper for a research roundtable on Research Methods.

35
8) Topic (please check those that apply): _ Accounting _ Certification Programs _ Creation and Development of Environmental Markets _ Economics _ Environmental Finance _ Innovation and Entrepreneurship _ Law and Ethics X Management/Strategy: economics oriented _ Management/Strategy: OB/OT/organizations oriented _ Marketing _ Operations/Supply Chain X Public Policy _ Real Estate _ Sustainable Resource Management _ Other (please specify) 9) Method (please check those that apply): _ Analytical Model _ De/Inductive Theory Building _ Empirical: qualitative X Empirical: quantitative _ Non-Empirical: qualitative _ Non-Empirical/Conceptual: qualitative _ Other (please specify)