Embed Size (px)
Citation preview

Supervised and Unsupervised methods to detect Insider Threatfrom Enterprise Social and Online Activity Data
Gaurang Gavai1∗, Kumar Sricharan1, Dave Gunning1, John Hanley1, Mudita Singhal1, and Rob Rolleston2
1Palo Alto Research Center, Palo Alto CA 94304 USA{ggavai, skumar, dgunning, jhanley, msinghal}@parc.com2Palo Alto Research Center East, Webster NY 14580 USA
Abstract
Insider threat is a significant security risk for organizations, and detection of insider threat is ofparamount concern to organizations. In this paper, we attempt to discover insider threat by analyzingenterprise social and online activity data of employees. To this end, we process and extract relevantfeatures that are possibly indicative of insider threat behavior. This includes features extracted fromsocial data including email communication patterns and content, and online activity data such as webbrowsing patterns, email frequency, and file and machine access patterns. Subsequently, we taketwo approaches to detect insider threat: (i) an unsupervised approach where we identify statisticallyabnormal behavior with respect to these features using state-of-the-art anomaly detection methods,and (ii) a supervised approach where we use labels indicating when employees quit the company asa proxy for insider threat activity to design a classifier. We test our approach on a real world data setwith artificially injected insider threat events. We obtain a ROC score of 0.77 for the unsupervisedapproach, and a classification accuracy of 73.4% for the supervised approach. These results indicatethat our proposed approaches are fairly successful in identifying insider threat events. Finally, webuild a visualization dashboard that enables managers and HR personnel to quickly identify employ-ees with high threat risk scores which will enable them to take suitable preventive measures and limitsecurity risk.
Keywords: Anomaly detection, insider threat detection, quitting detection, enterprise social data
1 Introduction
Insider threats are threats with malicious intent directed towards organizations by people internal to theorganization. These include physical sabotage activities, theft of confidential data and business secrets,and fraud. Insider threat activities pose a severe challenge to the well-being of an organization, and it isnaturally critical for organizations to guard against such events.
For these reasons the insider threat detection problem has been studied extensively [1]. This in-cludes work done in the cyber-security realm, social science, business management and other relevantareas. Recently, we have seen the advent of data analytics based methods for identifying insider threatevents. Compared to the traditional approaches of post-attack analysis and subsequent change of policy,predicting threats from data offers the benefit of continuous and in-time evaluation. It circumvents thevarious issues plaguing the traditional approach such as their significant administrative overhead andtheir infrequency. The questions here are rather, how strongly a real-world insider threat event correlateswith enterprise data traces, and whether the prediction is reliable enough to serve the purpose of riskmanagement.
Journal of Wireless Mobile Networks, Ubiquitous Computing, and Dependable Applications, volume: 6, number: 4, pp. 47-63∗Corresponding author: Tel: +1-(650)-812-4760
47

Insider Threat Detection from Enterprise Data Gavai et al
To this end, we have developed a privacy preserving feature extraction approach to capture a rich setof online behaviors that can be indicative of insider threat behavior, with each of these features beingfree of personally identifiable information.[2] Next, we take two approaches to detecting insider threat:(i) we have applied a state-of-the-art unsupervised anomaly detection method called isolation forest [3]to identify anomalous events and (ii) we have developed a classifier that uses labels of employees whohave quit the organization as a proxy for potential insider threat activity. The use of quitting labels asproxy for insider threat activity is reasonable in light of analysis that quitting prediction may also informrisk management. For instance, Infosecurity Magazine [4] reports that “50% of job leavers are likely tosteal confidential company data”.
Unsupervised methods for insider threat detection include the work done by Mathew et al. [5] basedon user access patterns, the work of Eberle et al. [6] on using social graphs, and several papers based onbehavioral models [7, 8, 9]. Hoda et al. [10] detect peer groups of users and modeling user behavior withrespect to these peer groups, and subsequently detect insider activity by identifying users who deviatefrom their peers with respect to the user behavior models. There have also been various approachesbased on detection of specific insider threat scenarios [11, 12]. Our approach is based on design of novelfeatures from enterprise data that are reflective of insider threat behavior, and subsequent analysis of thisdata to identify inconsistent, statistically rare behavior that can be indicative of insider threat activity [2].Our method differs from the work of Eberle et al. in that they focus only on social graphs, while ourfeatures are more inclusive. Similarly, Mathew et al. focus only on user access patterns. Also, the workby [11, 12] focuses on specific scenarios only, and as a result, they will be unable to detect previouslyunknown insider threat scenarios. In contrast, our method can detect previously unknown types of insiderthreat activity because our method is based on identifying statistically abnormal behavior and is notreliant on having prior knowledge of insider threat scenarios. Finally, our approach differs from thework by [7, 8, 9, 10] in that our approach does not require the estimation of normal behavior models.Rather, our method directly identifies statistically abnormal behavior. A closely related body of workto our paper is the work by Young et al. [13], who also employ anomaly detection methods to detectinsider activity. Our work differs from theirs in that they determine anomalies only by contrasting userattributes against their peers at every time instance, while we also detect insider activity by identifyingabnormal changes in user attributes over time. This helps us to also identify users whose behavior mightappear normal at every time instance when looked at individually but exhibit anomalous trends acrosstime, possibly indicating insider activity. This concept of across-time consistency is describe in detail inthe paper by Hoda et al. [14].
On the other hand, for the supervised approach, the employee churn problem has been studied exten-sively by business management, economists, psychologists, and social scientists. Ample broad findingscan be found in the literature. For instance, company size, industry and pay scales play a key role indetermining attrition rate. Industries that largely employ unskilled labor have a higher rate of attrition ascompared to those that largely require skilled labor. Attrition rate is also highest amongst the lowest pay-ing jobs. While these findings provide many qualitative insights, they have not yet reached the level ofmathematical predictors that can be deployed to perform churn analysis and prediction. Our earlier work[15] has made a first attempt at using a data-driven approach to study the problem of predicting attritionwithin an organization. We have constructed models to predict if and when an employee is likely to quitthe company using email features. In this paper we extend the analysis to a broader set of data: posts,messages, and group conversations within a much more comprehensive social space. Another piece ofrelated work is described in [16]. The authors use LinkedIn data to provide job-switching recommenda-tions to users. Their work models a user’s tenure in their current employment with a proportional hazardmodel, and uses it to decide when to provide job recommendations. In a sense this is the opposite ofwhat we are trying to do.
48

Insider Threat Detection from Enterprise Data Gavai et al
Pros and Cons between supervised and unsupervised approachesSupervised approach Unsupervised approach(p) Higher precision rate (wrt quitting) (p) Higher recall rate(c) Optimized wrt quitting instead of insiderthreat
(c) Unsupervised approach detects all abnor-mal behavior
Table 1: Table listing pros and cons of the two methods. (p) indicates pros and (c) indicates cons
Next, we contrast and compare the supervised and unsupervised approaches. For the unsupervisedapproach, given that we are employing statistical anomaly detection methods on a broad set of features,not all anomalies that are detected will necessarily be related to insider threat activity. However, thebroad feature selection ensures that our recall rate will remain high, at the cost of lower precision. Onthe flip side, the supervised method has higher precision, but with respect to the quitting behavior whichis only a proxy for possible insider threat activity. The two methods therefore complement each other.The pros and cons of these methods are summarized in Table 1.
We test our dual-pronged approach on a real world data set named ’Vegas’. The Vegas data setis a proprietary collection of social and activity data traces such as email, work practice logs, recordsof file access, device usage, and web browsing patterns for all employees belonging to a sub-divisionof a large corporate organization. Social communications between the employees such as email andinstant messages are an important part of this data set. In order to use this data set for evaluating insiderthreat detection capabilities, insider threat activity behavior is artificially injected into the data via acollection of red team users [2]. Details about this artificial injection process are given in Section 2 andthe Appendix.
We obtain a ROC score of 0.77 for the unsupervised anomaly detection approach and an accuracyscore of 73.4% using the supervised approach on Vegas. Given the difficulty of the insider threat detec-tion problem, these results are fairly encouraging. Finally, we build a visualization dashboard that chartsthe predicted anomaly scores for all the employees in an organization. This dashboard makes it easy forend-user analysts to quickly identify users with high anomaly risk in order to take suitable preventivemeasures.
The rest of this paper is organized as follows. We describe data cleaning and pre-processing steps andour privacy preserving feature extraction approach in Section 2. The unsupervised anomaly detectionmethod, the supervised classification method, and the corresponding results are described in Sections3, 4, and 5, respectively. We describe our visualization dashboard in Section 5 and finally, give ourconclusions in Section 6.
2 Feature extraction and data
We ran our experiments on a real-world dataset which we refer to from here on as Vegas. It was specif-ically collected in order to evaluate detection methods for insider threat activity1. This multi-domainemployee dataset containing many modalities of employee information (emails, application logs, logininformation, business unit hierarchy, etc.) was sourced from a single business unit of a larger organi-zation. It is measured over 10 months, from October 2013 through July 2014, and comprised of 6805distinct users with over a billion user activity records.
1http://www.networkworld.com/article/2220363/security/darpa-expands-insider-threat-research.html
49

Insider Threat Detection from Enterprise Data Gavai et al
Figure 1: Example Sub-tree in Hierarchy. Each node represents a user and red nodes are quitters.
The CERT organization from SEI was tasked with the job of intelligently inserting syntheticallycreated malicious events corresponding to a subset of ”red team” users into the data. The team employedvarious complicated models to make the fictional scenarios mirror real world ones as closely as possible.[17]. Additionally, to ensure that algorithms were being tuned to find anomalous data and not justartificial data, benign events were injected as part of user histories as well. The full list of scenarios andtheir descriptions can be found in Appendix A of the paper. The aim of unsupervised methods in thispaper is to find these Red Team users.
For our supervised approach, we used the employees who quit the company as a proxy for insiderthreat [18]. We framed the problem formally as: For a given user U and a day index T , predict if that userU will quit company at some time instance T by studying the user’s activity from Tbegin up to T [18]. Wewere provided daily hierarchy snapshots of the business by the company and we used the quitting labelsfrom these to identify the quitters. Additionally there were a few users whose IDs were removed withoutexplanation from the hierarchy snapshots with all records of their various activities ceasing to exist fromthat point. We treated these users as quitters too but labeled them differently as pseudo-quitters since wehave no formal record of them quitting. We identified 555 quitters and 1270 pseudo-quitters in the data.
2.1 Pre-processing
The organization that provided us the data from it’s business unit had several privacy concerns due to it’ssensitive nature. To alleviate these, we created a security protocol in conjunction with the organization toensure that the required level of anonymization was maintained across all our experiments. This howeverdid lead to some reconstruction issues [2].
We also needed to build a hierarchy of the employees within the business unit in conjunction withthe features that we wanted to create. To achieve this, we used the snapshots of daily hierarchies that wehad access to and constructed a normalized version over time in which the most persistent relationshipsbetween employees and their direct supervisors were maintained. Unfortunately, since the business unitwe were studying did not include any of the highest levels of the organization, this resulted in over 200distinct, disconnected sub-trees as opposed to a single structured tree. We selected a few, coherent onesfrom these for comparative and visualization purposes. An example of these can be seen in Figure 1.
2.2 Features
An employee’s electronic presence, or at least it’s most important aspects, can be encapsulated in theiremail, web, login and application usage behavior. Consequently, this implies that most insider threatactivity or anomalous behavior with an electronic footprint can be detected from features constructedfrom employee traces in these information domains.
To aid our feature design process, we also conducted interviews with recent job quitters [18]. Weinterview 12 people with varied job roles and gained various insights which varied from easily intuitive
50

Insider Threat Detection from Enterprise Data Gavai et al
Table 2: Vegas features.Email Usage FeaturesEmails Sent/Read Weekly CountNo. of Emails sent at DaytimeNo. of Emails sent at NightNo. of Emails read at DaytimeNo. of Emails read at NightEmail Content FeaturesNo. of exclamation marks, question marks,multiple marks, ellipses, commas, semi-colonsdashes, double dashes, brackets, colonsAvg Word Length in SubjectAvg Character Length in SubjectAvg Word Length in ContentAvg Character Length in ContentLog-on log-off FeaturesNo. of log-onsNo. of log-offsNo. of hours with log-on activityNo. of hours with log-off activityActivity FeaturesNo. of activity typesMax contiguous hours spent on activityNumber of activitiesTime spent on Email appsTime spent on Productivity appsTime spent on Web appsTime spent on Engineering appsWeb Usage FeaturesTotal time spent on websitesTime spent on career sites, web mail,entertainment sites, internal social media,internal sites, news sites, search sites,private social media, tech sites
to considerably counter-intuitive. This drove the formulation of our email content feature set [18]. Someof the insights we gained were:
• Increased use of career sites.
• Increased use of personal email (for job applications).
• Decreased attention span at work resulting in more constant task switching.
• Efforts are often made by quitters to maintain normal behavior at work resulting in a more neutralsentiment in emails.
• Shortened work hours while seeking a new job to make time for interviews, but regular hours inthe last few weeks once a new job was found.
51
Insider Threat Detection from Enterprise Data Gavai et al
Using the afore-mentioned insights, we engineered a total of 42 features over five domains or cat-egories: email usage, email content, log-on log-off behavior, application activity and web activity. Weexplicitly note that this feature set is general and applicable to datasets and scenarios other than Vegas.The full set of features are listed in Table 2. We describe each of these five categories in further detailbelow.
We calculate features for each user U with respect to each individual day indexed by T . Thus forevery (U,T ) tuple here, the corresponding value of each feature was on a daily basis. There were a num-ber of motivations for doing so including allowing the dataset to evince activity between and outside setwork hours and contrast the difference between different types of days (weekdays/weekends/holidays).
(i) Email Usage Features: The email usage features describe how users manage communicating topeople within and outside the business unit using their business email portal. They are aggregated on adaily basis and can be used to capture evidence of abnormal collusion, since many Red Teams eventshinge on the same. An unnatural increase in the flow or volume of email either in terms of time or peoplecould be indicative of the same. Example Scenarios: Insider Startup, Indecent RFP
(ii) Email Content Features: The email content features are created from the body of the emailsthat were sent by business unit users to people both within and outside the unit. The email usage featuressection covers the reasons one would want to capture abnormal collusion by business unit users. Content-based methods such as sentiment analysis and speech act scores would greatly aid in being able todiscern the modality of this abnormal communication and how much it deviates from the norm. Thereare some daily aggregated count features for punctuation marks etc. that are calculated in order to beable to capture changes in writing style that may occur as a result of users attempting to cover theirmalicious tracks. Their inclusion is further justified in this scenario since recall is valued much higherover precision. Example Scenarios: Indecent RFP, Czech Mate
(iii) Web Browsing Usage Features: The web browsing usage features describe the categorizedbrowsing histories of Vegas users. We constructed categories of websites and ascribed popular variantsof each kind to the category. Then we calculated the daily aggregated time spent by individual employeesin each category. For example, time spent on career sites, email sites, news sites, social media sites,etc. Time spent on non-job related sites could be a useful barometer to the level of disengagement ofemployees and the flux therein can capture the variance in the degree of satisfaction they derive fromtheir jobs. More dissatisfied employees have a greater likelihood of being an insider threat [4]. ExampleScenarios: Naughty By Proxy, Hiding Undue Affluence
(iv) Application Activity Features: The application activity features log the usage of different cat-egories of applications by employees. Application codes were divided into four classes: Email, Web,Productivity, and Engineering. Email and Web refer to application clients used for the same whereas Pro-ductivity includes note-taking, document manipulation, calculators etc and Engineering revolves aroundcoding/ programming tools. We aggregated the time spent in each category on a daily basis. This cate-gory was created to capture insider threat scenarios that involve employees using permitted applicationsfor excessive periods of time that may indicate them committing actions outside their job duties. ExampleScenarios: Masquerading, Masquerading 2
(v) Employee Log-on/Log-off Features: The log-on/log-off features are derived from the sign-insof employees. They are aggregated on a daily basis as the number of hours with such activity and the totalnumber of log-ons and log-offs. Insiders are more likely to commit their activities at odd times whenthere are less people physically present so as to avoid being detected or perhaps conversely suddenlybecome extremely punctual to avoid detection. This subset of features was created to evince such fluxeither with respect to the employee’s own past history or with respect to their peers in the organization.Example Scenarios: Stealing Login Credentials, Exfiltration Prior to Termination
We cast a wider net of features than those that can be directly correlated to quitting behavior or insiderthreat activity, because the aim of our analyses is a high recall rate, regardless of it being at the cost of
52

Insider Threat Detection from Enterprise Data Gavai et al
Figure 2: Framework for identifying anomalous users and quitters.
Figure 3: Quitter Prediction ROC curve for Vegas. x-axis is ’false positive rate’, y-axis is the ’truepositive rate’. The area under the ROC curve is 0.77.
a loss in precision. At the same time, the list of features is non-exhaustive due to numerous anonymityand privacy related constraints imposed on us by the organization owning the data.
In the next two sections, we describe our unsupervised and supervised approaches that exploit thesefeatures to detect insider threat. The framework of our analyses to predict insider threat is illustrated inFigure 2.
3 Unsupervised Approach: Insider Threat Detection
In this section, we describe our analyses in identifying users who likely pose an insider threat to theorganization. We do so using the set of features that were identified and constructed in the previoussection. Since it is exceedingly difficult in real-world insider threat scenarios to obtain ground truth forsuch activity, we pose this prediction problem as an unsupervised one. We state the formal problemstatement of this experiment as: “At any given time instance, given their past online activity, predictif an employee is behaving abnormally either with respect to to his past activity, or with respect to thebehavior of his peers.” [2]
53

Insider Threat Detection from Enterprise Data Gavai et al
Figure 4: Comparison of histograms of daily rank using iForest method. Observe that the red team eventson average have a higher rank (lower numerical value is considered to be higher rank e.g. 2 is a higherrank than 5 ), i.e., iForest assigns a majority of the red team events a high rank.
3.1 Feature manipulation
As mentioned previously, the Vegas dataset encompasses nU = 6805 users from October 2013 to July2014 (a period of 10 months) and can be specified as covering nT = 302 days. Additionally, the setof features we constructed in the previous section comprises nK = 42 distinct features. Thus, we canrepresent our entire feature set F as a tensor with dimensions as nU ×nK×nT .
Our aim is to use F and determine two distinct anomalous behaviors in the data set. Namely:
1. behavior of a user that is anomalous with respect to their peers
2. behavior of a user that is anomalous with respect to their own past activity
In order to do this, we used the feature set F to construct a data set D. We did this by populating thedata set D with nT matrices M(T ) for T = 1, . . . ,nT . Every M(T ) matrix is of the dimensions nU ×3nK .We construct these M(T ) matrices using the equations enumerated below:
1. Average:
M1(T ) =∑
Ti=1 F [:, :, i]
T.
2. Weighted average:
M2(T ) =∑
Ti=1 F [:, :, i]exp [(i−T )2/σ2]
T.
3. Weighted difference:
M3(T ) =∑
Ti=1(F [:, :, i]−F [:, :, i−1])exp [(i−T )2/σ2]
T,
54

Insider Threat Detection from Enterprise Data Gavai et al
where F [:, :,0] is set to 0, and σ is a weight parameter that controls the influence of past time instances.Here, we use σ = 1. We can easily observe that the M1(T ),M2(T ) and M3(T ) matrices are all of thesame dimensions namely, nU×nK . The intuition here is that the matrices M1(T ) and M2(T ) are effectivein contrasting every user U with respect to their peers in the organization on the basis of the average ofall past behavior and only recent past behavior with respect to each time instance respectively. Comple-mentarily, the matrix M3(T ) is useful in capturing anomalous behavior of every user with regards to theaverage of their own past behavior.
We denote M(T ) = [M1(T ),M2(T ),M3(T )] for each T = 1, ..,nT . Thus, one can see that consideringevery M(T ), and applying the anomaly detection algorithm for the same, will result in us being able toidentify both previously declared modalities of a user’s anomalous behavior.
3.2 Anomaly detection algorithm
The algorithm used in the previous sub-section to detect the two types of anomalies in each time-stepusing the three matrix variants of the features is a modified version of the isolation forest algorithm [3],which is the current state-of-the-art in anomaly detection. We describe the algorithm in more detail here.This algorithm can be used to detect statistical anomalies in data. It does so by constructing a forest ofisolation trees which are basically binary trees. These trees grow by recursively partitioning the data byselecting a threshold for a randomly picked feature from the set at every node. This process continuestill each individual point in the data set is isolated in a leaf. Every point is ascribed a score that relates tothe average number of splits required over the forest of isolation trees to isolate it into a leaf node.
Our modification to this algorithm is in that we not only identify the anomalous points that arise fromthe averaging across the forest, but also record the corresponding features that are the reason for theirisolation. Our method to do so is to aggregate the extent to which every feature in every dimension ofevery tree isolates a point. We use this modified isolation forest and apply it to the previously constructedM(T ) sets at every time instance to generate a ranking of users at said instance. Due to our modification,we also have a motivation of why each anomalous user was flagged in terms of the feature that indicatedso. We obtain this daily ranking by sorting in descending order the anomaly scores that the isolationforest generates from the M(T ) sets.
3.3 Evaluation
In this unsupervised approach, we only use the labels from the red team ground truth to evaluate theresults of our modified isolation forest algorithm. To do so, we compare the red team member’s dailyranks at every time instance to the non-red team members’. The histograms from this comparison areshown in Figure 4. We can clearly evince from these histograms that our modified isolation forest methodis indeed successful in the identification of a majority of the anomalous insider threats since it assignsthem a higher daily rank. Since the algorithm assigns a majority of the target events from the red teampopulation high ranks, it is indicative of the fact that it can effectively identify insider threat activity ona conceptual level. Conversely, if the algorithm was not able to do so, the resulting histograms for bothpopulations would have looked like the histogram of non-red team users does now. That is, the ranksassigned across the population would have been identically uniform. The most informative features, onthe basis of the modified feature descriptor in the algorithm, were found to be the features derived fromthe content of employee emails.
The resulting ROC curve from the daily ranks of users (with an encouragingly high area under theROC curve of 0.77 given the undefined, variegated nature of the anomalies we are trying to find) gener-ated by the modified isolation forest algorithm is shown in Figure 5.
55

Insider Threat Detection from Enterprise Data Gavai et al
4 Supervised Approach: Quitting Detection
In this section, we describe our quitting analyses on the Vegas dataset using those instances in our datawhere user U quits in time T , T +1 or T +2 as the quitting label of the positive class. [18]
Out of the 6805 users in Vegas that represent a unit of the large organization we are studying, thereare totally 555+ 1270 = 1825 users + pseudo-quitters that quit at some point in the 10 months of datawe possess. Approximately, this results in around ∼ 6K instances of the positive class, and ∼ 1M (U,T)instances of the negative class.
4.1 Feature importance
Primarily, we needed to identify the subset of features from our exhaustive set that were the most infor-mative or important. To that end, we computed the mutual information (MI) [19] of the target positiveclass labels and each feature individually. The number of bits on average conveyed by an individualfeature with regards to the target label is known as mutual information. The results of this informationanalysis indicated that the set of email content features or features that were derived from the contentbody of employee emails were the most informative with regards to the task of predicting quitters.
4.2 Classification
We set up the Vegas quitter prediction problem in a time-ordered fashion, The training set used to builda model for the prediction task was the first three months from October to December of 2013. The testdata set was from January to July 2014. The model built from the training data was applied to this testset. We trained a number of classifiers on the training set and from that collection the best performingclassifier relative to the set were random forests [20]. We used the random forests algorithm and createda model that was then applied to the test set and ran many iterations of the procedure so that we mayaccount for the randomness existing in sampling. The classifier’s resulting confusion matrix is shown inTable 3. The resulting normalized accuracy was 73.4%, and the recall rate was 72%. The ROC curvethat corresponds to this experiment with an area under the curve of 0.76 is shown in Figure 5.
Table 3: Normalized confusion matrix for company quitter prediction on imbalanced data in Vegas.
PredictionClass Normal Quit
Trut
h Normal 37.3 12.7Quit 13.9 36.1
5 Visualization
The analyses we presented in the previous section outputs a threat score for the anomaly detection pieceand form the quitting detection piece, the likelihood of quitting for every user U at every time instanceT . However as mentioned before, these scores are not important independently, but in comparison withthe user’s own history and that of their peers. For example, if an entire team is working to fulfill adeadline, all their scores would indicate a high level of anomalousness. Similarly, an employee witha non-traditional job role may show high anomalousness consistently. To make it easier to compare
56
Insider Threat Detection from Enterprise Data Gavai et al
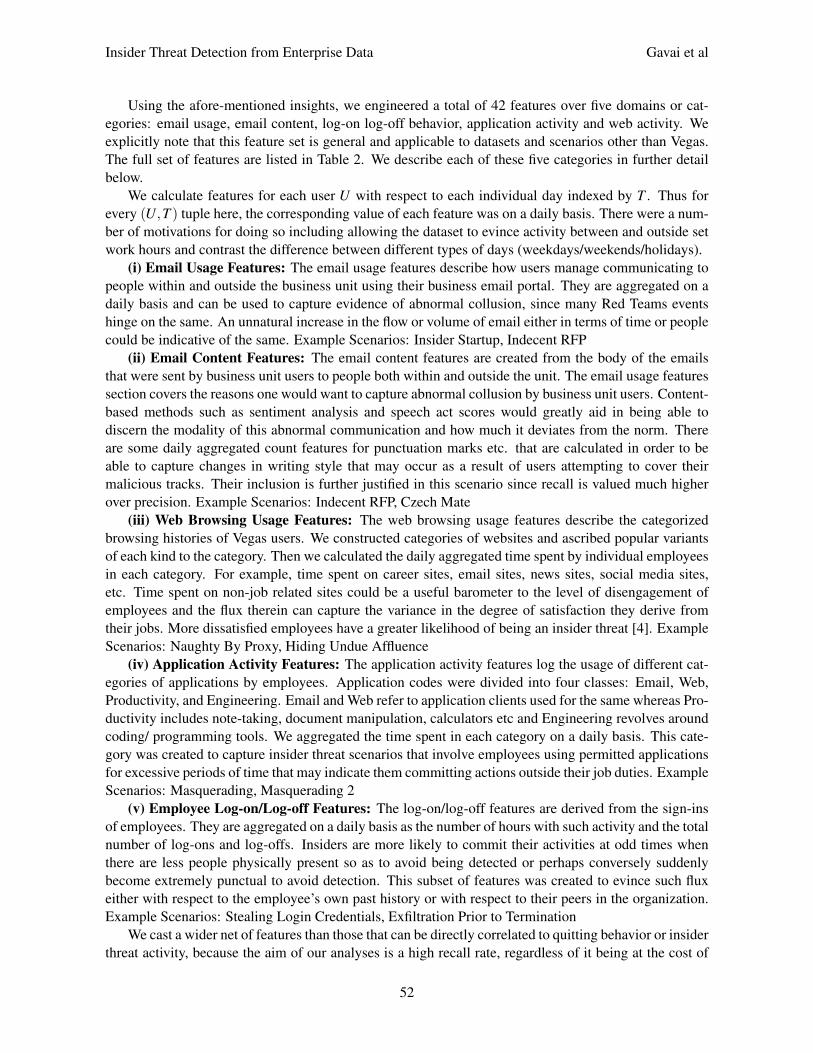
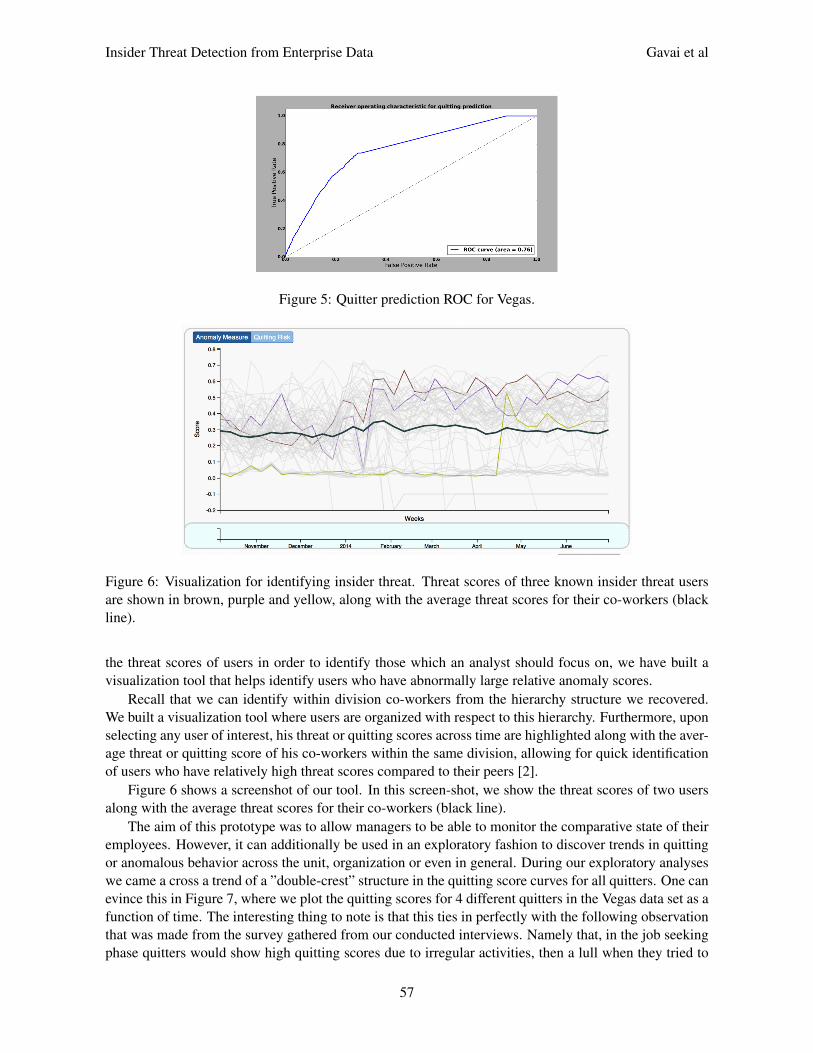
Figure 5: Quitter prediction ROC for Vegas.
Figure 6: Visualization for identifying insider threat. Threat scores of three known insider threat usersare shown in brown, purple and yellow, along with the average threat scores for their co-workers (blackline).
the threat scores of users in order to identify those which an analyst should focus on, we have built avisualization tool that helps identify users who have abnormally large relative anomaly scores.
Recall that we can identify within division co-workers from the hierarchy structure we recovered.We built a visualization tool where users are organized with respect to this hierarchy. Furthermore, uponselecting any user of interest, his threat or quitting scores across time are highlighted along with the aver-age threat or quitting score of his co-workers within the same division, allowing for quick identificationof users who have relatively high threat scores compared to their peers [2].
Figure 6 shows a screenshot of our tool. In this screen-shot, we show the threat scores of two usersalong with the average threat scores for their co-workers (black line).
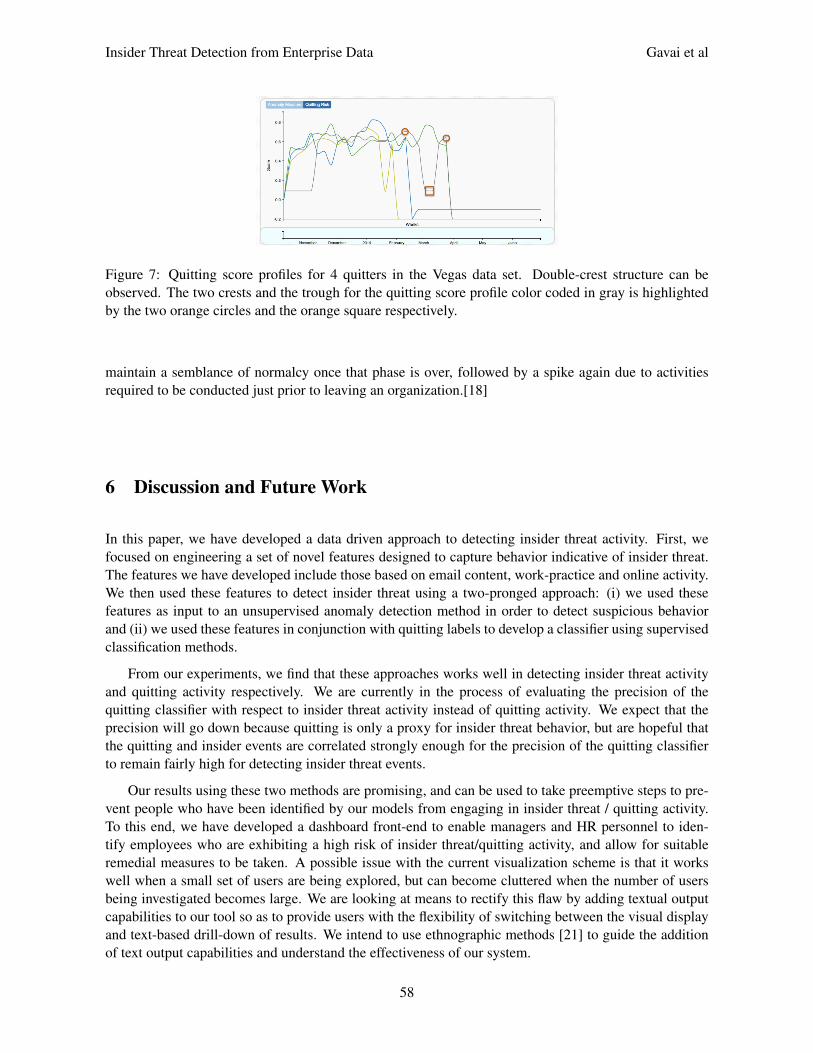
The aim of this prototype was to allow managers to be able to monitor the comparative state of theiremployees. However, it can additionally be used in an exploratory fashion to discover trends in quittingor anomalous behavior across the unit, organization or even in general. During our exploratory analyseswe came a cross a trend of a ”double-crest” structure in the quitting score curves for all quitters. One canevince this in Figure 7, where we plot the quitting scores for 4 different quitters in the Vegas data set as afunction of time. The interesting thing to note is that this ties in perfectly with the following observationthat was made from the survey gathered from our conducted interviews. Namely that, in the job seekingphase quitters would show high quitting scores due to irregular activities, then a lull when they tried to
57
Insider Threat Detection from Enterprise Data Gavai et al
Figure 7: Quitting score profiles for 4 quitters in the Vegas data set. Double-crest structure can beobserved. The two crests and the trough for the quitting score profile color coded in gray is highlightedby the two orange circles and the orange square respectively.
maintain a semblance of normalcy once that phase is over, followed by a spike again due to activitiesrequired to be conducted just prior to leaving an organization.[18]
6 Discussion and Future Work
In this paper, we have developed a data driven approach to detecting insider threat activity. First, wefocused on engineering a set of novel features designed to capture behavior indicative of insider threat.The features we have developed include those based on email content, work-practice and online activity.We then used these features to detect insider threat using a two-pronged approach: (i) we used thesefeatures as input to an unsupervised anomaly detection method in order to detect suspicious behaviorand (ii) we used these features in conjunction with quitting labels to develop a classifier using supervisedclassification methods.
From our experiments, we find that these approaches works well in detecting insider threat activityand quitting activity respectively. We are currently in the process of evaluating the precision of thequitting classifier with respect to insider threat activity instead of quitting activity. We expect that theprecision will go down because quitting is only a proxy for insider threat behavior, but are hopeful thatthe quitting and insider events are correlated strongly enough for the precision of the quitting classifierto remain fairly high for detecting insider threat events.
Our results using these two methods are promising, and can be used to take preemptive steps to pre-vent people who have been identified by our models from engaging in insider threat / quitting activity.To this end, we have developed a dashboard front-end to enable managers and HR personnel to iden-tify employees who are exhibiting a high risk of insider threat/quitting activity, and allow for suitableremedial measures to be taken. A possible issue with the current visualization scheme is that it workswell when a small set of users are being explored, but can become cluttered when the number of usersbeing investigated becomes large. We are looking at means to rectify this flaw by adding textual outputcapabilities to our tool so as to provide users with the flexibility of switching between the visual displayand text-based drill-down of results. We intend to use ethnographic methods [21] to guide the additionof text output capabilities and understand the effectiveness of our system.
58

Insider Threat Detection from Enterprise Data Gavai et al
Acknowledgment
This research is funded in part by DARPA/ADAMS program under contract W911NF-11-C-0216. Anyopinions, findings, and conclusions or recommendations in this material are those of the authors and donot necessarily reflect the views of the government funding agencies.
References[1] T. F. Lunt, “A survey of intrusion detection techniques,” Computers & Security, vol. 12, no. 4, pp. 405–418,
1993.[2] G. Gavai, K. Sricharan, D. Gunning, R. Rolleston, M. Singhal, J. Hanley, and R. Rolleston, “Detecting
insider threat from enterprise social and online activity data,” in Proc. of the 7th ACM CCS InternationalWorkshop on Managing Insider Security Threats (MIST’15), Denver, Colorado, USA. ACM, October 2015,pp. 13–20. [Online]. Available: http://dx.doi.org/10.1145/2808783.2808784
[3] F. T. Liu, K. M. Ting, and Z.-H. Zhou, “Isolation forest,” in Proc. of the 8th IEEE International Conferenceon on Data Mining (ICDM’08), Pisa, Italy. IEEE, December 2008, pp. 413–422.
[4] Infosecurity Magazine, “50% job leavers steal confidential company data,” http://www.infosecurity-magazine.com/view/26986/50-job-leavers-steal-confidential-company-data-/, July 2012,[Online; Accessed on December 10, 2015].
[5] S. Mathew, M. Petropoulos, H. Q. Ngo, and S. Upadhyaya, “A data-centric approach to insider attackdetection in database systems,” in Proc. of the 13th International Symposium on Recent Advances inIntrusion Detection (RAID’10), Ottawa, Ontario, Canada, LNCS, vol. 6307. Springer Berlin Heidelberg,September 2010, pp. 382–401. [Online]. Available: http://dx/doi.org/10.1007/978-3-642-15512-3 20
[6] W. Eberle, J. Graves, and L. Holder, “Insider threat detection using a graph-based approach,” Journal ofApplied Security Research, vol. 6, no. 1, pp. 32–81, 2010.
[7] M. Kandias, A. Mylonas, N. Virvilis, M. Theoharidou, and D. Gritzalis, “An insider threat predictionmodel,” in Proc. of the 7th International Conference on Trust, Privacy and Security in Digital Business(TrustBus’10), Bilbao, Spain, LNCS, vol. 6264. Springer Berlin Heidelberg, August 2010, pp. 26–37.[Online]. Available: http://dx.doi.org/10.1007/978-3-642-15152-1 3
[8] F. L. Greitzer, L. J. Kangas, C. F. Noonan, and A. C. Dalton, Identifying at-risk employees: A behavioralmodel for predicting potential insider threats. Pacific Northwest National Laboratory Richland, WA, 2010.
[9] G. Magklaras and S. Furnell, “Insider threat prediction tool: Evaluating the probability of it misuse,” Com-puters & Security, vol. 21, no. 1, pp. 62–73, 2001.
[10] H. Eldardiry, E. Bart, J. Liu, J. Hanley, B. Price, and O. Brdiczka, “Multi-domain informationfusion for insider threat detection,” in Proc. of the IEEE 2013 Security and Privacy Workshops(SPW’13), San Francisco, California, USA. IEEE, May 2013, pp. 45–51. [Online]. Available:http://dx.doi.org/10.1109/SPW.2013.14
[11] R. F. Mills, M. R. Grimaila, G. L. Peterson, and J. W. Butts, “A scenario-based approach to mitigating theinsider threat,” DTIC Document, Tech. Rep. ADA545628, 2011.
[12] A. Memory, H. G. Goldberg, and E. Ted, “Context-aware insider threat detection,” in Proc. of Workshops atthe 27th AAAI Conference on Artificial Intelligence (AAAI-13), Bellevue, Washington, USA. the Associationfor the Advancement of Artificial Intelligence, July 2013, pp. 44–47.
[13] W. T. Young, A. Memory, H. G. Goldberg, and E. Ted, “Detecting unknown insider threat scenarios,” inProc. of the IEEE 2014 Security and Privacy Workshops (SPW’14), San Jose, California, USA. IEEE, May2014, pp. 277–288. [Online]. Available: http://dx.doi.org/10.1109/SPW.2014.42
[14] H. Eldardiry, K. Sricharan, J. Liu, J. Hanley, O. Brdiczka, B. Price, and E. Bart, “Multi-source fusion foranomaly detection: using across-domain and across-time peer-group consistency checks,” JJournal of Wire-less Mobile Networks, Ubiquitous Computing, and Dependable Applications (JoWUA), vol. 5, no. 2, pp.39–58, June 2014.
[15] A. Patil, J. Liu, J. Shen, O. Brdiczka, and J. Gao, “Modeling attrition in organizations fromemail communication,” in Proc. of the 2013 IEEE International Conference on Social Computing
59

Insider Threat Detection from Enterprise Data Gavai et al
(SocialCom’13), Alexandria, Virginia, USA. IEEE, September 2013, pp. 331–338. [Online]. Available:http://dx.doi.org/10.1109/SocialCom.2013.52
[16] J. Wang, Y. Zhang, C. Posse, and A. Bhasin, “Is it time for a career switch?” in Proc. of the 22nd InternationalWorld Wide Web Conference (WWW’13 ), Rio de Janeiro, Brazil. ACM, May 2013, pp. 1377–1387.
[17] J. Glasser and B. Lindauer, “Bridging the gap: A pragmatic approach to generating insider threat data,” inProc. of the IEEE 2013 Security and Privacy Workshops (SPW’13), San Francisco, California, USA. IEEE,May 2013, pp. 98–104.
[18] K. Sricharan, G. Gavai, D. Gunning, R. Rolleston, M. Singhal, J. Hanley, J. Liu, and O. Brdiczka, “Detect-ing employee churn from enterprise social and online activity data,” in Proc. of the ASE 8th InternationalConference on Social Computing, Stanford, California, USA, August 2015.
[19] T. M. Cover and J. A. Thomas, Elements of Information Theory. New York, NY: John Wiley and Sons, Inc.,1991.
[20] L. Breiman, “Random forests,” Machine learning, vol. 45, no. 1, pp. 5–32, 2001.[21] J. E. Orr, “Ethnography and organizational learning: In pursuit of learning at work,” in Organizational Learn-
ing and Technological Change, ser. NATO ASI Series, C. Zucchermaglio, S. Bagnara, and S. U. Stucky, Eds.Springer Berlin Heidelberg, 1993, vol. 141, pp. 47–60.
——————————————————————————
Author Biography
Gaurang Gavai currently works on applications in embedded reasoning and machinelearning with a focus on social network data analysis and technical infrastructure de-velopment therein. He has designed and developed systems and algorithms to bothidentify anomalous trends in data and also allow subject matter experts to apply theirexpertise by abstracting the nuts and bolts of the analyses from these tools. Prior toPARC, Gaurang was a student at the Georgia Institute of Technology where he ob-tained his Master’s in Computer Science with a specialization in Machine Learning.
He worked as a Research Assistant on developing new models of Active Learning and also interned atCitadel LLC as a Financial Technology intern along the way. Gaurang also worked as a part-time web de-veloper during his undergraduate education in the University of Mumbai where he earned his Bachelor’sin Information Technology.
Kumar Sricharan currently focuses on statistical machine learning and data miningmethods for anomaly detection and pattern recognition in multivariate, temporal, andrelational data. His research interests include statistics, machine learning, data min-ing, and signal processing with specific focus on ensemble methods and large sampleestimation theory. He has particular interest in applications concerning anomaly de-tection and structure discovery in data. Prior to PARC, Sricharan was a researchengineer at NASA Ames, where he conducted research on mining aviation data for
anomalies with regard to fuel consumption efficiency and aviation safety. He also completed a R&D in-ternship at General Motors, with research on classifying driving behavior based on statistical analysis ofheadway time-series data. Sricharan earned his Ph.D. in Electrical Engineering, Systems in 2012, M.A.in Statistics in 2011, and M.S. in Electrical Engineering: Systems in 2009, all from the University ofMichigan, Ann Arbor. His doctoral work on efficient estimation of probability density functionals usingneighborhood graphs has resulted in publications in esteemed peer-reviewed conferences and journals,and is currently nominated for the best dissertation award at the University of Michigan. He also receivedhis B.Tech degree in Electrical Engineering from IIT Madras in 2006.
60

Insider Threat Detection from Enterprise Data Gavai et al
Dave Gunning directs PARC’s efforts in artificial intelligence and predictive analyt-ics focused on the enterprise. These include projects in anomaly and fraud detection,contextual intelligence, recommendation systems, and tools for smart organizations.The technical focus is on developing rich, predictive user models that capture andunderstand the situational context well enough to prioritize information, make recom-mendations, and act on the user’s behalf. Dave is an experienced technology managerwith an extensive background in the development and application of artificial intel-
ligence technology. Prior to PARC, Dave was a Senior Research Manager at Vulcan Inc., a ProgramManager at DARPA (twice), SVP of SET Corp., VP of Cycorp, and a Senior Scientist in the Air ForceResearch Labs. At DARPA, he managed the Personalized Assistant that Learns (PAL) project that pro-duced Siri and the Command Post of the Future (CPoF) project that was adopted by the US Army inIraq. Dave holds a M.S. in Computer Science from Stanford University, a M.S. in Cognitive Psychologyfrom the University of Dayton, and a B.S. in Psychology from Otterbein College.
John Hanley works on large software systems deployed in situations spanning thebreadth of PARC’s customers, from decision support to aerospace applications. Priorto his current work in Embedded Reasoning, John contributed to a PARC and Xeroxresearch effort aimed at retrieving documents from a personal library exactly whenthey become relevant. Before joining PARC, John served as Manager of InternetServices at Oracle, and as Technical Yahoo at a well-known web portal, before goingon to earn his Masters in Software Engineering at Carnegie Mellon University. After
collaborating with several developers of new ether probes, John brings his experience back to the homeof the Digital Intel Xerox blue book, the spec that brought networking to the masses.
Mudita Singhal is a Senior Research Scientist in the Technology for Agile Organi-zations (TAO) Group. She has more than 12 years of experience working in interdis-ciplinary teams facilitating product development and heterogenous data integration,visualization & analysis. Her expertise is in the areas of visual analytics, user inter-faces and applied machine learning. Her current research focuses on developing visualanalytic products for Law Enforcement Agencies. She was previously the PrincipalInvestigator of a government grant building POCs for search across large document
collections. Mudita has been the product owner and made significant contributions to several publiclydeployed tools, including COPASI, BRM, Pquad, CABIN and Cartoonist, as well as internally deployedPOCs such as Footprints and CoRef. She has obtained her Ph.D. in Computer Science from WashingtonState University and a Masters in Computer Science from Virginia Tech. She is Product ManagementCertified from the Haas School of Business, Berkeley and has managed several government and internalgrants. Additionally, she has co-authored more than 35 peer-reviewed journal and conference publica-tions.
61
Insider Threat Detection from Enterprise Data Gavai et al
Rob Rolleston currently works in the area of Information Visualization. His technicalinterests have always been related to how people see, perceive, and interact visuallywith the world around them; and in turn helping others understand these mechanisms.“The world is exploding with data and information. If we are smart about how this ispresented to people, there is so much we can learn about the world.” Rob previouslyhas worked in the areas of Color Management, Strategy & Planning, and assortedmanagement roles within the Xerox Research Labs. Rob also has been an adjunct
professor and instructor at Rochester Institute of Technology and is currently an instructor at MarylandInstitute College of Art. He has served on the Executive Advisory Board for the New York State Centerfor Electronic Imaging Systems and currently serves on the Advisory Board for the Rochester Instituteof Technology Center for Imaging Science. He is currently chair of the Xerox University Affairs Com-mittee. Dr. Rolleston holds a B.S. in Computational Physics from Carnegie-Mellon University, andM.S. and Ph.D. in Optics from the University of Rochester, and a MPS in Information Visualizationfrom Maryland Institute College of Art. He has 33 patents in the areas of color management, imageprocessing, and virtual rendering.
A Red Team scenarios
Stealing Login CredentialsAn employee steals usernames and passwords from co-workers and emails them to an outside party.
Exfiltration Prior to TerminationAn employee is leaving the company and decides to take all of their emails and files with them.
MasqueradingOne user is masquerading as another on an unattended workstation.
Bona FidesEspionage volunteer prints a bona fides package and takes it to a foreign embassy.
Hiding Undue AffluenceAn employee possesses undue affluence because of ongoing espionage activity. They need to hidethe existence of the money from investigators and they perform research on how to do so.
Exfil with Complex SteganographyAn employee uses steganography to hide data in an image file, then uploads that file to a website.
Insider StartupThree co-conspirators collude to steal company IP. They coordinate the synchronized theft of pro-prietary information before leaving the company.
Masquerading 2Subject sets up a rogue SSH server on another user’s machine. They also make a copy of the localWindows password file and copy the file off over the network.
Indecent RFPSubject uses an inappropriate relationship with another employee to illegally influence vendor selec-tion for a lucrative catering contract in order to obtain personal financial gain.
62

Insider Threat Detection from Enterprise Data Gavai et al
Credit CzechSubject runs an illicit business trafficking in stolen credit card numbers, using the organization’sIT resources. He acts as a middleman between various external purveyors of stolen numbers and aRussian operative who buys the collected numbers.
Czech MateSimilar to Credit Czech, but the new protocol calls for twice-daily emails to Subject’s Russian coun-terpart in order to keep the operation alive.
Naughty by ProxyA disgruntled employee seeks revenge by logging on to her manager’s computer and visiting ques-tionable websites.
63