Embed Size (px)
Citation preview

Supercooled sulphuric acid solutions: Desorption of water, mass accommodation
and residence time of HCl at 213, 218 and 228 K
Dissertation Faculty of chemistry
University of Duisburg- Essen 21.12.2012
Khaled Ataya
Supercooled sulphuric acid solutions: Desorption of water, mass accommodation
and residence time of HCl at 213, 218 and 228 K
Dissertation
Submitted to
Faculty of chemistry University of Duisburg- Essen
In partial fulfilment of the
requirements for a
Doctor of Natural Sciences (Dr. rer. nat.)
Khaled Ataya from
Damascus/ Syria

Tag der Disputation: 29.01.2013
Vorsitzender: Prof. Dr. O. Schmitz
1. Gutachter: Prof. Dr. Dr. h. c. R. Zellner
2. Gutachter: Prof. Dr. C. Mayer
Acknowledgements Here is the place where I would like to thank Prof. Dr. Dr. h. c. R. Zellner, who al-
lowed me to join his group and gave me a chance to write my PhD thesis at the
University of Duisburg-Essen.
My very sincere thanks also to Dr. Peter Behr. He is an inspiration and wonderful
human being. He is not only my supervisor but also my best brother in Germany.
Thank you for making me the scientist.
I also give thanks to all of the Zellner group and LUAT group members who helped
me in the lab and made me laugh.
I would like to thank specially Mr. Schnichels and Mr. Türksch.
Finally, I would like to thank Prof. Dr. –Ing. habil. K. Görner, who supported this work.
Erklärung
Hiermit versichere ich, dass ich die vorlegende Arbeit mit dem Titel
„Supercooled sulphuric acid solutions:
Desorption of water, mass accommodation
and residence time of HCl at 213, 218 and 228 K“
selbst verfasst und keine außer den angegebenen Hilfsmitteln und Quellen benutzt habe,
und dass die arbeit in dieser oder ähnlicher Form noch bei keiner anderen Universität
eingerichtet wurde.
Essen, im Oktober 2012
Khaled Ataya
Khaled Ataya Oberdorf Str. 29 45143 Essen
[email protected] Tel: 0201/4338447
Curriculum Vitae
Personal Data
Name Ataya Khaled Birth date 13.11.1979 Birth place Damascus (Syria) Nationality Syrian
Educations
2008 – 2013 Ph.D. student at the faculty of chemistry, university of
Duisburg- Essen
2007 – 2008 Advanced project in the physical chemistry, department of physical chemistry, university of Duisburg- Essen
2003 – 2004 Diploma of higher studies in general chemistry, department of chemistry, university of Damascus
1998 – 2003 Bachelor of chemical sciences (applied chemistry), faculty of science, university of Damascus
1998 Secondary education certificate (scientific section) in Damascus
Work experience 2009 – 2012 Scientist at the University of Duisburg- Essen, LUAT
(Chair of Environmental Process Engineering and Plant Design), in the teamwork of Prof. Dr. Ing. habil. K. Görner
10.2009 Scientific visitor, one week, BER II, Neutron Scattering Centre, Helmholtz- Zentrum Berlin für Materialien und Energie GmbH in der Helmholtz Gemeinschaft, Dr. Hoser, (Flat- Cone Signal Crystal Diffractometer “thermal neutrons“), Focal point: thermal evolution of the powder diffraction pattern of D2O crystal
2008 – 2009 Scientist at the University of Duisburg- Essen, Institute of theoretical and physical Chemistry, in the teamwork of Prof. Dr. Dr. h. c. R. Zellner

2004 – 2007 Chemist at the Italian detergent industry, department of
sodium silicate production, in Damascus
Related experiences
Environmental chemistry, Analysis chemistry
Heterogeneous reactions
Atomic and molecular beam scattering technique, vacuum evaporation experiments
Mass, IR, NIR, VIS spectrometer
Skills and Qualifications
Language English (very good)
German (DSH- 2) Arabic (very good)
EDV/Graphic/Internet Microsoft Office (Word, Excel, Power Point) Internet (Outlook, Internet Explorer), Origin,
Spectroscopy software, data analysis applications, Visual Basic, FORTRAN 77,
SAP Program
Khaled Ataya
List of publications Paper Behr P., U. Scharfenort, K. Ataya, R. Zellner, Dynamic and mass accommodation of HCl molecules on surface acid- water surfaces, Phys. Chem. Chem. Phys., 11, 1- 8, 2009.
Oral presentation P. Behr, U. Scharfenort, K. Ataya, R. Zellner, Dynamics and mass accommodation of HCl molecules on sulphuric acid/ water surfaces, 109. Hauptversammlung der Deutschen Bunsen- Gesellschaft für Physikalische Chemie e.V., Universität Bielefeld, 2010.
Poster presentation Peter Behr, Khaled Ataya, Thermal and non- thermal translational energy distributions of D2O molecules desorbing from liquid and solid D2O/ D2SO4 surfaces, P. 367, III. Hauptversammlung der Deutschen Bunsen- Gesellschaft für Physikalische Chemie e.V., Tagungshandbuch, Universität Leipzig, 2012.
Contents ___________________________________________________________________________
i
Contents Contents ...................................................................................................................................... 1 Introduction ................................................................................................................................ 1 1. Experimental setup ................................................................................................................ 6
1.1 Overview .......................................................................................................................... 6 1.2 Molecular beam chamber ................................................................................................. 7 1.3 Source differential chamber ........................................................................................... 10 1.4 Scattering chamber ........................................................................................................ 11
1.4.1 Pre- chopper .......................................................................................................... 12 1.4.2 Liquid reservoir ..................................................................................................... 12 1.4.3 Post- chopper .......................................................................................................... 14
1.5 Detector- differential chamber ...................................................................................... 15 1.6 Detector chamber ........................................................................................................... 15 1.7 Chemicals ....................................................................................................................... 17
2. Data evaluation and analysis ................................................................................................ 19 2.1 Determination the incident beam energy ................................................................. 19 2.2 TOF post- chopper arrangement ................................................................................... 21
2.2.1 The electronic offset ................................................................................................ 22 2.2.2 Forward and backward time offset ......................................................................... 23 2.2.3 The ion flight time offset ........................................................................................ 23
2.3 TOF pre- chopper arrangement ...................................................................................... 24 2.4 Extraction of the residence time from TOF spectra ....................................................... 26 2.5 Calculation of the residence time ................................................................................... 27
3. Water desorption from a D2SO4 / D2O surface .................................................................... 32 3.1 Experimental results ....................................................................................................... 32
3.1.1 Desorption from a solid surface .............................................................................. 35 3.1.2 Desorption from a liquid surface ............................................................................ 38 3.1.3 Concentration dependence ..................................................................................... 46
3.2 Theoretical analysis using the capillary wave theory .................................................... 48 4. The accommodation coefficient of HCl on a D2SO4/ D2O surface ...................................... 62
4.1 Experimental data ........................................................................................................... 62 4.2 Theoretical analysis using the cavity theory ................................................................. 69 4.3 Theoretical analysis using transition state theory (Cluster model) ............................... 72 4.4 Theoretical analysis using the capillary wave theory .................................................... 81
5. The residence time of HCl in a D2SO4 / D2O solution ......................................................... 95 5.1 Experimental data ........................................................................................................... 95 5.2 Theoretical analysis using the Tabazadeh model ........................................................... 99 5.3 Theoretical analysis using the Carslaw model ............................................................. 106 5.4 Theoretical analysis using the capillary wave theory ................................................... 112
6. Summary ........................................................................................................................... 118 7. References .......................................................................................................................... 121

Contents ___________________________________________________________________________
i

Introduction ___________________________________________________________________________
1
Introduction
Interactions between gas and liquid molecules are of importance for understanding
atmospheric and industrial processes. For example, heterogeneous reactions of
hydrogen chloride gas with the solution of sulphuric acid aerosols play an important
role in stratospheric ozone depletion [e.g. Anderson et al., 2000]. This hydrogen
chloride reacts with dissolved molecules such as ClONO2 [Abbatt & Molina, 1992] or
HOCl [Scwell et al. 2000] or HOBr [Waschewsky & Abbatt, 1999; Hanson &
Ravishankara, 1995] to produce Cl2 or BrCl gas. The Cl2 and BrCl gas molecules are
then photolyzed by sunrays into chlorine radicals that catalyze ozone destruction
[Tolbert et al. 1987] & [De More, 1991]. The following reactions show the influence of
HCl gas in the stratosphere to form the ozone hole:
HCl + ClONO2 Cl2 + HNO3
HCl + HOCl Cl2 + H2O
HCl + HOBr BrCl + H2O
Cl2 + hν 2Cl
Cl + O3 OCl + O2
These reactions can be limited by reducing the HCl solubility in the aerosol. Recent
studies indicate that HCl gas molecules remain in molecular form in the gas phase. In
contrast, in the liquid phase, the value of the dissociation constant is sufficient high to
produce ions completely [Ardura & Donaldson, 2009]. In addition, the HCl solubility
increases with the concentration of sulphuric acid in the aerosol at supercooled
temperatures [Tabzadeh et al. 1994] and [Carslaw et al. 1995].
In fact, the kinetics of transport of gas molecules at the interface liquid- gas can be
determined if these reactions take place either on the surface or in the bulk of the
aerosol droplets. If the reactions occur on the surface of the liquid, the transfer of the
molecules needs a short time, rather than the reactions take place in the bulk of the

Introduction ___________________________________________________________________________
2
liquid. Therefore, these kinetics of transfer of gas molecules have been studied
using several experimental techniques such as droplet train flow reactor [Worsnop et
al. 1989], wetted wall flow reactor [Brown, 1978] and Knudsen cell reactor [Caloz et
al. 1997].
The measurements using the droplet train flow reactor reveal that the solubility of HCl
gas molecules in the stratospheric aerosol increases with the concentration of
sulphuric acid above 69 wt% [Robinson et al. 1998]. Using the wetted flow reactor,
the measured values of the HOCl solubility are higher than expected in the
concentration range of 62.5- 70 wt% of the sulphuric acid solution at a temperature of
250 K [Donaldson et al. 1997]. Further, the results from the experimental data of the
wetted flow reactor demonstrate that the solubility of HCl in the sulphuric acid
solution increase with a decrease in temperature for a given acid content and
decrease with increasing acid content at a given temperature [Zhang et al. 1994].
Furthermore, at a concentration of the sulphuric acid solution below 61 wt%, the
measurements of HCl and HOCl solubilities are in very good agreement with the
calculated values for HCl and HOCl based on Carslaw et al. 1995 and Huthwelker et
al. 1995 models, respectively [Hanson & Lovejoy, 1996].
Hurlbut and Beck developed first an experimental method to provide important
physical and chemical information about gas-liquid surface interactions. This
experimental method is named the atomic and molecular beam scattering technique
[Hurlbut & Beck, 1959]. This technique was applied to measure the directions and
velocities of Ne, Ar and Xe atoms scattering from perfluorinated polyether and
squalane (C14H29) which have very low vapour pressure [King et al. 1993]. After that,
these processes were observed both, direct inelastic scattering and trapping
desorption, when gases such as Ne, CH4, NH3 and D2O strike the liquid surface of
glycerol or squalane [Seacker & Nathanson, 1993]. The first scattering experiments
using the liquid surface of sulphuric acid solutions at supercooled temperatures were
reported in 2000 by the Nathanson group [Moris et al. 2000]. These experiments
explored the collisions and interactions of the strong acid HCl with the sulphuric acid
solutions. A detailed description of gas- liquid collisions and reactions can be
achieved by quantitatively determining the fraction of acid molecules that undergo:
trapping, direct scattering, interface dissociation or reaction, bulk solvation and
Introduction ___________________________________________________________________________
3
desorption. Moreover, the sulphuric acid content becomes higher by the evaporation
of water through the high vacuum of this experiment. As a result, the mass
accommodation of HCl gas onto the surface of the sulphuric acid solution and the
time of the solubility of HCl in the liquid bulk of the sulphuric acid solution (residence
time) can be measured in different concentrations of this solution.
However, the molecular beam technique recorded the residence time of HCl
molecules in the deuterated sulphuric acid solution at temperature 213 K. It is found
that the time of the solubility of HCl increases with an increase of the concentration of
sulphuric acid solution in the range concentration above 65 wt% [Behr et al. 2001].
The measured proton exchange of HCl molecules indicates that these values
decrease with increasing concentration of sulphuric acid solution [Behr et al. 2001].
The molecular beam technique is used in this work to investigate the proton
exchange of HCl and the lifetime with respect to solubility as it interacts with the bare
deuterated sulphuric acid solution at temperatures of 213, 218 and 228 K. In addition,
this technique is also used to monitor the kinetics of desorption of water from the
liquid [Samuel et al. 2006] and solid surface of this solution at supercooled
temperatures.
In the case of the desorption of water from the liquid surface, several experimental
techniques were applied in order to understand the kinetics of the evaporation of the
water molecules from a liquid surface. Some of these techniques are the evaporation
apparatus [Ward et al. 2004], Raman thermometry and the molecular beam
technique.
The evaporation apparatus from [Ward et al. 2004] indicates that the liquid surface is
the coldest place at the gas-liquid interface during the evaporation. Raman
thermometry is used to measure the temperatures of the rapidly evaporating liquid
water droplet injected into the vacuum. The results indicate that the evaporation of
water molecules may occur through geometric requirements [Smith et al. 2006].
Using the coupled liquid water jet source and the molecular beam apparatus, the
time of flight spectra reveals that the velocity distribution of the molecules which
evaporate from liquid surface shifts from the Maxwellian velocity distribution [Faubel
Introduction ___________________________________________________________________________
4
et al. 1988]. From recent observations of the velocity distribution of desorbing water
from the liquid surface are not consistent with the Maxwell-Boltzmann distribution at
the supercooled temperature [Brastad & Nathanson, 2011].
The adsorption of atmospheric trace gases on the solid surface can often be well
described by simple Langmuir or BET isotherms. In addition, the dissolution of the
gas molecules in the bulk of solid or of primary liquid can be determined by a Henry’s
law solubility constant [Kolb et al. 2010]. In fact, the adsorption, desorption and the
solubility of the gas molecules on the ice surface depend dramatically on the ice
microstructure [Sadtchenko et al. 2000a] and [Bar-Nun & Owen, 1998] such as: an
amorphous phase (Ia), crystalline cubic form (Ic) and hexagonal phase (Ih) [Hobbs,
1974] and [Eizenberg & Kauzmann, 1969]. Using temperature programmed
desorption mass spectrometry, the measurements demonstrate that the HCl uptake
molecules depend on the ice microstructure which depends dramatically on the
preparation conditions of these experiments [Sadtchenko et al. 2000b].
On the other hand, the adsorptions of the trace gases on the surface of a liquid as
well as the dissolution of these gases in the bulk of binary aqueous solution need
significant assumptions in order to describe these processes. In the case of liquid
surface, these processes depend on the physical properties of the liquid absorber
such as viscosity, surface tension, density, etc.
In the case of the adsorption and the solubility of gas molecules in the aqueous
solutions, the viscosity of the liquid might be important in order to determine the
kinetics of the transfer of the molecule from the gas phase to the liquid phase at the
interface gas- liquid as well as the decay time of the gas molecule in the bulk of
liquid. The surface tension plays perhaps a significant role to determine the
adsorption of the gas molecule onto the surface of the liquid and the desorption of
water molecules from the surface. Indeed, the surface tension may influence the
directions of the recoiling atoms from the liquid surface. The specular intensities
change weakly for inert gas molecules scattering from the liquid metal surfaces which
have the high surface tensions [Ronk et al. 1996].

Introduction ___________________________________________________________________________
5
As presented above, the sulphuric aerosols play an important role in the
photochemical reactions in the atmosphere. The sulphuric aerosols in the mid-
latitude stratosphere can be produced by subsequent oxidation of the sulphur dioxide
to form the sulphuric acid solution [Deshler et al. 1992]. The aqueous solutions of the
sulphuric acid are concentrated under very low temperatures in the stratospheric
layer to obtain the supercooled and highly concentrated sulphuric acid solution
[Bianco & Hynes, 2006]. The sulphuric acid content increases with increasing
diameter of the aerosol [Baron & Willeke, 2001].
Several theories are represented in this thesis to describe the heterogeneous
reactions as well as the desorption water from the liquid surface. One of these
theories is the capillary wave theory. This theory attempts to describe the results of
the accommodation coefficient and the unexpected measurements of the residence
time of HCl gas in the whole range of concentrations of sulphuric acid solution. This
theory may also explain the kinetics of the desorption of water from the liquid surface
of the sulphuric acid solution at supercooled temperatures. Many studies [Knox &
Phillips, 1998], [Phillips, 1997, 2000, 2001 b, 2004 a, b, 2005] and [Packwood &
Phillips, 2009] described that the surface of the liquid is not planar but is an elastic
membrane and the vibration of the surface molecules is similar to the wave motion.
This motion is named capillary waves, which are produced in different wave lengths
by the surface tension (restoring force).
The motivation of this thesis gives the best explanation in more depth to describe the
unexpected experimental results which were measured by using the molecular beam
scattering techniques. However, these experimental measurements consist of the
velocity distribution of water molecules which are desorbing from solid surface and
liquid surface of the sulphuric acid solution at supercooled temperatures.
Furthermore, the mass accommodation coefficient of HCl onto the surface of the
sulphuric acid solution as well as the residence time of HCl in the liquid bulk of the
sulphuric acid solution at very low temperatures can be described quantitatively by
using the calculations according to the capillary wave theory.

Experimental setup ___________________________________________________________________________
6
1. Experimental setup
1.1 Overview This chapter describes the molecular beam machine. It is used to identify the effects
between the gas molecules and the liquid molecules at the interface region. It can be
analysed by the energy distribution, the density distribution of the desorbing
molecules from the surface liquid and the residence time of the gas molecules in the
liquid.
The molecular beam scattering apparatus consists of five different chambers:
1- Molecular beam source chamber which creates the molecular beams.
2- Source differential chamber, where the effusive flux entering the scattering
chamber is reduced.
3- Scattering chamber, where the liquid reservoir is located in its centre.
4- Detector- differential chamber that decreases the background signal entering
to the detector chamber
5- Detector chamber, which consists of the quadruple mass spectrometer. The details of each chamber will be described later. Fig (1.1) is schematic of the
scattering apparatus.
Figure (1.1) Molecular beam apparatus
Molecular beam source chamber
Source-differential chamber
Scattering chamber
Dectector-differencial- chamber
Detector chamber
Experimental setup ___________________________________________________________________________
7
Molecular beams are formed in the molecular beam source chamber by adiabatic
expansion. After expansion, only one of them is passing throw the skimmer, source
differential chamber to the scattering chamber. In the scattering chamber, this beam
strikes the surface of a liquid film, which is produced by rotating a glass wheel
through the liquid in a reservoir. The beam scatters from the surface into the vacuum.
The exiting scattering beam is monitored by using a mass spectrometer in the
detector chamber. The mass spectrometer detects the intensity of desorbing
molecules versus time of flight between it and the chopper wheel. In the scattering
chamber two different choppers are found either before the liquid reservoir (pre-
chopper) or after it (post- chopper). The kinetic energy is measured by chopping the
exiting molecules into short pulses with the post chopper wheel. The residence time
of molecules in a solution is also measured by using the pre chopper wheel.
The scattering machine is controlled by the flux and pressure sensors in order to
protect it from the damage. If any problem occurs, it switches off automatically, such
as a low vacuum of ~ 10 mbar in the source beam chamber or in the case of
emergency electricity blackout.
1.2 Molecular beam chamber
Molecular beams are formed in this chamber by pressurizing a nozzle consisting of a
5 mm diameter glass tube that is sealed at one end with 100 µm diameter aperture.
Two steel collars, each one consists of four screws, which are used to secure the
nozzle in the stainless steel cylindrical holder and a heater at the end of this holder.
The distance is set at 6 cm. The flux of entering the source differential chamber can
be reduced by increasing the nozzle- skimmer distance. The glass nozzle is needed
to limit the corrosion and contamination inside it. The pressure of the gas is between
2- 5 bar inside the nozzle and it is 3. 10-3 mbar in this chamber, due to the molecular
beams that are produced by adiabatic expansion. We have used lower pressures for
beams 2% of HCl in H2 while higher pressures have been used for pure HCl. The
nozzle can be heated from 26°C-140°C by copper wir e (Lack draht CUL 200, 1,0
mm O.D., 20 m long, resistance of 2,6 Ohms) to increase the kinetic energy of the
Experimental setup ___________________________________________________________________________
8
exiting molecules from the aperture and to reduce the concentration of dimers. The
temperature is measured and controlled by the bang- bang controller (GIR 2000 PT).
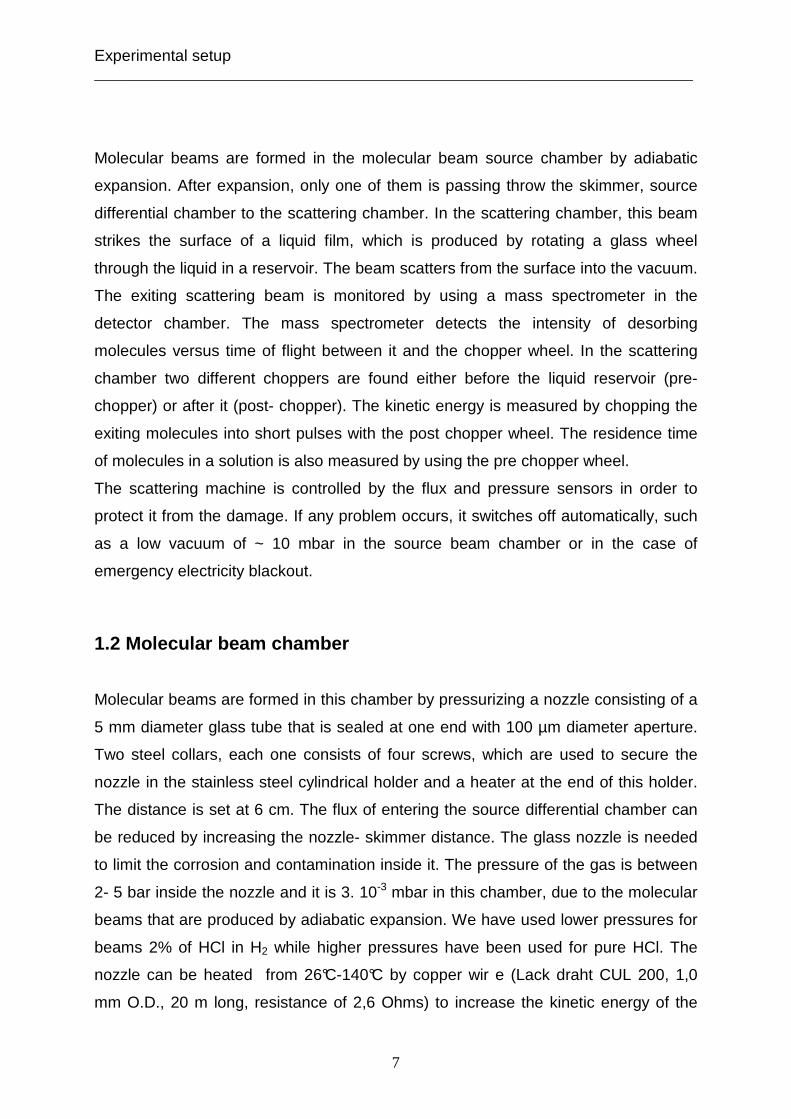
The following figure (Fig 1.2) shows the molecular beam source chamber:
Figure (1.2) Scheme of the molecular beam chamber: 1. glass nozzle, 2. stainless
steel holder, 3. diffusion oil pump, 4. heater, 5. skimmer, 6. molecular beam
The skimmer is made from gold to prevent corrosion and contamination, which are
formed by using the molecular beam from aggressive gases. This contamination
does not allow the molecular beam to pass through the skimmer vent (diameter of 1
mm) parallel from the molecular beam chamber to the source- differential chamber.
The skimming of the molecular beam is used to reduce the pressure in other
chambers and to block the molecules, which have non mono kinetic energy. Other
gas molecules, that are not passing through the skimmer must be pumped out from
this chamber by using a diffusion oil pump (Pfeiffer 6000) with pumping speed of
4000 l.s-1. If corrosive gas is used in this experiment, a liquid nitrogen trap is needed
to condense it and to block it to reach the pre- pumps system. Figure (1.3) shows the
diffusion oil pump and pre-pumps system.
2 1
3
4 5
6
Experimental setup ___________________________________________________________________________
9
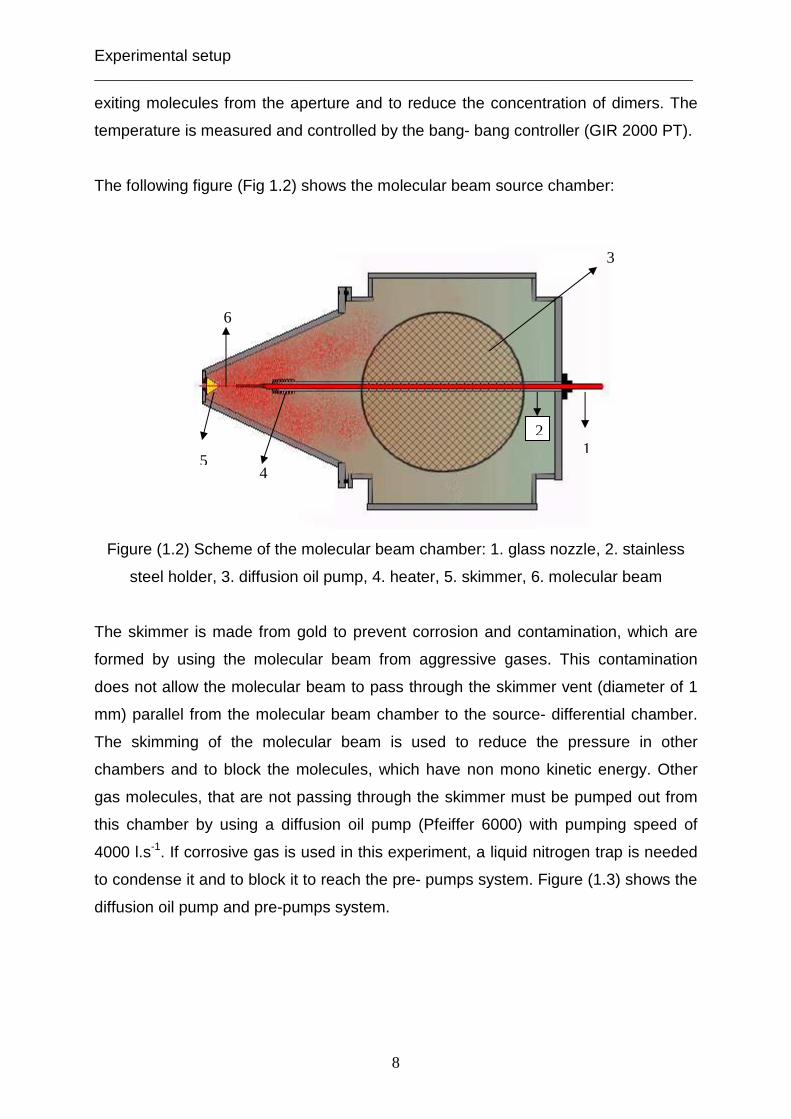
Figure (1.3) Diffusion oil pump, pre-pumps and valves system
The oil diffusion pump, roots pump and rotary vane pump are connected
respectively. The pressure between the diffusion pump and the pre- pumps are
measured by the pressure sensor (Active Pirani Transmitter Pfeiffer 1000- 1.10-4
mbar). When the rotary vane pump is switched on, the pressure is reduced to about
5 mbar if both pre- pumps are turned on, this pressure is reduced to 2.10-2 mbar.
The liquid nitrogen cooling trap is connected between diffusion oil pump and the pre-
pumps system in order to protect the pre- pumps system from the corrosive gases.
The pre- pumps are filled with special oil (Androl 555). This oil resists the aggressive
gases such as HCl and HBr. The oil diffusion pump and the baffle on the top of this
pump are cooled by a water line. The temperature in this pump is controlled by
thermo- sensor. The chamber is saved from the trace of oil by this cooling system.
Figure (1.3) will define the work of this vacuum system in two cases:
1- Rare gas such as Argon.
2- Aggressive or corrosive gases such as HCl or HBr.
Experimental setup ___________________________________________________________________________
10
In the first case, the cooling trap is separated. That means valves (V1) and (V2) are
closed. The valves (V3) and (V4) are opened. In this case the gas pumped away
from the chamber direct to pre-pumps system without passing the cooling trap.
In the second case, the cooling trap is necessary to save the pre- pumps system
from the damage of aggressive gases. The valves (V1), (V2) and (V4) are open. The
valve (V3) and vent- valve are closed. In this way the gas is pumped out from the
chamber and is passing throw the cooling trap. The corrosive gas condenses on the
inside surface of the double jacket of cooling trap. This trap is cooled by the liquid
nitrogen to reach the condensation temperature of HCl gas. Thus the pre- pumps
system is saved from the damage of aggressive gases. After the experiment is
completed, the valves (V1) and (V2) are closed since the valve (V3) has been
opened. After that the vent valve is opened to sublimate the corrosive gas and let
them escape form the cooling trap.
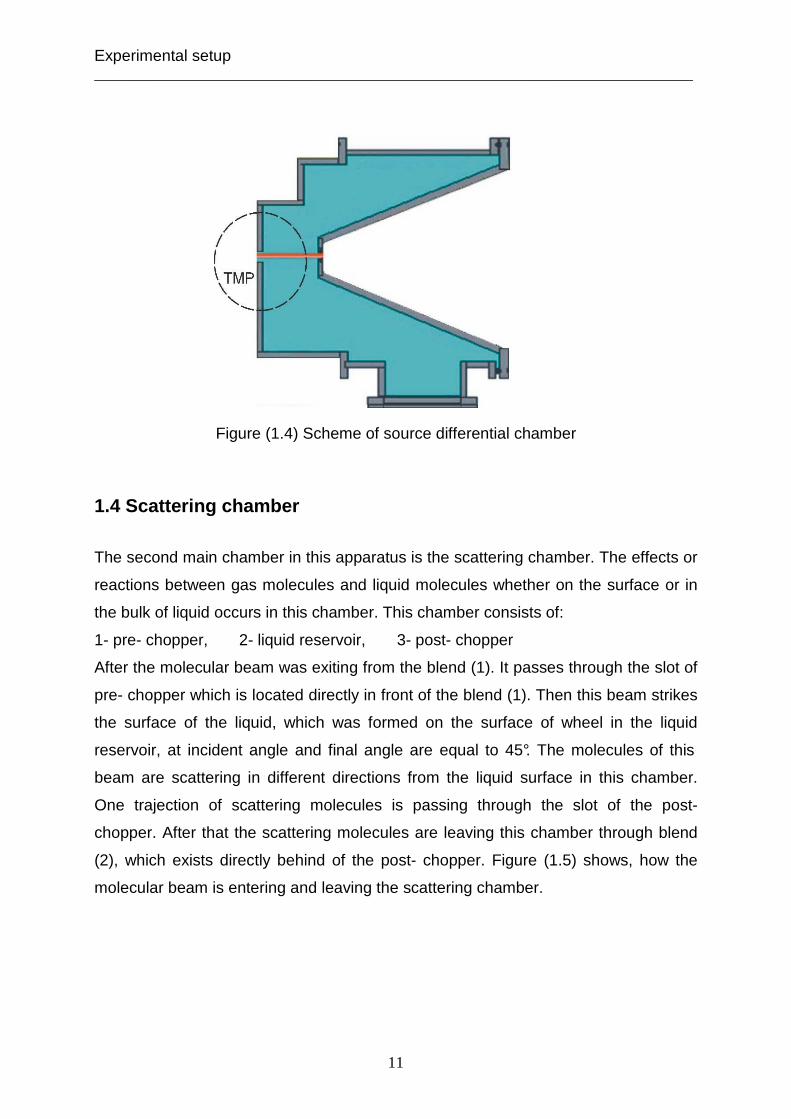
1.3 Source differential chamber
This chamber is located behind the source main chamber and is used to reduce the
effusive flux of the molecular beam to the next chamber (scattering chamber). The
molecular beam, which is passing from the hole of the skimmer to the blend (1), must
be parallel to flow out from blend (1) (diameter 2 mm) to the scattering chamber. The
distance is about 10 cm between the skimmer and blend (1). The molecules, which
are not passing throw blend (1), must be pumped away from this chamber to keep
the pressure at about 10-4- 10-5 mbar. Therefore the turbo- molecular pump Leybold
vacuum (TMP 600 C) with pumping speed of 650 dm3.s-1 as well as the pre- pump
Leybold TRIVAC (D65 B CS) with pumping speed of 65 m3.h-1 were used. In this
chamber we use only one turbo- molecular pump which is enough in the experiment,
because the pumping speed of this pump is satisfactory to reach this vacuum.
This blend (1) is closed in the water evaporation experiment because the nozzle is
not required in this experiment. Thus the scattering chamber is separated from the
two previous chambers which are described above. In figure (1.4) is schematic
diagram of the source differential chamber.
Experimental setup ___________________________________________________________________________
11
Figure (1.4) Scheme of source differential chamber
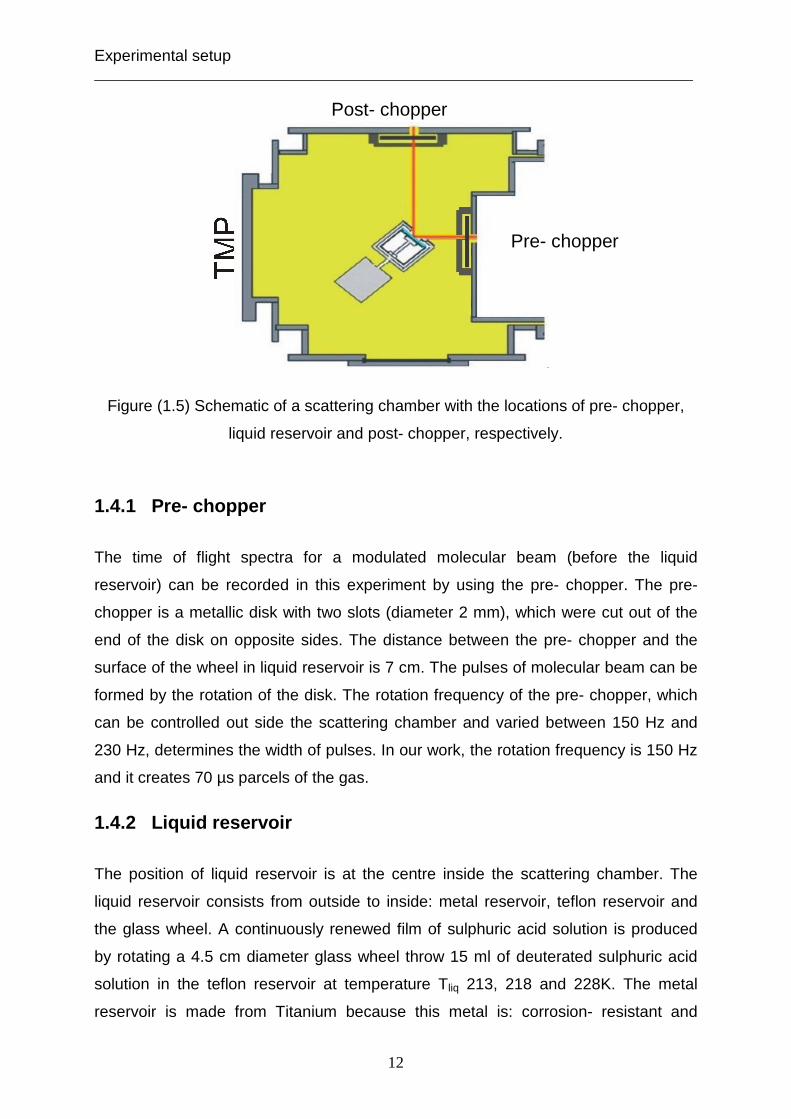
1.4 Scattering chamber
The second main chamber in this apparatus is the scattering chamber. The effects or
reactions between gas molecules and liquid molecules whether on the surface or in
the bulk of liquid occurs in this chamber. This chamber consists of:
1- pre- chopper, 2- liquid reservoir, 3- post- chopper
After the molecular beam was exiting from the blend (1). It passes through the slot of
pre- chopper which is located directly in front of the blend (1). Then this beam strikes
the surface of the liquid, which was formed on the surface of wheel in the liquid
reservoir, at incident angle and final angle are equal to 45°. The molecules of this
beam are scattering in different directions from the liquid surface in this chamber.
One trajection of scattering molecules is passing through the slot of the post-
chopper. After that the scattering molecules are leaving this chamber through blend
(2), which exists directly behind of the post- chopper. Figure (1.5) shows, how the
molecular beam is entering and leaving the scattering chamber.
Experimental setup ___________________________________________________________________________
12
Figure (1.5) Schematic of a scattering chamber with the locations of pre- chopper,
liquid reservoir and post- chopper, respectively.
1.4.1 Pre- chopper
The time of flight spectra for a modulated molecular beam (before the liquid
reservoir) can be recorded in this experiment by using the pre- chopper. The pre-
chopper is a metallic disk with two slots (diameter 2 mm), which were cut out of the
end of the disk on opposite sides. The distance between the pre- chopper and the
surface of the wheel in liquid reservoir is 7 cm. The pulses of molecular beam can be
formed by the rotation of the disk. The rotation frequency of the pre- chopper, which
can be controlled out side the scattering chamber and varied between 150 Hz and
230 Hz, determines the width of pulses. In our work, the rotation frequency is 150 Hz
and it creates 70 µs parcels of the gas.
1.4.2 Liquid reservoir
The position of liquid reservoir is at the centre inside the scattering chamber. The
liquid reservoir consists from outside to inside: metal reservoir, teflon reservoir and
the glass wheel. A continuously renewed film of sulphuric acid solution is produced
by rotating a 4.5 cm diameter glass wheel throw 15 ml of deuterated sulphuric acid
solution in the teflon reservoir at temperature Tliq 213, 218 and 228K. The metal
reservoir is made from Titanium because this metal is: corrosion- resistant and
Post- chopper
Pre- chopper
Experimental setup ___________________________________________________________________________
13
rf
dt
π2exp =
lightweight. The teflon reservoir has a resistance from the acidity of sulphuric acid
and serves as an isolator from the liquid evaporation in the vacuum chamber. The
gold plated wheel was used in this experiment because the reflection of laser from
the gold surface is better than the glass wheel to draw the trajectory of the reservoir
[Behr et al. 2009 a]. The gold wheel is not used anymore because the protective
coating form gold is not fixable on the surface of wheel and it is more expensive than
the glass one. The problem of the clearly reflection is solved by using a glass wheel,
which is in the front of the surface of this wheel is slick and the behind surface is
rigid. This glass wheel is fixed with the teflon axis by using three screws. This axis is
attached tightly with the motor axis behind the liquid reservoir. The motor frequency
will be changed from 5 – 35 Hz and translating that into glass wheel speeds. As the
wheel rotates, the liquid film is exposed to the molecular beam through a 11mm x 3
mm rectangular opening in the front of the liquid reservoir. The beam interaction time
with the liquid surface (texp) can be calculated using this following equation:
Equation (1.4.1)
d: is the diameter of the beam spot. r: is the distance from the centre of the wheel to
the centre of beam. f: is the wheel frequency.
The exposure time is listed in the table (1.1)
Frequency of the motor (Hz) Exposure time (s)
5 0,93
10 0,50
15 0,32
20 0,24
25 0,19
30 0,16
35 0,14
Experimental setup ___________________________________________________________________________
14
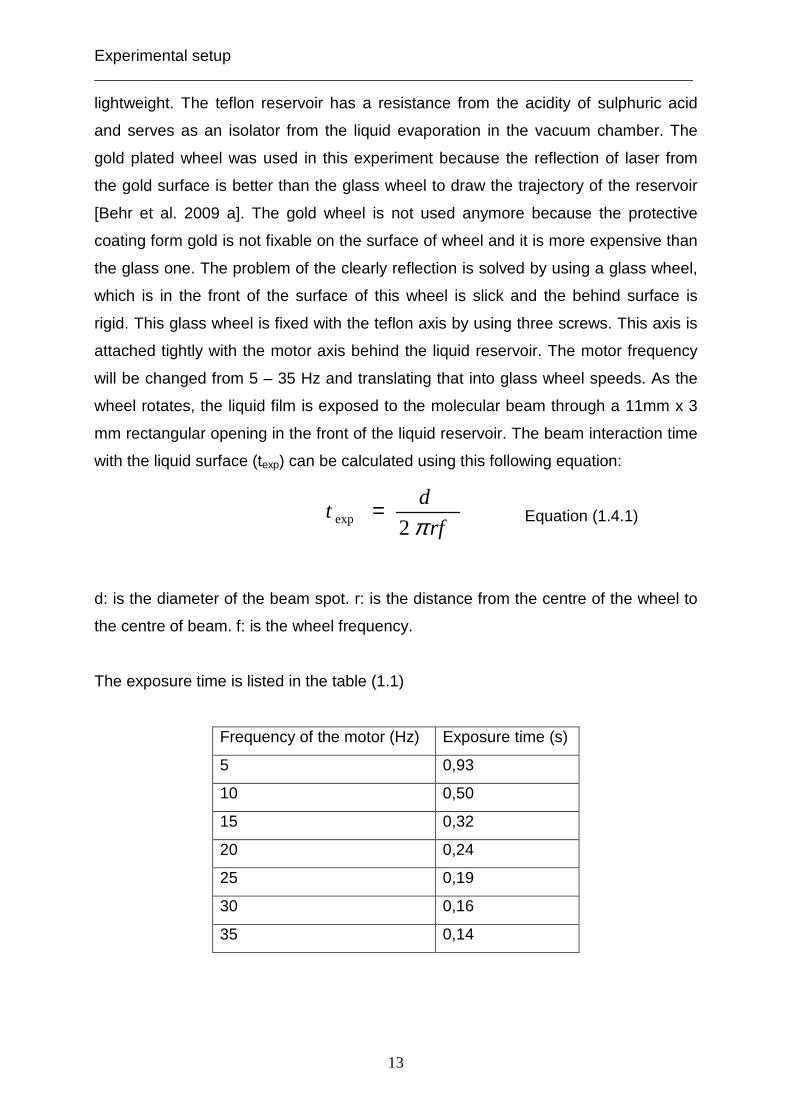
The sulphuric acid solution is cooled by using the cooling coil, which is isolated by
the coating teflon that is fixed tightly on the surface of the cooler. This coating Teflon
is very necessary to protect the cooling coil from the corrosion by the sulphuric acid.
This cooler is used to keep the temperature constant in the solution in order to
reduce the vapour pressure of water in the scattering chamber. A manipulator is
connected through the moveable piece, which allows the liquid reservoir to move
forward and backward from the centre of the rotation axis of the manipulator, to the
top of this liquid reservoir. The desorbing molecules from the liquid surface are better
measured by using the moveable piece in different spectral angles. This will be
discussed in section (3.1.2). Figure (1.6) shows the schematic of the liquid reservoir
with the move piece and the cooling tubs.
Figure (1.6) Moveable liquid reservoir
1.4.3 Post- chopper
The post- chopper is a wheel with two slots (diameter 4 mm), which are drilled out at
the edge of it in the opposite side. The centre of it is fixed tightly with the motor axis
by three screws. Gas pulses of 50 µs are produced by using a motor frequency of
200 Hz. This chopper is placed after the surface of the liquid wheel at the distance 13
cm and directly before the blend (2) (diameter 4 mm). The energy distribution of the
desorbing molecules from the surface of the liquid can be determined by chopping
the continuous molecular beams after their striking the liquid surface.
Experimental setup ___________________________________________________________________________
15
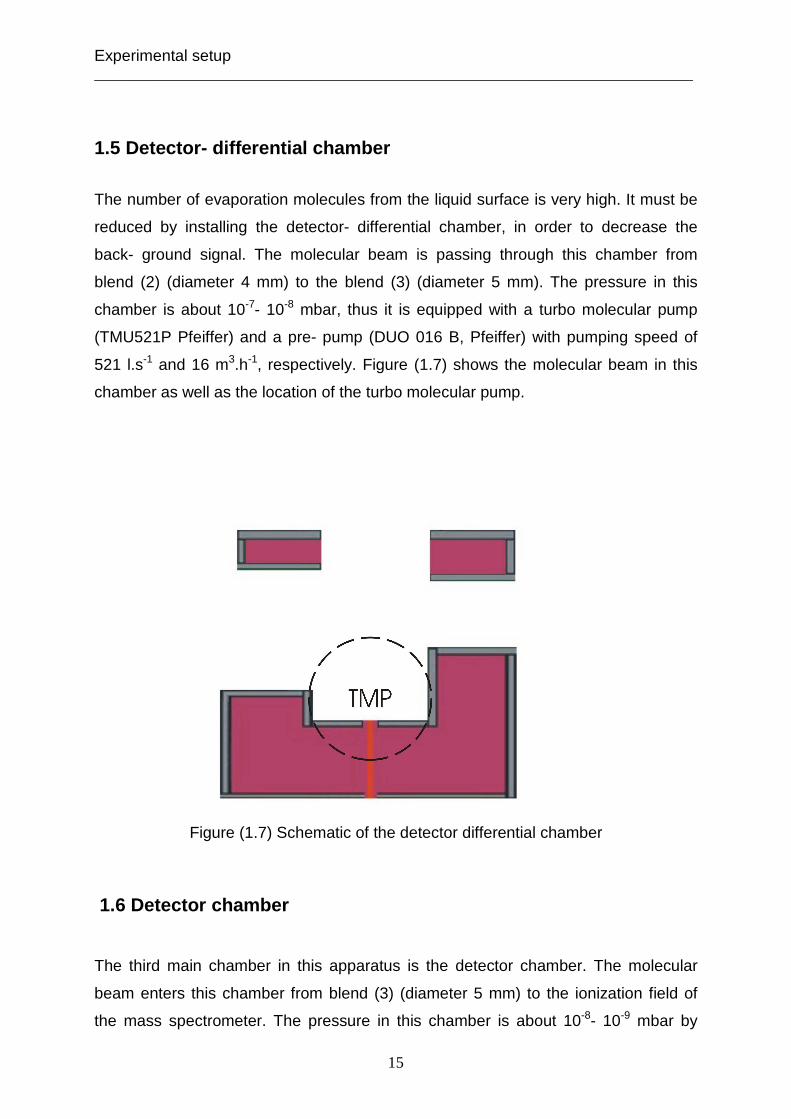
1.5 Detector- differential chamber
The number of evaporation molecules from the liquid surface is very high. It must be
reduced by installing the detector- differential chamber, in order to decrease the
back- ground signal. The molecular beam is passing through this chamber from
blend (2) (diameter 4 mm) to the blend (3) (diameter 5 mm). The pressure in this
chamber is about 10-7- 10-8 mbar, thus it is equipped with a turbo molecular pump
(TMU521P Pfeiffer) and a pre- pump (DUO 016 B, Pfeiffer) with pumping speed of
521 l.s-1 and 16 m3.h-1, respectively. Figure (1.7) shows the molecular beam in this
chamber as well as the location of the turbo molecular pump.
Figure (1.7) Schematic of the detector differential chamber
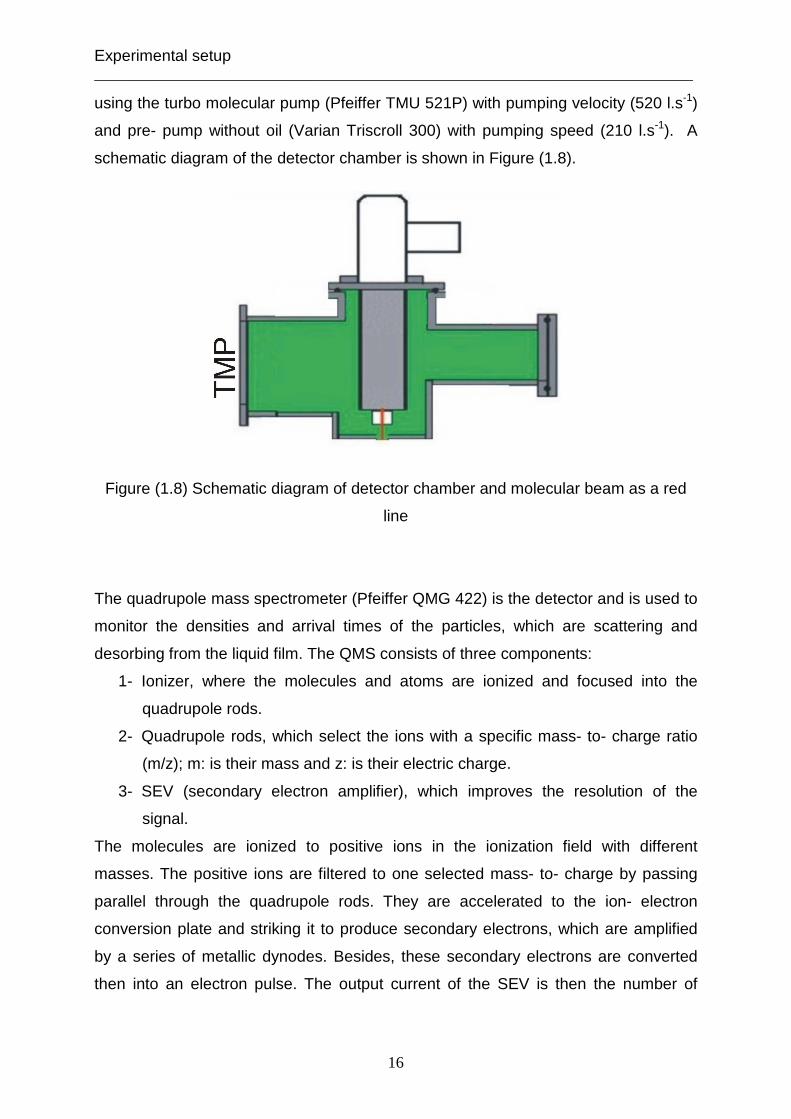
1.6 Detector chamber
The third main chamber in this apparatus is the detector chamber. The molecular
beam enters this chamber from blend (3) (diameter 5 mm) to the ionization field of
the mass spectrometer. The pressure in this chamber is about 10-8- 10-9 mbar by
Experimental setup ___________________________________________________________________________
16
using the turbo molecular pump (Pfeiffer TMU 521P) with pumping velocity (520 l.s-1)
and pre- pump without oil (Varian Triscroll 300) with pumping speed (210 l.s-1). A
schematic diagram of the detector chamber is shown in Figure (1.8).
Figure (1.8) Schematic diagram of detector chamber and molecular beam as a red
line
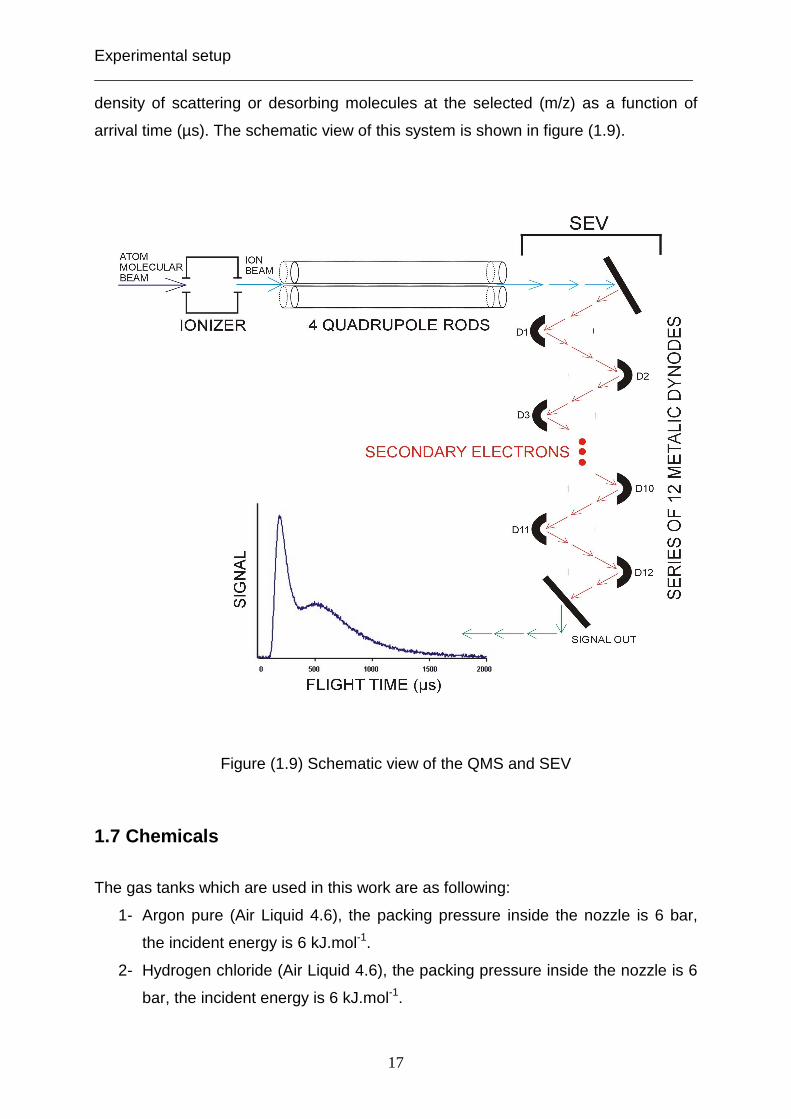
The quadrupole mass spectrometer (Pfeiffer QMG 422) is the detector and is used to
monitor the densities and arrival times of the particles, which are scattering and
desorbing from the liquid film. The QMS consists of three components:
1- Ionizer, where the molecules and atoms are ionized and focused into the
quadrupole rods.
2- Quadrupole rods, which select the ions with a specific mass- to- charge ratio
(m/z); m: is their mass and z: is their electric charge.
3- SEV (secondary electron amplifier), which improves the resolution of the
signal.
The molecules are ionized to positive ions in the ionization field with different
masses. The positive ions are filtered to one selected mass- to- charge by passing
parallel through the quadrupole rods. They are accelerated to the ion- electron
conversion plate and striking it to produce secondary electrons, which are amplified
by a series of metallic dynodes. Besides, these secondary electrons are converted
then into an electron pulse. The output current of the SEV is then the number of
Experimental setup ___________________________________________________________________________
17
density of scattering or desorbing molecules at the selected (m/z) as a function of
arrival time (µs). The schematic view of this system is shown in figure (1.9).
Figure (1.9) Schematic view of the QMS and SEV
1.7 Chemicals
The gas tanks which are used in this work are as following:
1- Argon pure (Air Liquid 4.6), the packing pressure inside the nozzle is 6 bar,
the incident energy is 6 kJ.mol-1.
2- Hydrogen chloride (Air Liquid 4.6), the packing pressure inside the nozzle is 6
bar, the incident energy is 6 kJ.mol-1.

Experimental setup ___________________________________________________________________________
18
4242 20
09,100%
SOD
NaOH
d
VwtSOD
⋅⋅=
3- Hydrogen chloride (Air Liquid 2,8) 2% mixed with H2 (Air Liquid 3.0) 98% , the
packing pressure inside the nozzle is 2 bar, the incident energy is 140 kJ.mol-1.
The solution of D2SO4 / D2O is produced, as follows:
10 ml D2SO4 (99,9 wt% D2SO4 98,9 atom %D Aldrich) was diluted with 15 ml of
deuterium oxide (Deuterium oxide 99,9 atom %D) in the ice bath in order to reduce
the evaporation of deuterium oxide by dilution and to keep the concentration of this
solution constant. We prepared the deuterated sulphuric acid solution in
concentration of 52 wt%. This solution was poured in the Teflon reservoir by using a
glass syringe (Poulet and Graf GmbH). Before the scattering apparatus set up, the
sulphuric acid solution is concentrated by the evaporation of D2O through the high
vacuum in the scattering chamber.
The titration method of the sulphuric acid solution:
The sulphuric acid solution is titrated by using sodium hydroxide (1 mol.l-1 Waldeck)
and indicator phenolphthalein. 1 ml of the solution is weighted to determine its
density (d D2SO4), diluted with distillated water and poured two or three droplet from
the indicator. Then it is titrated with NaOH (VNaOH). The concentration in weight per
cent is calculated by the equation as following:
Equation (1.7.1)
Data evaluation and analysis ___________________________________________________________________________
19
2. Data evaluation and analysis
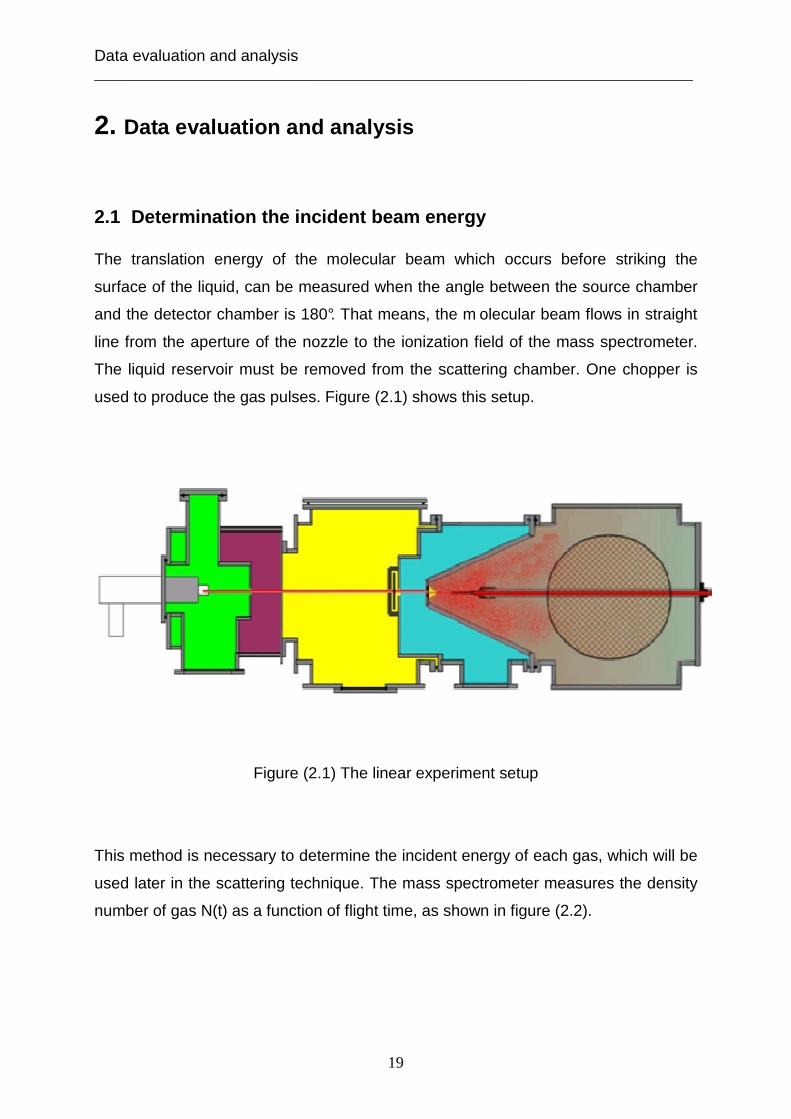
2.1 Determination the incident beam energy The translation energy of the molecular beam which occurs before striking the
surface of the liquid, can be measured when the angle between the source chamber
and the detector chamber is 180°. That means, the m olecular beam flows in straight
line from the aperture of the nozzle to the ionization field of the mass spectrometer.
The liquid reservoir must be removed from the scattering chamber. One chopper is
used to produce the gas pulses. Figure (2.1) shows this setup.
Figure (2.1) The linear experiment setup
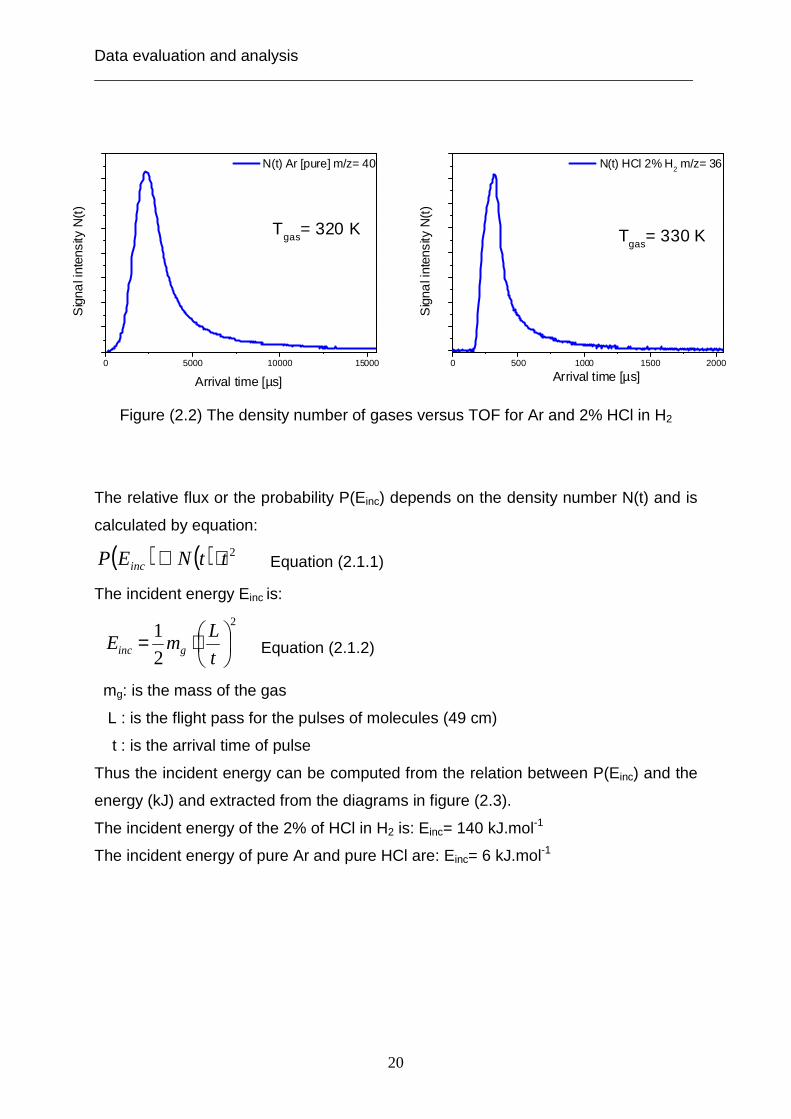
This method is necessary to determine the incident energy of each gas, which will be
used later in the scattering technique. The mass spectrometer measures the density
number of gas N(t) as a function of flight time, as shown in figure (2.2).
Data evaluation and analysis ___________________________________________________________________________
20
0 5000 10000 15000
Sig
nal i
nten
sity
N(t
)
Arrival time [µs]
N(t) Ar [pure] m/z= 40
Tgas
= 320 K
0 500 1000 1500 2000
Sig
nal i
nten
sity
N(t
)
Arrival time [µs]
N(t) HCl 2% H2 m/z= 36
Tgas
= 330 K
Figure (2.2) The density number of gases versus TOF for Ar and 2% HCl in H2
The relative flux or the probability P(Einc) depends on the density number N(t) and is
calculated by equation:
( ) ( ) 2ttNEP inc ⋅∝ Equation (2.1.1)
The incident energy Einc is:
2
2
1
⋅=t
LmE ginc Equation (2.1.2)
mg: is the mass of the gas
L : is the flight pass for the pulses of molecules (49 cm)
t : is the arrival time of pulse
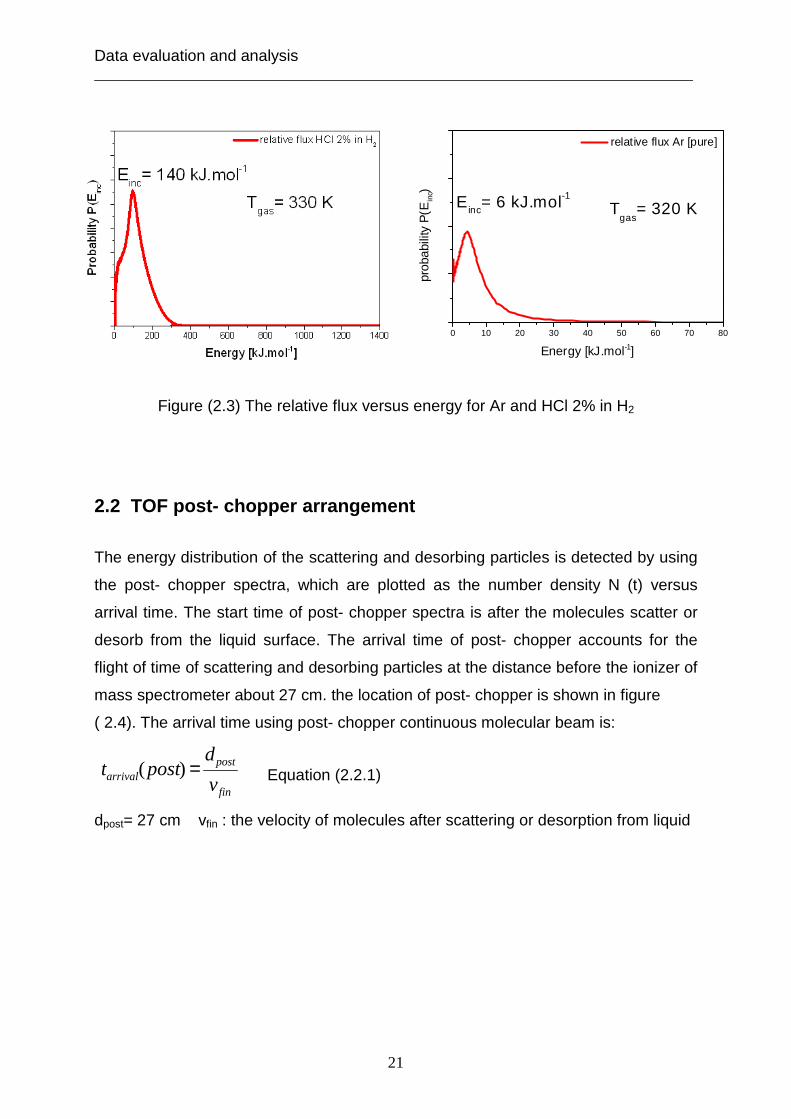
Thus the incident energy can be computed from the relation between P(Einc) and the
energy (kJ) and extracted from the diagrams in figure (2.3).
The incident energy of the 2% of HCl in H2 is: Einc= 140 kJ.mol-1
The incident energy of pure Ar and pure HCl are: Einc= 6 kJ.mol-1
Data evaluation and analysis ___________________________________________________________________________
21
0 10 20 30 40 50 60 70 80
prob
abili
ty P
(Ein
c)
Energy [kJ.mol-1]
relative flux Ar [pure]
Tgas
= 320 KEinc
= 6 kJ.mol-1
Figure (2.3) The relative flux versus energy for Ar and HCl 2% in H2
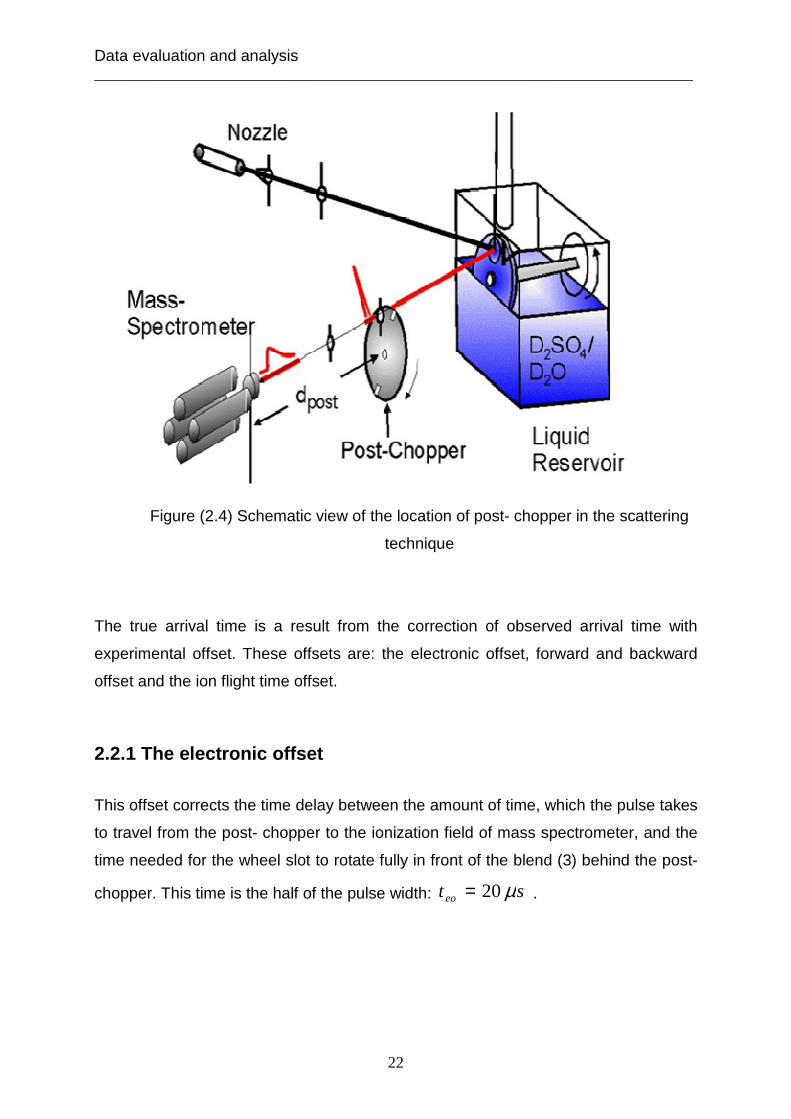
2.2 TOF post- chopper arrangement
The energy distribution of the scattering and desorbing particles is detected by using
the post- chopper spectra, which are plotted as the number density N (t) versus
arrival time. The start time of post- chopper spectra is after the molecules scatter or
desorb from the liquid surface. The arrival time of post- chopper accounts for the
flight of time of scattering and desorbing particles at the distance before the ionizer of
mass spectrometer about 27 cm. the location of post- chopper is shown in figure
( 2.4). The arrival time using post- chopper continuous molecular beam is:
fin
postarrival v
dpostt =)( Equation (2.2.1)
dpost= 27 cm vfin : the velocity of molecules after scattering or desorption from liquid
Data evaluation and analysis ___________________________________________________________________________
22
Figure (2.4) Schematic view of the location of post- chopper in the scattering
technique
The true arrival time is a result from the correction of observed arrival time with
experimental offset. These offsets are: the electronic offset, forward and backward
offset and the ion flight time offset.
2.2.1 The electronic offset
This offset corrects the time delay between the amount of time, which the pulse takes
to travel from the post- chopper to the ionization field of mass spectrometer, and the
time needed for the wheel slot to rotate fully in front of the blend (3) behind the post-
chopper. This time is the half of the pulse width: st eo µ20= .
Data evaluation and analysis ___________________________________________________________________________
23
2.2.2 Forward and backward time offset
This time offset can be measured by taking half of the difference between the peak
arrival times for clockwise and counter clockwise wheel rotation
−=2
BOFOFBO
ttt Equation (2.2.2)
2.2.3 The ion flight time offset
This offset depends on the mass spectrometer, which is used in the experiment. The
ion takes a time to travel through the quadrupole rods to the ion detector (or exactly
to the ion- electron conversation plate).
ionflightion mt ⋅=− α Equation (2.2.3)
α: this value in our work is “5”.
mion: the mass of ion.
The true arrival time for post- chopper TOF is then given by:
)( ionpostFBO
posteoobserved
posttrue mtttt ⋅−−= αm Equation (2.2.4)
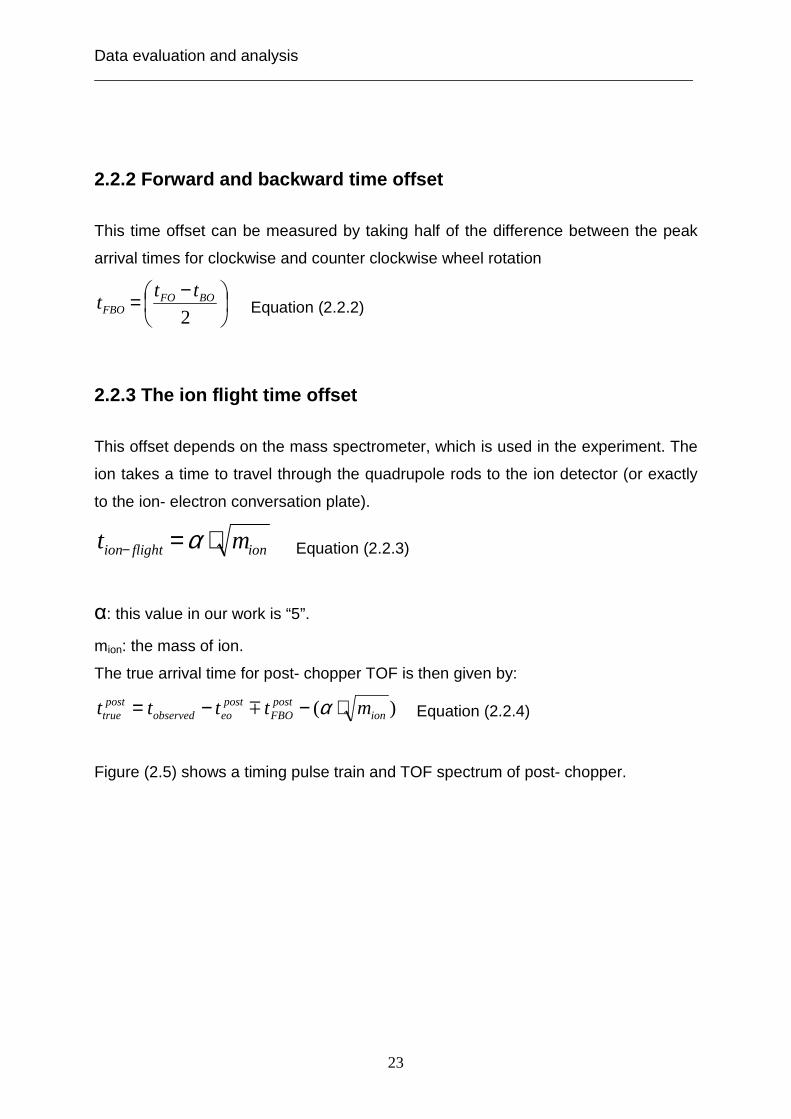
Figure (2.5) shows a timing pulse train and TOF spectrum of post- chopper.
Data evaluation and analysis ___________________________________________________________________________
24
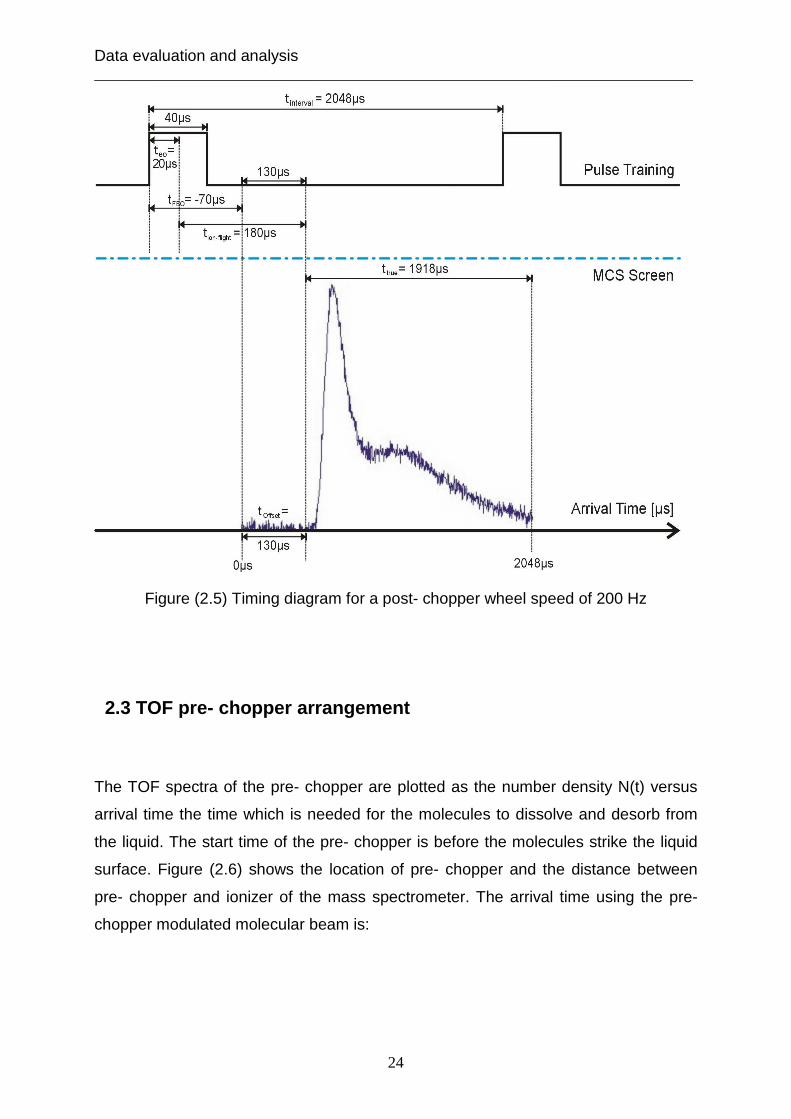
Figure (2.5) Timing diagram for a post- chopper wheel speed of 200 Hz
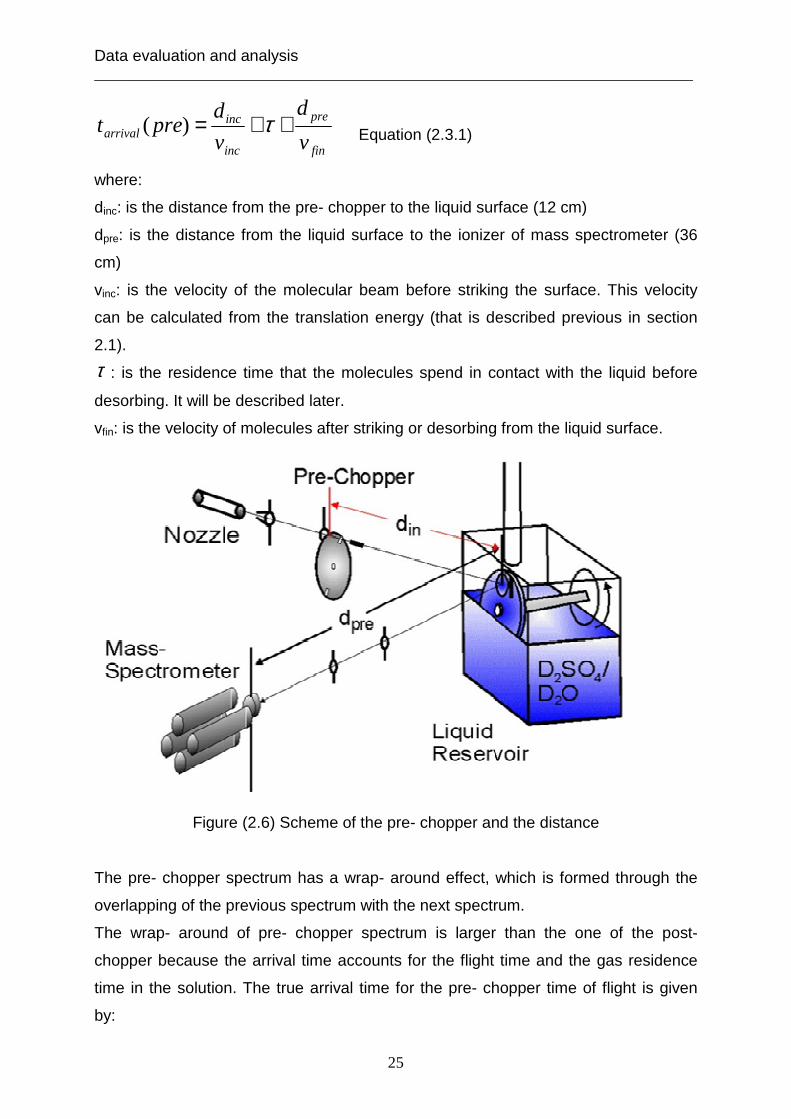
2.3 TOF pre- chopper arrangement The TOF spectra of the pre- chopper are plotted as the number density N(t) versus
arrival time the time which is needed for the molecules to dissolve and desorb from
the liquid. The start time of the pre- chopper is before the molecules strike the liquid
surface. Figure (2.6) shows the location of pre- chopper and the distance between
pre- chopper and ionizer of the mass spectrometer. The arrival time using the pre-
chopper modulated molecular beam is:
Data evaluation and analysis ___________________________________________________________________________
25
fin
pre
inc
incarrival v
d
v
dpret ++= τ)( Equation (2.3.1)
where:
dinc: is the distance from the pre- chopper to the liquid surface (12 cm)
dpre: is the distance from the liquid surface to the ionizer of mass spectrometer (36
cm)
vinc: is the velocity of the molecular beam before striking the surface. This velocity
can be calculated from the translation energy (that is described previous in section
2.1).
τ : is the residence time that the molecules spend in contact with the liquid before
desorbing. It will be described later.
vfin: is the velocity of molecules after striking or desorbing from the liquid surface.
Figure (2.6) Scheme of the pre- chopper and the distance The pre- chopper spectrum has a wrap- around effect, which is formed through the
overlapping of the previous spectrum with the next spectrum.
The wrap- around of pre- chopper spectrum is larger than the one of the post-
chopper because the arrival time accounts for the flight time and the gas residence
time in the solution. The true arrival time for the pre- chopper time of flight is given
by:
Data evaluation and analysis ___________________________________________________________________________
26
inc
incion
preFBO
preeoobserved
pretrue v
dmtttt −⋅−−= )(αm Equation (2.3.2)
preFBOt = 800 µs (the forward / backward offset for the pre chopper is larger than that
by post- chopper and is pre
eot = 30 µs.
2.4 Extraction of the residence time from TOF spectra
The residence time of the molecules in the bulk liquid can be revealed from the
comparison between both pre- and post- chopper spectra. The time of flight spectra
of post- and pre- chopper have two components, namely inelastic scattering and
thermal desorption. The inelastic scattering molecules arrive earlier at the ionization
field of mass spectrometer, because they have a high energy. Thermal desorbing
molecules reach to the ionizer of the mass spectrometer later, because they
dissipate their energy at the surface of liquid before desorbing from it. These two
components can be found separated for the molecular beam, which has high incident
energy. But for the molecular beam, which has low incident energy, is very difficult to
recognize these two components.
The residence time can be extracted by comparing pre- and post- chopper spectra.
Both spectra must be corrected before the comparison using two steps.
First, the post- chopper path length (2048 µs) is shorter than the pre- chopper flight
bath (3072 µs). The arrival times in the pre- chopper spectrum must be decreased by
multiplying the ratio of flight path distances, as in equation:
=
−
−
ionizerliquid
ionizerpostpretrue
precurrect d
dtt
Equation (2.3.3)
Second, the arrival time for both spectra must be also corrected by using the time
offsets for pre- and post- chopper, as they have been outlined above.
In the case for the high incident energy of the molecular beam can be easier
compared through the overlapping the inelastic scattering peaks of pre- and post-
Data evaluation and analysis ___________________________________________________________________________
27
0 500 1000 1500 2000 2500 3000
wt% D2SO
4= 70,0%
Tl iq
= 218K
τ = 130 µs
Data-points DCl Post-chopper Data-points DCl Pre-chopper 0 µs 130 µs
Nor
mal
ized
DC
l ( P
re &
Pos
t )
Arrival Time ( µs )
chopper spectra, because the residence time for the inelastically scattered molecules
is equal to zero. In contrast, the molecular beam with low incident energy has not a
separated inelastic scattering component. In this case, it is difficult to determine the
exact offsets in the arrival time between both spectra. But this problem can be
vanished by using a rare gas, which has identical incident energy. The differences in
arrival times and intensities between pre- and post- chopper spectra of this gas
disappear. That means that the curve of the pre- chopper spectra is aligned with one
of the post- chopper spectra.
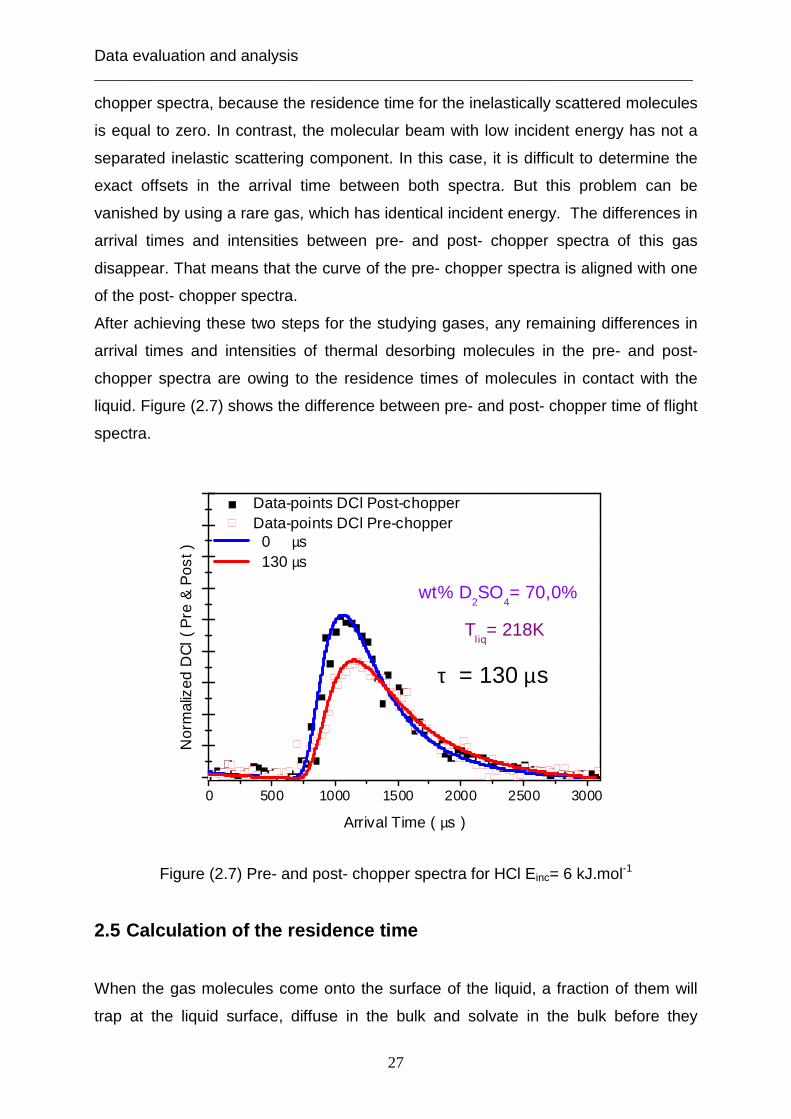
After achieving these two steps for the studying gases, any remaining differences in
arrival times and intensities of thermal desorbing molecules in the pre- and post-
chopper spectra are owing to the residence times of molecules in contact with the
liquid. Figure (2.7) shows the difference between pre- and post- chopper time of flight
spectra.
Figure (2.7) Pre- and post- chopper spectra for HCl Einc= 6 kJ.mol-1
2.5 Calculation of the residence time
When the gas molecules come onto the surface of the liquid, a fraction of them will
trap at the liquid surface, diffuse in the bulk and solvate in the bulk before they

Data evaluation and analysis ___________________________________________________________________________
28
desorb from the surface. That means that the gas molecules spend some time on the
liquid surface and in the bulk before they desorb from it. This delay in time is defined
as a residence timeτ . The residence time can be obtained by the equalization
between the net uptake gas flux into the liquid and the diffusive flux on the liquid side.
The net uptake gas flux into liquid is calculated by using Flick’s first law in one
dimension (x). This is measured in an inward direction along the normal to the
surface.
The net uptake gas flux is extracted from the difference between two fluxes Fin and
Fdes (t):
( )tFFF desinnet −= Equation (2.5.1)
inF : is the flux gas entering the liquid, which is defined as:
hitthin FF ⋅= α Equation (2.5.2)
hitF : is the flux of the solute molecules coming on the liquid surface defined as:
4
vnF g
hit
⋅= Equation (2.5.3)
gn : is the number of gas molecules in the gas bulk.
This flux will be rewritten by applying Henry’s law as:
HRT
vcF l
hit 4
⋅=o
Equation (2.5.4)
thα : is the thermal accommodation coefficient
TD
enterth N
N=α Equation (2.5.5)
enterN : is the number of molecules that enter the liquid
TDN : is the number of molecules that strike the liquid from thermal desorption
v : is the average velocity of the gas molecules (= incident and exiting gas
molecules)
Then the incident flux is:
HRT
vcF thl
in 4
⋅⋅= αo
Equation (2.5.6)
Data evaluation and analysis ___________________________________________________________________________
29
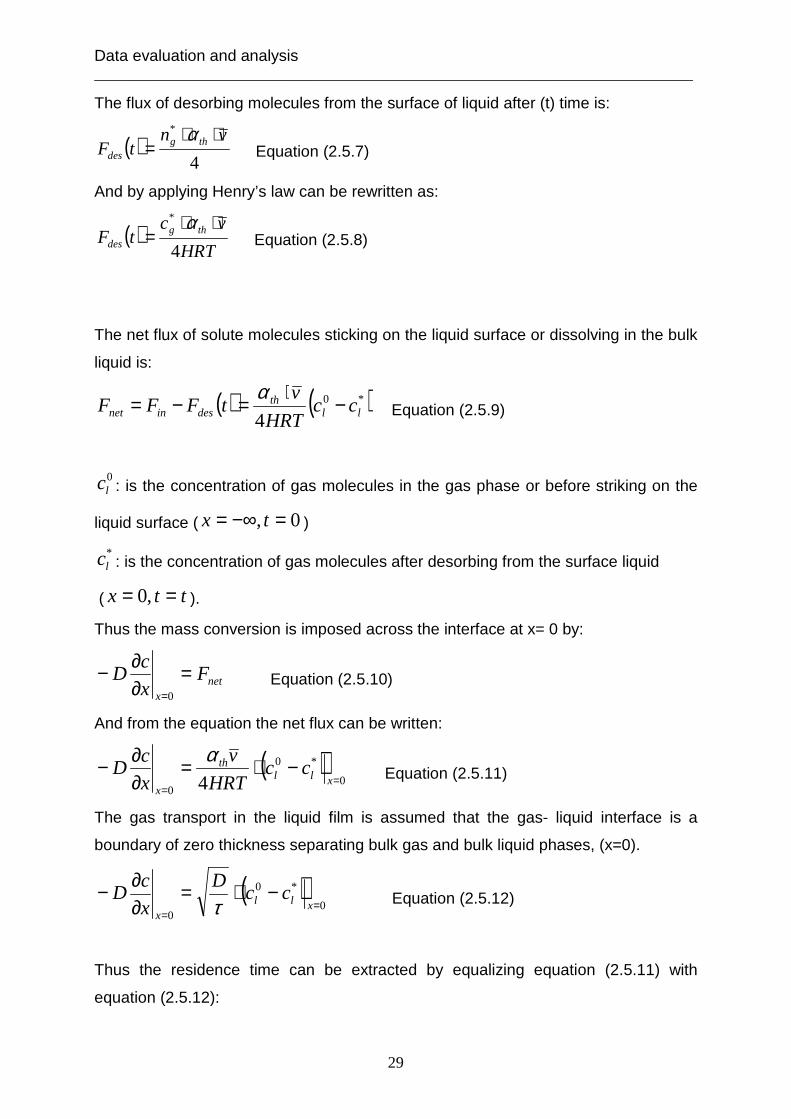
The flux of desorbing molecules from the surface of liquid after (t) time is:
( )4
* vntF thg
des
⋅⋅=
α Equation (2.5.7)
And by applying Henry’s law can be rewritten as:
( )HRT
vctF thg
des 4
* ⋅⋅=
α Equation (2.5.8)
The net flux of solute molecules sticking on the liquid surface or dissolving in the bulk
liquid is:
( ) ( )*0
4 llth
desinnet ccHRT
vtFFF −
⋅=−=
α Equation (2.5.9)
0lc : is the concentration of gas molecules in the gas phase or before striking on the
liquid surface ( 0, =−∞= tx )
*lc : is the concentration of gas molecules after desorbing from the surface liquid
( ttx == ,0 ).
Thus the mass conversion is imposed across the interface at x= 0 by:
netx
Fx
cD =
∂∂−
=0 Equation (2.5.10)
And from the equation the net flux can be written:
( )0
*0
0 4 ==
−⋅=∂∂−
xllth
x
ccHRT
v
x
cD
α Equation (2.5.11)
The gas transport in the liquid film is assumed that the gas- liquid interface is a
boundary of zero thickness separating bulk gas and bulk liquid phases, (x=0).
( )0
*0
0=
=
−⋅=∂∂−
xllx
ccD
x
cD
τ Equation (2.5.12)
Thus the residence time can be extracted by equalizing equation (2.5.11) with
equation (2.5.12):

Data evaluation and analysis ___________________________________________________________________________
30
24
⋅⋅=
v
HRTD
thατ Equation (2.5.13)
D: is the diffusion coefficient in the liquid phase (cm2.s-1)
H: is the solubility of the gas molecules in the liquid (mol.l-1.atm-1)
R: is the gas constant (atm.l.mol-1.K-1)
T: is the temperature of the liquid (K)
The residence time is the time required for the desorption flux to reach 57% of the
entering flux. The desorbing flux decreases every time when the entering flux is
decreased and the lifetimes of molecules, which enter the liquid, must be increased
to reduce the desorption rate. However, the desorption probability depends on the
solvation or residence time of the gas molecules dissolving in the liquid. The diagram
(2.8) shows, that desorption probability curves rise (in the beam on) and drop sharply
(in the beam off) by different residence time in the solution.
Figure (2.8) Desorption probability versus the desorption time [Nathanson, 2004]
The desorption flux during the pulse of the impinging gas rises with the time until at
50 µs it reaches to a maximum. At this time the surface is saturated from the solute.
Over 50 µs desorption flux drops sharply, because there are no impinging gas
molecules to replenish those that desorb. The desorption flux at the beam off
depends only on the desorbing molecules from the liquid. For longer residence time,
Data evaluation and analysis ___________________________________________________________________________
31
the curves rise and fall less sharply, because the gas molecules with larger value of
residence times diffuse deeper into the liquid and desorb more slowly in both (beam
on and off). The areas under each curve are equal, because the equal number of gas
molecules that are uptaken into the liquid and desorb from it.
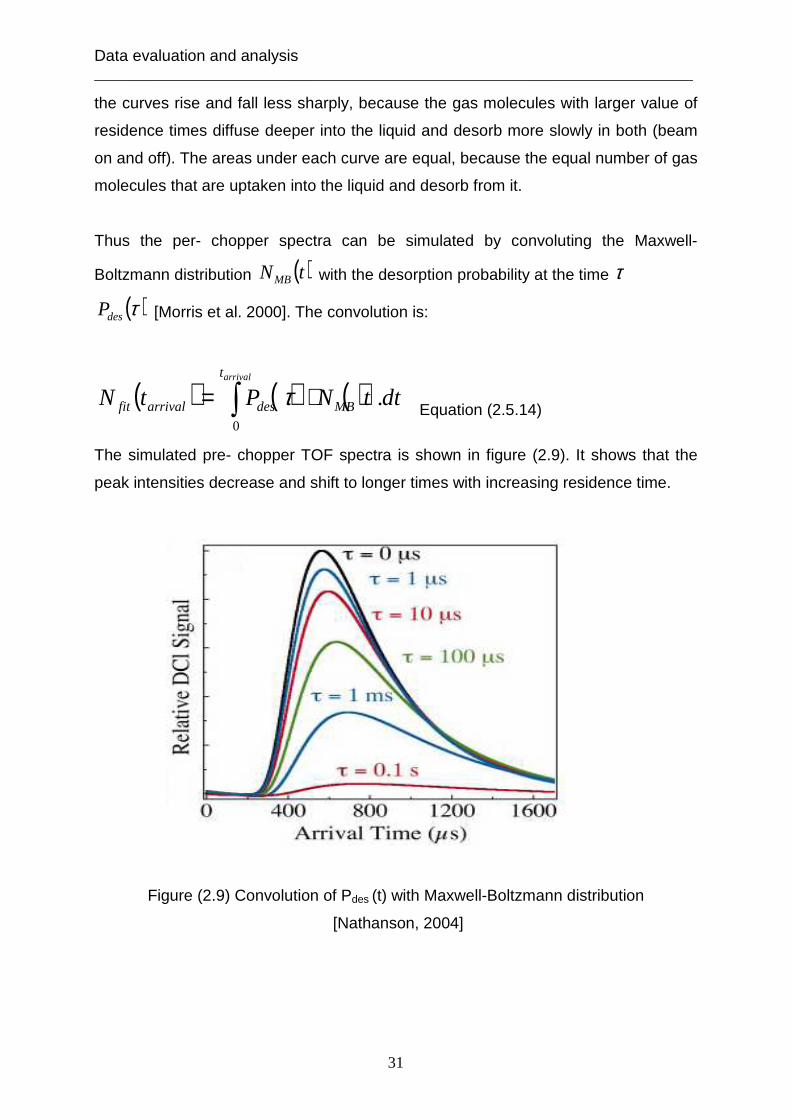
Thus the per- chopper spectra can be simulated by convoluting the Maxwell-
Boltzmann distribution ( )tNMB with the desorption probability at the time τ
( )τdesP [Morris et al. 2000]. The convolution is:
( ) ( ) ( )dttNPtNarrivalt
MBdesarrivalfit .0∫ ⋅= τ
Equation (2.5.14)
The simulated pre- chopper TOF spectra is shown in figure (2.9). It shows that the
peak intensities decrease and shift to longer times with increasing residence time.
Figure (2.9) Convolution of Pdes (t) with Maxwell-Boltzmann distribution
[Nathanson, 2004]
Water desorption from a D2SO4 / D2O surface ___________________________________________________________________________
32
3. Water desorption from a D 2SO4 / D2O surface The kinetics of desorbing water play a significant role in determining the lifetime of
changing sulfuric acid concentration in the aerosols. The change in concentration has
an effect on the behavior of gas uptake and gas solution dynamic on the surface and
in the bulk of aerosol particle. Furthermore, the heterogeneous reactions for the
stratospheric ozone depletion depend on the concentration of sulfuric acid in aerosol.
First, we will present the experimental results of D2O molecules desorbing from a
solid and liquid surface of deuterated sulphuric acid solution using post chopper
spectra. These data will be compared with theories classical kinetic theory [Scharge,
1953], statistical rate theory [Ward & Fang, 1999] and transition state theory
[Nagayama et al. 2003]. Thereafter it will be pointed out in more details the capillary
wave theory, in order to describe the different behaviors of D2O molecules desorbing
from solid as well as from liquid surface.
3.1 Experimental results
Vacuum evaporation experiments have been used to monitor the loss of deuterium
oxide from the solid and liquid surface of deuterated sulphuric acid solution at
temperatures of 213, 218 and 228K. In addition, the intensity of escaping D2O from
ice and liquid surface is observed with different concentration of D2SO4 and different
spectral angles in the range from 0° to 65°.
The vacuum evaporation technique consists of three chambers, which are the
scattering chamber, the differential detector chamber and the detector chamber. The
liquid reservoir is located at the centre of the scattering chamber. The differential
detector chamber is used here to reduce the background of the time of flight spectra.
In addition, the quadrapole mass spectrometer detects the density of desorbing D2O
molecules from the liquid surface of sulphuric acid solution. The details of this
technique can be shown in figure (3.1). The spectral angle is equal to zero (Ф = 0°).

Water desorption from a D2SO4 / D2O surface ___________________________________________________________________________
33
Figure (3.1) Schematic view of the vacuum evaporation technique at zero spectral angle
In the case of the spectral angle being higher than zero, it is placed between “N” and
“D” where “N” is the normal to the whole liquid reservoir and “D” is the straight
distance between the surface of liquid and the ionization field of the mass
spectrometer, as illustrated in the figure (3.2).
Figure (3.2) Scheme of the variation of the spectral angle (Ф)
Detector chamber
Detector differential chamber
Scattering chamber
QMS
Liquid reservoir
0=φ
Mass spectrometer
Spectral angle
Water desorption from a D2SO4 / D2O surface ___________________________________________________________________________
34
The liquid reservoir can be adjusted using the manipulator, which is fixed on the top
of it. The continuously renewed film is created by rotating the glass wheel in the
sulphuric acid solution. The heavy water molecules desorb from the surface under
the vacuum in the scattering chamber. As a result, the concentration of sulphuric acid
solution increases as the technique operates longer time. At the high concentration of
the sulphuric acid solution, this solution changes from the liquid phase to the solid
phase. In the case of solid surface, the glass wheel has no ability to rotate. In this
condition, we will observe D2O molecules desorbing from the solid surface. According
to the sulphuric acid water phase diagram [Giauque et al. 1960] this indicates that the
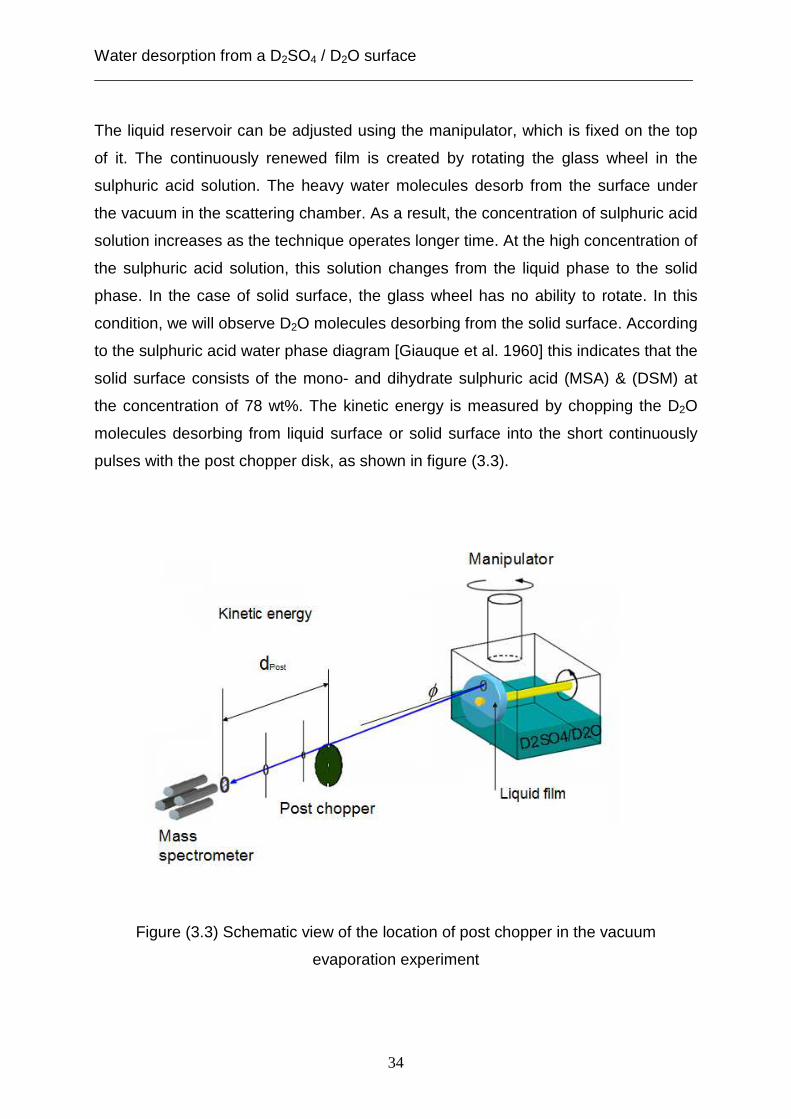
solid surface consists of the mono- and dihydrate sulphuric acid (MSA) & (DSM) at
the concentration of 78 wt%. The kinetic energy is measured by chopping the D2O
molecules desorbing from liquid surface or solid surface into the short continuously
pulses with the post chopper disk, as shown in figure (3.3).
Figure (3.3) Schematic view of the location of post chopper in the vacuum
evaporation experiment
Water desorption from a D2SO4 / D2O surface ___________________________________________________________________________
35
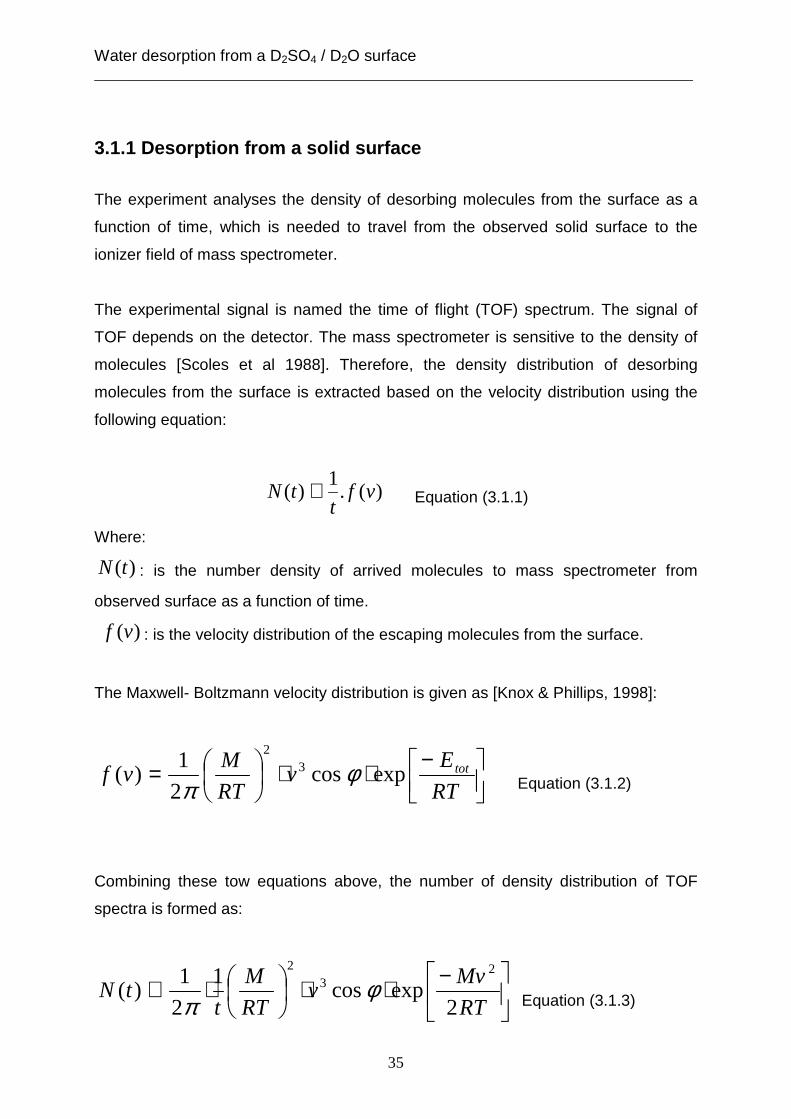
3.1.1 Desorption from a solid surface
The experiment analyses the density of desorbing molecules from the surface as a
function of time, which is needed to travel from the observed solid surface to the
ionizer field of mass spectrometer.
The experimental signal is named the time of flight (TOF) spectrum. The signal of
TOF depends on the detector. The mass spectrometer is sensitive to the density of
molecules [Scoles et al 1988]. Therefore, the density distribution of desorbing
molecules from the surface is extracted based on the velocity distribution using the
following equation:
)(.1
)( vft
tN ∝ Equation (3.1.1)
Where:
)(tN : is the number density of arrived molecules to mass spectrometer from
observed surface as a function of time.
)(vf : is the velocity distribution of the escaping molecules from the surface.
The Maxwell- Boltzmann velocity distribution is given as [Knox & Phillips, 1998]:
−⋅⋅
=RT
Ev
RT
Mvf totexpcos
2
1)( 3
2
φπ Equation (3.1.2)
Combining these tow equations above, the number of density distribution of TOF
spectra is formed as:
−⋅⋅
⋅∝RT
Mvv
RT
M
ttN
2expcos
1
2
1)(
23
2
φπ Equation (3.1.3)
Water desorption from a D2SO4 / D2O surface ___________________________________________________________________________
36
0 500 1000 1500 2000
D2O
Eva
pora
tion
Int
en
sity
Arrival Time [µs]
N(t) measurement Maxwell-Boltzmann distribution
Tsol id
= 213 K
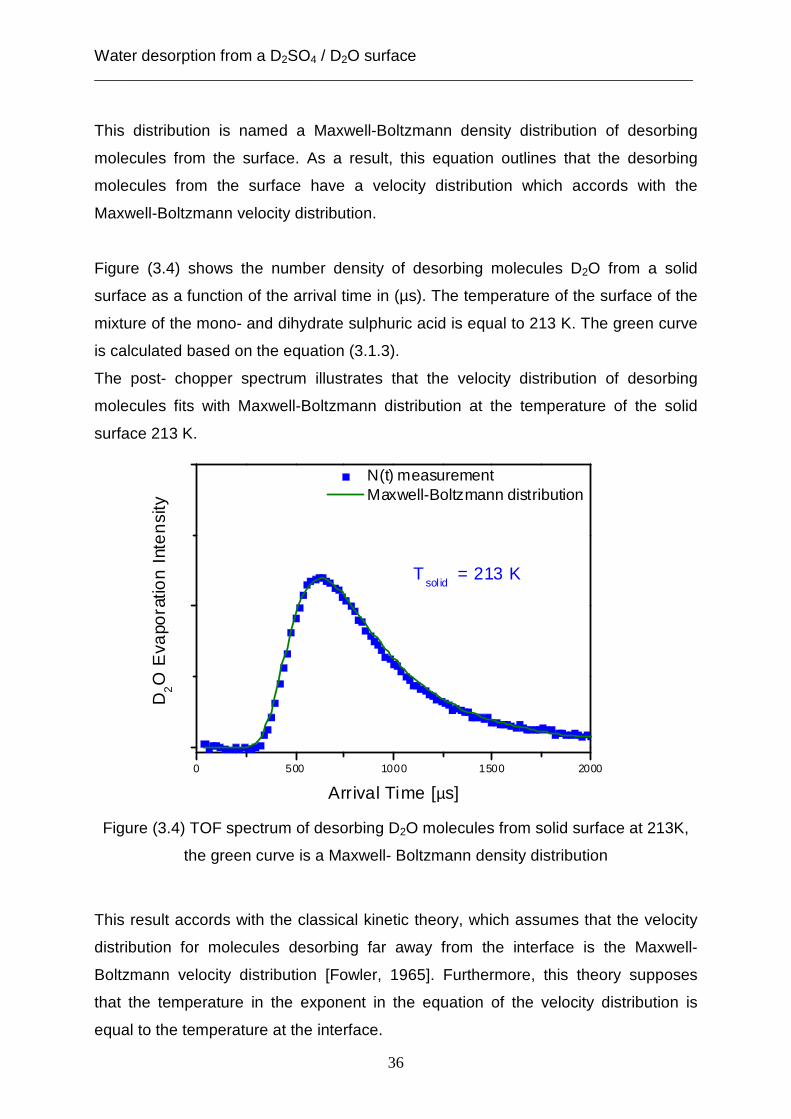
This distribution is named a Maxwell-Boltzmann density distribution of desorbing
molecules from the surface. As a result, this equation outlines that the desorbing
molecules from the surface have a velocity distribution which accords with the
Maxwell-Boltzmann velocity distribution.
Figure (3.4) shows the number density of desorbing molecules D2O from a solid
surface as a function of the arrival time in (µs). The temperature of the surface of the
mixture of the mono- and dihydrate sulphuric acid is equal to 213 K. The green curve
is calculated based on the equation (3.1.3).
The post- chopper spectrum illustrates that the velocity distribution of desorbing
molecules fits with Maxwell-Boltzmann distribution at the temperature of the solid
surface 213 K.
Figure (3.4) TOF spectrum of desorbing D2O molecules from solid surface at 213K,
the green curve is a Maxwell- Boltzmann density distribution
This result accords with the classical kinetic theory, which assumes that the velocity
distribution for molecules desorbing far away from the interface is the Maxwell-
Boltzmann velocity distribution [Fowler, 1965]. Furthermore, this theory supposes
that the temperature in the exponent in the equation of the velocity distribution is
equal to the temperature at the interface.
Water desorption from a D2SO4 / D2O surface ___________________________________________________________________________
37
0 500 1000 1500 2000
D2O
Eva
pora
tion
sig
nal
Arrival time [µs]
N(t) Max. Boltz. distribution N(t) φ =0° N(t) φ =5° N(t) φ =30° N(t) φ =40° N(t) φ =55° N(t) φ =60° N(t) φ =65°
Tsolid = 213 K
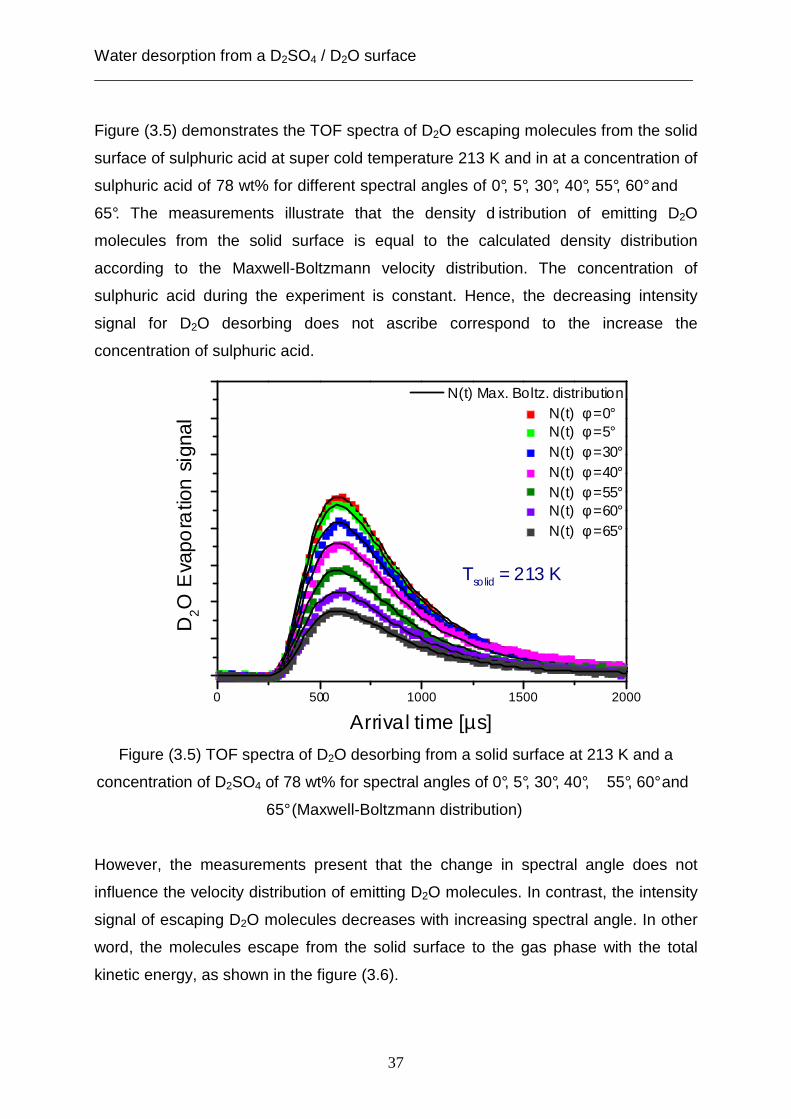
Figure (3.5) demonstrates the TOF spectra of D2O escaping molecules from the solid
surface of sulphuric acid at super cold temperature 213 K and in at a concentration of
sulphuric acid of 78 wt% for different spectral angles of 0°, 5°, 30°, 40°, 55°, 60° and
65°. The measurements illustrate that the density d istribution of emitting D2O
molecules from the solid surface is equal to the calculated density distribution
according to the Maxwell-Boltzmann velocity distribution. The concentration of
sulphuric acid during the experiment is constant. Hence, the decreasing intensity
signal for D2O desorbing does not ascribe correspond to the increase the
concentration of sulphuric acid.
Figure (3.5) TOF spectra of D2O desorbing from a solid surface at 213 K and a
concentration of D2SO4 of 78 wt% for spectral angles of 0°, 5°, 30°, 40°, 55°, 60° and
65° (Maxwell-Boltzmann distribution)
However, the measurements present that the change in spectral angle does not
influence the velocity distribution of emitting D2O molecules. In contrast, the intensity
signal of escaping D2O molecules decreases with increasing spectral angle. In other
word, the molecules escape from the solid surface to the gas phase with the total
kinetic energy, as shown in the figure (3.6).

Water desorption from a D2SO4 / D2O surface ___________________________________________________________________________
38
Figure (3.6) Schematic view of the difference between the spectral angle and the
kinetic energy of desorption (solid surface)
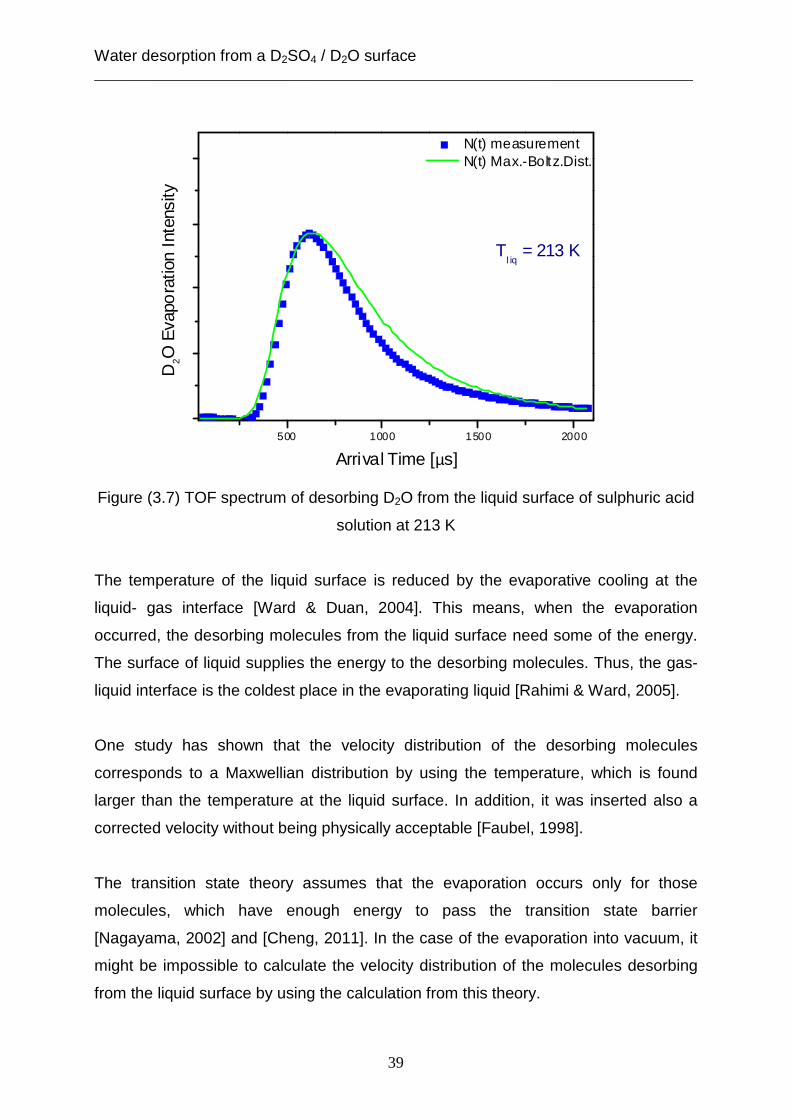
3.1.2 Desorption from a liquid surface
In case of a fluid surface, the post- chopper spectra indicate that the Maxwell-
Boltzmann density distribution is broader than the experimental density distribution,
as presented in figure (3.7). This observation points out that the velocity distribution
of the desorbing D2O molecules from a liquid surface is different from the velocity
distribution of escaping D2O molecules from a solid surface. Additionally, the
difference of experimental data and Maxwell-Boltzmann density distribution
decreases, when the value of the temperature of the liquid surface becomes higher.
In fact, the statistical rate theory suggests that the velocity distribution of the emitted
molecules from the liquid surface has a Maxwell-Boltzmann distribution but with
higher temperature than from the surface of the liquid. The difference in temperature
in the gas phase and on the surface is approximately about 7 K [Ward & Fang, 1998].
Nevertheless, the results of the vacuum evaporation experiment are not associated
with the calculation based on the statistical rate theory, because the deviation from
this theory is more than 20 K.
Water desorption from a D2SO4 / D2O surface ___________________________________________________________________________
39
500 1000 1500 2000
D2O
Eva
pora
tion
Inte
nsity
Arrival Time [µs]
N(t) measurement N(t) Max.-Boltz.Dist.
Tl iq
= 213 K
Figure (3.7) TOF spectrum of desorbing D2O from the liquid surface of sulphuric acid
solution at 213 K
The temperature of the liquid surface is reduced by the evaporative cooling at the
liquid- gas interface [Ward & Duan, 2004]. This means, when the evaporation
occurred, the desorbing molecules from the liquid surface need some of the energy.
The surface of liquid supplies the energy to the desorbing molecules. Thus, the gas-
liquid interface is the coldest place in the evaporating liquid [Rahimi & Ward, 2005].
One study has shown that the velocity distribution of the desorbing molecules
corresponds to a Maxwellian distribution by using the temperature, which is found
larger than the temperature at the liquid surface. In addition, it was inserted also a
corrected velocity without being physically acceptable [Faubel, 1998].
The transition state theory assumes that the evaporation occurs only for those
molecules, which have enough energy to pass the transition state barrier
[Nagayama, 2002] and [Cheng, 2011]. In the case of the evaporation into vacuum, it
might be impossible to calculate the velocity distribution of the molecules desorbing
from the liquid surface by using the calculation from this theory.
Water desorption from a D2SO4 / D2O surface ___________________________________________________________________________
40
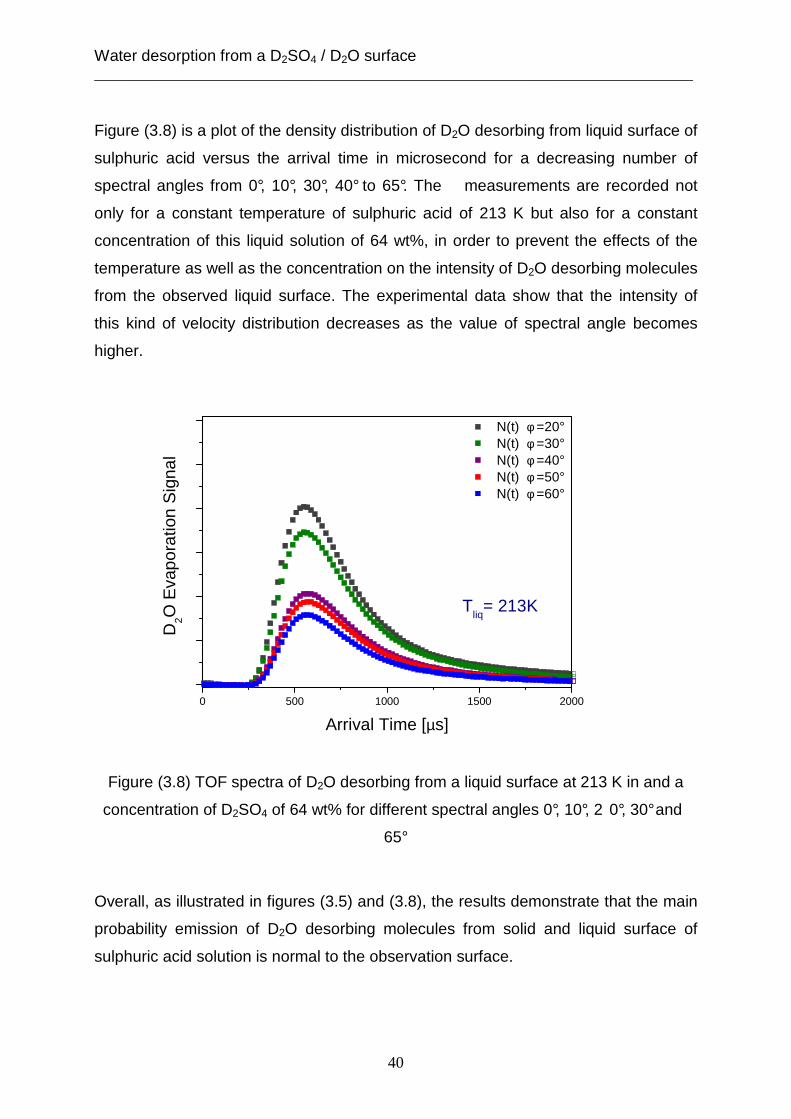
Figure (3.8) is a plot of the density distribution of D2O desorbing from liquid surface of
sulphuric acid versus the arrival time in microsecond for a decreasing number of
spectral angles from 0°, 10°, 30°, 40° to 65°. The measurements are recorded not
only for a constant temperature of sulphuric acid of 213 K but also for a constant
concentration of this liquid solution of 64 wt%, in order to prevent the effects of the
temperature as well as the concentration on the intensity of D2O desorbing molecules
from the observed liquid surface. The experimental data show that the intensity of
this kind of velocity distribution decreases as the value of spectral angle becomes
higher.
Figure (3.8) TOF spectra of D2O desorbing from a liquid surface at 213 K in and a
concentration of D2SO4 of 64 wt% for different spectral angles 0°, 10°, 2 0°, 30° and
65°
Overall, as illustrated in figures (3.5) and (3.8), the results demonstrate that the main
probability emission of D2O desorbing molecules from solid and liquid surface of
sulphuric acid solution is normal to the observation surface.
0 500 1000 1500 2000
D2O
Eva
pora
tion
Sig
nal
Arrival Time [µs]
N(t) φ =20° N(t) φ =30° N(t) φ =40° N(t) φ =50° N(t) φ =60°
Tliq
= 213K
Water desorption from a D2SO4 / D2O surface ___________________________________________________________________________
41
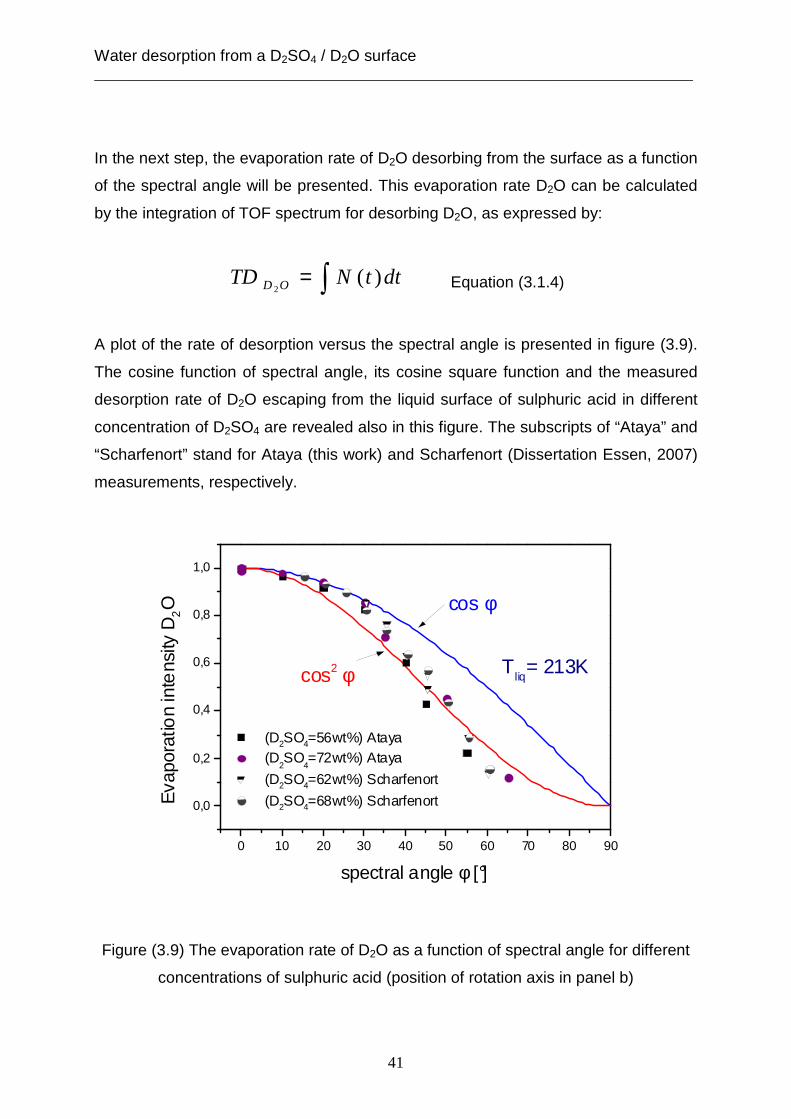
In the next step, the evaporation rate of D2O desorbing from the surface as a function
of the spectral angle will be presented. This evaporation rate D2O can be calculated
by the integration of TOF spectrum for desorbing D2O, as expressed by:
∫= dttNTD OD )(2 Equation (3.1.4)
A plot of the rate of desorption versus the spectral angle is presented in figure (3.9).
The cosine function of spectral angle, its cosine square function and the measured
desorption rate of D2O escaping from the liquid surface of sulphuric acid in different
concentration of D2SO4 are revealed also in this figure. The subscripts of “Ataya” and
“Scharfenort” stand for Ataya (this work) and Scharfenort (Dissertation Essen, 2007)
measurements, respectively.
Figure (3.9) The evaporation rate of D2O as a function of spectral angle for different
concentrations of sulphuric acid (position of rotation axis in panel b)
0 10 20 30 40 50 60 70 80 90
0,0
0,2
0,4
0,6
0,8
1,0
Eva
pora
tion
inte
nsity
D2O
spectral angle φ [°]
(D2SO4=56wt%) Ataya (D
2SO
4=72wt%) Ataya
(D2SO4=62wt%) Scharfenort
(D2SO4=68wt%) Scharfenort
cos2 φ
cos φ
Tliq
= 213K
Water desorption from a D2SO4 / D2O surface ___________________________________________________________________________
42
Desorption rates are normalized to the highest value of the desorption rate at
spectral angle ( °= 0φ ) for each concentration of sulphuric acid solution. As shown in
this figure, the measurements of desorption rate is associated with the cosine
function of the spectral angle between (0°- 30°). A fter that, the deviation of the
experimental desorption rate from the cosine function curve increases at spectral
angles above 30°. Eventually, the reduction of deso rption rate can not be determined
as a function of spectral angle. As expected, the normalized rate of desorption does
not depend on the concentration of sulphuric acid.
In a previous study [Scharfenort, 2007] of the desorption rate for D2O molecules from
the liquid surface of D2SO4 it was shown that the reduction of the evaporation rate is
expressed as a function of angular cosine square of the spectral angle (φ ). The
results of this study did not consider the decrease of the desorption rate which is
affected by the geometrical liquid reservoir in the scattering chamber as well as by
the acidity of the solution. The effect of the acidity of the solution on the evaporation
rate can be vanished through the normalization of this rate as outlined above.
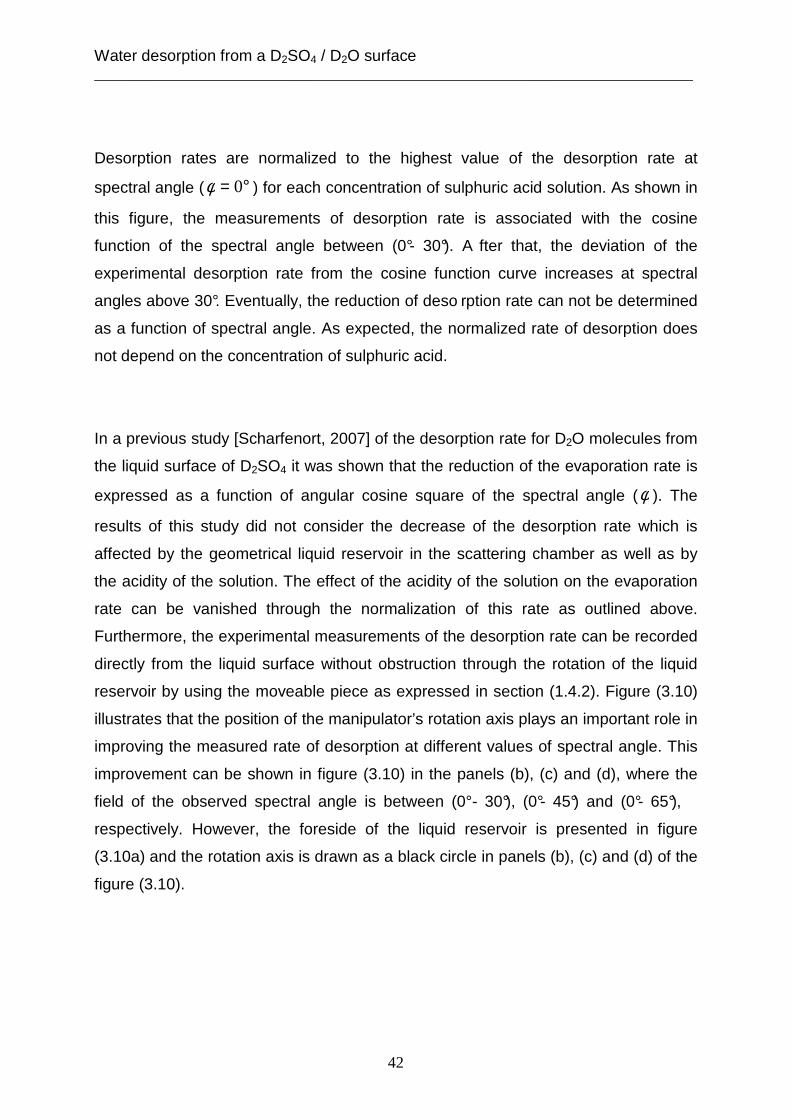
Furthermore, the experimental measurements of the desorption rate can be recorded
directly from the liquid surface without obstruction through the rotation of the liquid
reservoir by using the moveable piece as expressed in section (1.4.2). Figure (3.10)
illustrates that the position of the manipulator’s rotation axis plays an important role in
improving the measured rate of desorption at different values of spectral angle. This
improvement can be shown in figure (3.10) in the panels (b), (c) and (d), where the
field of the observed spectral angle is between (0°- 30°), (0°- 45°) and (0°- 65°),
respectively. However, the foreside of the liquid reservoir is presented in figure
(3.10a) and the rotation axis is drawn as a black circle in panels (b), (c) and (d) of the
figure (3.10).
Water desorption from a D2SO4 / D2O surface ___________________________________________________________________________
43
Figure (3.10) Schematic view for the improvement of the spectral angle
Figure (3.11) displays that the deviation between the measured rate of the desorption
for escaping D2O molecules from the liquid surface and the curve of the angular
cosine function of the spectral angle decreases at spectral angles above 40° and 45°.
Additionally, these measurements are in accord with the calculated values based on
the cosine function of spectral angle, while the difference between the experimental
data and the curve of the cosine function increases again at the observed angle
above 45°. In this case, the position of the rotati on axis of the manipulator was in
front of the liquid reservoir, as illustrated in figure (3.10 c). As a result, the deviation
between the measured rate of the evaporation and the cosine function of the spectral
angle is caused by the prevention of the desorbed molecules from the liquid surface
which depends on the geometrical liquid reservoir in the scattering chamber, as
shown in figure (3.10 b).
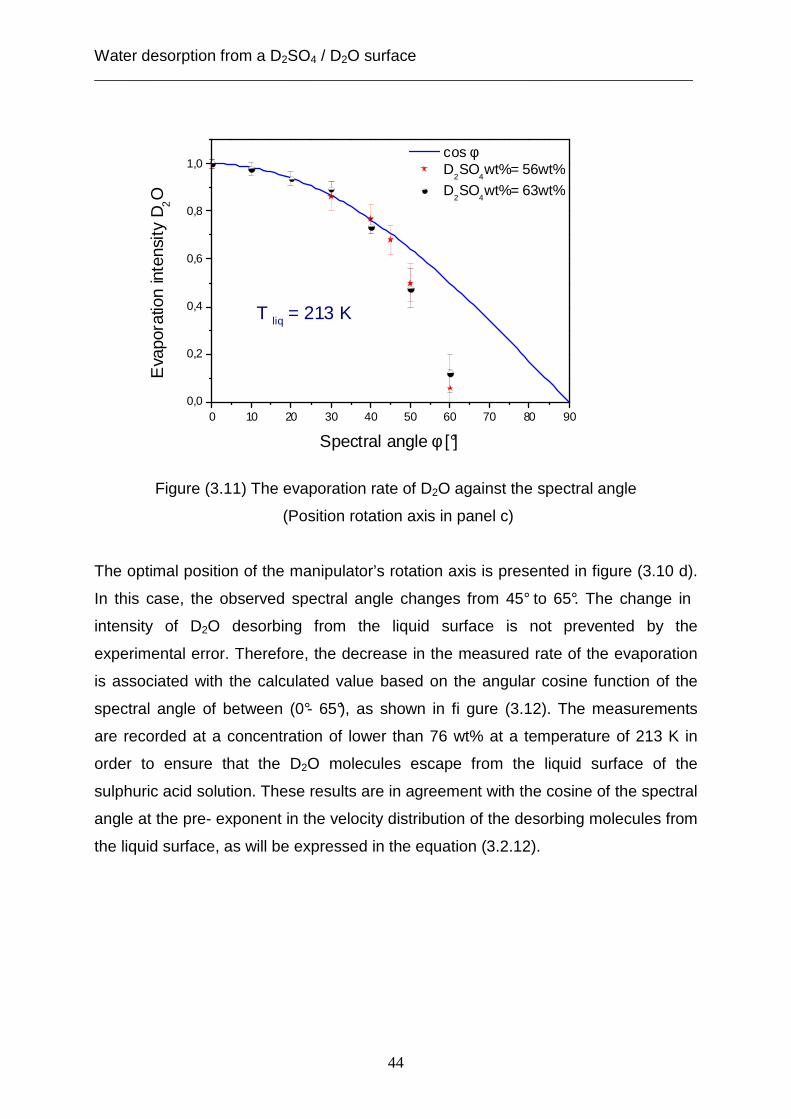
Water desorption from a D2SO4 / D2O surface ___________________________________________________________________________
44
0 10 20 30 40 50 60 70 80 900,0
0,2
0,4
0,6
0,8
1,0
Eva
pora
tion
inte
nsity
D2O
Spectral angle φ [°]
cos φ D
2SO
4wt%= 56wt%
D2SO
4wt%= 63wt%
T liq = 213 K
Figure (3.11) The evaporation rate of D2O against the spectral angle
(Position rotation axis in panel c)
The optimal position of the manipulator’s rotation axis is presented in figure (3.10 d).
In this case, the observed spectral angle changes from 45° to 65°. The change in
intensity of D2O desorbing from the liquid surface is not prevented by the
experimental error. Therefore, the decrease in the measured rate of the evaporation
is associated with the calculated value based on the angular cosine function of the
spectral angle of between (0°- 65°), as shown in fi gure (3.12). The measurements
are recorded at a concentration of lower than 76 wt% at a temperature of 213 K in
order to ensure that the D2O molecules escape from the liquid surface of the
sulphuric acid solution. These results are in agreement with the cosine of the spectral
angle at the pre- exponent in the velocity distribution of the desorbing molecules from
the liquid surface, as will be expressed in the equation (3.2.12).

Water desorption from a D2SO4 / D2O surface ___________________________________________________________________________
45
0 10 20 30 40 50 60 70 80 900,0
0,2
0,4
0,6
0,8
1,0
Eva
pora
tion
inte
nsity
D2O
Spectral angle φ [°]
cos φ D
2SO
4wt%= 50wt%
D2SO
4wt%= 56wt%
D2SO4wt%= 60wt%
Tliq= 213 K
Figure (3.12) The evaporation rate of D2O from the liquid surface versus the spectral
angle (position of the rotation axis in panel d)
A plot of the D2O evaporation rate against the spectral angle is outlined in figure
(3.13). The measured values of the desorption rate of the escaping D2O from the
liquid surface and the solid surface of the sulphuric acid solution at the temperature
of 213 K and at the concentrations of 54 wt% and 78 wt% are presented as a circles
and triangles, respectively.
Figure (3.13) The desorption rate of the escaping molecules from the liquid and the
solid surface as a function of the spectral angle
0 10 20 30 40 50 60 70 80 90
0,0
0,2
0,4
0,6
0,8
1,0
Eva
pora
tion
inte
nsity
D2O
Spectral angle φ [°]
cos φ D
2SO
4wt%= 54wt%
D2SO
4wt%= 78wt% (solid)
T= 213K
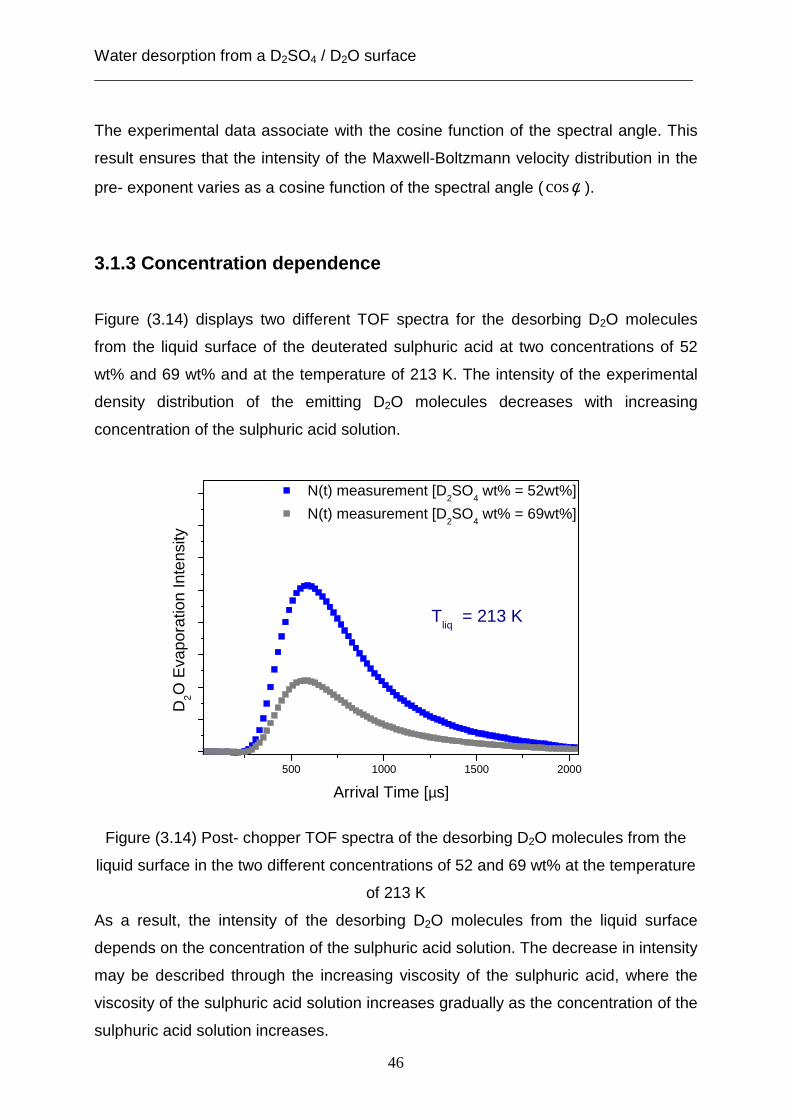
Water desorption from a D2SO4 / D2O surface ___________________________________________________________________________
46
The experimental data associate with the cosine function of the spectral angle. This
result ensures that the intensity of the Maxwell-Boltzmann velocity distribution in the
pre- exponent varies as a cosine function of the spectral angle ( φcos ).
3.1.3 Concentration dependence
Figure (3.14) displays two different TOF spectra for the desorbing D2O molecules
from the liquid surface of the deuterated sulphuric acid at two concentrations of 52
wt% and 69 wt% and at the temperature of 213 K. The intensity of the experimental
density distribution of the emitting D2O molecules decreases with increasing
concentration of the sulphuric acid solution.
Figure (3.14) Post- chopper TOF spectra of the desorbing D2O molecules from the
liquid surface in the two different concentrations of 52 and 69 wt% at the temperature
of 213 K
As a result, the intensity of the desorbing D2O molecules from the liquid surface
depends on the concentration of the sulphuric acid solution. The decrease in intensity
may be described through the increasing viscosity of the sulphuric acid, where the
viscosity of the sulphuric acid solution increases gradually as the concentration of the
sulphuric acid solution increases.
500 1000 1500 2000
D2O
Eva
pora
tion
Inte
nsity
Arrival Time [µs]
N(t) measurement [D2SO
4 wt% = 52wt%]
N(t) measurement [D2SO
4 wt% = 69wt%]
Tliq
= 213 K
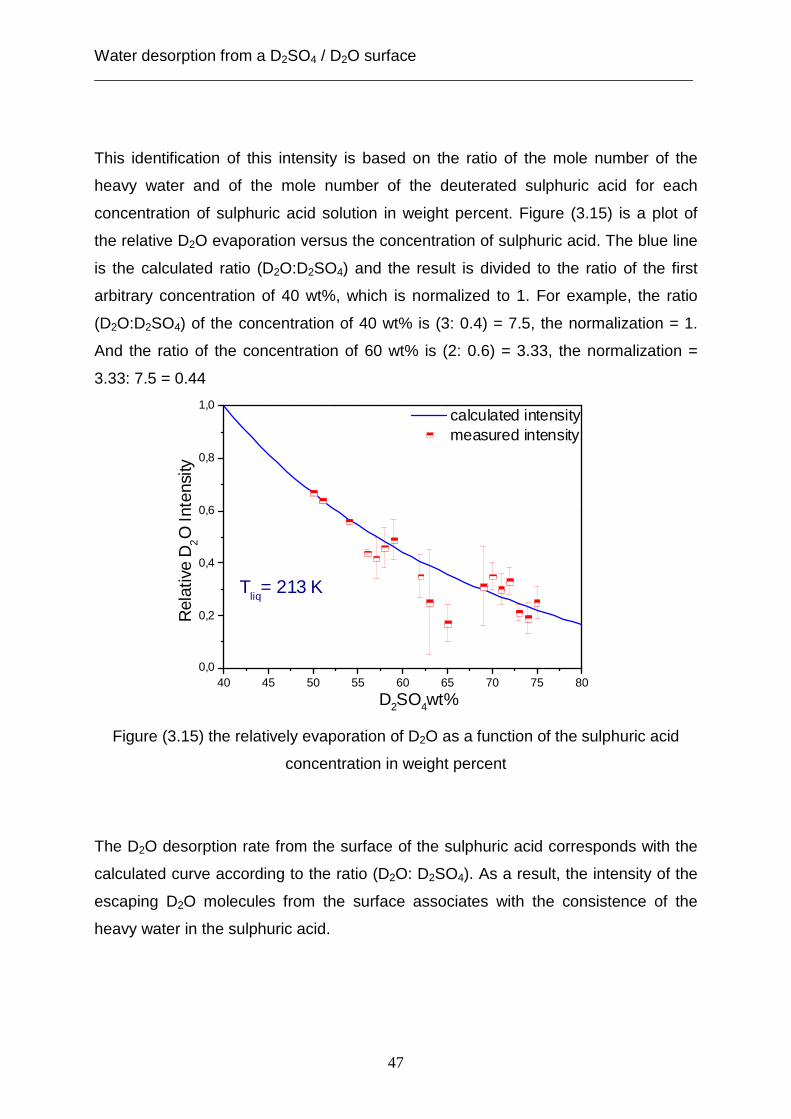
Water desorption from a D2SO4 / D2O surface ___________________________________________________________________________
47
This identification of this intensity is based on the ratio of the mole number of the
heavy water and of the mole number of the deuterated sulphuric acid for each
concentration of sulphuric acid solution in weight percent. Figure (3.15) is a plot of
the relative D2O evaporation versus the concentration of sulphuric acid. The blue line
is the calculated ratio (D2O:D2SO4) and the result is divided to the ratio of the first
arbitrary concentration of 40 wt%, which is normalized to 1. For example, the ratio
(D2O:D2SO4) of the concentration of 40 wt% is (3: 0.4) = 7.5, the normalization = 1.
And the ratio of the concentration of 60 wt% is (2: 0.6) = 3.33, the normalization =
3.33: 7.5 = 0.44
Figure (3.15) the relatively evaporation of D2O as a function of the sulphuric acid
concentration in weight percent
The D2O desorption rate from the surface of the sulphuric acid corresponds with the
calculated curve according to the ratio (D2O: D2SO4). As a result, the intensity of the
escaping D2O molecules from the surface associates with the consistence of the
heavy water in the sulphuric acid.
40 45 50 55 60 65 70 75 800,0
0,2
0,4
0,6
0,8
1,0
Rel
ativ
e D
2O
Inte
nsity
D2SO4wt%
calculated intensity measured intensity
Tliq
= 213 K
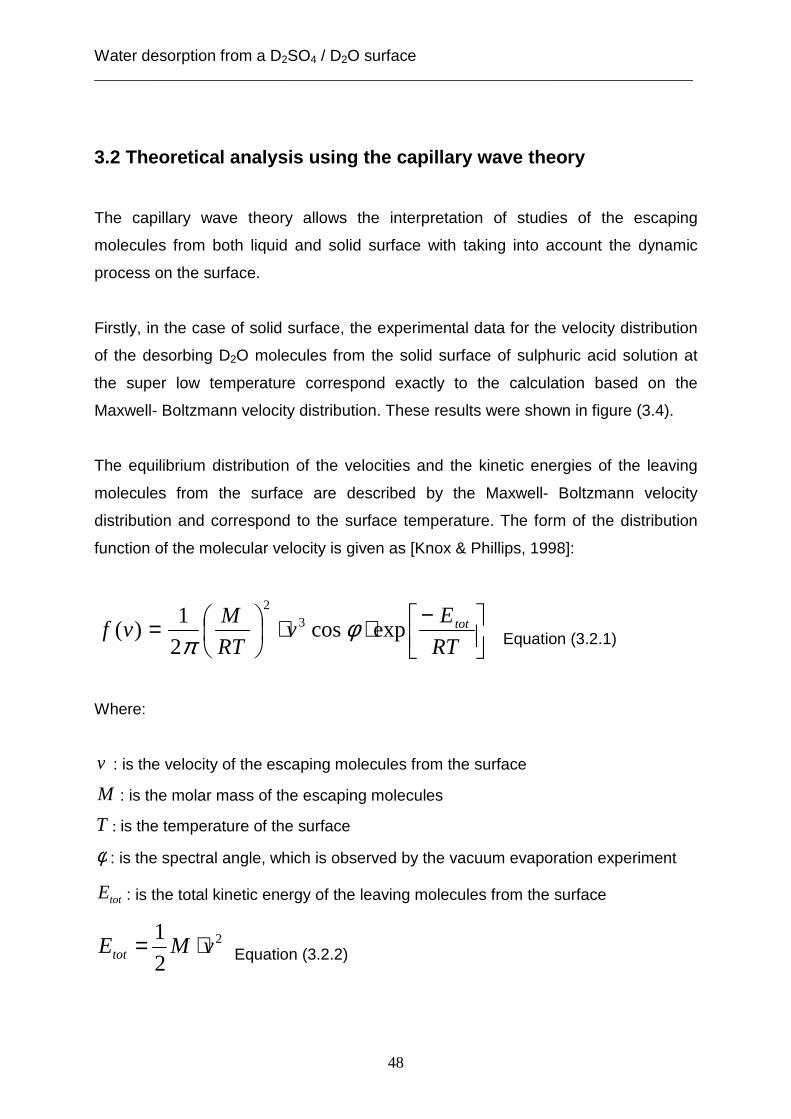
Water desorption from a D2SO4 / D2O surface ___________________________________________________________________________
48
3.2 Theoretical analysis using the capillary wave theory
The capillary wave theory allows the interpretation of studies of the escaping
molecules from both liquid and solid surface with taking into account the dynamic
process on the surface.
Firstly, in the case of solid surface, the experimental data for the velocity distribution
of the desorbing D2O molecules from the solid surface of sulphuric acid solution at
the super low temperature correspond exactly to the calculation based on the
Maxwell- Boltzmann velocity distribution. These results were shown in figure (3.4).
The equilibrium distribution of the velocities and the kinetic energies of the leaving
molecules from the surface are described by the Maxwell- Boltzmann velocity
distribution and correspond to the surface temperature. The form of the distribution
function of the molecular velocity is given as [Knox & Phillips, 1998]:
−⋅⋅
=RT
Ev
RT
Mvf totexpcos
2
1)( 3
2
φπ Equation (3.2.1)
Where:
v : is the velocity of the escaping molecules from the surface
M : is the molar mass of the escaping molecules
T : is the temperature of the surface
φ : is the spectral angle, which is observed by the vacuum evaporation experiment
totE : is the total kinetic energy of the leaving molecules from the surface
2
2
1vMEtot ⋅= Equation (3.2.2)
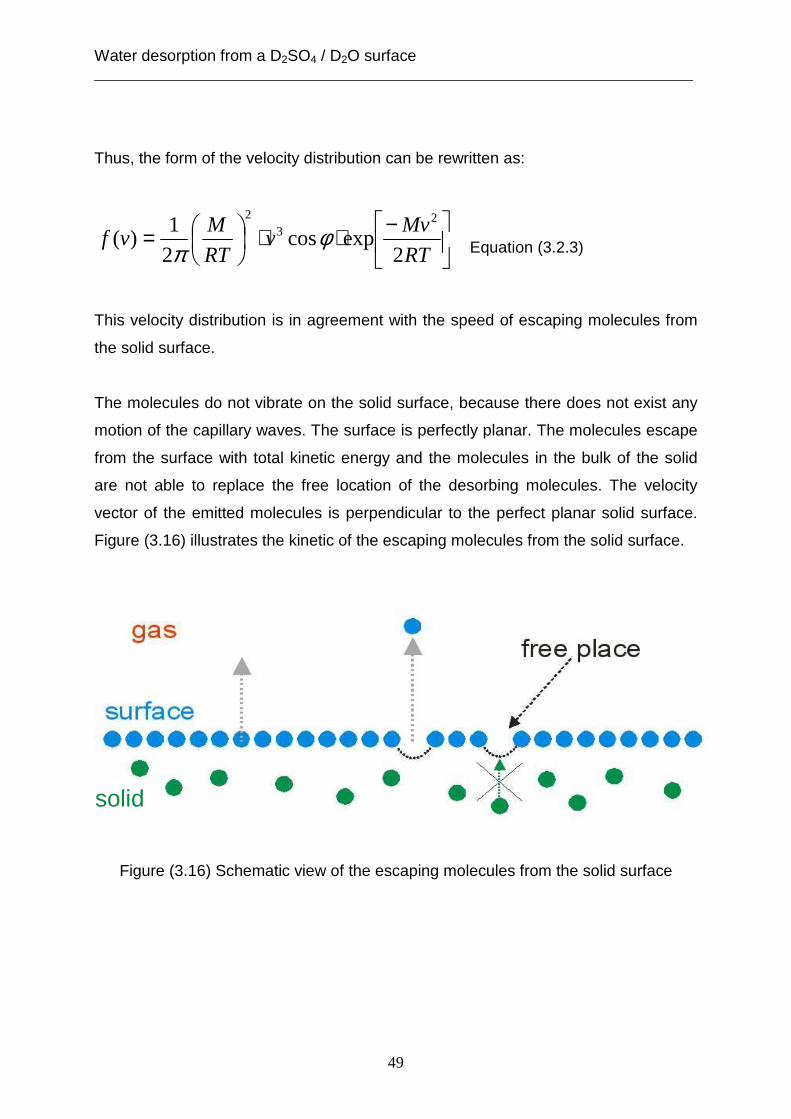
Water desorption from a D2SO4 / D2O surface ___________________________________________________________________________
49
Thus, the form of the velocity distribution can be rewritten as:
−⋅⋅
=RT
Mvv
RT
Mvf
2expcos
2
1)(
23
2
φπ Equation (3.2.3)
This velocity distribution is in agreement with the speed of escaping molecules from
the solid surface.
The molecules do not vibrate on the solid surface, because there does not exist any
motion of the capillary waves. The surface is perfectly planar. The molecules escape
from the surface with total kinetic energy and the molecules in the bulk of the solid
are not able to replace the free location of the desorbing molecules. The velocity
vector of the emitted molecules is perpendicular to the perfect planar solid surface.
Figure (3.16) illustrates the kinetic of the escaping molecules from the solid surface.
Figure (3.16) Schematic view of the escaping molecules from the solid surface
solid

Water desorption from a D2SO4 / D2O surface ___________________________________________________________________________
50
In the case of the fluid surface the Maxwell- Boltzmann distribution can not describe
the kinetic energies and the average velocities of the molecules desorbing from the
liquid surface, because the behaviour of the molecules on the surface of liquid is not
in the same as that on the surface of a solid. Therefore, a different distribution to
describe the desorbing molecules from the liquid surface will be needed. In fact, the
capillary wave theory supposes that the surface of the liquid is not extremely planar.
While the other three theories, which are outlined above, assume that the liquid
surface is perfectly flat. However, the transition state theory suggests that the
molecules in the liquid need sufficient energies in order to pass the thickness of
energy barrier at the transition state and desorb from the liquid surface. The
thickness of the energy barrier is identical to the dynamic surface which is expressed
by capillary wave theory. Hence, the molecules can escape from the liquid phase to
the gas phase only by passing through this dynamic surface. This dynamic surface
can be described exactly by using the local mode of the capillary wave theory. This
mode points out that the molecules are vibrating on the surface by the conjunction
with the thermal motion of capillary waves. As a result, this oscillation of the surface
molecules has an effect on the distribution of the velocities for the desorbing
molecules from the liquid surface.
Based on this theory, the kinetic process of the escaping molecules from the liquid
surface will be presented first, in order to understand the velocity distribution of these
molecules. The kinetic process of the desorption has two extreme cases [Phillips
1997]. Figure (3.17) illustrates these two cases. In the first extreme case, the emitted
molecules are lost from the tip of a sharp wavelet with the total kinetic energy and the
velocity trajectory being at the right angle to the original surface. In the second
extreme case, the molecules escape from the opposite side of the capillary wave and
the root mean square displacement moment and the velocity trajectory are
perpendicular to the mean surface.
The capillary waves oscillate over and under the planar surface. In the case of
desorption, only the period and the location of the wave motion over the original
surface are considered. The root mean square displacement moment is the average
time of the duration of the downward motion of the capillary wave over the mean
surface.
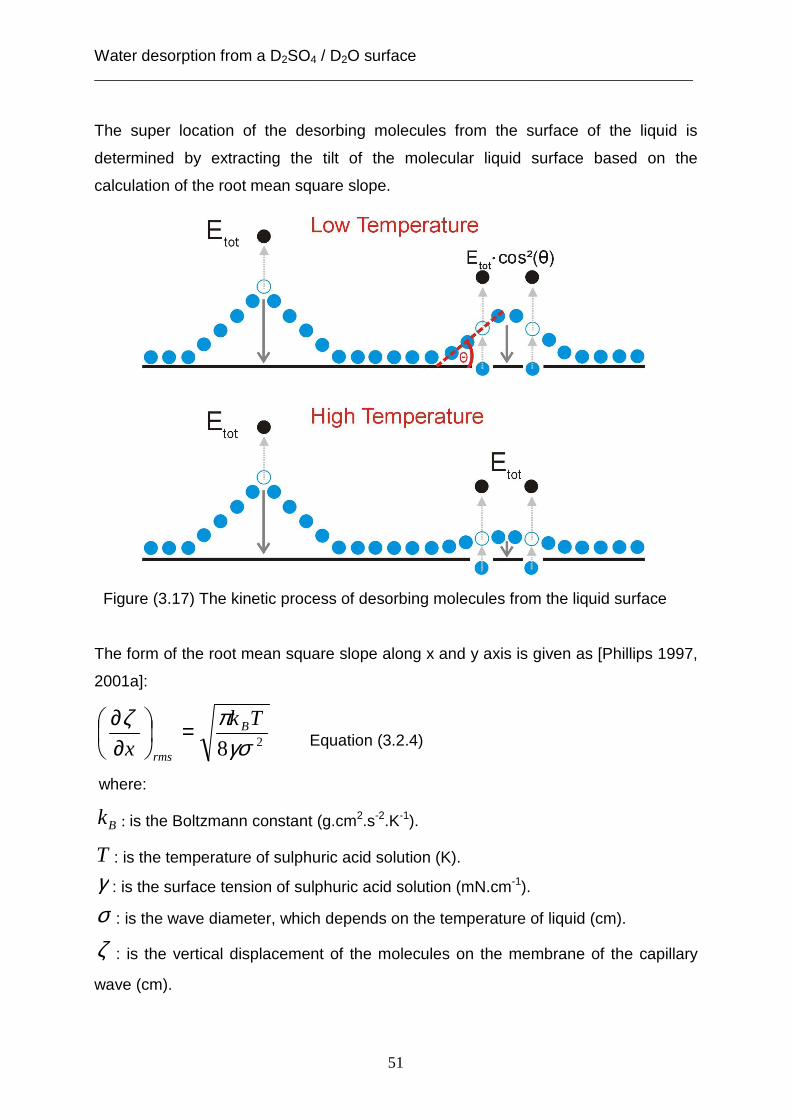
Water desorption from a D2SO4 / D2O surface ___________________________________________________________________________
51
The super location of the desorbing molecules from the surface of the liquid is
determined by extracting the tilt of the molecular liquid surface based on the
calculation of the root mean square slope.
Figure (3.17) The kinetic process of desorbing molecules from the liquid surface
The form of the root mean square slope along x and y axis is given as [Phillips 1997,
2001a]:
28γσπζ Tk
xB
rms
=
∂∂
Equation (3.2.4)
where:
Bk : is the Boltzmann constant (g.cm2.s-2.K-1).
T : is the temperature of sulphuric acid solution (K).
γ : is the surface tension of sulphuric acid solution (mN.cm-1).
σ : is the wave diameter, which depends on the temperature of liquid (cm).
ζ : is the vertical displacement of the molecules on the membrane of the capillary
wave (cm).
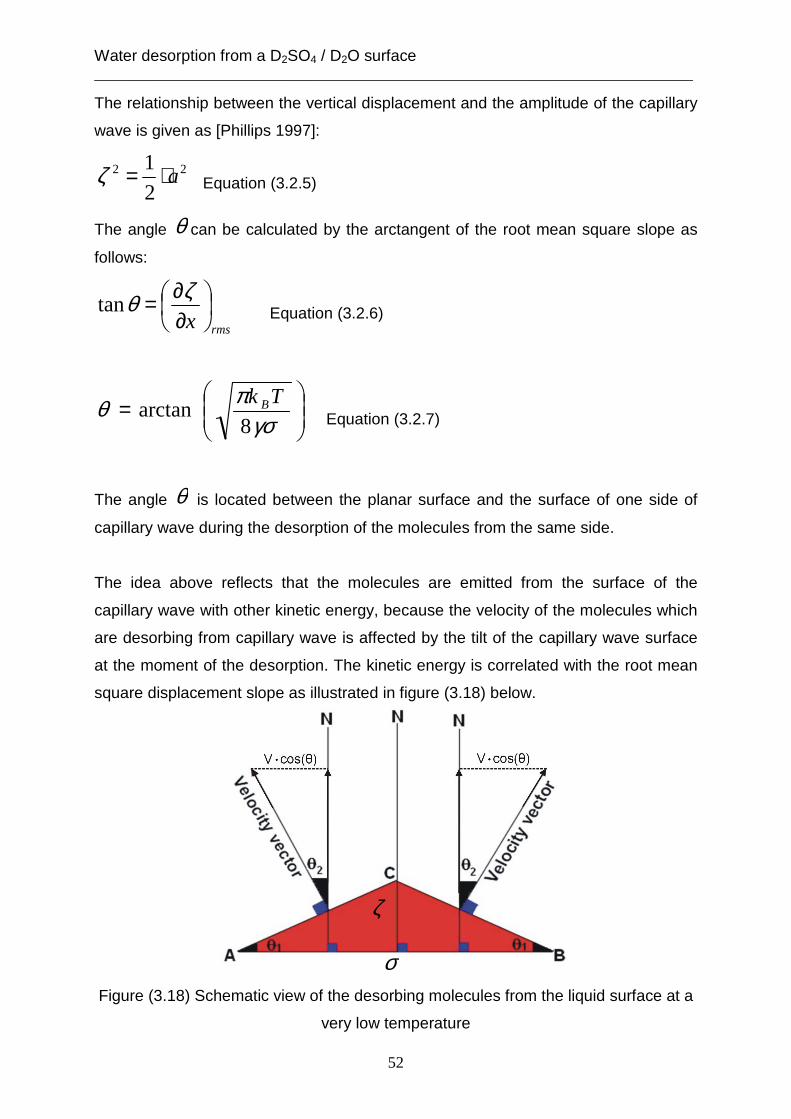
Water desorption from a D2SO4 / D2O surface ___________________________________________________________________________
52
ζ
σ
The relationship between the vertical displacement and the amplitude of the capillary
wave is given as [Phillips 1997]:
22
2
1a⋅=ζ Equation (3.2.5)
The angle θ can be calculated by the arctangent of the root mean square slope as
follows:
rmsx
∂∂= ζθtan Equation (3.2.6)
=
γσπθ8
arctanTk B
Equation (3.2.7)
The angle θ is located between the planar surface and the surface of one side of
capillary wave during the desorption of the molecules from the same side.
The idea above reflects that the molecules are emitted from the surface of the
capillary wave with other kinetic energy, because the velocity of the molecules which
are desorbing from capillary wave is affected by the tilt of the capillary wave surface
at the moment of the desorption. The kinetic energy is correlated with the root mean
square displacement slope as illustrated in figure (3.18) below.
Figure (3.18) Schematic view of the desorbing molecules from the liquid surface at a
very low temperature
Water desorption from a D2SO4 / D2O surface ___________________________________________________________________________
53
The triangle points out of the capillary wave at the root mean square displacement in
the positive amplitude (the location and the moment of the desorption). “N” is the
normal to the mean surface (planar surface) of the liquid. The angle 1θ is placed
between one of both sides of the capillary wave at the moment of the root mean
square displacement and the planar surface of the liquid. This angle is calculated as
described above. The angle 2θ is located between the pseudo velocity vector and
the normal to the mean surface.
The deviation of the trajectory of pseudo velocity vector to the normal has the same
slope of the tilting capillary wave at the moment of the root mean square
displacement (at the moment of the escaping molecules). In the case of the
desorbing molecules from the liquid surface, the velocity of the desorbing molecules
is given as:
θcos⋅= vvreal Equation (3.2.8)
where:
realv : is the real velocity of the molecules desorbing from the surface of capillary
wave at the moment of desorption
v : is the velocity of the desorbing molecules from the flat liquid surface
Therefore, the kinetic energy of the escaping molecules from the liquid surface is
given as:
θθ 22 cos2
1 ⋅⋅= vmE Equation (3.2.9)
The kinetic energy theta of a desorbing molecule at the angle θ to the normal is
equal to the total kinetic energy multiplied by θ2cos as [Phillips, 1997]:
θθ 2cos⋅= totEE Equation (3.2.10)

Water desorption from a D2SO4 / D2O surface ___________________________________________________________________________
54
From the formula arises the velocity distribution of the desorbing molecules from the
surface of the liquid:
( )
−⋅⋅⋅
=RT
Ev
RT
Mvf
θ
φπ
expcos2
1 32
Equation (3.2.11)
Combining equations (3.2.10) and (3.2.11) gives:
( )
−⋅⋅⋅
=RT
Mvv
RT
Mvf
θφπ
223
2cos
expcos21
Equation (3.2.12)
This formula is used to describe the velocity distribution for molecules which desorb
from the liquid surface. The essential difference from the Maxwellian velocity
distribution is the angular cosine square factor ( θ2cos ) in the exponential factor.
Henceforth, the velocity distribution of molecules which are emitted from the liquid
surface is named non-Maxwell-Boltzmann velocity distribution.
The figure (3.19) is the post- chopper signal of D2O molecules which desorb from the
liquid surface of deuterated sulphuric acid solution at temperature of 213 K. The red
curve shows the density distribution according to a non-Maxwell-Boltzmann velocity
distribution. This density distribution is extracted by combining equations (3.1.1) and
(3.2.12):
−⋅⋅
⋅∝RT
Mvv
RT
M
ttN
2
cosexpcos
1
2
1)(
223
2 θφπ Equation (3.2.13)
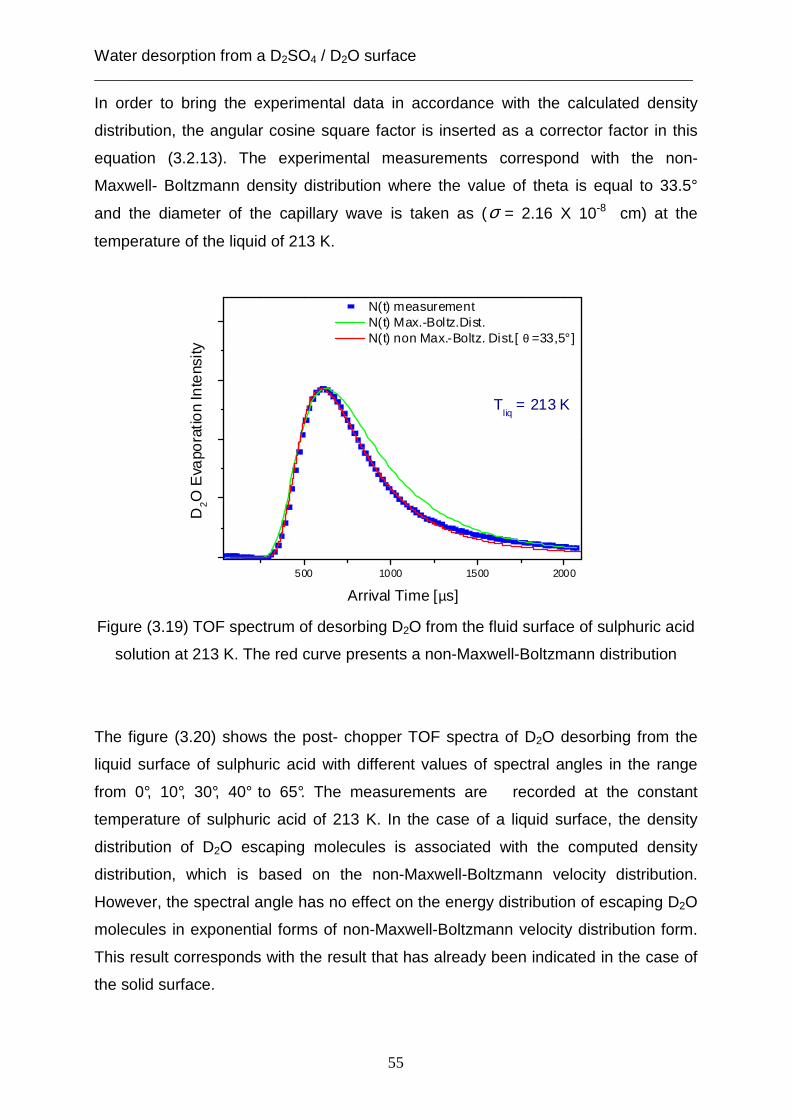
Water desorption from a D2SO4 / D2O surface ___________________________________________________________________________
55
In order to bring the experimental data in accordance with the calculated density
distribution, the angular cosine square factor is inserted as a corrector factor in this
equation (3.2.13). The experimental measurements correspond with the non-
Maxwell- Boltzmann density distribution where the value of theta is equal to 33.5°
and the diameter of the capillary wave is taken as (σ = 2.16 X 10⁻⁸ cm) at the
temperature of the liquid of 213 K.
Figure (3.19) TOF spectrum of desorbing D2O from the fluid surface of sulphuric acid
solution at 213 K. The red curve presents a non-Maxwell-Boltzmann distribution
The figure (3.20) shows the post- chopper TOF spectra of D2O desorbing from the
liquid surface of sulphuric acid with different values of spectral angles in the range
from 0°, 10°, 30°, 40° to 65°. The measurements are recorded at the constant
temperature of sulphuric acid of 213 K. In the case of a liquid surface, the density
distribution of D2O escaping molecules is associated with the computed density
distribution, which is based on the non-Maxwell-Boltzmann velocity distribution.
However, the spectral angle has no effect on the energy distribution of escaping D2O
molecules in exponential forms of non-Maxwell-Boltzmann velocity distribution form.
This result corresponds with the result that has already been indicated in the case of
the solid surface.
500 1000 1500 2000
D2O
Eva
pora
tion
Inte
nsity
Arrival Time [µs]
N(t) measurement N(t) Max.-Boltz.Dist. N(t) non Max.-Boltz. Dist.[ θ =33,5° ]
Tliq
= 213 K
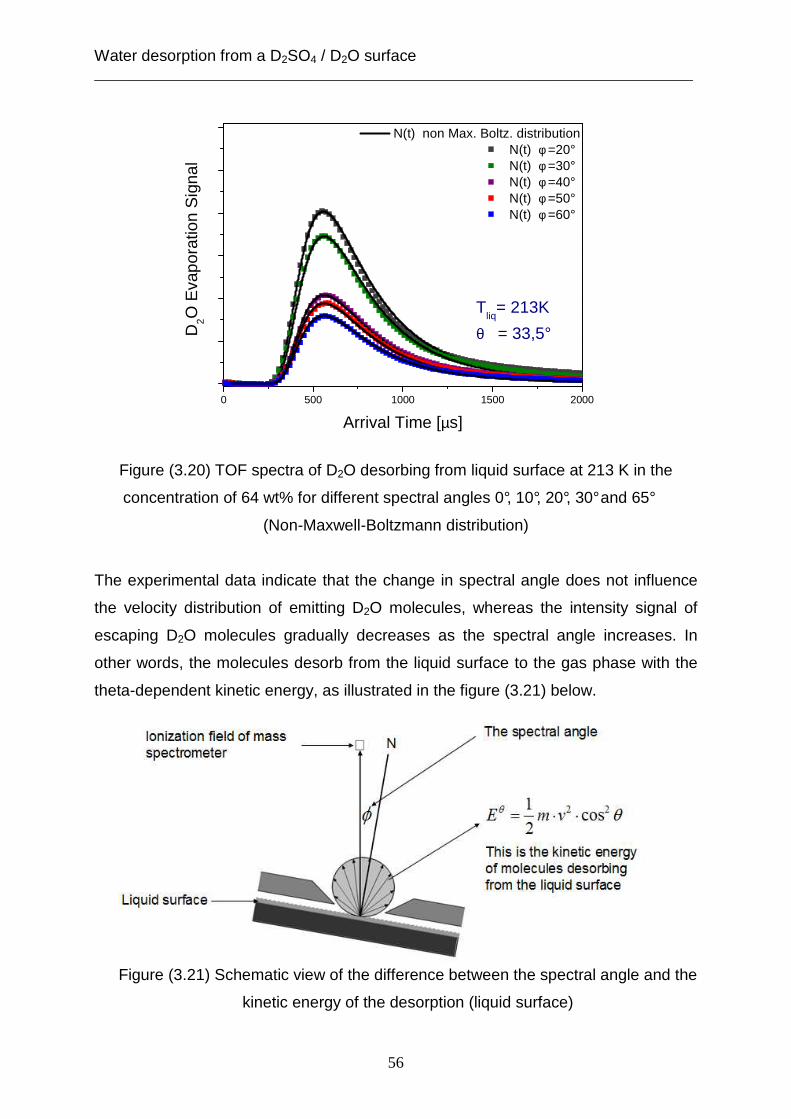
Water desorption from a D2SO4 / D2O surface ___________________________________________________________________________
56
Figure (3.20) TOF spectra of D2O desorbing from liquid surface at 213 K in the
concentration of 64 wt% for different spectral angles 0°, 10°, 20°, 30° and 65°
(Non-Maxwell-Boltzmann distribution)
The experimental data indicate that the change in spectral angle does not influence
the velocity distribution of emitting D2O molecules, whereas the intensity signal of
escaping D2O molecules gradually decreases as the spectral angle increases. In
other words, the molecules desorb from the liquid surface to the gas phase with the
theta-dependent kinetic energy, as illustrated in the figure (3.21) below.
Figure (3.21) Schematic view of the difference between the spectral angle and the
kinetic energy of the desorption (liquid surface)
0 500 1000 1500 2000
D2O
Eva
pora
tion
Sig
nal
Arrival Time [µs]
N(t) non Max. Boltz. distribution N(t) φ =20° N(t) φ =30° N(t) φ =40° N(t) φ =50° N(t) φ =60°
Tliq
= 213K
θ = 33,5°
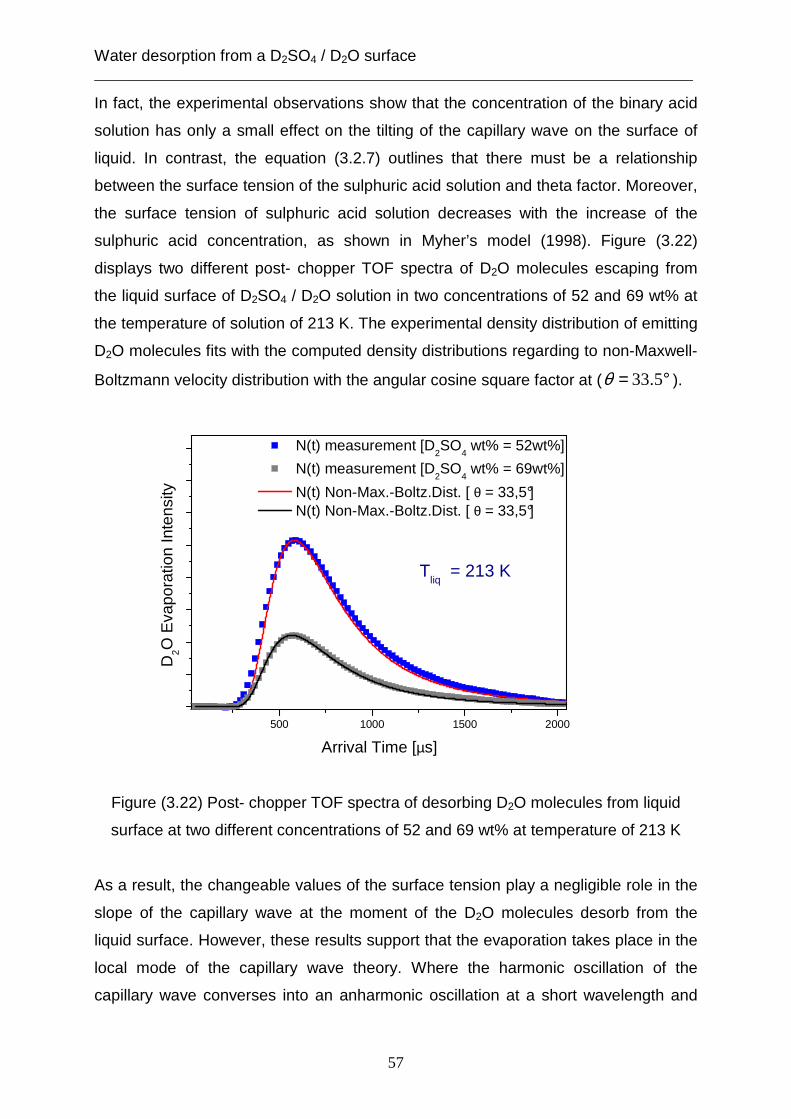
Water desorption from a D2SO4 / D2O surface ___________________________________________________________________________
57
In fact, the experimental observations show that the concentration of the binary acid
solution has only a small effect on the tilting of the capillary wave on the surface of
liquid. In contrast, the equation (3.2.7) outlines that there must be a relationship
between the surface tension of the sulphuric acid solution and theta factor. Moreover,
the surface tension of sulphuric acid solution decreases with the increase of the
sulphuric acid concentration, as shown in Myher’s model (1998). Figure (3.22)
displays two different post- chopper TOF spectra of D2O molecules escaping from
the liquid surface of D2SO4 / D2O solution in two concentrations of 52 and 69 wt% at
the temperature of solution of 213 K. The experimental density distribution of emitting
D2O molecules fits with the computed density distributions regarding to non-Maxwell-
Boltzmann velocity distribution with the angular cosine square factor at ( °= 5.33θ ).
Figure (3.22) Post- chopper TOF spectra of desorbing D2O molecules from liquid
surface at two different concentrations of 52 and 69 wt% at temperature of 213 K
As a result, the changeable values of the surface tension play a negligible role in the
slope of the capillary wave at the moment of the D2O molecules desorb from the
liquid surface. However, these results support that the evaporation takes place in the
local mode of the capillary wave theory. Where the harmonic oscillation of the
capillary wave converses into an anharmonic oscillation at a short wavelength and
500 1000 1500 2000
D2O
Eva
pora
tion
Inte
nsity
Arrival Time [µs]
N(t) measurement [D2SO
4 wt% = 52wt%]
N(t) measurement [D2SO
4 wt% = 69wt%]
N(t) Non-Max.-Boltz.Dist. [ θ = 33,5°] N(t) Non-Max.-Boltz.Dist. [ θ = 33,5°]
Tliq
= 213 K
rSlot
= 2 mm
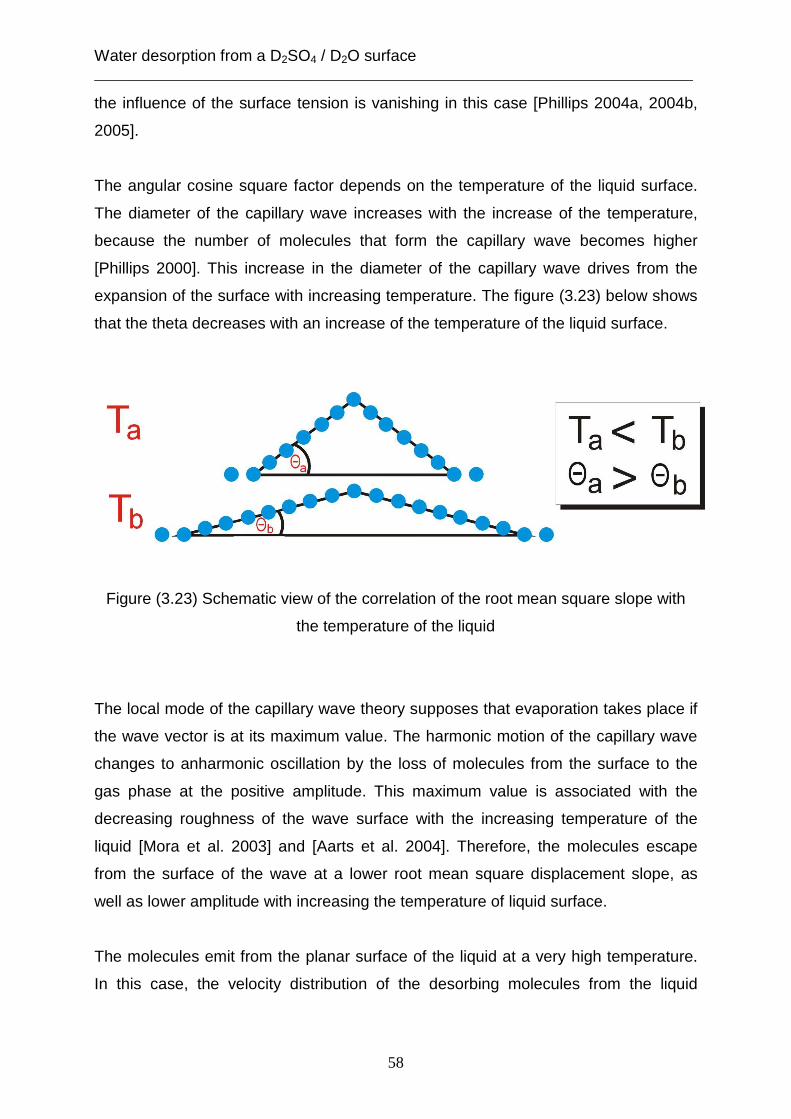
Water desorption from a D2SO4 / D2O surface ___________________________________________________________________________
58
the influence of the surface tension is vanishing in this case [Phillips 2004a, 2004b,
2005].
The angular cosine square factor depends on the temperature of the liquid surface.
The diameter of the capillary wave increases with the increase of the temperature,
because the number of molecules that form the capillary wave becomes higher
[Phillips 2000]. This increase in the diameter of the capillary wave drives from the
expansion of the surface with increasing temperature. The figure (3.23) below shows
that the theta decreases with an increase of the temperature of the liquid surface.
Figure (3.23) Schematic view of the correlation of the root mean square slope with
the temperature of the liquid
The local mode of the capillary wave theory supposes that evaporation takes place if
the wave vector is at its maximum value. The harmonic motion of the capillary wave
changes to anharmonic oscillation by the loss of molecules from the surface to the
gas phase at the positive amplitude. This maximum value is associated with the
decreasing roughness of the wave surface with the increasing temperature of the
liquid [Mora et al. 2003] and [Aarts et al. 2004]. Therefore, the molecules escape
from the surface of the wave at a lower root mean square displacement slope, as
well as lower amplitude with increasing the temperature of liquid surface.
The molecules emit from the planar surface of the liquid at a very high temperature.
In this case, the velocity distribution of the desorbing molecules from the liquid
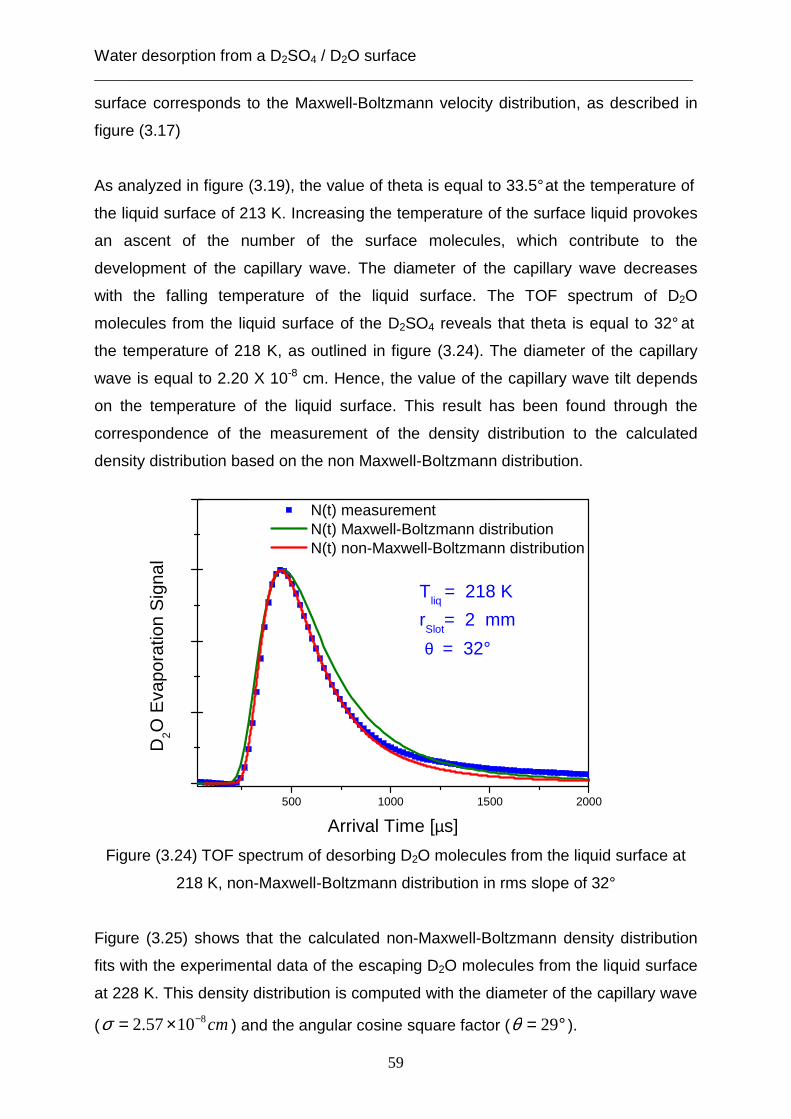
Water desorption from a D2SO4 / D2O surface ___________________________________________________________________________
59
500 1000 1500 2000
D2O
Eva
pora
tion
Sig
nal
Arrival Time [µs]
N(t) measurement N(t) Maxwell-Boltzmann distribution N(t) non-Maxwell-Boltzmann distribution
Tliq
= 218 K
rSlot
= 2 mm
θ = 32°
surface corresponds to the Maxwell-Boltzmann velocity distribution, as described in
figure (3.17)
As analyzed in figure (3.19), the value of theta is equal to 33.5° at the temperature of
the liquid surface of 213 K. Increasing the temperature of the surface liquid provokes
an ascent of the number of the surface molecules, which contribute to the
development of the capillary wave. The diameter of the capillary wave decreases
with the falling temperature of the liquid surface. The TOF spectrum of D2O
molecules from the liquid surface of the D2SO4 reveals that theta is equal to 32° at
the temperature of 218 K, as outlined in figure (3.24). The diameter of the capillary
wave is equal to 2.20 X 10⁻⁸ cm. Hence, the value of the capillary wave tilt depends
on the temperature of the liquid surface. This result has been found through the
correspondence of the measurement of the density distribution to the calculated
density distribution based on the non Maxwell-Boltzmann distribution.
Figure (3.24) TOF spectrum of desorbing D2O molecules from the liquid surface at
218 K, non-Maxwell-Boltzmann distribution in rms slope of 32°
Figure (3.25) shows that the calculated non-Maxwell-Boltzmann density distribution
fits with the experimental data of the escaping D2O molecules from the liquid surface
at 228 K. This density distribution is computed with the diameter of the capillary wave
( cm81057.2 −×=σ ) and the angular cosine square factor ( °= 29θ ).
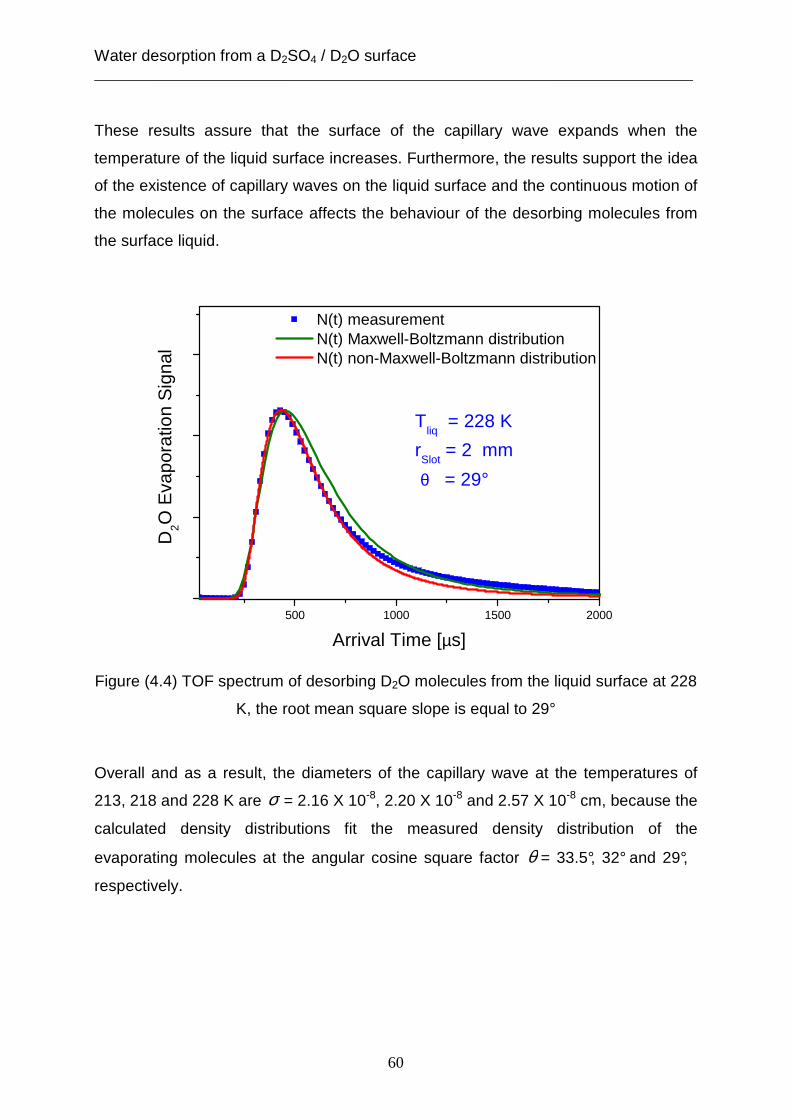
Water desorption from a D2SO4 / D2O surface ___________________________________________________________________________
60
500 1000 1500 2000
D2O
Eva
pora
tion
Sig
nal
Arrival Time [µs]
N(t) measurement N(t) Maxwell-Boltzmann distribution N(t) non-Maxwell-Boltzmann distribution
Tliq
= 228 K
rSlot
= 2 mm
θ = 29°
These results assure that the surface of the capillary wave expands when the
temperature of the liquid surface increases. Furthermore, the results support the idea
of the existence of capillary waves on the liquid surface and the continuous motion of
the molecules on the surface affects the behaviour of the desorbing molecules from
the surface liquid.
Figure (4.4) TOF spectrum of desorbing D2O molecules from the liquid surface at 228
K, the root mean square slope is equal to 29°
Overall and as a result, the diameters of the capillary wave at the temperatures of
213, 218 and 228 K are σ = 2.16 X 10⁻⁸, 2.20 X 10⁻⁸ and 2.57 X 10⁻⁸ cm, because the
calculated density distributions fit the measured density distribution of the
evaporating molecules at the angular cosine square factor θ = 33.5°, 32° and 29°,
respectively.
Water desorption from a D2SO4 / D2O surface ___________________________________________________________________________
61
To conclude, the intensity of the velocity distribution for escaping molecules from the
liquid surface and the solid surface depends on the angular cosine factor ( φcos ).
This angle is located between the normal to the whole surface (surface of liquid
wheel) and the distance, which is between the whole surface and the ionization field
of the mass spectrometer. This spectral angle (Ф) has no effect on the kinetic energy
of the desorbing molecules from either the solid surface or the liquid surface.
The intensity of the desorbing molecules from the liquid surface decreases with the
increase of the concentration of the sulphuric acid. That may occur by reducing the
velocity of the oscillation molecules at the local mode for capillary waves, because
the created capillary waves need to create more time after desorption with high
concentration than those with low concentration of sulphuric acid. Thus the delay
time to reform the oscillation motion has an effect on the intensity of desorbing
molecules from the liquid surface. However, the number of water molecules on the
surface becomes smaller with higher concentration of the sulphuric acid solution.
Therefore the intensity of the desorbing molecules from the surface is associated
with the number of the water molecules on the surface.
The surface tension decreases with the increase of the concentration of the sulphuric
acid solution, while the value of the viscosity becomes higher with increasing
concentration of sulphuric acid in solution. This change in the values of the viscosity
and the surface tension has an insufficient effect on the kinetic energies, which are
needed to escape from the solid surface or the liquid surface by desorbing
molecules.
In contrast, the kinetic energy depends only on the temperature of the liquid surface,
because the root mean square slope (in molecular scale) decreases with the
increase of the temperature of the liquid surface.
The accommodation coefficient of HCl on a D2SO4 / D2O surface ___________________________________________________________________________
62
4. The accommodation coefficient of HCl on a D 2SO4/ D2O surface
The accommodation coefficient of HCl gas onto surface of D2SO4/ D2O solution from
a comparison between the post chopper TOF spectra before and after the exchange
reaction ( DH → ) will be determined first. The mass accommodation coefficient of
HCl gas into a D2SO4/ D2O surface can be then described by analysing three
theories. The three mentioned theories are the following: the cavity theory [Pollack,
1991], transition state theory [Davidovits et al. 1995] & [Nathanson et al. 1996] and
the capillary wave theory [Behr et al. 2009].
In the case of the transition state theory more details of the mechanism of the uptake
of HCl gas on the deuterated sulphuric acid solution through the thermodynamic
description will be presented. After that, the results are then compared with the
calculated mass accommodation coefficient of HCl into the sulphuric acid solution
according to the capillary wave theory.
4.1 Experimental data
The pathways for HCl molecules impinging to the liquid surface of the deuterated
sulphuric acid solution at incident angle 45° will be described. The molecules collide
with the liquid surface. Then, some of them scatter away from the surface with high
energy (direct inelastic scattering). The others bounce and bind momentarily at the
liquid surface and they dissipate their excess energy on the surface (trapping). These
trapping molecules have two ways, either they desorb from the liquid surface before
they undergo an exchange reaction (thermal desorption without exchange) or they
penetrate in the bulk liquid, dissociate into H+ and Cl-, recombine with D+ in the
solution to produce DCl molecules, after that these molecules desorb from the liquid
surface (thermal desorption after reaction). The pathways are illustrated in figure
(4.1).
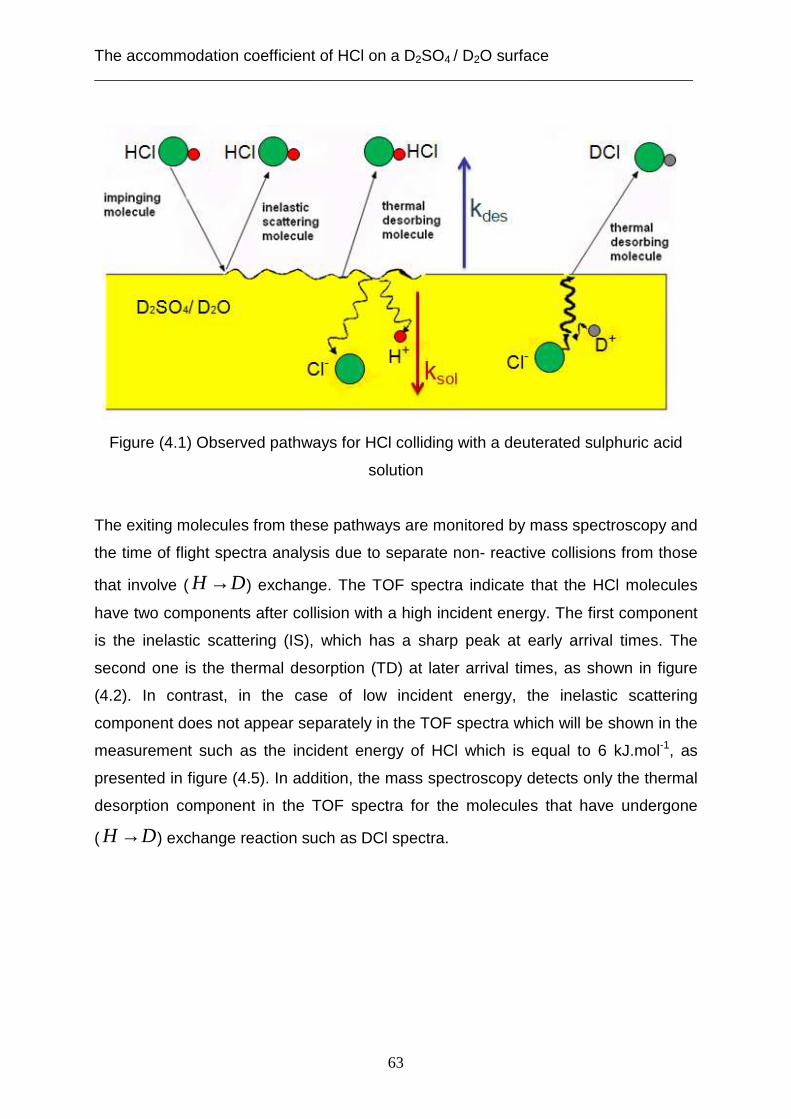
The accommodation coefficient of HCl on a D2SO4 / D2O surface ___________________________________________________________________________
63
Figure (4.1) Observed pathways for HCl colliding with a deuterated sulphuric acid
solution
The exiting molecules from these pathways are monitored by mass spectroscopy and
the time of flight spectra analysis due to separate non- reactive collisions from those
that involve ( DH → ) exchange. The TOF spectra indicate that the HCl molecules
have two components after collision with a high incident energy. The first component
is the inelastic scattering (IS), which has a sharp peak at early arrival times. The
second one is the thermal desorption (TD) at later arrival times, as shown in figure
(4.2). In contrast, in the case of low incident energy, the inelastic scattering
component does not appear separately in the TOF spectra which will be shown in the
measurement such as the incident energy of HCl which is equal to 6 kJ.mol-1, as
presented in figure (4.5). In addition, the mass spectroscopy detects only the thermal
desorption component in the TOF spectra for the molecules that have undergone
( DH → ) exchange reaction such as DCl spectra.
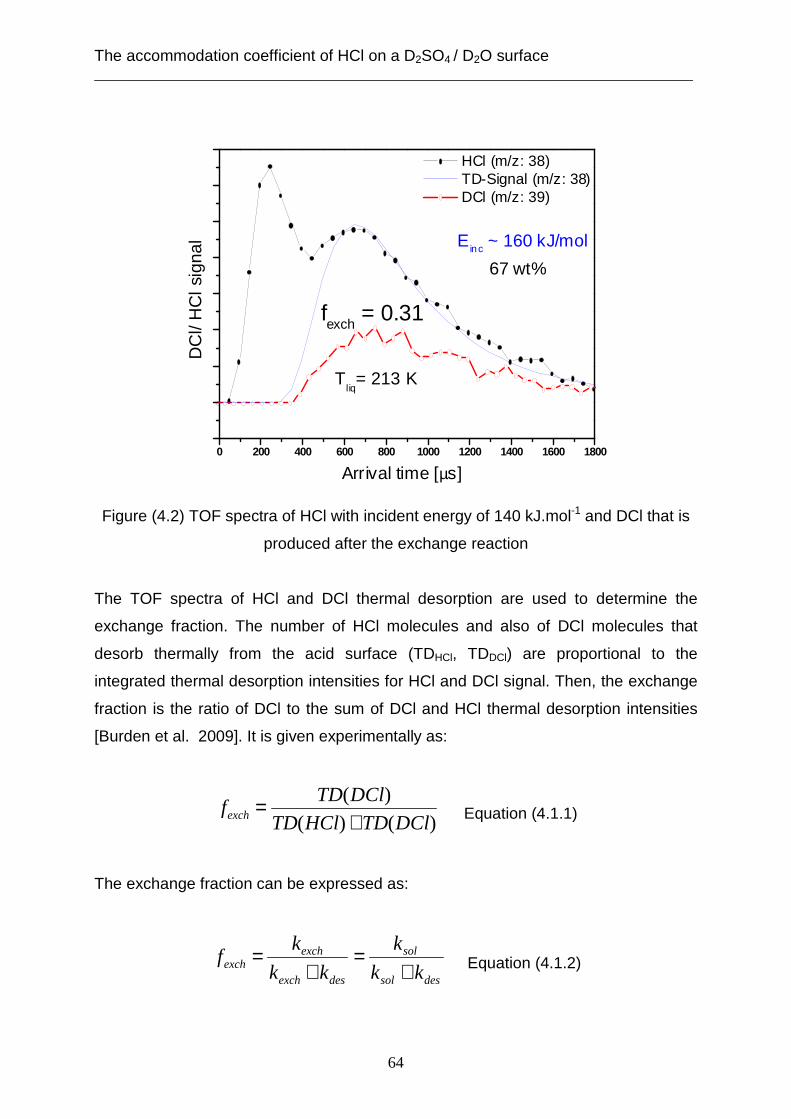
The accommodation coefficient of HCl on a D2SO4 / D2O surface ___________________________________________________________________________
64
0 200 400 600 800 1000 1200 1400 1600 1800
fexch
= 0.31
67 wt%
E inc ~ 160 kJ/mol
Tliq
= 213 K
HCl (m/z: 38) TD-Signal (m/z: 38) DCl (m/z: 39)
DC
l/ H
Cl s
igna
l
Arrival time [µs]
Figure (4.2) TOF spectra of HCl with incident energy of 140 kJ.mol-1 and DCl that is
produced after the exchange reaction
The TOF spectra of HCl and DCl thermal desorption are used to determine the
exchange fraction. The number of HCl molecules and also of DCl molecules that
desorb thermally from the acid surface (TDHCl, TDDCl) are proportional to the
integrated thermal desorption intensities for HCl and DCl signal. Then, the exchange
fraction is the ratio of DCl to the sum of DCl and HCl thermal desorption intensities
[Burden et al. 2009]. It is given experimentally as:
)()()(
DClTDHClTD
DClTDfexch +
= Equation (4.1.1)
The exchange fraction can be expressed as:
dessol
sol
desexch
exchexch kk
k
kk
kf
+=
+= Equation (4.1.2)
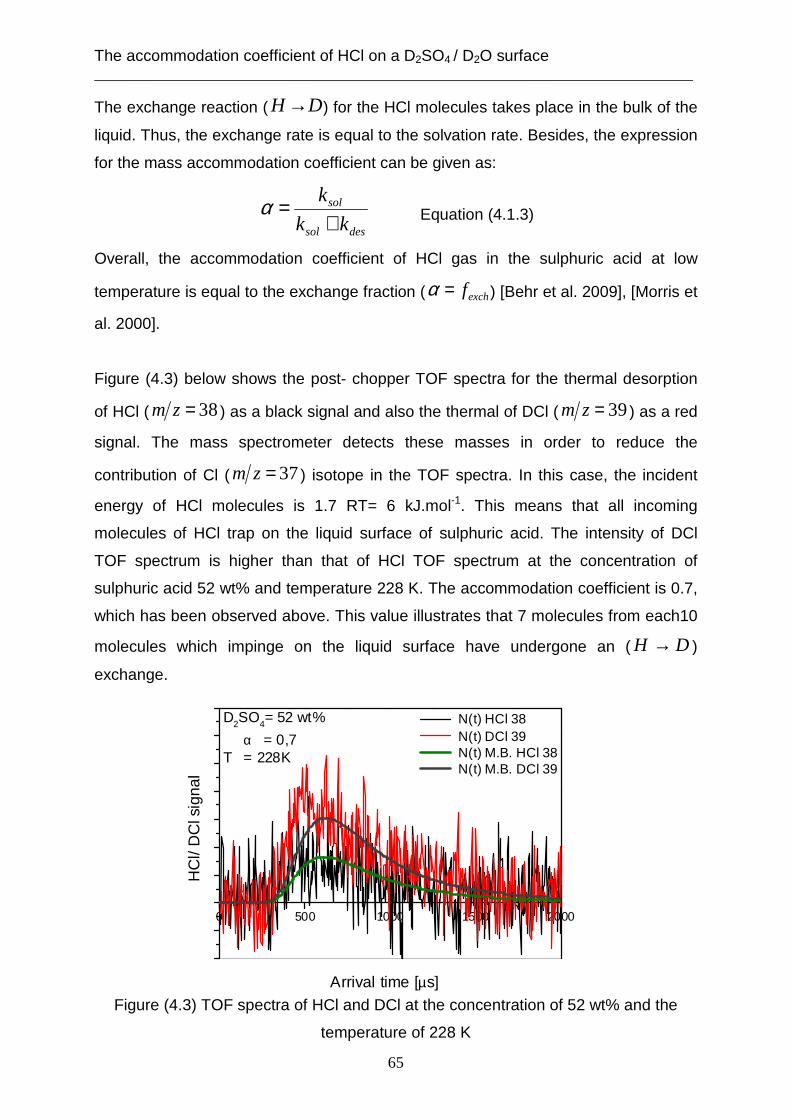
The accommodation coefficient of HCl on a D2SO4 / D2O surface ___________________________________________________________________________
65
0 500 1000 1500 2000
HC
l/ D
Cl s
igna
l
Arrival time [µs]
N(t) HCl 38 N(t) DCl 39 N(t) M.B. HCl 38 N(t) M.B. DCl 39
D2SO4= 52 wt%
α = 0,7T = 228K
The exchange reaction ( DH → ) for the HCl molecules takes place in the bulk of the
liquid. Thus, the exchange rate is equal to the solvation rate. Besides, the expression
for the mass accommodation coefficient can be given as:
dessol
sol
kk
k
+=α Equation (4.1.3)
Overall, the accommodation coefficient of HCl gas in the sulphuric acid at low
temperature is equal to the exchange fraction ( exchf=α ) [Behr et al. 2009], [Morris et
al. 2000].
Figure (4.3) below shows the post- chopper TOF spectra for the thermal desorption
of HCl ( 38=zm ) as a black signal and also the thermal of DCl ( 39=zm ) as a red
signal. The mass spectrometer detects these masses in order to reduce the
contribution of Cl ( 37=zm ) isotope in the TOF spectra. In this case, the incident
energy of HCl molecules is 1.7 RT= 6 kJ.mol-1. This means that all incoming
molecules of HCl trap on the liquid surface of sulphuric acid. The intensity of DCl
TOF spectrum is higher than that of HCl TOF spectrum at the concentration of
sulphuric acid 52 wt% and temperature 228 K. The accommodation coefficient is 0.7,
which has been observed above. This value illustrates that 7 molecules from each10
molecules which impinge on the liquid surface have undergone an ( DH → )
exchange.
Figure (4.3) TOF spectra of HCl and DCl at the concentration of 52 wt% and the
temperature of 228 K
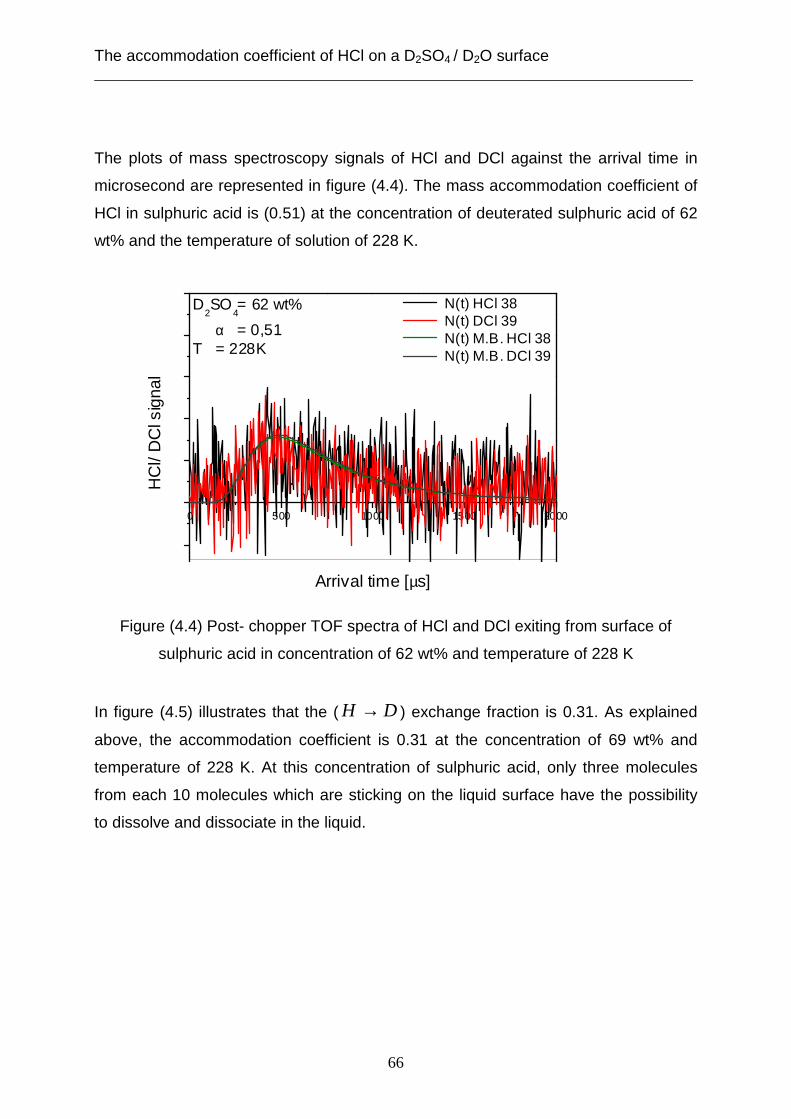
The accommodation coefficient of HCl on a D2SO4 / D2O surface ___________________________________________________________________________
66
0 500 1000 1500 2000
D2SO
4= 62 wt%
α = 0,51T = 228K
HC
l/ D
Cl s
igna
l
Arrival time [µs]
N(t) HCl 38 N(t) DCl 39 N(t) M.B. HCl 38 N(t) M.B. DCl 39
The plots of mass spectroscopy signals of HCl and DCl against the arrival time in
microsecond are represented in figure (4.4). The mass accommodation coefficient of
HCl in sulphuric acid is (0.51) at the concentration of deuterated sulphuric acid of 62
wt% and the temperature of solution of 228 K.
Figure (4.4) Post- chopper TOF spectra of HCl and DCl exiting from surface of
sulphuric acid in concentration of 62 wt% and temperature of 228 K
In figure (4.5) illustrates that the ( DH → ) exchange fraction is 0.31. As explained
above, the accommodation coefficient is 0.31 at the concentration of 69 wt% and
temperature of 228 K. At this concentration of sulphuric acid, only three molecules
from each 10 molecules which are sticking on the liquid surface have the possibility
to dissolve and dissociate in the liquid.
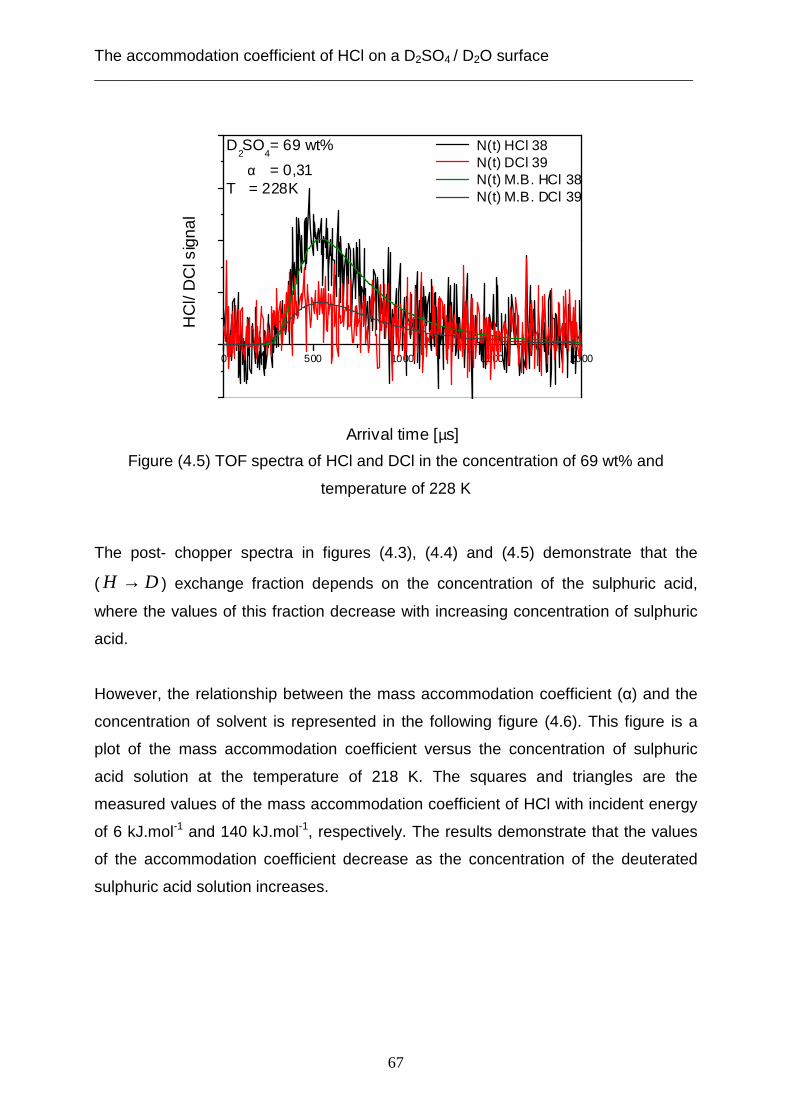
The accommodation coefficient of HCl on a D2SO4 / D2O surface ___________________________________________________________________________
67
0 500 1000 1500 2000
D2SO
4= 69 wt%
α = 0,31T = 228K
HC
l/ D
Cl s
igna
l
Arrival time [µs]
N(t) HCl 38 N(t) DCl 39 N(t) M.B. HCl 38 N(t) M.B. DCl 39
Figure (4.5) TOF spectra of HCl and DCl in the concentration of 69 wt% and
temperature of 228 K
The post- chopper spectra in figures (4.3), (4.4) and (4.5) demonstrate that the
( DH → ) exchange fraction depends on the concentration of the sulphuric acid,
where the values of this fraction decrease with increasing concentration of sulphuric
acid.
However, the relationship between the mass accommodation coefficient (α) and the
concentration of solvent is represented in the following figure (4.6). This figure is a
plot of the mass accommodation coefficient versus the concentration of sulphuric
acid solution at the temperature of 218 K. The squares and triangles are the
measured values of the mass accommodation coefficient of HCl with incident energy
of 6 kJ.mol-1 and 140 kJ.mol-1, respectively. The results demonstrate that the values
of the accommodation coefficient decrease as the concentration of the deuterated
sulphuric acid solution increases.
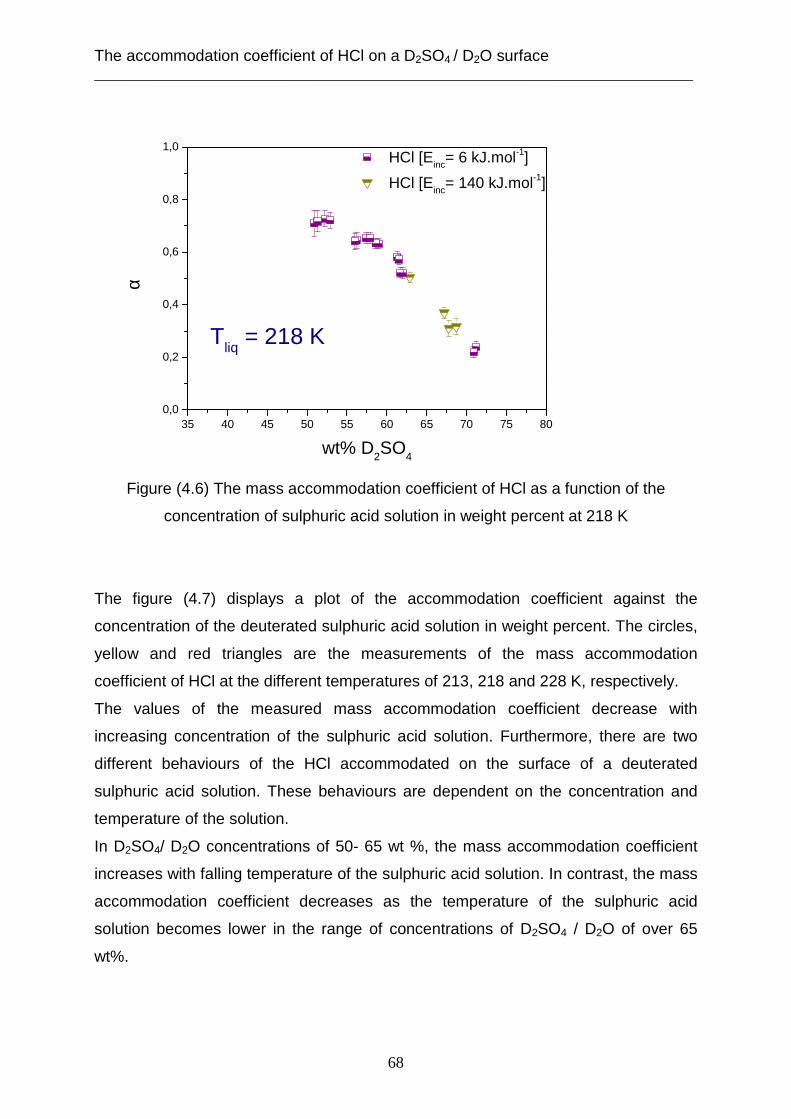
The accommodation coefficient of HCl on a D2SO4 / D2O surface ___________________________________________________________________________
68
Figure (4.6) The mass accommodation coefficient of HCl as a function of the
concentration of sulphuric acid solution in weight percent at 218 K
The figure (4.7) displays a plot of the accommodation coefficient against the
concentration of the deuterated sulphuric acid solution in weight percent. The circles,
yellow and red triangles are the measurements of the mass accommodation
coefficient of HCl at the different temperatures of 213, 218 and 228 K, respectively.
The values of the measured mass accommodation coefficient decrease with
increasing concentration of the sulphuric acid solution. Furthermore, there are two
different behaviours of the HCl accommodated on the surface of a deuterated
sulphuric acid solution. These behaviours are dependent on the concentration and
temperature of the solution.
In D2SO4/ D2O concentrations of 50- 65 wt %, the mass accommodation coefficient
increases with falling temperature of the sulphuric acid solution. In contrast, the mass
accommodation coefficient decreases as the temperature of the sulphuric acid
solution becomes lower in the range of concentrations of D2SO4 / D2O of over 65
wt%.
35 40 45 50 55 60 65 70 75 800,0
0,2
0,4
0,6
0,8
1,0
Tliq
= 218 K
α
wt% D2SO
4
HCl [Einc= 6 kJ.mol-1]
HCl [Einc= 140 kJ.mol-1]
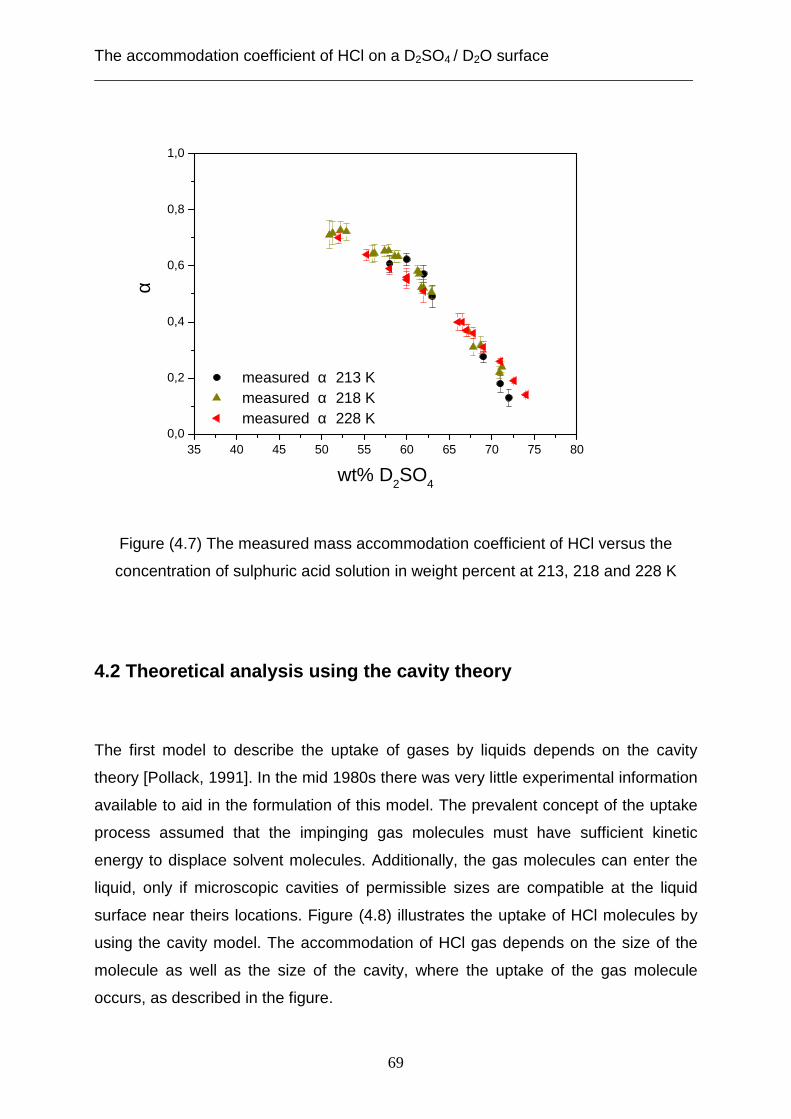
The accommodation coefficient of HCl on a D2SO4 / D2O surface ___________________________________________________________________________
69
Figure (4.7) The measured mass accommodation coefficient of HCl versus the
concentration of sulphuric acid solution in weight percent at 213, 218 and 228 K
4.2 Theoretical analysis using the cavity theory
The first model to describe the uptake of gases by liquids depends on the cavity
theory [Pollack, 1991]. In the mid 1980s there was very little experimental information
available to aid in the formulation of this model. The prevalent concept of the uptake
process assumed that the impinging gas molecules must have sufficient kinetic
energy to displace solvent molecules. Additionally, the gas molecules can enter the
liquid, only if microscopic cavities of permissible sizes are compatible at the liquid
surface near theirs locations. Figure (4.8) illustrates the uptake of HCl molecules by
using the cavity model. The accommodation of HCl gas depends on the size of the
molecule as well as the size of the cavity, where the uptake of the gas molecule
occurs, as described in the figure.
35 40 45 50 55 60 65 70 75 800,0
0,2
0,4
0,6
0,8
1,0
α
wt% D2SO
4
measured α 213 K measured α 218 K measured α 228 K
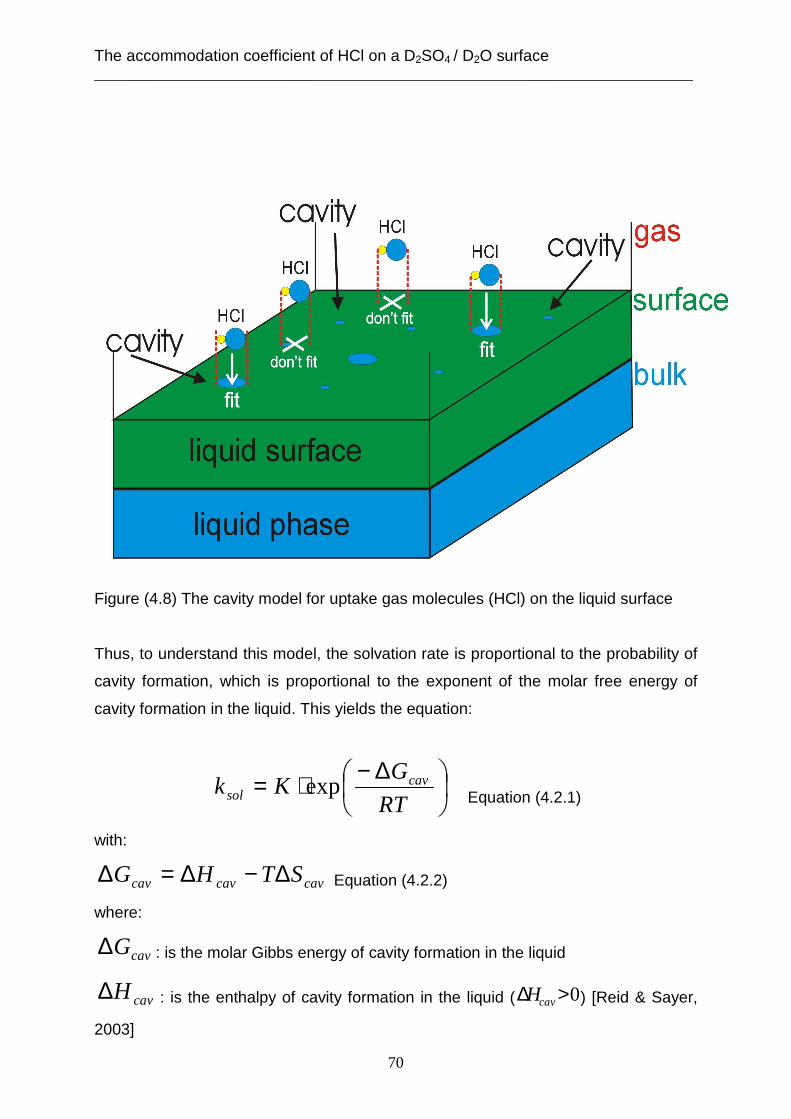
The accommodation coefficient of HCl on a D2SO4 / D2O surface ___________________________________________________________________________
70
Figure (4.8) The cavity model for uptake gas molecules (HCl) on the liquid surface
Thus, to understand this model, the solvation rate is proportional to the probability of
cavity formation, which is proportional to the exponent of the molar free energy of
cavity formation in the liquid. This yields the equation:
∆−⋅=RT
GKk cav
sol exp Equation (4.2.1)
with:
cavcavcav STHG ∆−∆=∆ Equation (4.2.2)
where:
cavG∆ : is the molar Gibbs energy of cavity formation in the liquid
cavH∆ : is the enthalpy of cavity formation in the liquid ( 0>∆ cavH ) [Reid & Sayer,
2003]
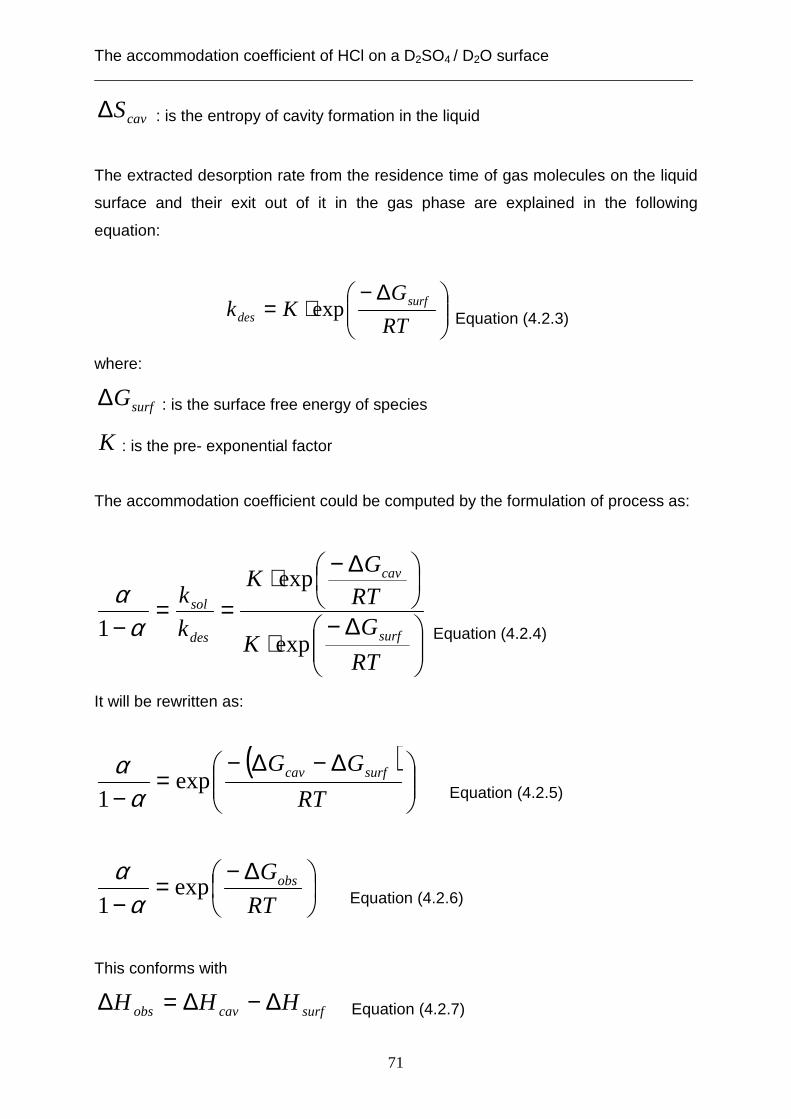
The accommodation coefficient of HCl on a D2SO4 / D2O surface ___________________________________________________________________________
71
cavS∆ : is the entropy of cavity formation in the liquid
The extracted desorption rate from the residence time of gas molecules on the liquid
surface and their exit out of it in the gas phase are explained in the following
equation:
∆−⋅=
RT
GKk surf
des exp Equation (4.2.3)
where:
surfG∆ : is the surface free energy of species
K : is the pre- exponential factor
The accommodation coefficient could be computed by the formulation of process as:
∆−⋅
∆−⋅==
−RT
GK
RTG
K
k
k
surf
cav
des
sol
exp
exp
1 αα
Equation (4.2.4)
It will be rewritten as:
( )
∆−∆−=
− RT
GG surfcavexp1 α
α Equation (4.2.5)
∆−=− RT
Gobsexp1 α
α Equation (4.2.6)
This conforms with
surfcavobs HHH ∆−∆=∆ Equation (4.2.7)
The accommodation coefficient of HCl on a D2SO4 / D2O surface ___________________________________________________________________________
72
and
surfcavobs SSS ∆−∆=∆ Equation (4.2.8)
The calculations above are not suitable with the experimental results from Davidovitz
et al. 1996, because the value of the observed enthalpy of the uptake of HCl gas in
the sulphuric acid solution is ( 1.58 −−=∆ molkJH obs ); conversely, the computed
enthalpy of uptake gas is a positive number in regard to the cavity theory.
In fact, this theory cannot describe the HCl gas molecules accommodated into the
sulphuric acid solution, because the enthalpy of the cavity formation in the surface of
liquid must be higher than zero [Reid & Sayer, 2003].
Therefore, Davidovitz and Nathanson have suggested another model. This model is
called the cluster model. It depends on the transition state theory.
4.3 Theoretical analysis using transition state theory (Cluster model)
This theory suggests that the surface of the liquid represents a boundary of the
transition region of the gas molecules to dissolve in the liquid by forming continually
aggregates (cluster). The impinging gas molecule can be incorporated into the liquid
bulk, which depends on the aggregation process with solvent molecules at the
interface.
The trace gas reaches the surface of the solvent. Then, the molecules of the solvent
form a cluster around the gas molecule. This cluster grows by adding the determining
number of the solvent molecules until they form a critical cluster. After that, it merges
into the adjacent bulk liquid. The number of molecules, which are required to form the
critical cluster is the sum of the gas molecule and the additional number of the
solvent molecules.
Thus, the number of the solvent molecules that have to aggregate with the trace gas
molecule to form the critical cluster is (N*-1).
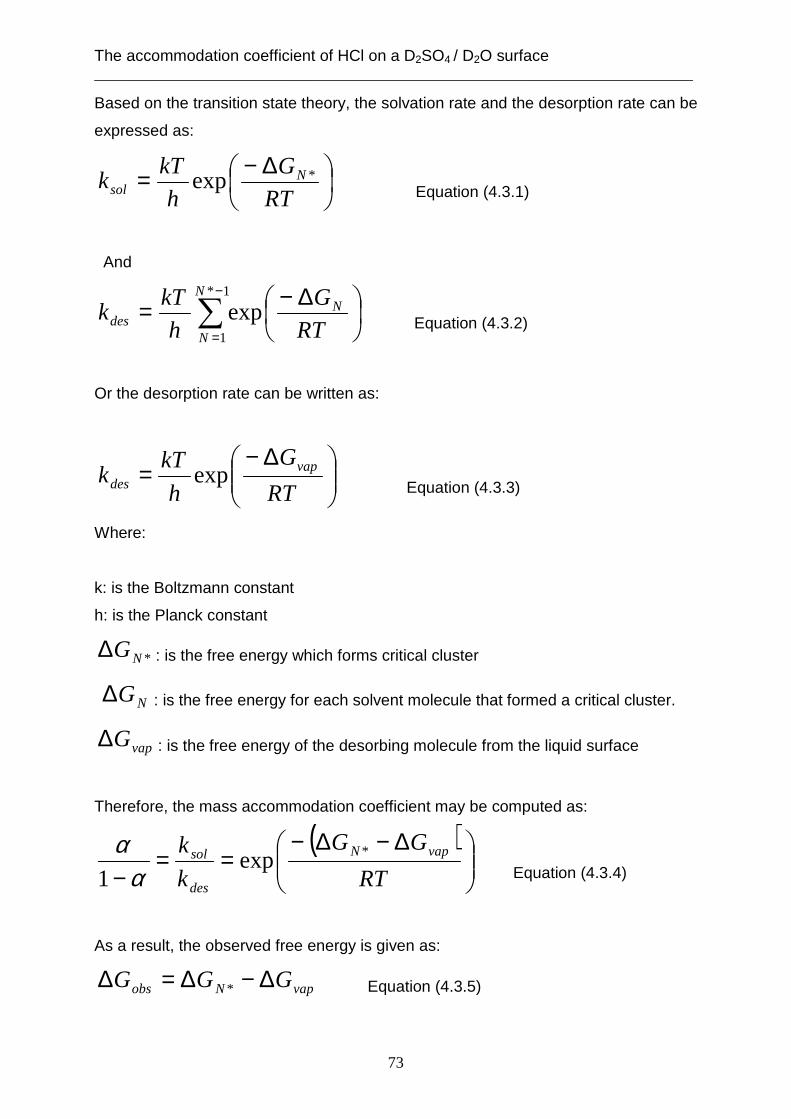
The accommodation coefficient of HCl on a D2SO4 / D2O surface ___________________________________________________________________________
73
Based on the transition state theory, the solvation rate and the desorption rate can be
expressed as:
∆−=RT
G
h
kTk N
sol*exp Equation (4.3.1)
And
∑−
=
∆−=1*
1
expN
N
Ndes RT
G
h
kTk Equation (4.3.2)
Or the desorption rate can be written as:
∆−=
RT
G
h
kTk vap
des exp Equation (4.3.3)
Where:
k: is the Boltzmann constant
h: is the Planck constant
*NG∆ : is the free energy which forms critical cluster
NG∆ : is the free energy for each solvent molecule that formed a critical cluster.
vapG∆ : is the free energy of the desorbing molecule from the liquid surface
Therefore, the mass accommodation coefficient may be computed as:
( )
∆−∆−==
− RT
GG
k
k vapN
des
sol *exp1 α
α Equation (4.3.4)
As a result, the observed free energy is given as:
vapNobs GGG ∆−∆=∆ * Equation (4.3.5)
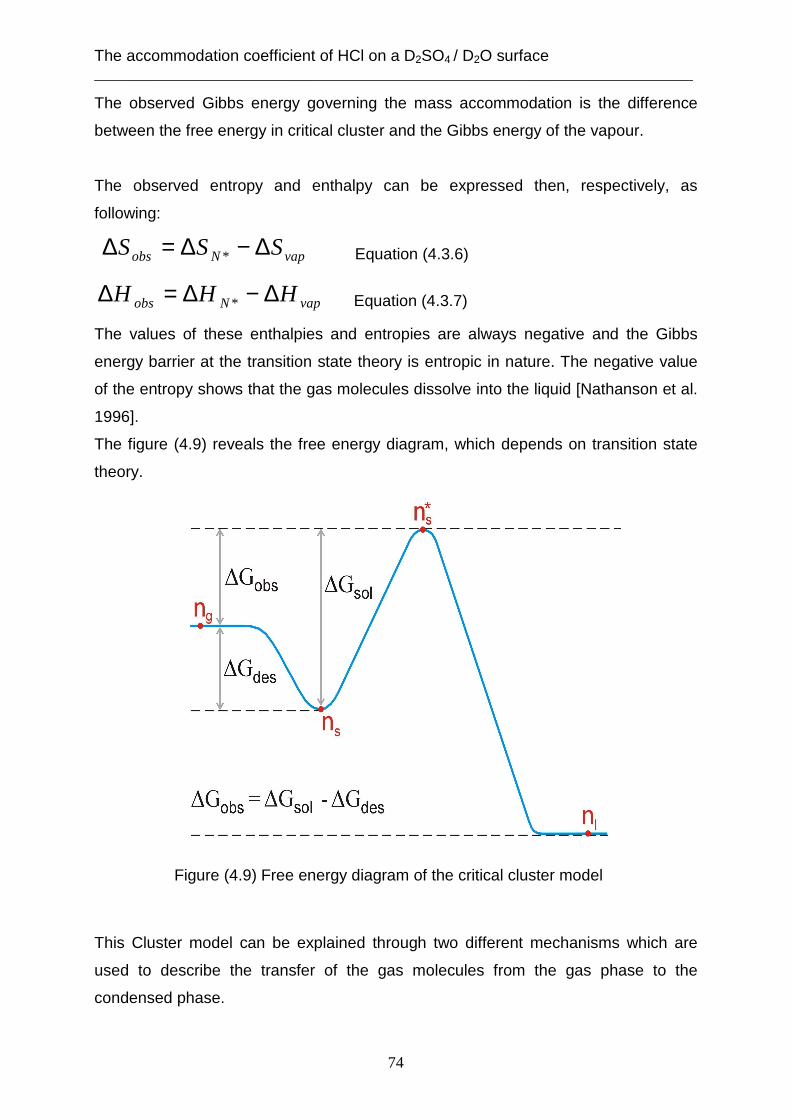
The accommodation coefficient of HCl on a D2SO4 / D2O surface ___________________________________________________________________________
74
The observed Gibbs energy governing the mass accommodation is the difference
between the free energy in critical cluster and the Gibbs energy of the vapour.
The observed entropy and enthalpy can be expressed then, respectively, as
following:
vapNobs SSS ∆−∆=∆ * Equation (4.3.6)
vapNobs HHH ∆−∆=∆ * Equation (4.3.7)
The values of these enthalpies and entropies are always negative and the Gibbs
energy barrier at the transition state theory is entropic in nature. The negative value
of the entropy shows that the gas molecules dissolve into the liquid [Nathanson et al.
1996].
The figure (4.9) reveals the free energy diagram, which depends on transition state
theory.
Figure (4.9) Free energy diagram of the critical cluster model This Cluster model can be explained through two different mechanisms which are
used to describe the transfer of the gas molecules from the gas phase to the
condensed phase.
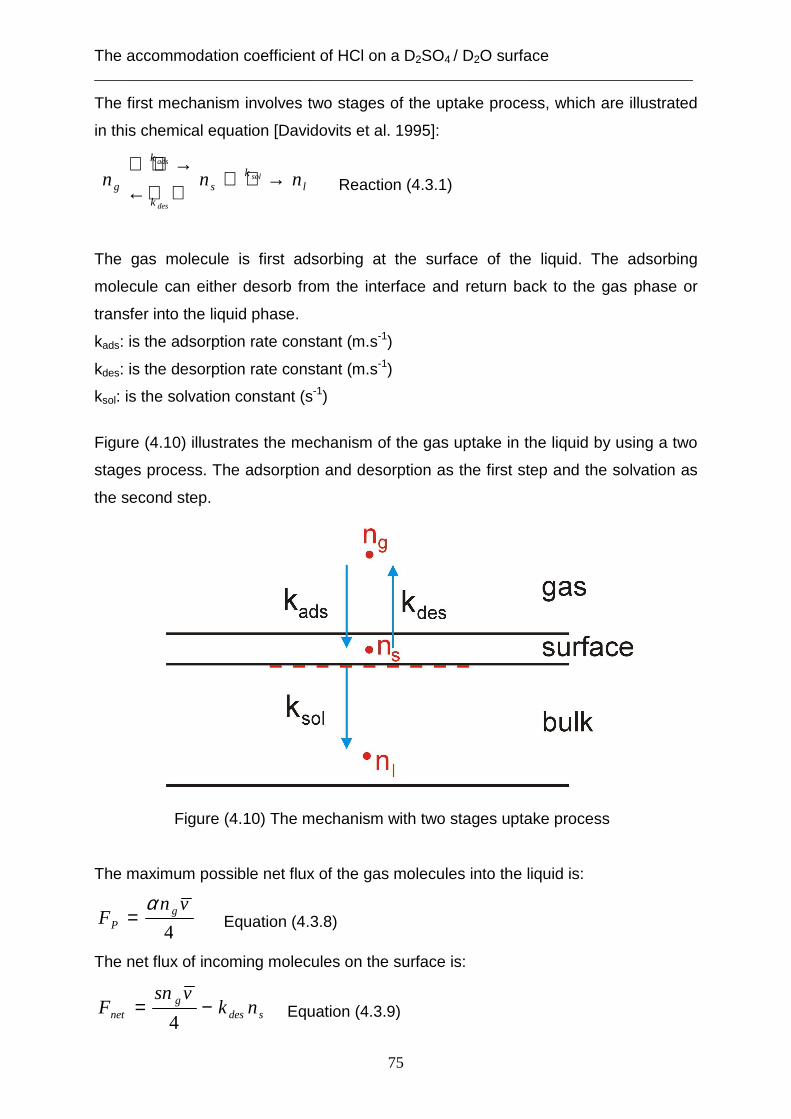
The accommodation coefficient of HCl on a D2SO4 / D2O surface ___________________________________________________________________________
75
The first mechanism involves two stages of the uptake process, which are illustrated
in this chemical equation [Davidovits et al. 1995]:
lk
s
k
k
g nnn sol
des
ads
→ ← →
Reaction (4.3.1)
The gas molecule is first adsorbing at the surface of the liquid. The adsorbing
molecule can either desorb from the interface and return back to the gas phase or
transfer into the liquid phase.
kads: is the adsorption rate constant (m.s-1)
kdes: is the desorption rate constant (m.s-1)
ksol: is the solvation constant (s-1)
Figure (4.10) illustrates the mechanism of the gas uptake in the liquid by using a two
stages process. The adsorption and desorption as the first step and the solvation as
the second step.
Figure (4.10) The mechanism with two stages uptake process
The maximum possible net flux of the gas molecules into the liquid is:
4
vnF g
P
α= Equation (4.3.8)
The net flux of incoming molecules on the surface is:
sdesg
net nkvsn
F −=4
Equation (4.3.9)
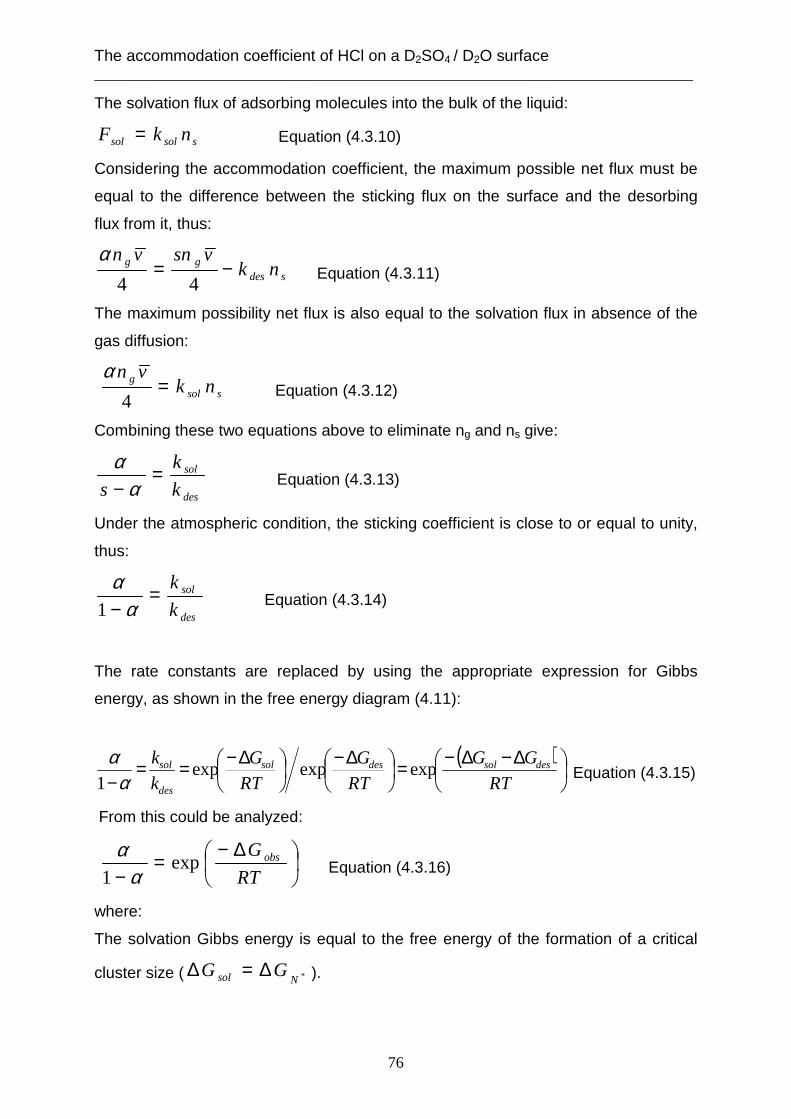
The accommodation coefficient of HCl on a D2SO4 / D2O surface ___________________________________________________________________________
76
The solvation flux of adsorbing molecules into the bulk of the liquid:
ssolsol nkF = Equation (4.3.10)
Considering the accommodation coefficient, the maximum possible net flux must be
equal to the difference between the sticking flux on the surface and the desorbing
flux from it, thus:
sdesgg nkvsnvn
−=44
α Equation (4.3.11)
The maximum possibility net flux is also equal to the solvation flux in absence of the
gas diffusion:
ssolg nkvn
=4
α Equation (4.3.12)
Combining these two equations above to eliminate ng and ns give:
des
sol
k
k
s=
− αα
Equation (4.3.13)
Under the atmospheric condition, the sticking coefficient is close to or equal to unity,
thus:
des
sol
k
k=
− αα
1 Equation (4.3.14)
The rate constants are replaced by using the appropriate expression for Gibbs
energy, as shown in the free energy diagram (4.11):
( )
∆−∆−=
∆−
∆−==− RT
GG
RT
G
RT
G
k
k dessoldessol
des
sol expexpexp1 α
α Equation (4.3.15)
From this could be analyzed:
∆−=
− RT
G obsexp1 α
α Equation (4.3.16)
where:
The solvation Gibbs energy is equal to the free energy of the formation of a critical
cluster size ( *Nsol GG ∆=∆ ).
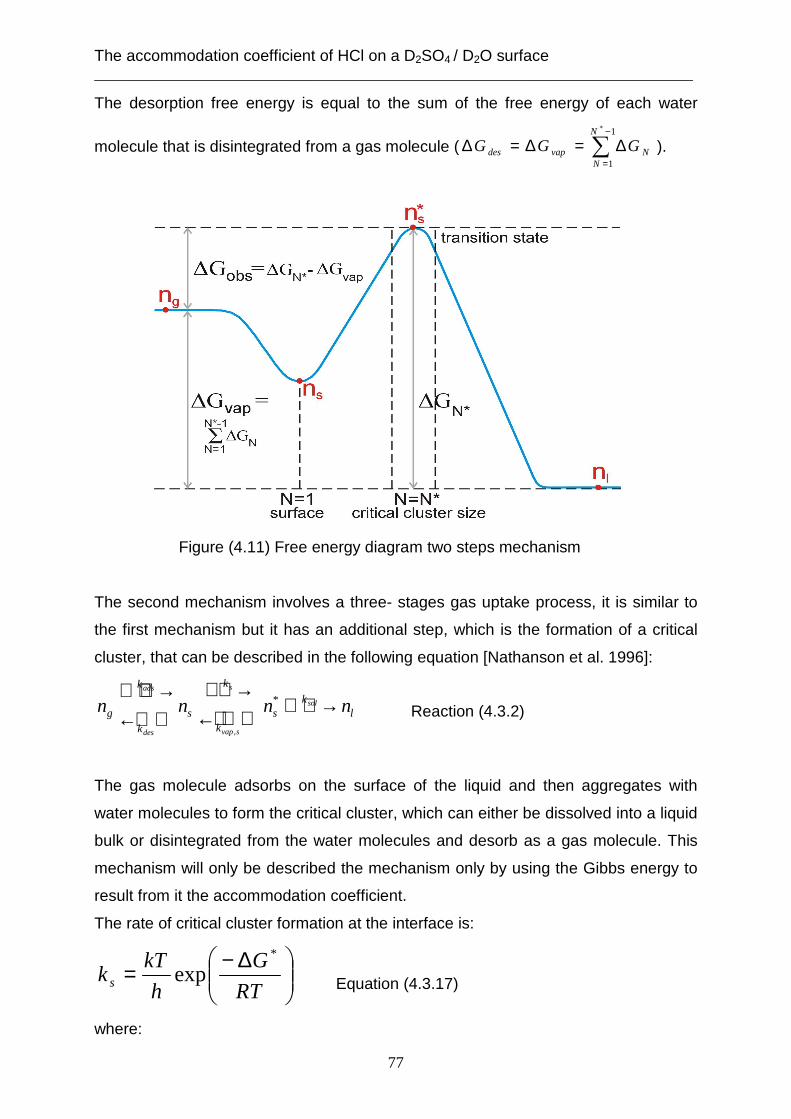
The accommodation coefficient of HCl on a D2SO4 / D2O surface ___________________________________________________________________________
77
The desorption free energy is equal to the sum of the free energy of each water
molecule that is disintegrated from a gas molecule ( ∑−
=
∆=∆=∆1
1
*N
NNvapdes GGG ).
Figure (4.11) Free energy diagram two steps mechanism
The second mechanism involves a three- stages gas uptake process, it is similar to
the first mechanism but it has an additional step, which is the formation of a critical
cluster, that can be described in the following equation [Nathanson et al. 1996]:
lk
sk
k
s
k
k
g nnnn sol
svap
s
des
ads
→ ←→
←→
*
,
Reaction (4.3.2)
The gas molecule adsorbs on the surface of the liquid and then aggregates with
water molecules to form the critical cluster, which can either be dissolved into a liquid
bulk or disintegrated from the water molecules and desorb as a gas molecule. This
mechanism will only be described the mechanism only by using the Gibbs energy to
result from it the accommodation coefficient.
The rate of critical cluster formation at the interface is:
∆−=RT
G
h
kTk s
*
exp Equation (4.3.17)
where:
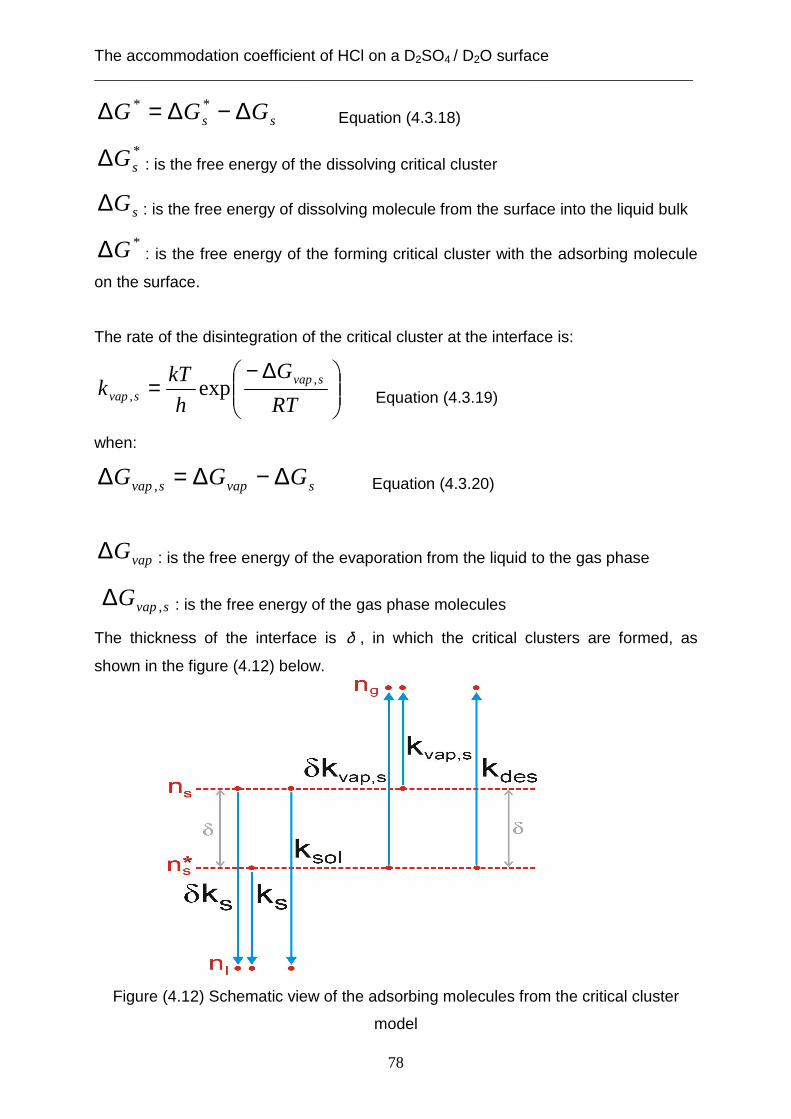
The accommodation coefficient of HCl on a D2SO4 / D2O surface ___________________________________________________________________________
78
ss GGG ∆−∆=∆ ** Equation (4.3.18)
*sG∆ : is the free energy of the dissolving critical cluster
sG∆ : is the free energy of dissolving molecule from the surface into the liquid bulk
*G∆ : is the free energy of the forming critical cluster with the adsorbing molecule
on the surface.
The rate of the disintegration of the critical cluster at the interface is:
∆−=
RT
G
h
kTk svap
svap,
, exp Equation (4.3.19)
when:
svapsvap GGG ∆−∆=∆ , Equation (4.3.20)
vapG∆ : is the free energy of the evaporation from the liquid to the gas phase
svapG ,∆ : is the free energy of the gas phase molecules
The thickness of the interface is δ , in which the critical clusters are formed, as
shown in the figure (4.12) below.
Figure (4.12) Schematic view of the adsorbing molecules from the critical cluster
model
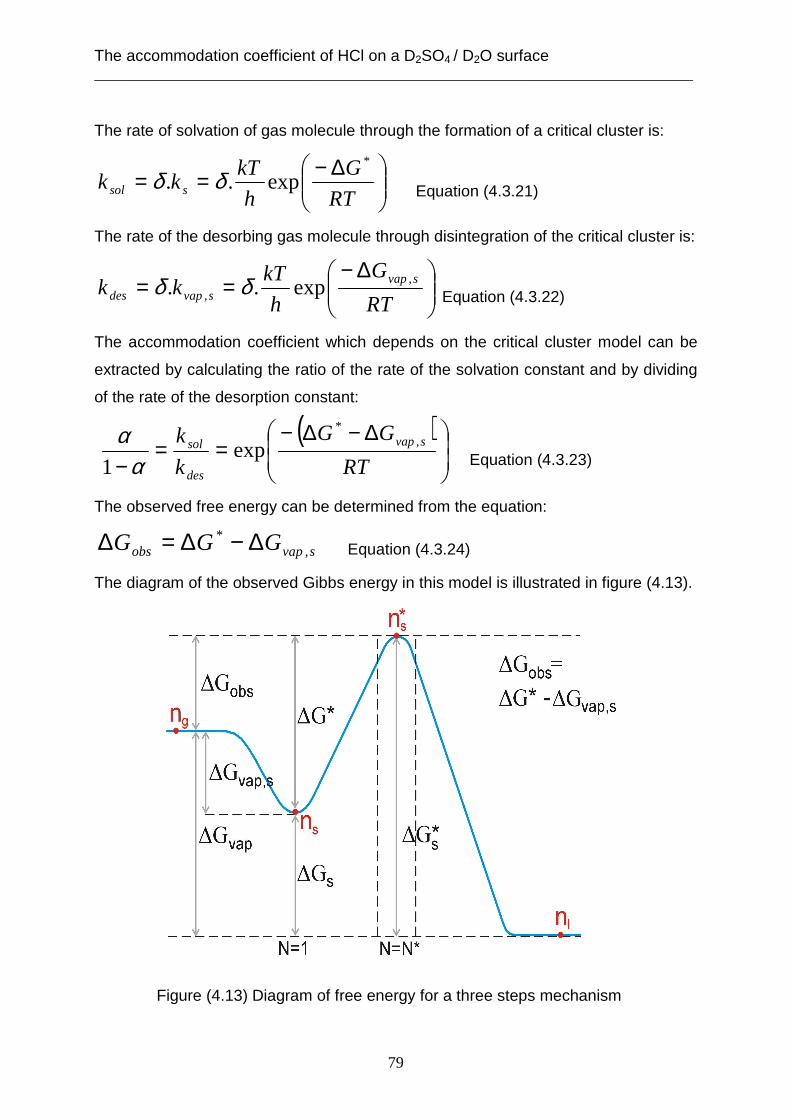
The accommodation coefficient of HCl on a D2SO4 / D2O surface ___________________________________________________________________________
79
The rate of solvation of gas molecule through the formation of a critical cluster is:
∆−==RT
G
h
kTkk ssol
*
exp.. δδ Equation (4.3.21)
The rate of the desorbing gas molecule through disintegration of the critical cluster is:
∆−==
RT
G
h
kTkk svap
svapdes,
, exp.. δδ Equation (4.3.22)
The accommodation coefficient which depends on the critical cluster model can be
extracted by calculating the ratio of the rate of the solvation constant and by dividing
of the rate of the desorption constant:
( )
∆−∆−==
− RT
GG
k
k svap
des
sol ,*
exp1 α
α Equation (4.3.23)
The observed free energy can be determined from the equation:
svapobs GGG ,* ∆−∆=∆ Equation (4.3.24)
The diagram of the observed Gibbs energy in this model is illustrated in figure (4.13).
Figure (4.13) Diagram of free energy for a three steps mechanism
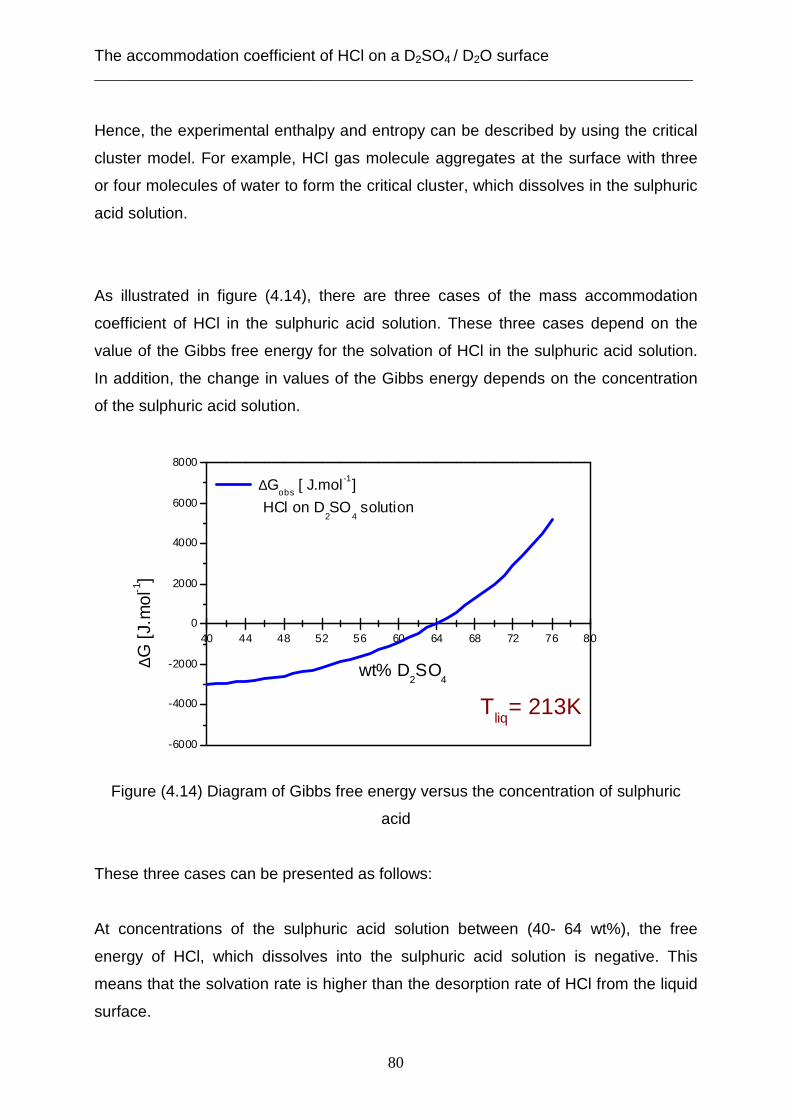
The accommodation coefficient of HCl on a D2SO4 / D2O surface ___________________________________________________________________________
80
40 44 48 52 56 60 64 68 72 76 80
-6000
-4000
-2000
0
2000
4000
6000
8000
Tliq
= 213K
∆Gobs
[ J.mol -1]
HCl on D2SO
4 solution
∆G [J
.mol
-1]
wt% D2SO
4
Hence, the experimental enthalpy and entropy can be described by using the critical
cluster model. For example, HCl gas molecule aggregates at the surface with three
or four molecules of water to form the critical cluster, which dissolves in the sulphuric
acid solution.
As illustrated in figure (4.14), there are three cases of the mass accommodation
coefficient of HCl in the sulphuric acid solution. These three cases depend on the
value of the Gibbs free energy for the solvation of HCl in the sulphuric acid solution.
In addition, the change in values of the Gibbs energy depends on the concentration
of the sulphuric acid solution.
Figure (4.14) Diagram of Gibbs free energy versus the concentration of sulphuric
acid
These three cases can be presented as follows:
At concentrations of the sulphuric acid solution between (40- 64 wt%), the free
energy of HCl, which dissolves into the sulphuric acid solution is negative. This
means that the solvation rate is higher than the desorption rate of HCl from the liquid
surface.
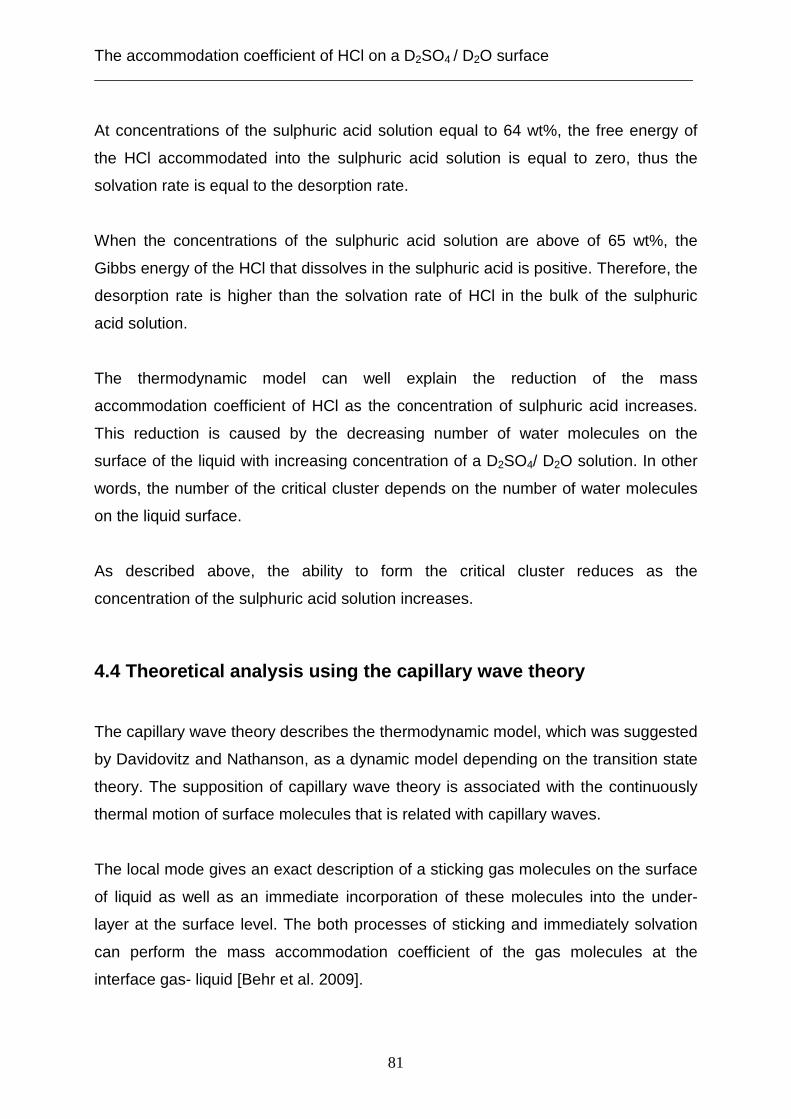
The accommodation coefficient of HCl on a D2SO4 / D2O surface ___________________________________________________________________________
81
At concentrations of the sulphuric acid solution equal to 64 wt%, the free energy of
the HCl accommodated into the sulphuric acid solution is equal to zero, thus the
solvation rate is equal to the desorption rate.
When the concentrations of the sulphuric acid solution are above of 65 wt%, the
Gibbs energy of the HCl that dissolves in the sulphuric acid is positive. Therefore, the
desorption rate is higher than the solvation rate of HCl in the bulk of the sulphuric
acid solution.
The thermodynamic model can well explain the reduction of the mass
accommodation coefficient of HCl as the concentration of sulphuric acid increases.
This reduction is caused by the decreasing number of water molecules on the
surface of the liquid with increasing concentration of a D2SO4/ D2O solution. In other
words, the number of the critical cluster depends on the number of water molecules
on the liquid surface.
As described above, the ability to form the critical cluster reduces as the
concentration of the sulphuric acid solution increases.
4.4 Theoretical analysis using the capillary wave theory
The capillary wave theory describes the thermodynamic model, which was suggested
by Davidovitz and Nathanson, as a dynamic model depending on the transition state
theory. The supposition of capillary wave theory is associated with the continuously
thermal motion of surface molecules that is related with capillary waves.
The local mode gives an exact description of a sticking gas molecules on the surface
of liquid as well as an immediate incorporation of these molecules into the under-
layer at the surface level. The both processes of sticking and immediately solvation
can perform the mass accommodation coefficient of the gas molecules at the
interface gas- liquid [Behr et al. 2009].
The accommodation coefficient of HCl on a D2SO4 / D2O surface ___________________________________________________________________________
82
In the first point, the dynamic process of the penetration of the gas molecule into the
liquid according to the local mode capillary wave theory in order to understand the
yield of the mass accommodation coefficient.
The progressive stages of the accommodation are explained from the adsorption to
the solvation as following:
Figure (4.15) Scheme of the accommodation process depending on local mode
capillary wave theory
The gas molecule sticks with the solvent molecule at the sharp- point wavelet, the
coordinate number in this case is one or two. The gas molecule is pulled on the
surface of the liquid by a downward motion of the capillary wave, the coordinate
number increases to about three or four. Then the capillary wave is moving under the
mean surface (planar surface) and taking the solute molecule into the under- layer of
the liquid surface. In this case, the coordinate number has its maximum value. This
progression from sticking on the surface to the solvation into the liquid body is the
mass accommodation of the solute molecule in solvent condition.
The coordination number, as described in this theory, is equivalent to the number of
liquid molecules that are surrounding and in contact with the gas molecule. The
maximum value of the coordinate number points out that the solute molecule is
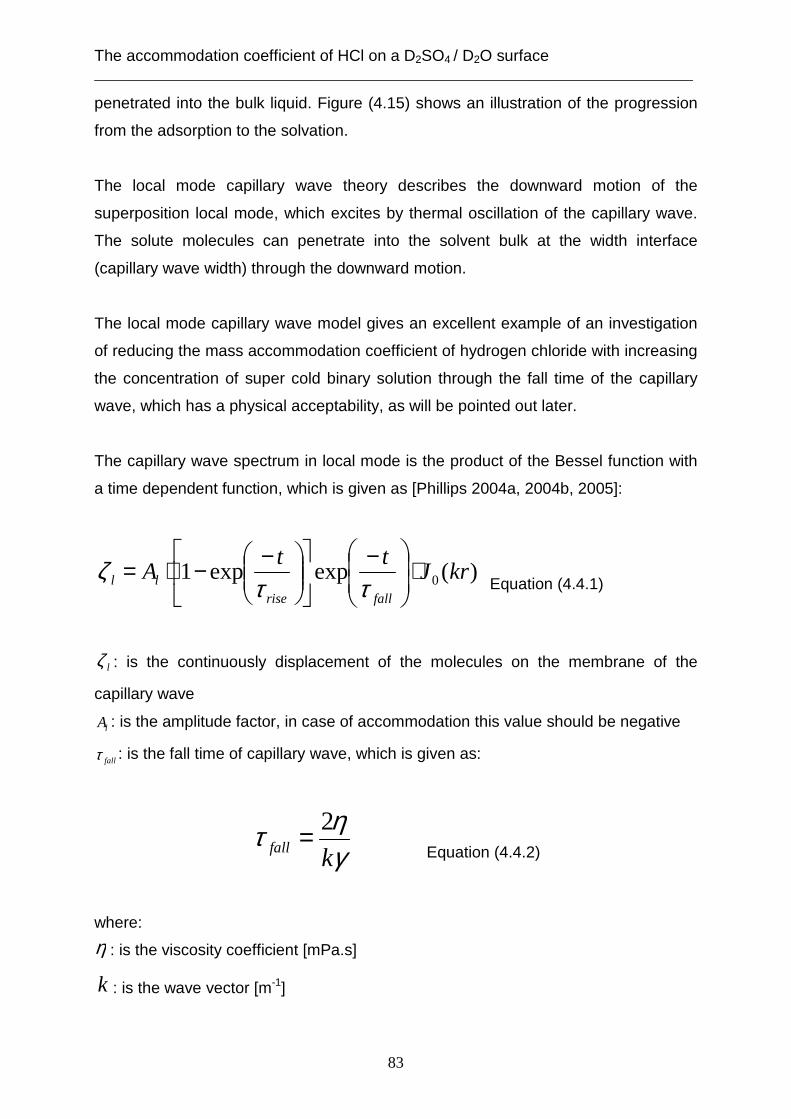
The accommodation coefficient of HCl on a D2SO4 / D2O surface ___________________________________________________________________________
83
penetrated into the bulk liquid. Figure (4.15) shows an illustration of the progression
from the adsorption to the solvation.
The local mode capillary wave theory describes the downward motion of the
superposition local mode, which excites by thermal oscillation of the capillary wave.
The solute molecules can penetrate into the solvent bulk at the width interface
(capillary wave width) through the downward motion.
The local mode capillary wave model gives an excellent example of an investigation
of reducing the mass accommodation coefficient of hydrogen chloride with increasing
the concentration of super cold binary solution through the fall time of the capillary
wave, which has a physical acceptability, as will be pointed out later.
The capillary wave spectrum in local mode is the product of the Bessel function with
a time dependent function, which is given as [Phillips 2004a, 2004b, 2005]:
)(expexp1 0 krJtt
Afallrise
ll ⋅
−
−−⋅=ττ
ζ Equation (4.4.1)
lζ : is the continuously displacement of the molecules on the membrane of the
capillary wave
lA : is the amplitude factor, in case of accommodation this value should be negative
fallτ : is the fall time of capillary wave, which is given as:
γητ
kfall
2= Equation (4.4.2)
where:
η : is the viscosity coefficient [mPa.s]
k : is the wave vector [m-1]
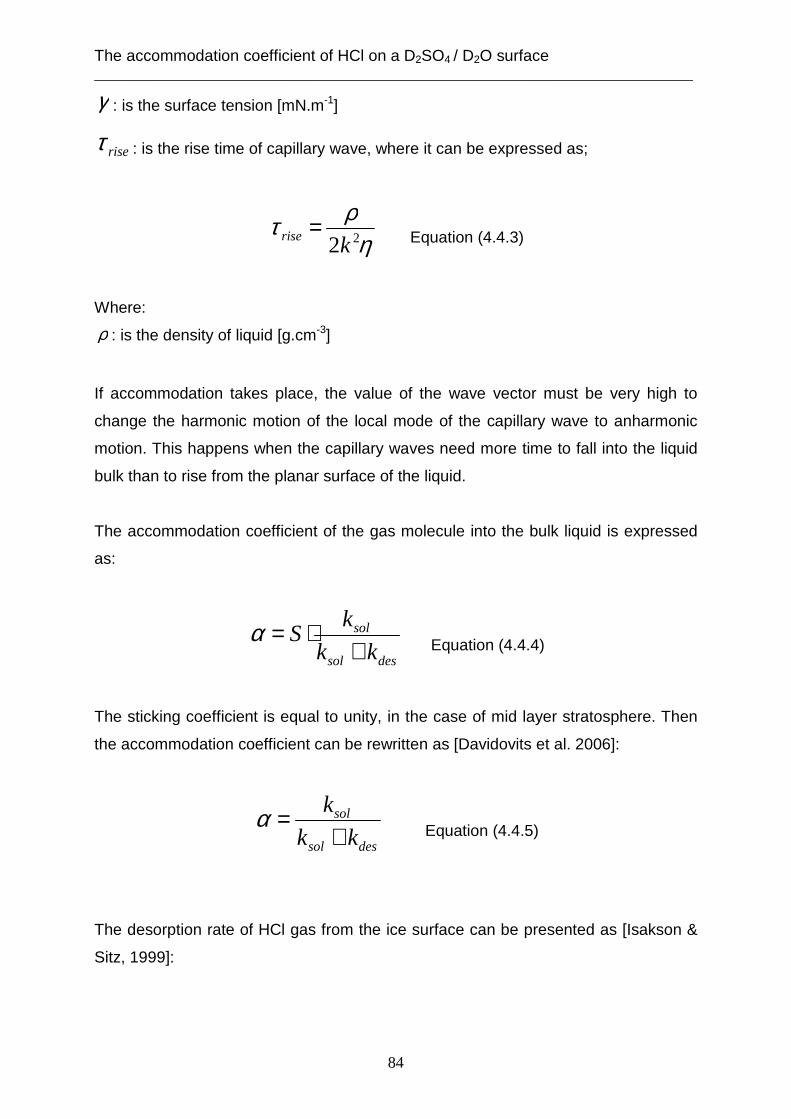
The accommodation coefficient of HCl on a D2SO4 / D2O surface ___________________________________________________________________________
84
γ : is the surface tension [mN.m-1]
riseτ : is the rise time of capillary wave, where it can be expressed as;
ηρτ
22krise = Equation (4.4.3)
Where:
ρ : is the density of liquid [g.cm-3]
If accommodation takes place, the value of the wave vector must be very high to
change the harmonic motion of the local mode of the capillary wave to anharmonic
motion. This happens when the capillary waves need more time to fall into the liquid
bulk than to rise from the planar surface of the liquid.
The accommodation coefficient of the gas molecule into the bulk liquid is expressed
as:
dessol
sol
kk
kS
+⋅=α
Equation (4.4.4)
The sticking coefficient is equal to unity, in the case of mid layer stratosphere. Then
the accommodation coefficient can be rewritten as [Davidovits et al. 2006]:
dessol
sol
kk
k
+=α
Equation (4.4.5)
The desorption rate of HCl gas from the ice surface can be presented as [Isakson &
Sitz, 1999]:
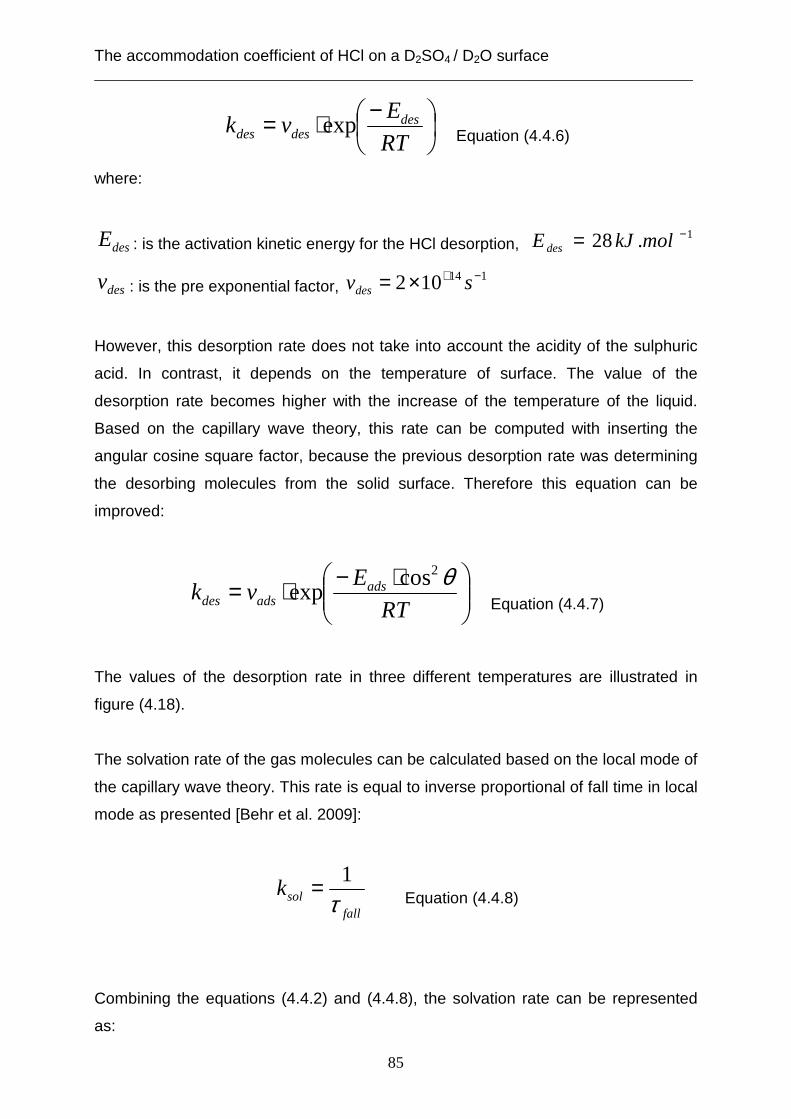
The accommodation coefficient of HCl on a D2SO4 / D2O surface ___________________________________________________________________________
85
−⋅=RT
Evk des
desdes exp Equation (4.4.6)
where:
desE : is the activation kinetic energy for the HCl desorption, 1.28 −= molkJE des
desv : is the pre exponential factor, 114102 −+×= svdes
However, this desorption rate does not take into account the acidity of the sulphuric
acid. In contrast, it depends on the temperature of surface. The value of the
desorption rate becomes higher with the increase of the temperature of the liquid.
Based on the capillary wave theory, this rate can be computed with inserting the
angular cosine square factor, because the previous desorption rate was determining
the desorbing molecules from the solid surface. Therefore this equation can be
improved:
⋅−⋅=RT
Evk ads
adsdes
θ2cosexp
Equation (4.4.7)
The values of the desorption rate in three different temperatures are illustrated in
figure (4.18).
The solvation rate of the gas molecules can be calculated based on the local mode of
the capillary wave theory. This rate is equal to inverse proportional of fall time in local
mode as presented [Behr et al. 2009]:
fallsolk
τ1= Equation (4.4.8)
Combining the equations (4.4.2) and (4.4.8), the solvation rate can be represented
as:
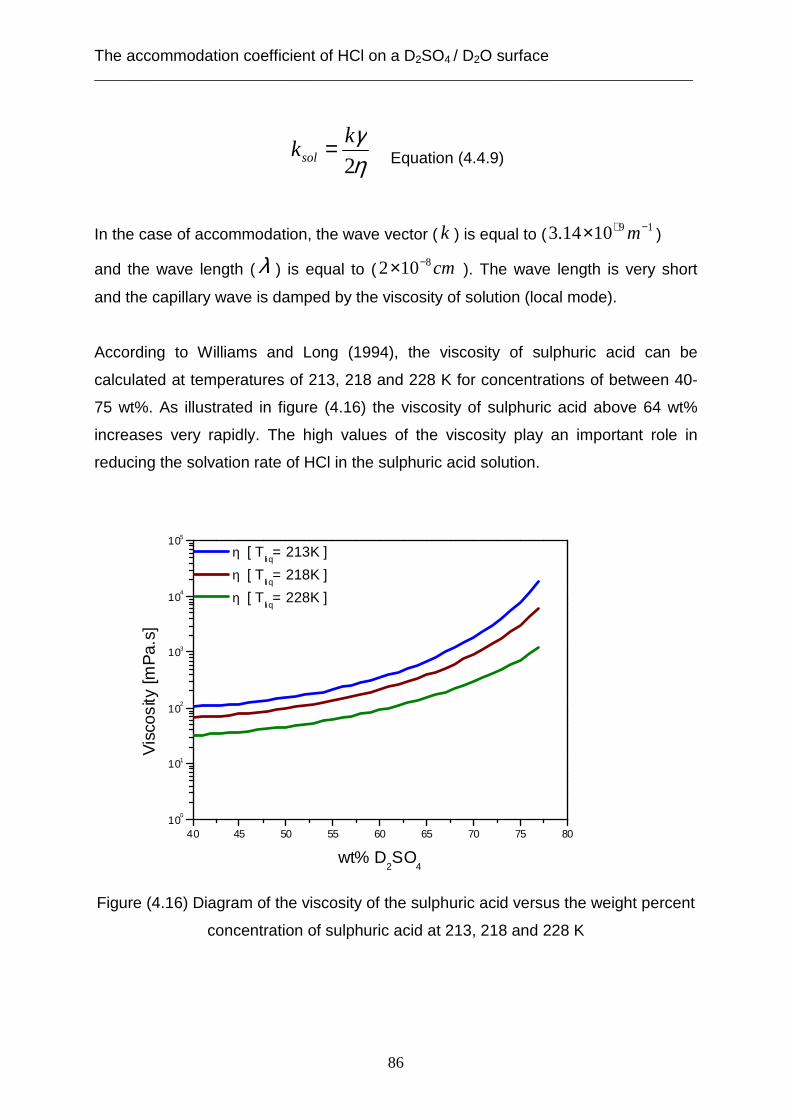
The accommodation coefficient of HCl on a D2SO4 / D2O surface ___________________________________________________________________________
86
40 45 50 55 60 65 70 75 8010
0
101
102
103
104
105
η [ Tliq= 213K ]
η [ Tliq= 218K ]
η [ Tliq= 228K ]
Vis
cosi
ty [m
Pa.
s]
wt% D2SO
4
ηγ
2k
ksol = Equation (4.4.9)
In the case of accommodation, the wave vector ( k ) is equal to ( 191014.3 −+× m )
and the wave length ( λ ) is equal to ( cm8102 −× ). The wave length is very short
and the capillary wave is damped by the viscosity of solution (local mode).
According to Williams and Long (1994), the viscosity of sulphuric acid can be
calculated at temperatures of 213, 218 and 228 K for concentrations of between 40-
75 wt%. As illustrated in figure (4.16) the viscosity of sulphuric acid above 64 wt%
increases very rapidly. The high values of the viscosity play an important role in
reducing the solvation rate of HCl in the sulphuric acid solution.
Figure (4.16) Diagram of the viscosity of the sulphuric acid versus the weight percent
concentration of sulphuric acid at 213, 218 and 228 K
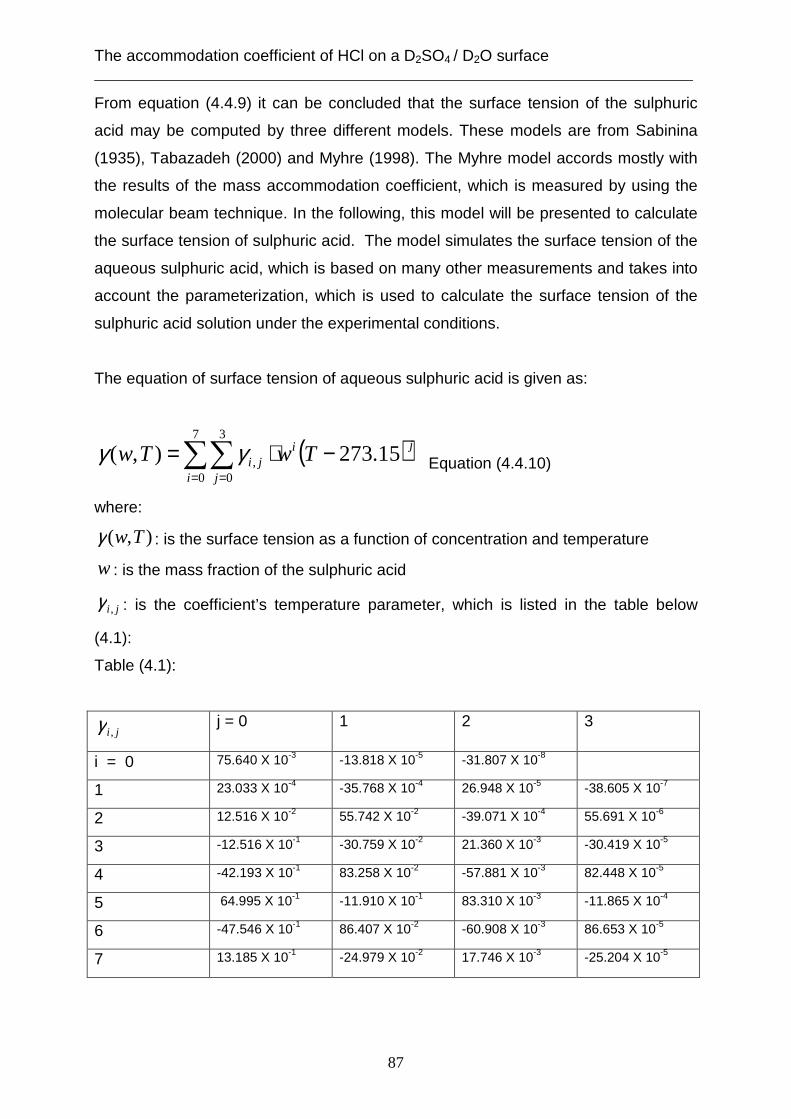
The accommodation coefficient of HCl on a D2SO4 / D2O surface ___________________________________________________________________________
87
From equation (4.4.9) it can be concluded that the surface tension of the sulphuric
acid may be computed by three different models. These models are from Sabinina
(1935), Tabazadeh (2000) and Myhre (1998). The Myhre model accords mostly with
the results of the mass accommodation coefficient, which is measured by using the
molecular beam technique. In the following, this model will be presented to calculate
the surface tension of sulphuric acid. The model simulates the surface tension of the
aqueous sulphuric acid, which is based on many other measurements and takes into
account the parameterization, which is used to calculate the surface tension of the
sulphuric acid solution under the experimental conditions.
The equation of surface tension of aqueous sulphuric acid is given as:
( )∑∑= =
−⋅=7
0
3
0, 15.273),(
i j
jiji TwTw γγ Equation (4.4.10)
where:
),( Twγ : is the surface tension as a function of concentration and temperature
w : is the mass fraction of the sulphuric acid
ji,γ : is the coefficient’s temperature parameter, which is listed in the table below
(4.1):
Table (4.1):
ji,γ j = 0 1 2 3
i = 0 75.640 X 10⁻³ -13.818 X 10⁻⁵ -31.807 X 10⁻⁸
1 23.033 X 10⁻⁴ -35.768 X 10⁻⁴ 26.948 X 10⁻⁵ -38.605 X 10⁻⁷
2 12.516 X 10⁻² 55.742 X 10⁻² -39.071 X 10⁻⁴ 55.691 X 10⁻⁶
3 -12.516 X 10⁻¹ -30.759 X 10⁻² 21.360 X 10⁻³ -30.419 X 10⁻⁵
4 -42.193 X 10⁻¹ 83.258 X 10⁻² -57.881 X 10⁻³ 82.448 X 10⁻⁵
5 64.995 X 10⁻¹ -11.910 X 10⁻¹ 83.310 X 10⁻³ -11.865 X 10⁻⁴
6 -47.546 X 10⁻¹ 86.407 X 10⁻² -60.908 X 10⁻³ 86.653 X 10⁻⁵
7 13.185 X 10⁻¹ -24.979 X 10⁻² 17.746 X 10⁻³ -25.204 X 10⁻⁵
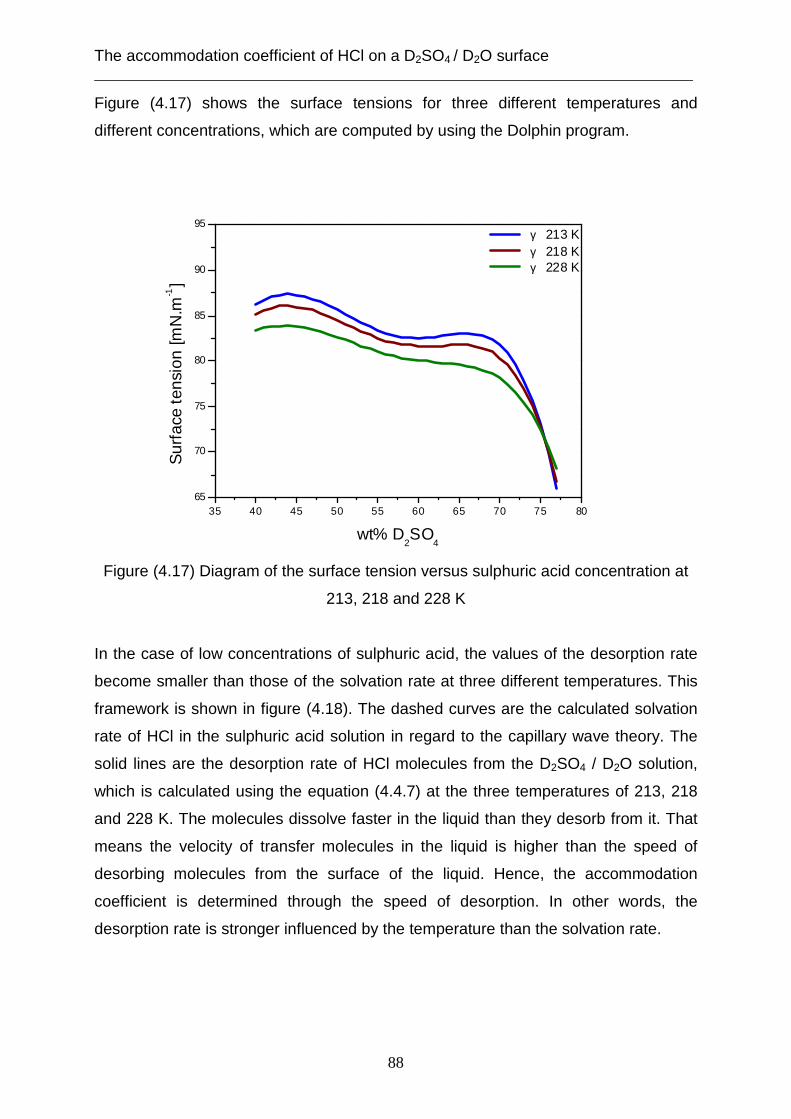
The accommodation coefficient of HCl on a D2SO4 / D2O surface ___________________________________________________________________________
88
35 40 45 50 55 60 65 70 75 8065
70
75
80
85
90
95
γ 213 K γ 218 K γ 228 K
Sur
face
tens
ion
[mN
.m-1]
wt% D2SO
4
Figure (4.17) shows the surface tensions for three different temperatures and
different concentrations, which are computed by using the Dolphin program.
Figure (4.17) Diagram of the surface tension versus sulphuric acid concentration at
213, 218 and 228 K
In the case of low concentrations of sulphuric acid, the values of the desorption rate
become smaller than those of the solvation rate at three different temperatures. This
framework is shown in figure (4.18). The dashed curves are the calculated solvation
rate of HCl in the sulphuric acid solution in regard to the capillary wave theory. The
solid lines are the desorption rate of HCl molecules from the D2SO4 / D2O solution,
which is calculated using the equation (4.4.7) at the three temperatures of 213, 218
and 228 K. The molecules dissolve faster in the liquid than they desorb from it. That
means the velocity of transfer molecules in the liquid is higher than the speed of
desorbing molecules from the surface of the liquid. Hence, the accommodation
coefficient is determined through the speed of desorption. In other words, the
desorption rate is stronger influenced by the temperature than the solvation rate.
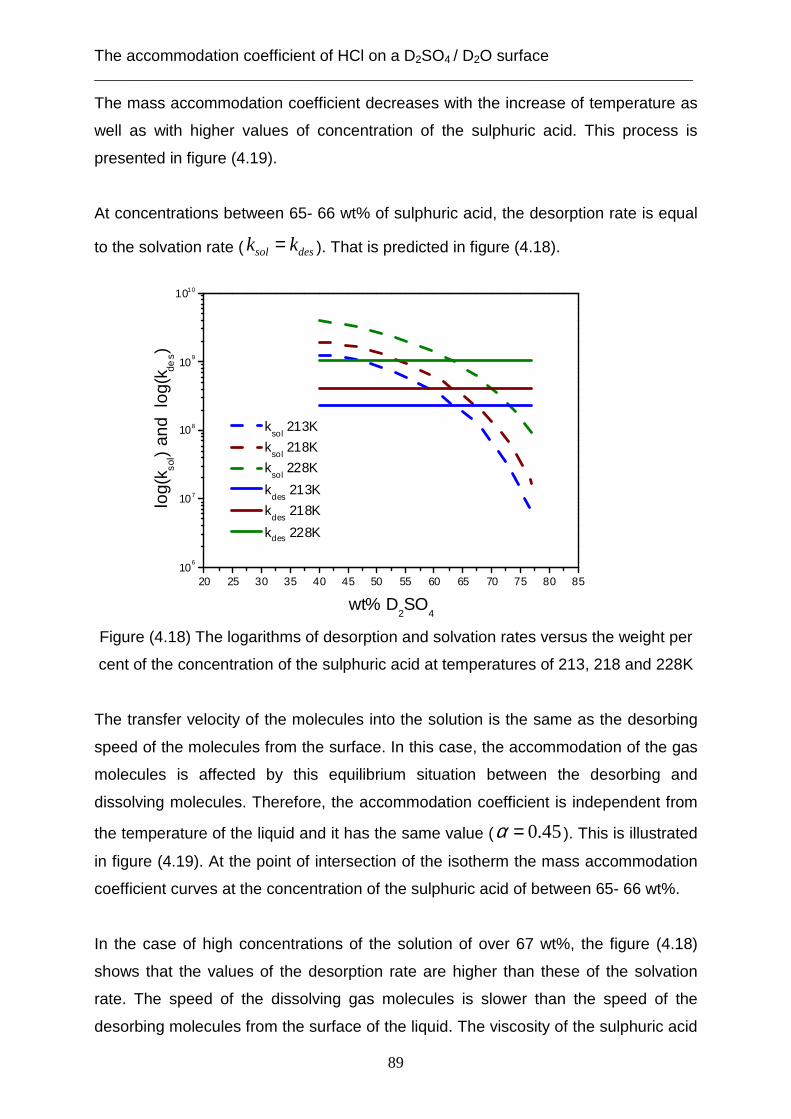
The accommodation coefficient of HCl on a D2SO4 / D2O surface ___________________________________________________________________________
89
20 25 30 35 40 45 50 55 60 65 70 75 80 8510
6
107
108
109
1010
log(
k sol)
and
log(
k des)
wt% D2SO
4
ksol
213K
ksol
218K
ksol
228K
kdes
213K
kdes
218K
kdes 228K
The mass accommodation coefficient decreases with the increase of temperature as
well as with higher values of concentration of the sulphuric acid. This process is
presented in figure (4.19).
At concentrations between 65- 66 wt% of sulphuric acid, the desorption rate is equal
to the solvation rate ( dessol kk = ). That is predicted in figure (4.18).
Figure (4.18) The logarithms of desorption and solvation rates versus the weight per
cent of the concentration of the sulphuric acid at temperatures of 213, 218 and 228K
The transfer velocity of the molecules into the solution is the same as the desorbing
speed of the molecules from the surface. In this case, the accommodation of the gas
molecules is affected by this equilibrium situation between the desorbing and
dissolving molecules. Therefore, the accommodation coefficient is independent from
the temperature of the liquid and it has the same value ( 45.0=α ). This is illustrated
in figure (4.19). At the point of intersection of the isotherm the mass accommodation
coefficient curves at the concentration of the sulphuric acid of between 65- 66 wt%.
In the case of high concentrations of the solution of over 67 wt%, the figure (4.18)
shows that the values of the desorption rate are higher than these of the solvation
rate. The speed of the dissolving gas molecules is slower than the speed of the
desorbing molecules from the surface of the liquid. The viscosity of the sulphuric acid
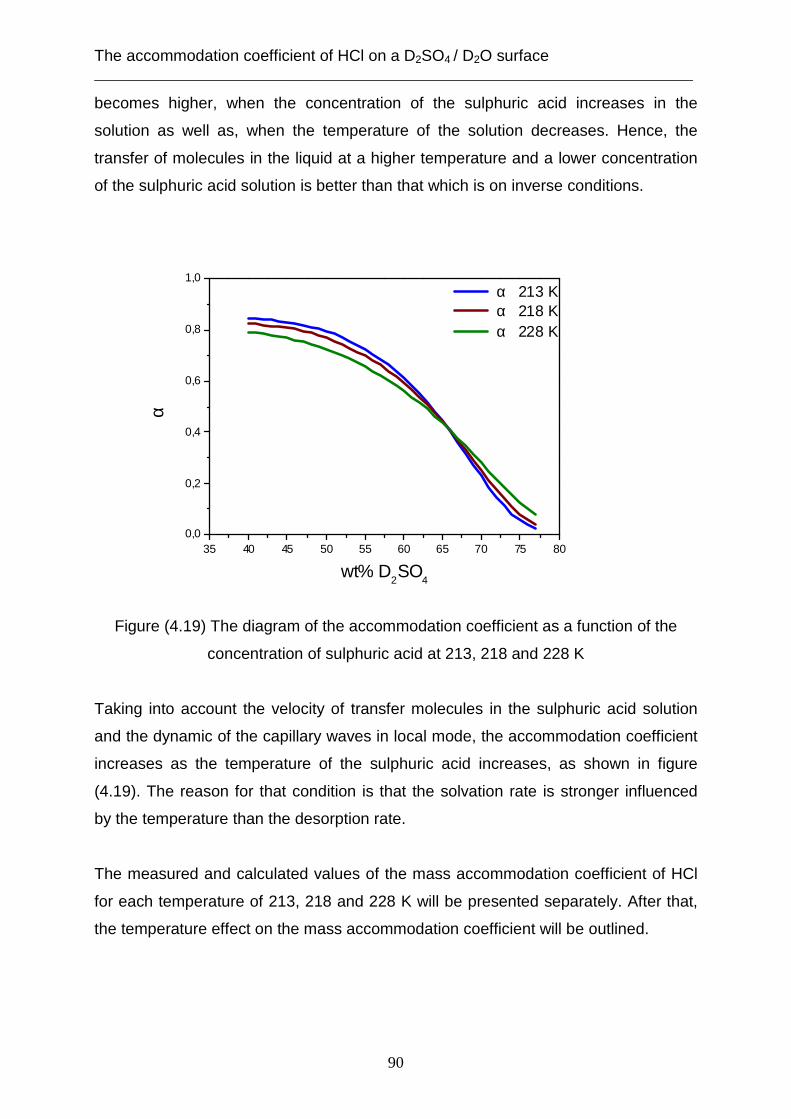
The accommodation coefficient of HCl on a D2SO4 / D2O surface ___________________________________________________________________________
90
35 40 45 50 55 60 65 70 75 800,0
0,2
0,4
0,6
0,8
1,0
α
wt% D2SO
4
α 213 K α 218 K α 228 K
becomes higher, when the concentration of the sulphuric acid increases in the
solution as well as, when the temperature of the solution decreases. Hence, the
transfer of molecules in the liquid at a higher temperature and a lower concentration
of the sulphuric acid solution is better than that which is on inverse conditions.
Figure (4.19) The diagram of the accommodation coefficient as a function of the
concentration of sulphuric acid at 213, 218 and 228 K
Taking into account the velocity of transfer molecules in the sulphuric acid solution
and the dynamic of the capillary waves in local mode, the accommodation coefficient
increases as the temperature of the sulphuric acid increases, as shown in figure
(4.19). The reason for that condition is that the solvation rate is stronger influenced
by the temperature than the desorption rate.
The measured and calculated values of the mass accommodation coefficient of HCl
for each temperature of 213, 218 and 228 K will be presented separately. After that,
the temperature effect on the mass accommodation coefficient will be outlined.
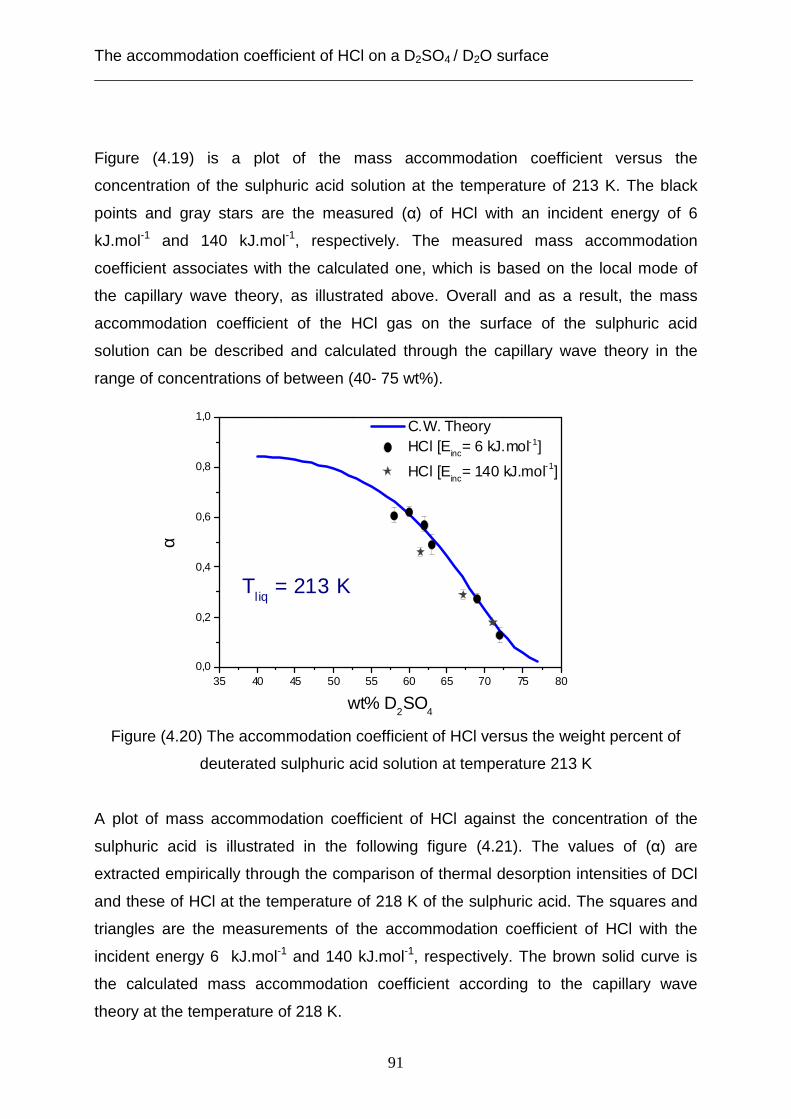
The accommodation coefficient of HCl on a D2SO4 / D2O surface ___________________________________________________________________________
91
35 40 45 50 55 60 65 70 75 800,0
0,2
0,4
0,6
0,8
1,0
α
wt% D2SO
4
C.W. Theory HCl [Einc= 6 kJ.mol-1]
HCl [Einc
= 140 kJ.mol-1]
Tl iq
= 213 K
Figure (4.19) is a plot of the mass accommodation coefficient versus the
concentration of the sulphuric acid solution at the temperature of 213 K. The black
points and gray stars are the measured (α) of HCl with an incident energy of 6
kJ.mol-1 and 140 kJ.mol-1, respectively. The measured mass accommodation
coefficient associates with the calculated one, which is based on the local mode of
the capillary wave theory, as illustrated above. Overall and as a result, the mass
accommodation coefficient of the HCl gas on the surface of the sulphuric acid
solution can be described and calculated through the capillary wave theory in the
range of concentrations of between (40- 75 wt%).
Figure (4.20) The accommodation coefficient of HCl versus the weight percent of
deuterated sulphuric acid solution at temperature 213 K
A plot of mass accommodation coefficient of HCl against the concentration of the
sulphuric acid is illustrated in the following figure (4.21). The values of (α) are
extracted empirically through the comparison of thermal desorption intensities of DCl
and these of HCl at the temperature of 218 K of the sulphuric acid. The squares and
triangles are the measurements of the accommodation coefficient of HCl with the
incident energy 6 kJ.mol-1 and 140 kJ.mol-1, respectively. The brown solid curve is
the calculated mass accommodation coefficient according to the capillary wave
theory at the temperature of 218 K.
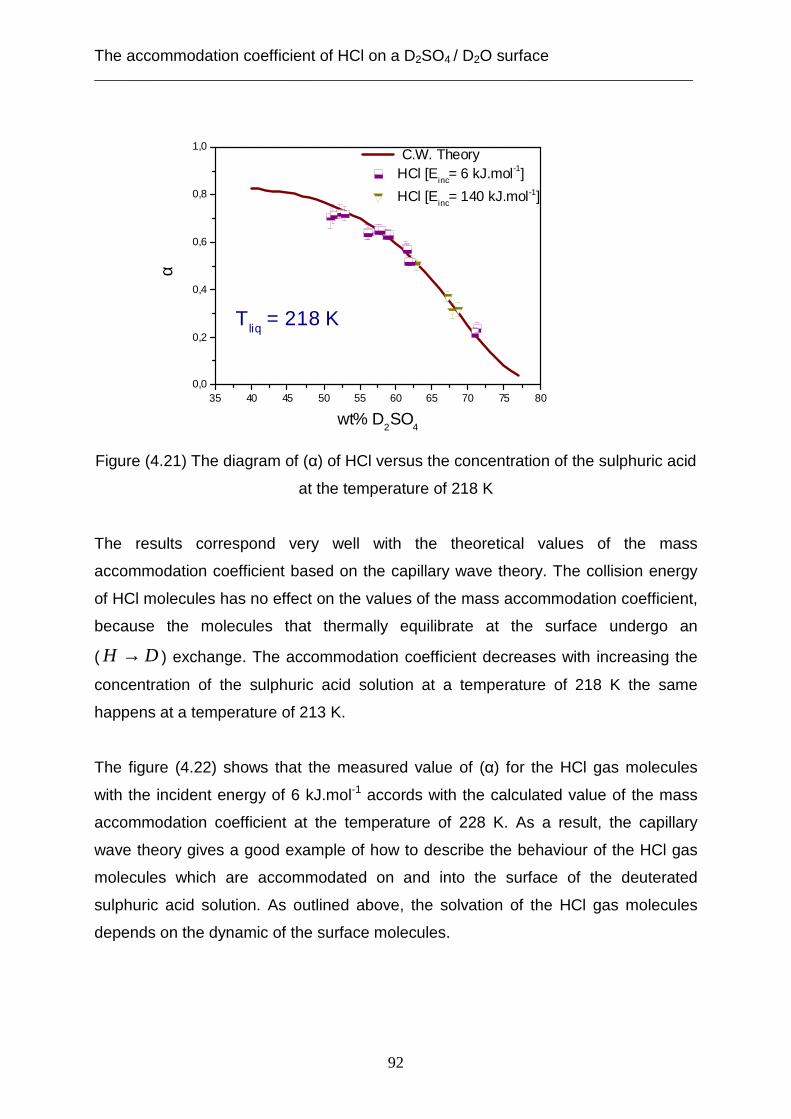
The accommodation coefficient of HCl on a D2SO4 / D2O surface ___________________________________________________________________________
92
35 40 45 50 55 60 65 70 75 800,0
0,2
0,4
0,6
0,8
1,0
Tliq
= 218 K
α
wt% D2SO
4
C.W. Theory HCl [Einc= 6 kJ.mol-1]
HCl [Einc= 140 kJ.mol-1]
Figure (4.21) The diagram of (α) of HCl versus the concentration of the sulphuric acid
at the temperature of 218 K
The results correspond very well with the theoretical values of the mass
accommodation coefficient based on the capillary wave theory. The collision energy
of HCl molecules has no effect on the values of the mass accommodation coefficient,
because the molecules that thermally equilibrate at the surface undergo an
( DH → ) exchange. The accommodation coefficient decreases with increasing the
concentration of the sulphuric acid solution at a temperature of 218 K the same
happens at a temperature of 213 K.
The figure (4.22) shows that the measured value of (α) for the HCl gas molecules
with the incident energy of 6 kJ.mol-1 accords with the calculated value of the mass
accommodation coefficient at the temperature of 228 K. As a result, the capillary
wave theory gives a good example of how to describe the behaviour of the HCl gas
molecules which are accommodated on and into the surface of the deuterated
sulphuric acid solution. As outlined above, the solvation of the HCl gas molecules
depends on the dynamic of the surface molecules.
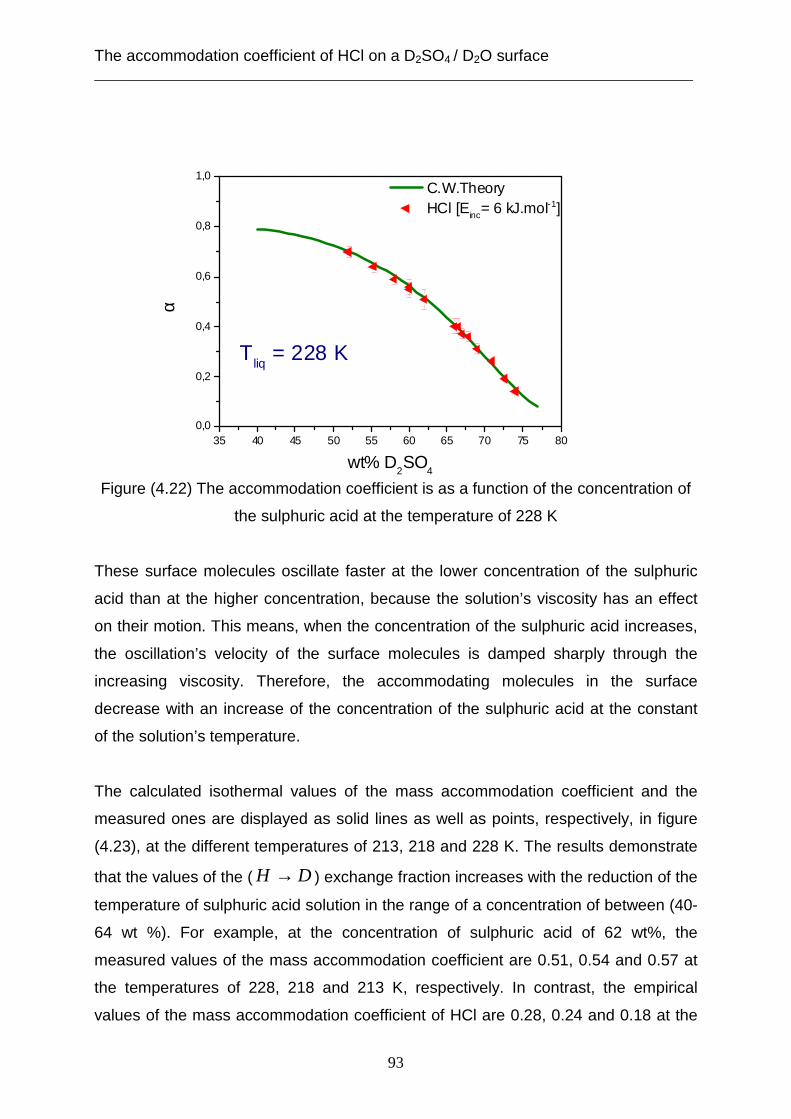
The accommodation coefficient of HCl on a D2SO4 / D2O surface ___________________________________________________________________________
93
35 40 45 50 55 60 65 70 75 800,0
0,2
0,4
0,6
0,8
1,0
Tliq
= 228 K
α
wt% D2SO
4
C.W.Theory HCl [Einc= 6 kJ.mol-1]
Figure (4.22) The accommodation coefficient is as a function of the concentration of
the sulphuric acid at the temperature of 228 K
These surface molecules oscillate faster at the lower concentration of the sulphuric
acid than at the higher concentration, because the solution’s viscosity has an effect
on their motion. This means, when the concentration of the sulphuric acid increases,
the oscillation’s velocity of the surface molecules is damped sharply through the
increasing viscosity. Therefore, the accommodating molecules in the surface
decrease with an increase of the concentration of the sulphuric acid at the constant
of the solution’s temperature.
The calculated isothermal values of the mass accommodation coefficient and the
measured ones are displayed as solid lines as well as points, respectively, in figure
(4.23), at the different temperatures of 213, 218 and 228 K. The results demonstrate
that the values of the ( DH → ) exchange fraction increases with the reduction of the
temperature of sulphuric acid solution in the range of a concentration of between (40-
64 wt %). For example, at the concentration of sulphuric acid of 62 wt%, the
measured values of the mass accommodation coefficient are 0.51, 0.54 and 0.57 at
the temperatures of 228, 218 and 213 K, respectively. In contrast, the empirical
values of the mass accommodation coefficient of HCl are 0.28, 0.24 and 0.18 at the
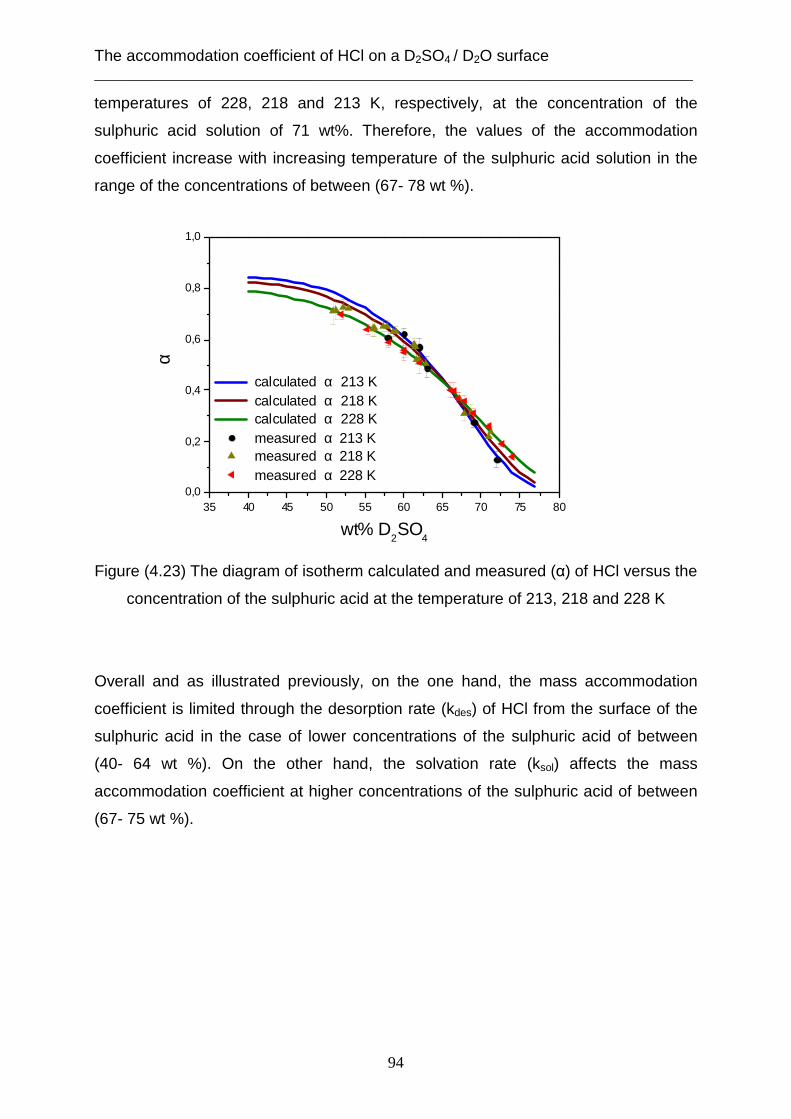
The accommodation coefficient of HCl on a D2SO4 / D2O surface ___________________________________________________________________________
94
35 40 45 50 55 60 65 70 75 800,0
0,2
0,4
0,6
0,8
1,0
α
wt% D2SO
4
calculated α 213 K calculated α 218 K calculated α 228 K measured α 213 K measured α 218 K measured α 228 K
temperatures of 228, 218 and 213 K, respectively, at the concentration of the
sulphuric acid solution of 71 wt%. Therefore, the values of the accommodation
coefficient increase with increasing temperature of the sulphuric acid solution in the
range of the concentrations of between (67- 78 wt %).
Figure (4.23) The diagram of isotherm calculated and measured (α) of HCl versus the
concentration of the sulphuric acid at the temperature of 213, 218 and 228 K
Overall and as illustrated previously, on the one hand, the mass accommodation
coefficient is limited through the desorption rate (kdes) of HCl from the surface of the
sulphuric acid in the case of lower concentrations of the sulphuric acid of between
(40- 64 wt %). On the other hand, the solvation rate (ksol) affects the mass
accommodation coefficient at higher concentrations of the sulphuric acid of between
(67- 75 wt %).
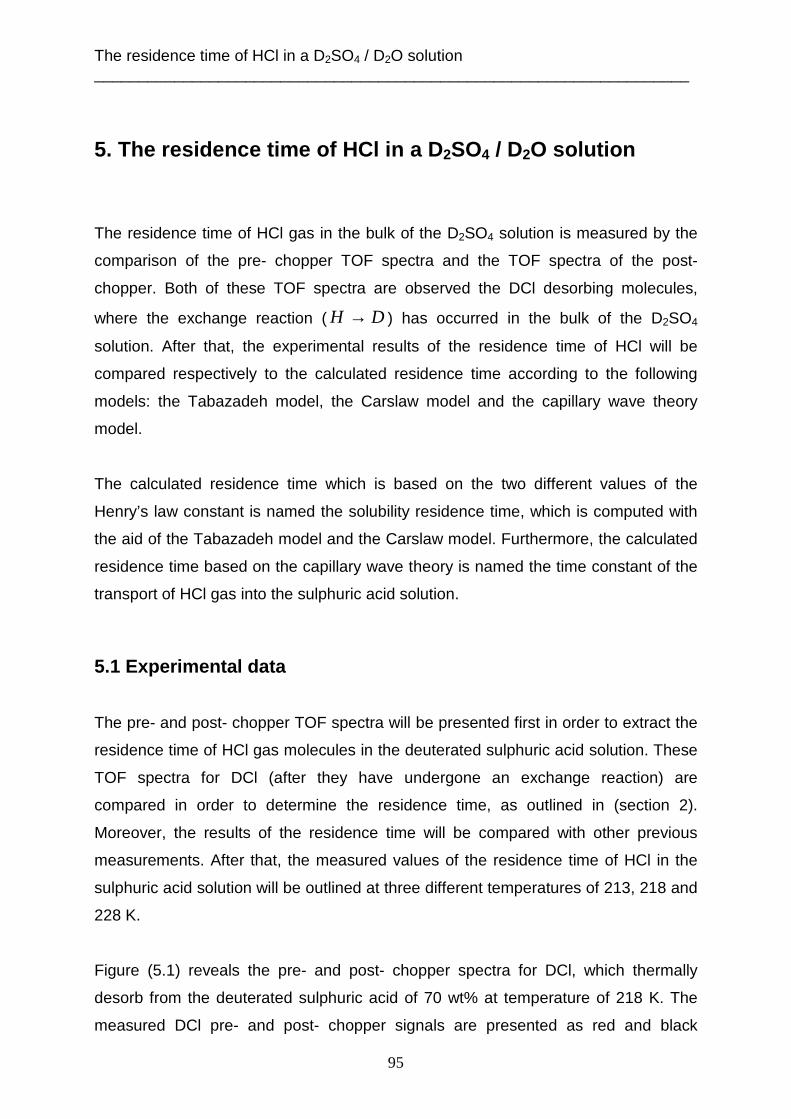
The residence time of HCl in a D2SO4 / D2O solution ___________________________________________________________________
95
5. The residence time of HCl in a D 2SO4 / D2O solution The residence time of HCl gas in the bulk of the D2SO4 solution is measured by the
comparison of the pre- chopper TOF spectra and the TOF spectra of the post-
chopper. Both of these TOF spectra are observed the DCl desorbing molecules,
where the exchange reaction ( DH → ) has occurred in the bulk of the D2SO4
solution. After that, the experimental results of the residence time of HCl will be
compared respectively to the calculated residence time according to the following
models: the Tabazadeh model, the Carslaw model and the capillary wave theory
model.
The calculated residence time which is based on the two different values of the
Henry’s law constant is named the solubility residence time, which is computed with
the aid of the Tabazadeh model and the Carslaw model. Furthermore, the calculated
residence time based on the capillary wave theory is named the time constant of the
transport of HCl gas into the sulphuric acid solution.
5.1 Experimental data
The pre- and post- chopper TOF spectra will be presented first in order to extract the
residence time of HCl gas molecules in the deuterated sulphuric acid solution. These
TOF spectra for DCl (after they have undergone an exchange reaction) are
compared in order to determine the residence time, as outlined in (section 2).
Moreover, the results of the residence time will be compared with other previous
measurements. After that, the measured values of the residence time of HCl in the
sulphuric acid solution will be outlined at three different temperatures of 213, 218 and
228 K.
Figure (5.1) reveals the pre- and post- chopper spectra for DCl, which thermally
desorb from the deuterated sulphuric acid of 70 wt% at temperature of 218 K. The
measured DCl pre- and post- chopper signals are presented as red and black
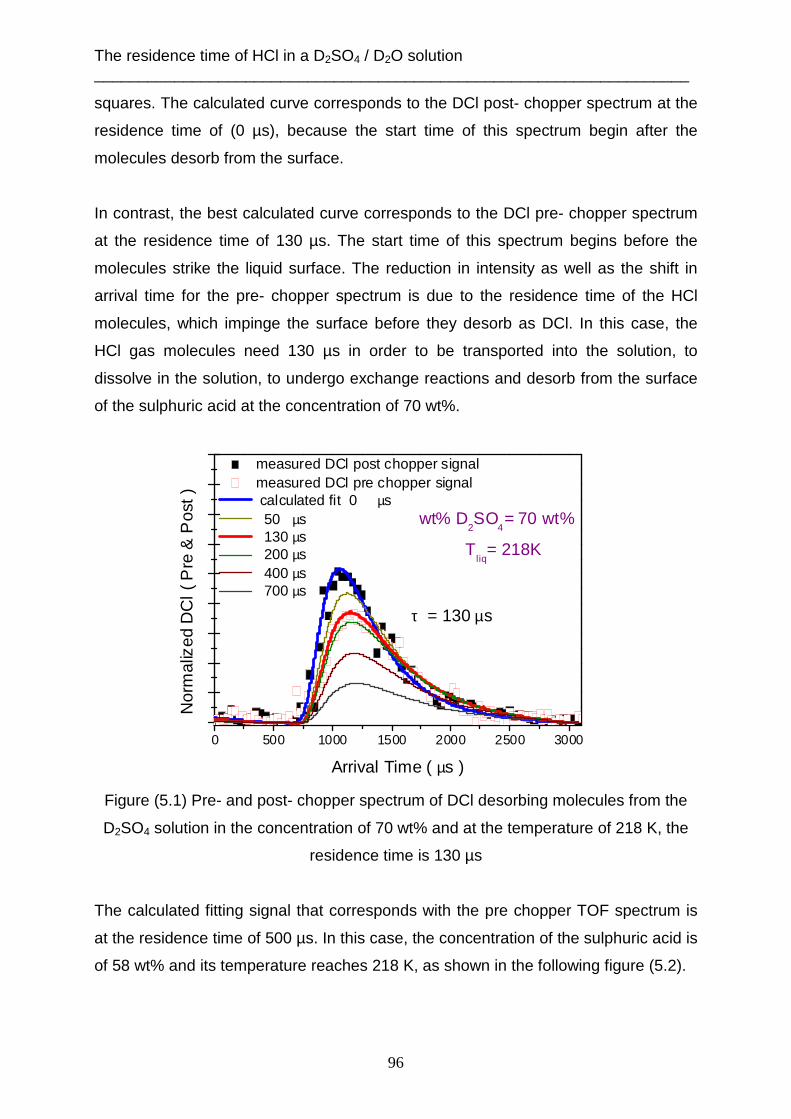
The residence time of HCl in a D2SO4 / D2O solution ___________________________________________________________________
96
0 500 1000 1500 2000 2500 3000
wt% D2SO
4= 70 wt%
Tliq
= 218K
τ = 130 µs
measured DCl post chopper signal measured DCl pre chopper signal calculated fit 0 µs 50 µs 130 µs 200 µs 400 µs 700 µs
Nor
mal
ized
DC
l ( P
re &
Pos
t )
Arrival Time ( µs )
squares. The calculated curve corresponds to the DCl post- chopper spectrum at the
residence time of (0 µs), because the start time of this spectrum begin after the
molecules desorb from the surface.
In contrast, the best calculated curve corresponds to the DCl pre- chopper spectrum
at the residence time of 130 µs. The start time of this spectrum begins before the
molecules strike the liquid surface. The reduction in intensity as well as the shift in
arrival time for the pre- chopper spectrum is due to the residence time of the HCl
molecules, which impinge the surface before they desorb as DCl. In this case, the
HCl gas molecules need 130 µs in order to be transported into the solution, to
dissolve in the solution, to undergo exchange reactions and desorb from the surface
of the sulphuric acid at the concentration of 70 wt%.
Figure (5.1) Pre- and post- chopper spectrum of DCl desorbing molecules from the
D2SO4 solution in the concentration of 70 wt% and at the temperature of 218 K, the
residence time is 130 µs
The calculated fitting signal that corresponds with the pre chopper TOF spectrum is
at the residence time of 500 µs. In this case, the concentration of the sulphuric acid is
of 58 wt% and its temperature reaches 218 K, as shown in the following figure (5.2).

The residence time of HCl in a D2SO4 / D2O solution ___________________________________________________________________
97
0 500 1000 1500 2000 2500 3000
Tliq
= 218K
wt% D2SO
4= 58 wt%
τ = 500 µs
Nor
mal
ized
DC
l (P
re &
Pos
t)
Arrival time [µs]
measured DCl post chopper signal measured DCl pre chopper signal calculated fit signal (τ = 0 µs) calculated fit signal (τ = 500 µs)
Figure (5.2) Pre- and post- chopper spectrum of DCl desorbing molecules from the
D2SO4 solution in concentration of 58 wt% and at the temperature of 218 K, the
residence time is 500 µs
The longer residence time reflects that the HCl impinging molecules dissolve deeply
in the solution of sulphuric acid. As a result, the residence time of HCl in the sulphuric
solution depends on the concentration of the sulphuric acid as well as on its
temperature. Therefore, in the next step, the effect of the concentration and
temperature of the sulphuric acid solution on its residence time will be studied.
Figure (5.3) shows the residence time of HCl in the bulk of the solution as a function
of the concentration of the sulphuric acid solution. The measured values of the
residence time are presented in this figure. The red stars are the values of residence
time that were measured by Behr et al. 2000. The triangles and circles are
measurements of the residence time of HCl gas which impinge the surface of the
sulphuric acid with incident energies of 6 kJ.mol-1 and 140 kJ.mol-1, respectively. All
measured values are carried out at the temperature 213 K. the measured residence
time of this work corresponds to the measured one of Behr et al. 2000.
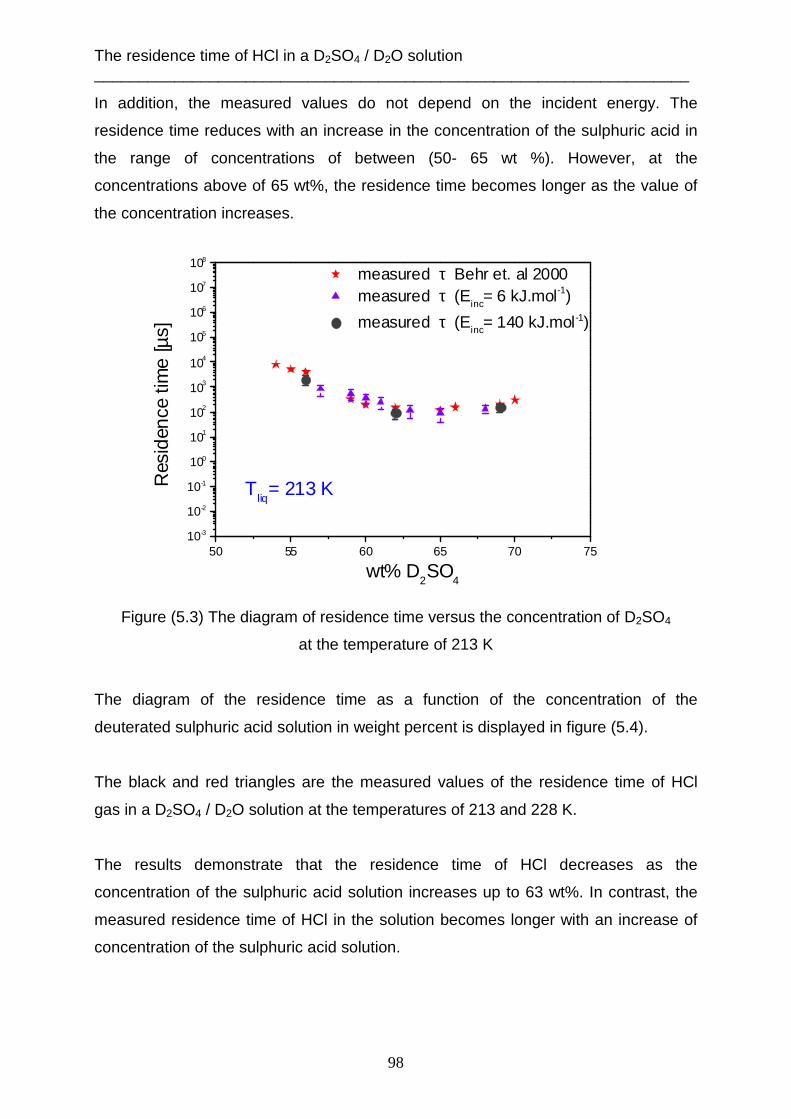
The residence time of HCl in a D2SO4 / D2O solution ___________________________________________________________________
98
50 55 60 65 70 7510-3
10-2
10-1
100
101
102
103
104
105
106
107
108
Res
iden
ce ti
me
[µs]
wt% D2SO
4
measured τ Behr et. al 2000 measured τ (E
inc= 6 kJ.mol-1)
measured τ (Einc= 140 kJ.mol-1)
Tliq
= 213 K
In addition, the measured values do not depend on the incident energy. The
residence time reduces with an increase in the concentration of the sulphuric acid in
the range of concentrations of between (50- 65 wt %). However, at the
concentrations above of 65 wt%, the residence time becomes longer as the value of
the concentration increases.
Figure (5.3) The diagram of residence time versus the concentration of D2SO4
at the temperature of 213 K
The diagram of the residence time as a function of the concentration of the
deuterated sulphuric acid solution in weight percent is displayed in figure (5.4).
The black and red triangles are the measured values of the residence time of HCl
gas in a D2SO4 / D2O solution at the temperatures of 213 and 228 K.
The results demonstrate that the residence time of HCl decreases as the
concentration of the sulphuric acid solution increases up to 63 wt%. In contrast, the
measured residence time of HCl in the solution becomes longer with an increase of
concentration of the sulphuric acid solution.
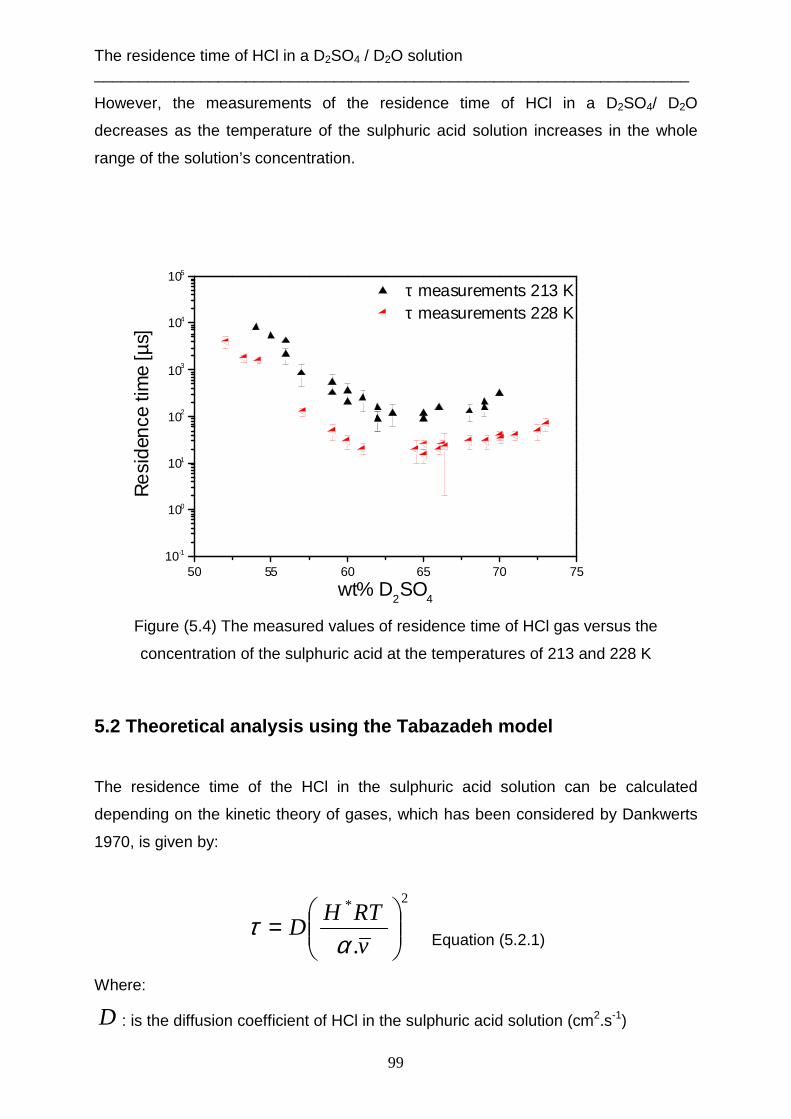
The residence time of HCl in a D2SO4 / D2O solution ___________________________________________________________________
99
50 55 60 65 70 7510-1
100
101
102
103
104
105
Res
iden
ce ti
me
[µs]
wt% D2SO
4
τ measurements 213 K τ measurements 228 K
However, the measurements of the residence time of HCl in a D2SO4/ D2O
decreases as the temperature of the sulphuric acid solution increases in the whole
range of the solution’s concentration.
Figure (5.4) The measured values of residence time of HCl gas versus the
concentration of the sulphuric acid at the temperatures of 213 and 228 K
5.2 Theoretical analysis using the Tabazadeh model
The residence time of the HCl in the sulphuric acid solution can be calculated
depending on the kinetic theory of gases, which has been considered by Dankwerts
1970, is given by:
2*
.
=
v
RTHD
ατ
Equation (5.2.1)
Where:
D : is the diffusion coefficient of HCl in the sulphuric acid solution (cm2.s-1)
The residence time of HCl in a D2SO4 / D2O solution ___________________________________________________________________
100
R : is the universal constant (atm.l.mol-1.K-1)
T : is the temperature of the sulphuric acid solution (K)
α : is the accommodation coefficient, which is calculated by using the capillary wave
theory, as described in the next chapter (dimensionless)
v : is the average velocity of the gas species, RTv2
3= (m.s-1)
*H : is the effective Henry’s law constant (mol.l-1.atm-1)
The residence time is related to the concentration and the temperature of the
sulphuric acid solution. Therefore, the diffusion coefficient for HCl in the sulphuric
acid solution must be computed first. This diffusion coefficient can be estimated by
using Stockes- Einstein relation:
ηT
cD ⋅= Equation (5.2.2)
c : is the constant, = 7.8x10⁻⁸ cm2.cP.s-1.K-1, which is determined by [Klassen et al.
1998].
T : is the temperature of the sulphuric acid solution in this work; 213, 218 and 228 K
η : is the viscosity of the sulphuric acid in centipoise.
The viscosity of the super cooled sulphuric acid can be determined by the equation
[Williams & Long, 1995]:
( ) ( ) ( ))(0)()( exp. ww
wnww TTBTA −=η Equation (5.2.3)
)( wη : is the viscosity of the sulphuric acid solution as a function of the weight
percent (wt %)
T : is the temperature of the solution (K)
And the parameters:
)(wB = 425 and n = -1.43
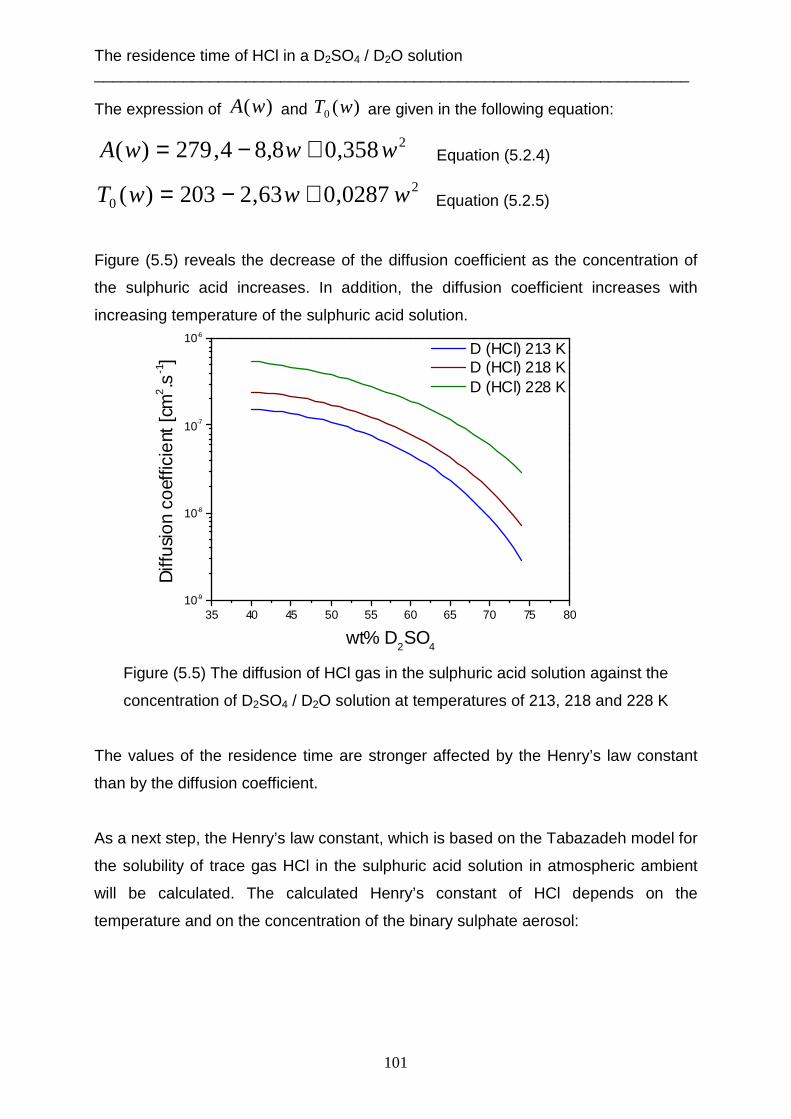
The residence time of HCl in a D2SO4 / D2O solution ___________________________________________________________________
101
35 40 45 50 55 60 65 70 75 8010-9
10-8
10-7
10-6
Diff
usio
n co
effic
ient
[cm
2.s
-1]
wt% D2SO
4
D (HCl) 213 K D (HCl) 218 K D (HCl) 228 K
The expression of )(wA and )(0 wT are given in the following equation:
2358,08,84,279)( wwwA +−= Equation (5.2.4)
20 0287,063,2203)( wwwT +−= Equation (5.2.5)
Figure (5.5) reveals the decrease of the diffusion coefficient as the concentration of
the sulphuric acid increases. In addition, the diffusion coefficient increases with
increasing temperature of the sulphuric acid solution.
Figure (5.5) The diffusion of HCl gas in the sulphuric acid solution against the
concentration of D2SO4 / D2O solution at temperatures of 213, 218 and 228 K
The values of the residence time are stronger affected by the Henry’s law constant
than by the diffusion coefficient.
As a next step, the Henry’s law constant, which is based on the Tabazadeh model for
the solubility of trace gas HCl in the sulphuric acid solution in atmospheric ambient
will be calculated. The calculated Henry’s constant of HCl depends on the
temperature and on the concentration of the binary sulphate aerosol:
The residence time of HCl in a D2SO4 / D2O solution ___________________________________________________________________
102
[ ] )(
)(
200
0*
42
42
),(2
)(),(
SOH
SOH
smixCls
s
Cl
Cls m
M
mTm
TK
p
mmTH ⋅==
γ Equation (5.2.6)
Where:
),( 0*smTH : is the effective Henry’s law constant (mol.l-1.atm-1)
)(TK s : is the gas solubility constant
This constant depends on the solution’s temperature, thus it can be approximated
using Van’t Hoff equation:
−−
∆+
−∆=
T
T
T
T
R
C
TTR
H
TK
TK p
s
s000
0
0
0ln1
11
)(
)(ln Equation (5.2.7)
In the course of this work, there will only be computed the solubility constant for HCl
in the aqueous H2SO4 concentrations of between (40- 75 wt %) and at temperatures
of (213, 218 and 228 K). Thus:
T : is the experimental temperature of the sulphuric acid solution
0T : is the standard temperature of (= 298.15 K)
)( 0TK s : is the solubility constant of HCl gas at the standard temperature of (= 2.04
x10+6 mol2.kg-2.atm-1)
0pC∆ : is the standard heat capacity of HCl of (= -3.95793 x10+1 cal.K-1.mol-1)
0H∆ : is the standard enthalpy of HCl of (= -1.78967 x10+1 kcal.mol)
Tabazadeh had taken these parameters at standard temperature from
[Brimblecomble & Clegg 1988].
0sm : is the molality of H2SO4, which is the major component of the aerosol in the
solution; 0ss mm = :
)100(
10000
00
s
ss wM
wm
−⋅
= Equation (5.2.8)
The residence time of HCl in a D2SO4 / D2O solution ___________________________________________________________________
103
This equation is used to convert the weight percent of the aqueous electroly
concentration into molality, where:
M = 100 g.mol-1 for D2SO4
0sw : is the weight percent of the electrolyte in the solution, which is calculated as a
function with respect to water vapour pressure ( wp ), which is calculated by
[Tabazadeh et al. 1997] in units of torr. The equation is:
∑=
⋅−=5
0
0 )()1(i
iwi
is PTSw Equation (5.2.9)
iS : the temperature coefficients are given in table (5.1):
44
33
2210)(ln TaTaTaTaaTS i ++++=
Coefficients a0 a1 a2 a3 a4
S0 4.9306007769 -281.24576227 36171.943540 -739210.80947 -116409364.69
S1 -10.6902946223 5784.329174 -1246284.8248 31325022.591 -2206827530.8
S2 -39.722280419 12350.60747 -3429949.4505 62642389.672 -3970969449.3
S3 -55.968384906 12922.351288 1350408.6346 -178905338.60 8849811933.4
S4 -82.938840352 22079.294414 294696.83691 -31424855.089 1088487564.6
S5 -106.47596744 27525.067463 420618.52240 -51877378.665 284983818.2
The mean activity coefficient can be calculated in the following equation. And the
result can be added to the Henry’s law constant equation:
( )[ ]),(ln25,2),(ln22
1ln 000 TITIm
I sClsmixCl γγγ += Equation (5.2.10)
where 03 smI =
The mean activity coefficient for the pure of HCl can be computed by the equation:
∑=
=3
0
0 ).(lni
iClciCl mTaγ Equation (5.2.11)
The concentration of HCl in the sulphuric acid solution is very small; therefore it will
be assumed that the concentration is approximately 0,001 mol.kg-1.
The mean activity coefficient for H2SO4 can be computed by the following equation:

The residence time of HCl in a D2SO4 / D2O solution ___________________________________________________________________
104
35 40 45 50 55 60 65 70 7510-2
10-1
100
101
102
103
104
105
106
Res
iden
ce ti
me
[µs]
D2SO
4wt%
τ HCl [213 K] τ HCl [218 K] τ HCl [228 K]
∑=
=3
0
0 ).(lni
issis mTaγ Equation (5.2.12)
The (ac) and (as) variables are temperature coefficients for the mean activity
coefficients of HCl and H2SO4, respectively, which can be calculated through the
table (5.2) below:
44
33
2210 TbTbTbTbbaij ++++=
Coefficients b0 b1 b2 b3 b4
as0 -98.727713620 1.5892180900 -1.0611069051e-2 3.1437317659e-5 -3.5694366687e-8
as1 26.972534510 -0.41774114259 2.7534704937e-3 -8.0885350553e-6 9.0919984894e-9
as2 -3.1506575361 5.1477027299e-2 -3.4697470359e-4 1.0511865215e-6 -1.2167638793e-9
as3 0.089194643751 -1.4398498884e-3 9.5874823381e-6 -2.8832930837e-8 3.319971759e-11
ac0 -63.192805354 9.1254642395 -5.0869838292e-3 1.2864402271e-5 -1.2449266080e-8
ac1 -4.3827430062 7.1340939436e-2 -4.0096139965e-4 1.0068383723e-6 -9.703889501e-10
ac2 1.1661208715 -1.6494974438e-2 9.0259619393e-5 -2.2549127848e-7 2.167004813e-10
ac3 -0.02003266808 2.6583489579e-4 -1.4088333815e-6 3.4600826715e-9 -3.298437535e-12
Hence, it can be extracted that the residence time depends on the calculation of
Henry’s law constant using Tabazadeh model. The diagram (5.6) illustrates the
residence time of HCl gas, which is plotted as a function in respect with the weight
percent concentration of the sulphuric acid.
Figure (5.6) Diagram of HClτ as a function of D2SO4 wt%, at the temperature of 213,
218 and 228K

The residence time of HCl in a D2SO4 / D2O solution ___________________________________________________________________
105
40 45 50 55 60 65 70 75 8010-3
10-2
10-1
100
101
102
103
104
105
106
107
108
109
Res
iden
ce ti
me
[µs]
wt% D2SO
4
τ (Tabazadeh model) τ measurements
Tliq
= 228 K
The blue, brown and green solid lines illustrate the calculated residence time based
on the Tabazadeh model at temperatures of the sulphuric acid solution of 213, 218
and 228 K, respectively.
The results demonstrate that the calculated residence time according to the
Tabazadeh model becomes shorter, when the concentration of the sulphuric acid
solution increases and the values of the temperature of this solution become higher.
The Henry’s law constant of HCl gas in the sulphuric acid solution decreases as the
concentration and the temperature of the sulphuric acid solution increase.
Figure (5.7) is a plot of the residence time of HCl in microsecond against the
concentration of the deuterated sulphuric acid solution at the temperature of 228 K.
The measured values of the residence time with the collusion energy of 6 kJ.mol-1
are displayed as the red triangles. The solid line is the calculated residence time
according to the Tabazadeh model at temperature of 228 K.
Figure (5.7) The residence time as a function of the weight percent concentration of
the sulphuric acid at the temperature of 228 K
The measured value of the residence time associates with the calculated one in the
range of concentrations of between (57- 61 wt %). There are two significant
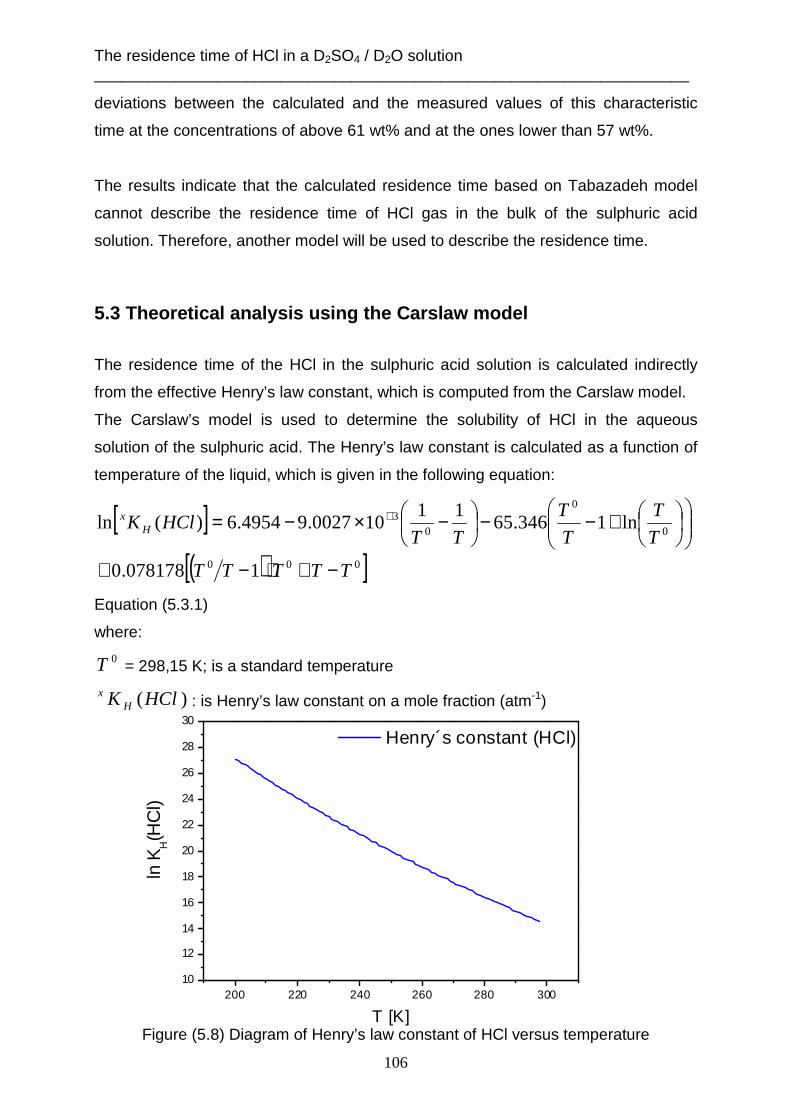
The residence time of HCl in a D2SO4 / D2O solution ___________________________________________________________________
106
200 220 240 260 280 30010
12
14
16
18
20
22
24
26
28
30
ln K
H(H
Cl)
T [K]
Henry´s constant (HCl)
deviations between the calculated and the measured values of this characteristic
time at the concentrations of above 61 wt% and at the ones lower than 57 wt%.
The results indicate that the calculated residence time based on Tabazadeh model
cannot describe the residence time of HCl gas in the bulk of the sulphuric acid
solution. Therefore, another model will be used to describe the residence time.
5.3 Theoretical analysis using the Carslaw model
The residence time of the HCl in the sulphuric acid solution is calculated indirectly
from the effective Henry’s law constant, which is computed from the Carslaw model.
The Carslaw’s model is used to determine the solubility of HCl in the aqueous
solution of the sulphuric acid. The Henry’s law constant is calculated as a function of
temperature of the liquid, which is given in the following equation:
[ ]( )[ ]000
0
0
03
1078178.0
ln1346.6511
100027.94954.6)(ln
TTTTT
T
T
T
T
TTHClK H
x
−+⋅−+
+−−
−×−= +
Equation (5.3.1)
where:
0T = 298,15 K; is a standard temperature
)(HClK Hx
: is Henry’s law constant on a mole fraction (atm-1)
Figure (5.8) Diagram of Henry’s law constant of HCl versus temperature
The residence time of HCl in a D2SO4 / D2O solution ___________________________________________________________________
107
The relationship between the Henry’s law constant above and the molal Henry’s law
constant is:
( )22 100018)(2
Hx
OH
Hx
H
K
m
KK == ; HK (kg2.mol-2.atm-1) Equation (5.3.2)
Diagram (5.8) plots the molal Henry’s law constant of HCl in the sulphuric acid
solution as a function of the temperatures in a range of between (200- 298K).
On the other hand, [Carslaw et al. 1995] presents the effective Henry’s law constant
H* (mol.l-1.atm-1) of HCl as a function of the concentration of the sulphuric acid
solution:
)(
)(
2*
42
42
SOH
SOH
H
H
m
M
m
KH ⋅
⋅=
mγ Equation (5.3.3)
while:
Hm : is the molality of free hydrogen ion in solution; the sulphuric acid must be
complete dissociation as:
+− +⇔ HSOSOH 22442 Reaction (5.3.1)
mγ : is the mean molal activity coefficient only for HCl, which can be found in the
internet on the website “EAIM” inorganic composition (HCl, HBr, HF in solution model
2 and 3).
)( 42 SOHM : is the molarity of the aqueous sulphuric acid solution (mol.l-1)
)( 42 SOHm : is the molality of the aqueous sulphuric acid solution (mol.kg-1)
Then, the molality of the aqueous H2SO4 can be calculated from the weight percent
concentration of the sulphuric acid with the help of this equation:
%)100.(98
%).(1000
42
4242 wtSOH
wtSOHm SOH −
= Equation (5.3.4)
In addition to that, the density of the solution at lower temperatures such as 213, 218
and 228 K can be computed by the following equation [Carslaw et al. 1995]:
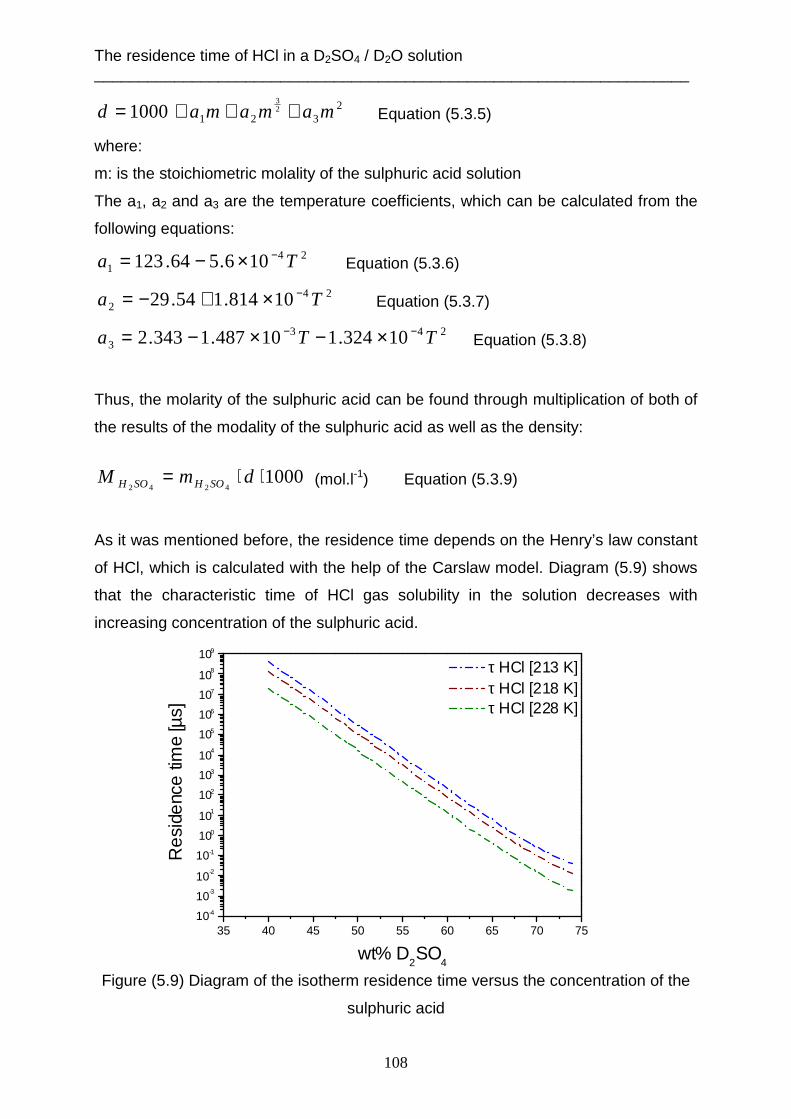
The residence time of HCl in a D2SO4 / D2O solution ___________________________________________________________________
108
35 40 45 50 55 60 65 70 7510-4
10-3
10-2
10-1
100
101
102
103
104
105
106
107
108
109
Res
iden
ce ti
me
[µs]
wt% D2SO
4
τ HCl [213 K] τ HCl [218 K] τ HCl [228 K]
2321
23
1000 mamamad +++= Equation (5.3.5)
where:
m: is the stoichiometric molality of the sulphuric acid solution
The a1, a2 and a3 are the temperature coefficients, which can be calculated from the
following equations:
241 106.564.123 Ta −×−= Equation (5.3.6)
242 10814.154.29 Ta −×+−= Equation (5.3.7)
2433 10324.110487.1343.2 TTa −− ×−×−= Equation (5.3.8)
Thus, the molarity of the sulphuric acid can be found through multiplication of both of
the results of the modality of the sulphuric acid as well as the density:
1000
4242⋅⋅= dmM SOHSOH (mol.l-1) Equation (5.3.9)
As it was mentioned before, the residence time depends on the Henry’s law constant
of HCl, which is calculated with the help of the Carslaw model. Diagram (5.9) shows
that the characteristic time of HCl gas solubility in the solution decreases with
increasing concentration of the sulphuric acid.
Figure (5.9) Diagram of the isotherm residence time versus the concentration of the
sulphuric acid
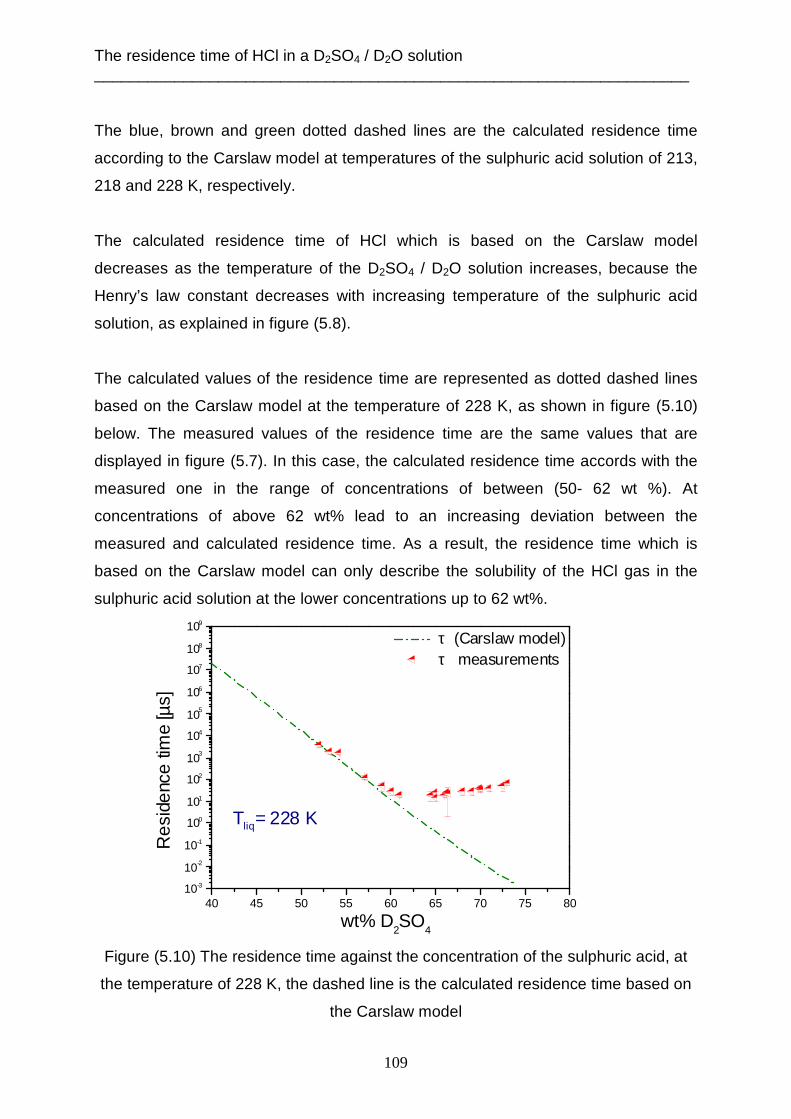
The residence time of HCl in a D2SO4 / D2O solution ___________________________________________________________________
109
40 45 50 55 60 65 70 75 8010-3
10-2
10-1
100
101
102
103
104
105
106
107
108
109
Res
iden
ce ti
me
[µs]
wt% D2SO
4
τ (Carslaw model) τ measurements
Tliq= 228 K
The blue, brown and green dotted dashed lines are the calculated residence time
according to the Carslaw model at temperatures of the sulphuric acid solution of 213,
218 and 228 K, respectively.
The calculated residence time of HCl which is based on the Carslaw model
decreases as the temperature of the D2SO4 / D2O solution increases, because the
Henry’s law constant decreases with increasing temperature of the sulphuric acid
solution, as explained in figure (5.8).
The calculated values of the residence time are represented as dotted dashed lines
based on the Carslaw model at the temperature of 228 K, as shown in figure (5.10)
below. The measured values of the residence time are the same values that are
displayed in figure (5.7). In this case, the calculated residence time accords with the
measured one in the range of concentrations of between (50- 62 wt %). At
concentrations of above 62 wt% lead to an increasing deviation between the
measured and calculated residence time. As a result, the residence time which is
based on the Carslaw model can only describe the solubility of the HCl gas in the
sulphuric acid solution at the lower concentrations up to 62 wt%.
Figure (5.10) The residence time against the concentration of the sulphuric acid, at
the temperature of 228 K, the dashed line is the calculated residence time based on
the Carslaw model
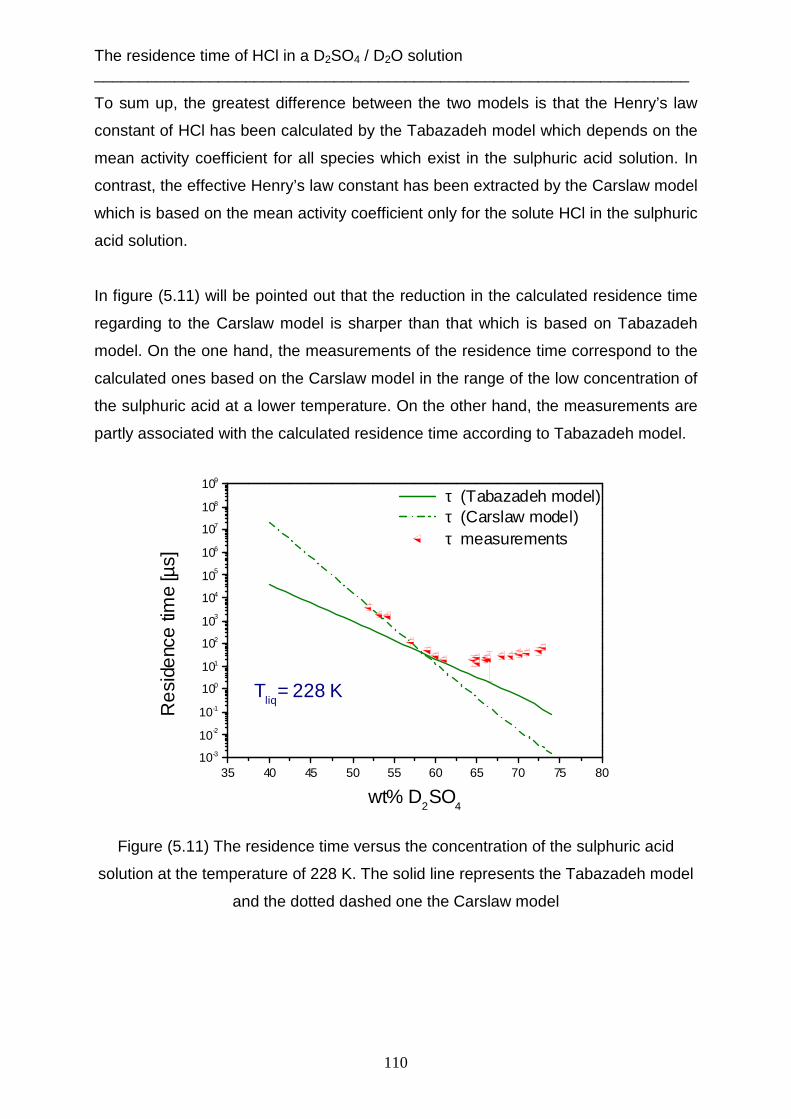
The residence time of HCl in a D2SO4 / D2O solution ___________________________________________________________________
110
35 40 45 50 55 60 65 70 75 8010-3
10-2
10-1
100
101
102
103
104
105
106
107
108
109
Tliq
= 228 K
Res
iden
ce ti
me
[µs]
wt% D2SO
4
τ (Tabazadeh model) τ (Carslaw model) τ measurements
To sum up, the greatest difference between the two models is that the Henry’s law
constant of HCl has been calculated by the Tabazadeh model which depends on the
mean activity coefficient for all species which exist in the sulphuric acid solution. In
contrast, the effective Henry’s law constant has been extracted by the Carslaw model
which is based on the mean activity coefficient only for the solute HCl in the sulphuric
acid solution.
In figure (5.11) will be pointed out that the reduction in the calculated residence time
regarding to the Carslaw model is sharper than that which is based on Tabazadeh
model. On the one hand, the measurements of the residence time correspond to the
calculated ones based on the Carslaw model in the range of the low concentration of
the sulphuric acid at a lower temperature. On the other hand, the measurements are
partly associated with the calculated residence time according to Tabazadeh model.
Figure (5.11) The residence time versus the concentration of the sulphuric acid
solution at the temperature of 228 K. The solid line represents the Tabazadeh model
and the dotted dashed one the Carslaw model
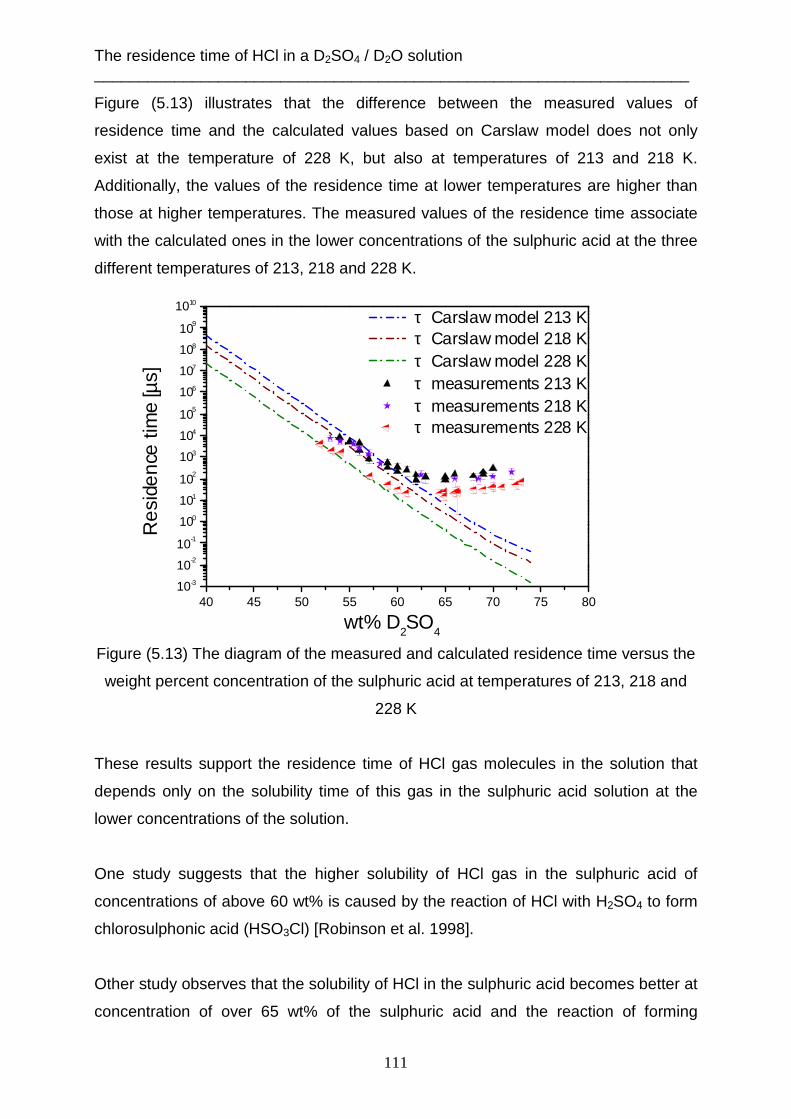
The residence time of HCl in a D2SO4 / D2O solution ___________________________________________________________________
111
40 45 50 55 60 65 70 75 8010-3
10-2
10-1
100
101
102
103
104
105
106
107
108
109
1010
Res
iden
ce ti
me
[µs]
wt% D2SO
4
τ Carslaw model 213 K τ Carslaw model 218 K τ Carslaw model 228 K τ measurements 213 K τ measurements 218 K τ measurements 228 K
Figure (5.13) illustrates that the difference between the measured values of
residence time and the calculated values based on Carslaw model does not only
exist at the temperature of 228 K, but also at temperatures of 213 and 218 K.
Additionally, the values of the residence time at lower temperatures are higher than
those at higher temperatures. The measured values of the residence time associate
with the calculated ones in the lower concentrations of the sulphuric acid at the three
different temperatures of 213, 218 and 228 K.
Figure (5.13) The diagram of the measured and calculated residence time versus the
weight percent concentration of the sulphuric acid at temperatures of 213, 218 and
228 K
These results support the residence time of HCl gas molecules in the solution that
depends only on the solubility time of this gas in the sulphuric acid solution at the
lower concentrations of the solution.
One study suggests that the higher solubility of HCl gas in the sulphuric acid of
concentrations of above 60 wt% is caused by the reaction of HCl with H2SO4 to form
chlorosulphonic acid (HSO3Cl) [Robinson et al. 1998].
Other study observes that the solubility of HCl in the sulphuric acid becomes better at
concentration of over 65 wt% of the sulphuric acid and the reaction of forming

The residence time of HCl in a D2SO4 / D2O solution ___________________________________________________________________
112
chlorosulphonic acid might be more enhanced with increasing concentration of the
sulphuric acid. Hence, the observed residence time of HCl of above 65 wt% becomes
longer than it was expected by using the molecular beam technique [Behr et al.
2000].
5.4 Theoretical analysis using the capillary wave theory
The capillary wave theory is adapted to describe the unexpected behaviour of the
solubility of HCl gas in higher concentrations of the sulphuric acid solution. In higher
concentrations it is used to estimate the solubility of HCl gas based on the transport
time of HCl into the sulphuric acid solution.
The residence time associates with the solubility coefficient of gas molecules in the
liquid (Henry’s constant), which is calculated by using the Carslaw model. This model
does not take into consideration the kinetics of the solubility at higher concentration
of the sulphuric acid. Thus the residence time of the gas molecules in the solution
accords with this model at the lower concentration of the binary solution.
In the case of the higher concentration of the sulphuric acid, the residence time
becomes longer after 65 wt%. That is caused by the decay time for the dissociation
and recombination of the solute in the liquid bulk before it desorbs from the surface.
This decay time can be computed by using the local mode capillary wave theory from
Phillips (2001 b):
The transport constant of the element into the bulk of the liquid is independent from
the surface tension. In contrast, the viscosity of the liquid affects to reduce the
transport velocity of the solute in the liquid. That is given as:
22ησTk
k Btrans = Equation (5.4.1)
Where:
transk : is the transport constant in the liquid bulk (m.s-1)
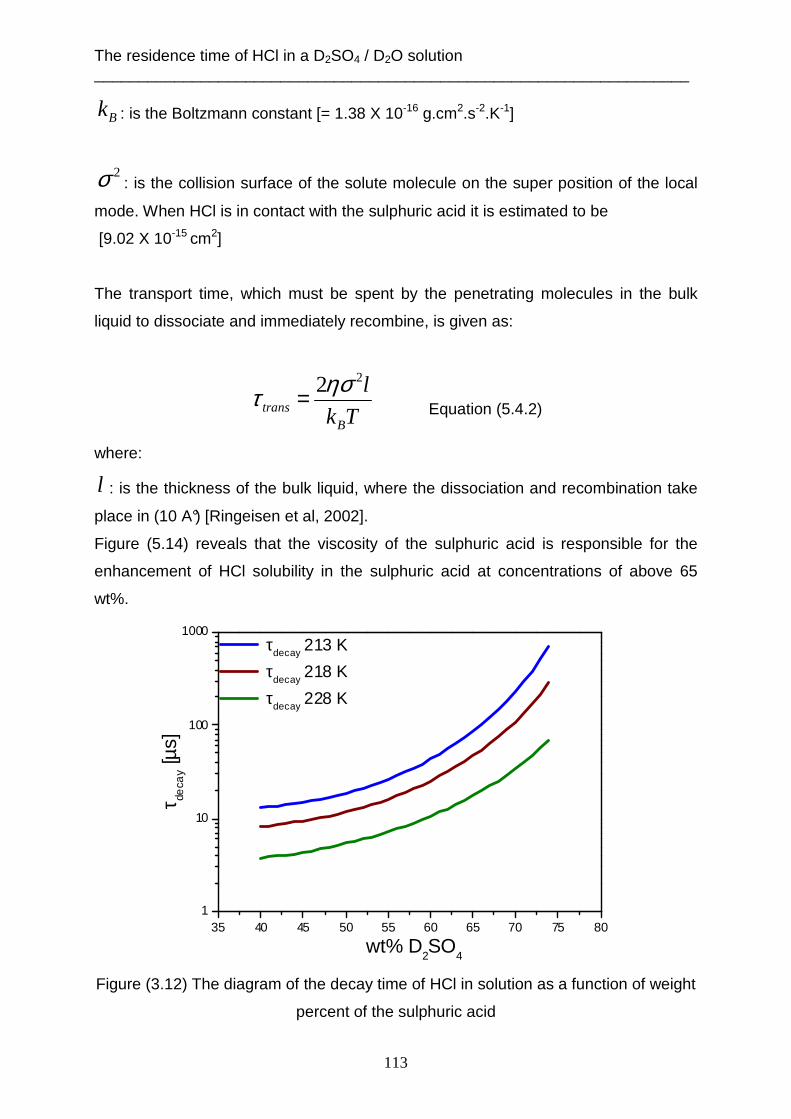
The residence time of HCl in a D2SO4 / D2O solution ___________________________________________________________________
113
35 40 45 50 55 60 65 70 75 801
10
100
1000
τ deca
y [µs
]
wt% D2SO
4
τdecay 213 K
τdecay
218 K
τdecay 228 K
Bk : is the Boltzmann constant [= 1.38 X 10⁻¹⁶ g.cm2.s-2.K-1]
2σ : is the collision surface of the solute molecule on the super position of the local
mode. When HCl is in contact with the sulphuric acid it is estimated to be
[9.02 X 10⁻¹⁵ cm2]
The transport time, which must be spent by the penetrating molecules in the bulk
liquid to dissociate and immediately recombine, is given as:
Tk
l
Btrans
22ηστ = Equation (5.4.2)
where:
l : is the thickness of the bulk liquid, where the dissociation and recombination take
place in (10 A°) [Ringeisen et al, 2002].
Figure (5.14) reveals that the viscosity of the sulphuric acid is responsible for the
enhancement of HCl solubility in the sulphuric acid at concentrations of above 65
wt%.
Figure (3.12) The diagram of the decay time of HCl in solution as a function of weight
percent of the sulphuric acid
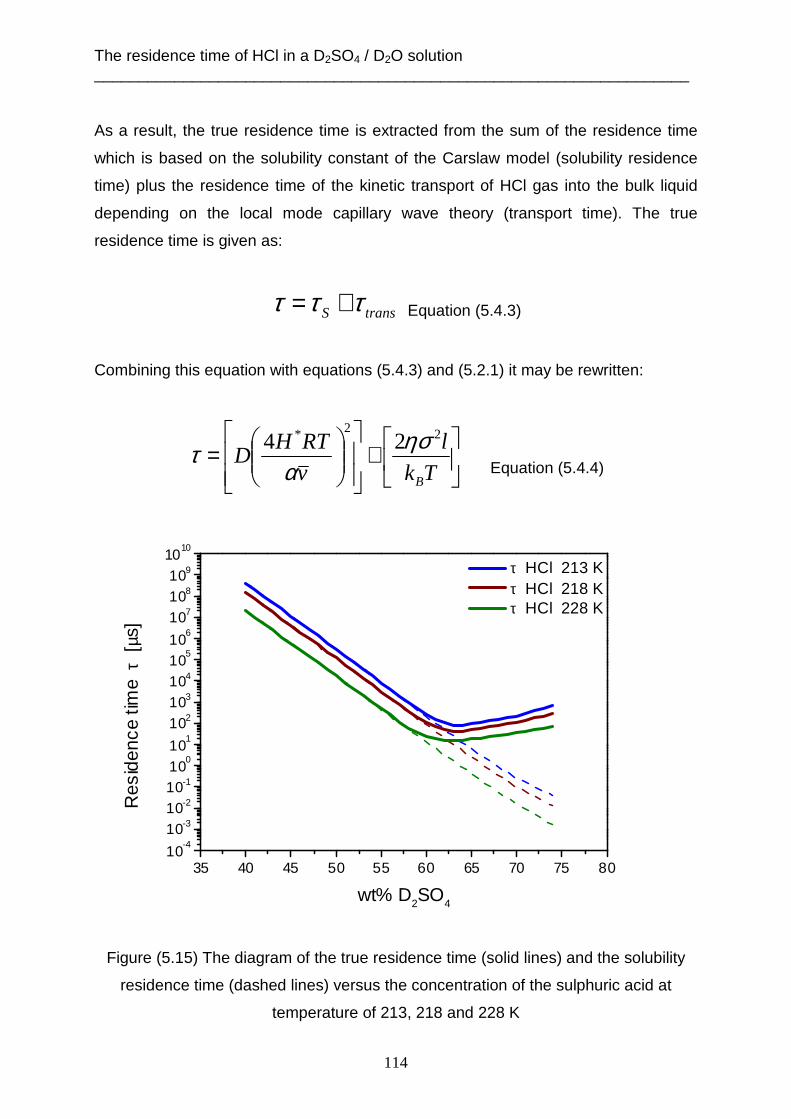
The residence time of HCl in a D2SO4 / D2O solution ___________________________________________________________________
114
35 40 45 50 55 60 65 70 75 8010
-410-310-210-110
010
1102103104
105
106
107108109
1010
Res
iden
ce ti
me
τ [
µs]
wt% D2SO4
τ HCl 213 K τ HCl 218 K τ HCl 228 K
As a result, the true residence time is extracted from the sum of the residence time
which is based on the solubility constant of the Carslaw model (solubility residence
time) plus the residence time of the kinetic transport of HCl gas into the bulk liquid
depending on the local mode capillary wave theory (transport time). The true
residence time is given as:
transS τττ += Equation (5.4.3)
Combining this equation with equations (5.4.3) and (5.2.1) it may be rewritten:
+
=
Tk
l
v
RTHD
B
22* 24 ησα
τ Equation (5.4.4)
Figure (5.15) The diagram of the true residence time (solid lines) and the solubility
residence time (dashed lines) versus the concentration of the sulphuric acid at
temperature of 213, 218 and 228 K

The residence time of HCl in a D2SO4 / D2O solution ___________________________________________________________________
115
In the case of lower concentrations of the sulphuric acid, the values of the solubility
residence time are a good deal higher than the decay time. The effect of the kinetic
transport is negligible for the true residence time. Therefore, the residence time
based on the Carslaw model corresponds with the true residence time, when the
concentration of the sulphuric acid is lower than 63 wt%.
The true residence time increases with increasing concentration of the sulphuric acid
in the field of concentrations of above 63 wt%. This depends on an effective kinetic
transport of the solute into the bulk solvent. The difference between the true
residence time and the solubility residence time increases significantly with
increasing concentration of the sulphuric acid, because the viscosity of the solution is
responsible for the slow desorption of the gas molecules from the surface. The
deviation of the true residence time from the solubility residence time becomes
obvious in figure (5.15).
The temperature plays an important role determining the residence time of the gas
molecules in the solution. The true residence time reduces with an increase in the
temperature of the sulphuric acid. This is because the residence time depends on the
Henry’s law constant of HCl as well as the viscosity of the sulphuric acid solution.
Furthermore, when the temperature increases, the Henry’s law constant of HCl falls
and the viscosity of the sulphuric acid solution decreases rapidly. Figure (5.15)
shows this behaviour of the residence time at the three different temperatures of
liquid of 213, 218 and 228K.
As explained above, the deviation between the measured and calculated values of
residence time is caused by the transport time of HCl gas molecules into the bulk of
the sulphuric acid solution at the higher concentrations. Therefore, the measured
values of the residence time accord with the calculated residence time based on the
local mode of the capillary wave theory. At the lower concentrations of the sulphuric
acid, the values of the transport time of HCl gas molecules are negligible in
comparison with the solubility residence time. By this means, the measured values of
residence time correspond with its calculated values, which are not only based on the
Carslaw model, but also on the capillary wave theory, as shown in figure (5.16).
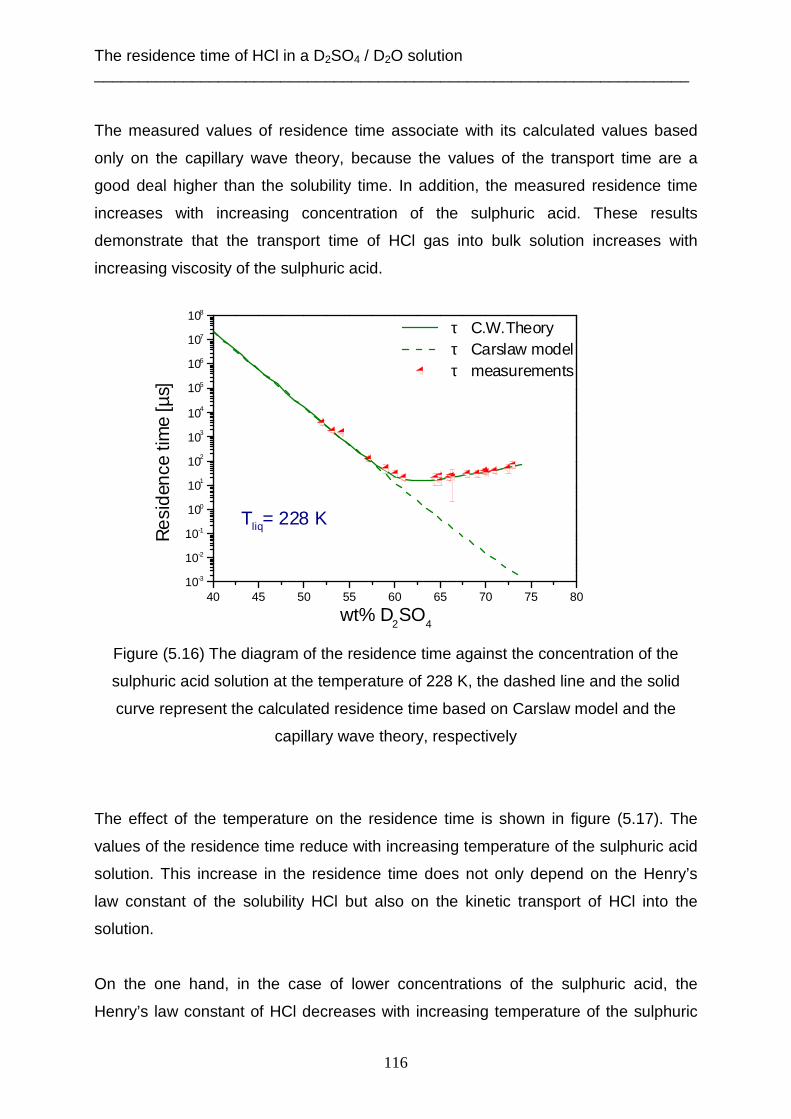
The residence time of HCl in a D2SO4 / D2O solution ___________________________________________________________________
116
40 45 50 55 60 65 70 75 8010-3
10-2
10-1
100
101
102
103
104
105
106
107
108
Res
iden
ce t
ime
[µs]
wt% D2SO
4
τ C.W.Theory τ Carslaw model τ measurements
Tliq= 228 K
The measured values of residence time associate with its calculated values based
only on the capillary wave theory, because the values of the transport time are a
good deal higher than the solubility time. In addition, the measured residence time
increases with increasing concentration of the sulphuric acid. These results
demonstrate that the transport time of HCl gas into bulk solution increases with
increasing viscosity of the sulphuric acid.
Figure (5.16) The diagram of the residence time against the concentration of the
sulphuric acid solution at the temperature of 228 K, the dashed line and the solid
curve represent the calculated residence time based on Carslaw model and the
capillary wave theory, respectively
The effect of the temperature on the residence time is shown in figure (5.17). The
values of the residence time reduce with increasing temperature of the sulphuric acid
solution. This increase in the residence time does not only depend on the Henry’s
law constant of the solubility HCl but also on the kinetic transport of HCl into the
solution.
On the one hand, in the case of lower concentrations of the sulphuric acid, the
Henry’s law constant of HCl decreases with increasing temperature of the sulphuric
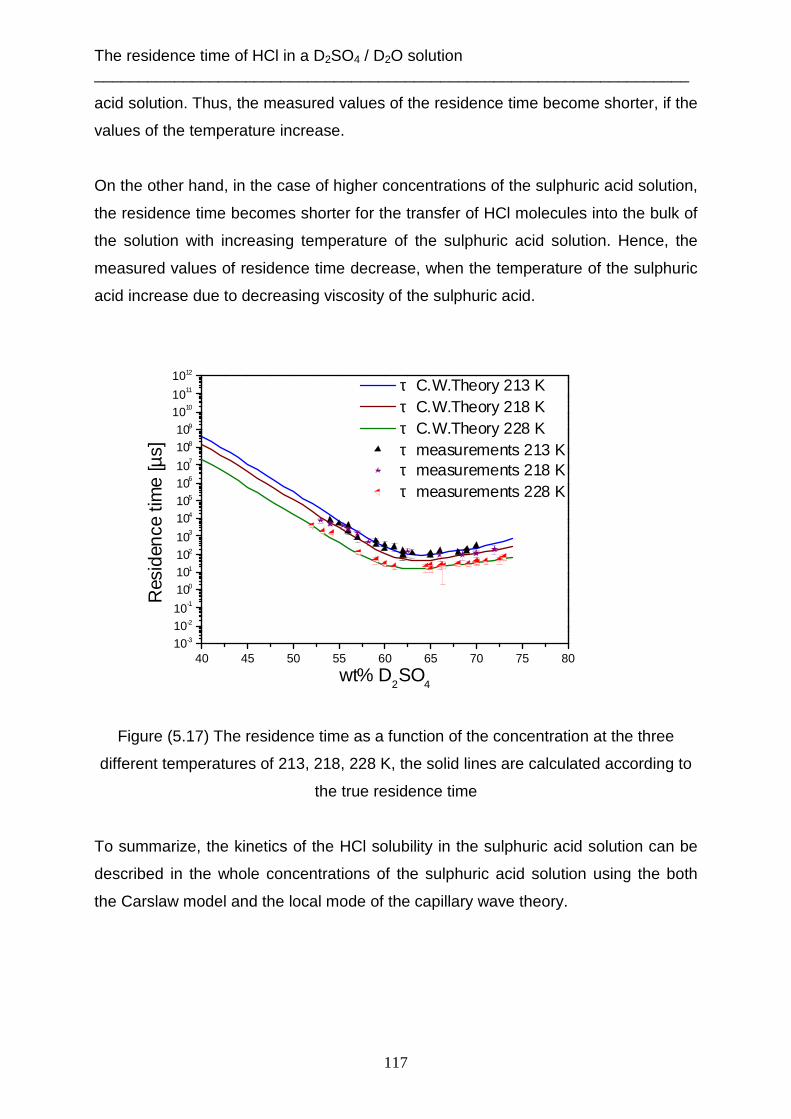
The residence time of HCl in a D2SO4 / D2O solution ___________________________________________________________________
117
40 45 50 55 60 65 70 75 8010-3
10-2
10-1
100
101
102
103
104
105
106
107
108
109
1010
1011
1012
Res
iden
ce ti
me
[µs]
wt% D2SO
4
τ C.W.Theory 213 K τ C.W.Theory 218 K τ C.W.Theory 228 K τ measurements 213 K τ measurements 218 K τ measurements 228 K
acid solution. Thus, the measured values of the residence time become shorter, if the
values of the temperature increase.
On the other hand, in the case of higher concentrations of the sulphuric acid solution,
the residence time becomes shorter for the transfer of HCl molecules into the bulk of
the solution with increasing temperature of the sulphuric acid solution. Hence, the
measured values of residence time decrease, when the temperature of the sulphuric
acid increase due to decreasing viscosity of the sulphuric acid.
Figure (5.17) The residence time as a function of the concentration at the three
different temperatures of 213, 218, 228 K, the solid lines are calculated according to
the true residence time
To summarize, the kinetics of the HCl solubility in the sulphuric acid solution can be
described in the whole concentrations of the sulphuric acid solution using the both
the Carslaw model and the local mode of the capillary wave theory.
Summary ___________________________________________________________________________
118
6. Summary
In this thesis, there are three main points that can be concluded as follows:
1. Water desorption from the surface:
The vacuum evaporation experiments are used to monitor the loss of deuterium
oxide from the surface of the liquid and the solid of deuterated sulphuric acid solution
at temperatures of 213, 218 and 228 K with different spectral angles in the range
from 0° to 65°.
The velocity distribution with the angular cosine square factor in exponent is
expressed for the velocity distribution of D2O molecules, which desorb from the liquid
surface. The angle in this factor can be calculated through the root mean slope of the
capillary wave. This root mean slope depends on the temperature of the liquid
surface. The capillary wave theory includes that the surface of the capillary wave
expands with increasing temperature of the liquid surface. Hence, when the
temperature of the liquid surface increases, the diameter of the capillary wave
becomes wider, which needs molecules to desorb from the surface of the capillary
wave. In contrast, the spectral angle and the concentration of the sulphuric acid
solution have no effect on the slope of the capillary wave. This velocity distribution is
named as non-Maxwell-Boltzmann velocity distribution. In the case of the solid
surface, the velocity distribution of the desorbing D2O molecules associates with the
Maxwell-Boltzmann velocity distribution. Besides, the spectral angle has also no
effect on the energy distribution.
However, the intensity of Maxwellian and non Maxwellian velocity distribution
depends on the concentration of the sulphuric acid solution and spectral angle. This
intensity of velocity distribution decreases with increasing concentration of the
sulphuric acid solution. This reduction associates with the number of D2O molecules
on the surface of the solution. Moreover, the reduction in intensity of the velocity
distribution is as a function of the angular cosine of the spectral angle (cos Ф).
Summary ___________________________________________________________________________
119
2. The mass accommodation coefficient:
The molecular beam techniques are used to investigate the proton exchange function
of HCl gas in collision with the bare deuterated sulphuric acid solution at
temperatures of 213, 218 and 228 K in the range of concentrations of between
(52- 74 wt %).
This proton exchange function is measured through the comparison of the DCl post-
chopper TOF spectrum with the HCl post- chopper TOF spectrum. The value of the
( DH → ) exchange is equal to the mass accommodation coefficient, which can be
determined by the solvation rate of the HCl gas molecule into the liquid phase of the
sulphuric acid solution as well as the desorption rate of HCl from the liquid surface of
solution.
In the case of constant temperature, the mass accommodation coefficient of HCl
decreases as the concentration of the sulphuric acid solution increases. This
behaviour depends on the increase in the viscosity of the sulphuric acid solution. The
solvation rate constant decreases with increasing concentration of the D2SO4 / D2O
solution.
In the case of concentrations of between (50- 64 wt %), the measured values of
accommodation coefficient increases with decreasing temperature of the sulphuric
acid solution. In addition to that, the values of the desorption rate are lower than the
values of solvation rate. Further, the kinetics of HCl molecules to dissolve in the
sulphuric acid solution is faster than the kinetics of desorption from the liquid surface.
As a result, the proton exchange fraction decreases as the temperature of the D2SO4
solution increases at the same concentration, because the desorption rate is stronger
influenced by temperature than the solvation rate constant.
On the other hand, in the case of concentrations of between (67- 75 wt %), it is found
that the proton exchange fraction becomes higher with increasing temperature of the
sulphuric acid solution at constant concentration of the D2SO4 / D2O solution. In
addition, the viscosity of the sulphuric acid solution decreases as the temperature of
Summary ___________________________________________________________________________
120
the sulphuric acid solution increases. The solvation rate constant is stronger
influenced by temperature than the desorption rate. Therefore, the mass
accommodation coefficient of HCl decreases with falling temperature of the sulphuric
acid solution.
3. The residence time of HCl:
Time- of- flight molecular beam scattering techniques are used to explore the
residence time of HCl- molecules, which collide with the binary sulphuric acid water
solution. The experiments are carried out in a concentration range from 52 to 75 wt%
at temperatures of 213, 218 and 228 K. The residence time of HCl is recorded
through the comparison of the DCl pre- chopper TOF spectrum with the DCl post-
chopper TOF spectrum after the time off set is corrected.
In the case of concentration of (52- 63 wt %), the residence time of the HCl
molecules in the solution decreases as the concentration of the sulphuric acid
solution increases. The reduction in the residence time accords with the calculated
residence time based on the Carslaw model. The residence time depends on the
Henry’s law constant of HCl gas molecules in the solution (the solubility of gas
molecules).
In the case of concentration of (63- 75 wt %), the residence time of HCl increases
with increasing concentration of the sulphuric acid solution. The residence time
corresponds with the time constant of the transfer HCl molecules in the solution of
the sulphuric acid. The effect of the HCl solubility is negligible in the residence time.
In contrast, this characteristic residence time corresponds with the transport of HCl
molecules in the solution. The velocity of transport HCl molecules becomes slower
with increasing viscosity of the sulphuric acid solution.
However, the residence time of HCl gas molecules reduces, when the temperature of
solution increases, because the Henry’s law constant of the HCl solubility and the
transport of HCl in the sulphuric acid decreases with increasing temperature of a
D2SO4 /D2O solution.
References ___________________________________________________________________________
121
7. References
Aarts D. G. A. L., M. Schmidt, H. N. W. Lekkerkerker, Direct visual observation of
thermal capillary wave, Science, 304, 847- 850, 2004.
Abbatt J. P. D., M. J. Molina, The heterogeneous reaction of HOCl +HCl Cl2 +
H2O on ice and nitric acid trihydrate: reaction probability and stratospheric
implications, Geo. Res. Lett., 19, 461- 464, 1992.
Anderson P. U., M. B. Nagard, J. B. C. Pettersson, Molecular beam studies of HCl
interactions with pure and HCl covered ice surface, J. Phys. Chem., 104, 1596- 1601,
2000.
Ardura D., D. J. Donaldson, Where does acid hydrolysis take place?, Phys. Chem.
Chem. Phys., 11, 857- 863, 2009.
Bar-Nun A., T. Owen, Astrophysics Space, Sci.-Libr., 227, 353, 1998.
Baron P. A., K. Willeke, Aerosol measurement principles, techniques, and
applications, John Wiley and Sons, p. 91, 2001.
Behr P., J. R. Morris, M. D. Antman, B. R. Ringeisen, J. R. Splan, G. M. Nathanson,
Reaction and desorption of HCl and HBr following collisions with supercooled
sulphuric acid, Geo. Res. Lett., 28, 1961- 1964, 2001.
Behr P., U. Scharfenort, K. Ataya, R. Zellner, Dynamic and mass accommodation of
HCl molecules on surface acid- water surfaces, Phys. Chem. Chem. Phys., 11, 1- 8,
2009.
Behr P., U. Scharfenort, R. Zellner, Collision of nobel gases with supercooled
sulphuric acid- water solution, Phys. Chem. Chem. Phys., 11, 7292- 7302, 2009 a.

References ___________________________________________________________________________
122
Bianco R., J. T. Hynes, Heterogeneous reactions important in atmospheric ozone
depletion: a theoretical perspective, Acc. Chem. Res., 39, 159-165, 2006.
Brastad S. M., G. M. Nathanson, Molecular beam studies of HCl dissolution and
dissociation in cold salty water, Phys. Chem. Chem. Phys., DOI: 10.1039/
C0cp02540b, 2011.
Brimblecombe P., S. L. Clegg, The solubility and behaviour of acid gases in the
marine aerosols, J. Atoms. Chem., 7, 1- 18, 1998.
Brown R. L., Tubular Flow reactors with first order kinetics, J. Res. Natl. Bur. Stand,
83, 1- 8, 1978.
Burden D.K., A. M. Johnson, G. M. Nathanson, HCl uptake through films of pentanoic
acid and pentanoic acid/ hexanol mixtures at the surface of sulphuric acid, J. Phys.
Chem., 113, 14131- 14140, 2009.
Calz F., F. Fenter, K. D. Tabor, M. J. Rossi, I. Paper, Design and construction of a
Knudsen- cell reactor for the study of heterogeneous reactions over the temperature
range 130- 750 K, Performances and limitations, Rev. Sci. Instrum., 68, 3172- 3179,
1997.
Carslaw K. S., S. L. Clegg, P. Brimblecombe, A thermodynamic model of the System
HCl- HNO3- H2SO4- H2O, Including solubilities of HBr, from fewer 200 to 328 K, J.
Phys. Chem., 99, 11557- 11574, 1995.
Cheng S., J. B. Lechman, S. J. Plimpton, G. S. Grest, Evaporation of Lennard- Jones
fluids, arXiv: 1101.5349v2 [cond- mat.soft], 2011.
Dankwerts P. V., Gas- Liquid Reactions, Mc Graw- Hill, New York, 30- 69, 1970.
Davidovits P., J. H. Hu, D. R. Worsnop, M. S. Zahniser, C. E. Kolb, Entry of gas
molecules into liquids, Faraday Discuss., 100, 65- 82, 1995.

References ___________________________________________________________________________
123
Davidovits P., C. E. Kolb, L. R. Williams, J. T. Jayne, D. R. Worsnop, Mass
accommodation and chemical reactions at Gas- Liquid interfaces, Chem. Rev., 106,
1323- 1354, 2006.
De More W. B., Tests of stratospheric models: The reactions of atomic chlorine with
O3 and CH4 at low temperature, J. Geo phys. Res, 96, 4995- 5000, 1991.
Deshler T., D. J. Hoffmann, B. J. Johnson, W. R. Rozier, Balloonborne
measurements of Pinatubo aerosol size distribution and volatility at Laramie,
Wyoming during the summer of 1991, Geophys. Res. Lett., 19, 199-202, 1992.
Donaldson D. J., A. R. Ravishankara, D. R. Hanson, Detailed study of HOCl + HCl
Cl2 + H2O in sulphuric acid, J. Phys. Chem., 101, 4717- 4725, 1997.
EIAM, internet web site inorganic composition (HCl, HBr, HF) in solution model 2 and
3.
Eizenberg D., W. Kauzmann, The structure and prosperities of water, Oxford
University press, New York, 1969.
Faubel M., S. Schlemmer, J. P. Toennies, A molecular beam study of the
evaporation of water from a liquid jet, Z. Phys. D- Atoms, Molecules and Cluster, 10,
269- 277, 1988.
Fowler R., G. A. Guggenheim, Statistical thermodynamics, Cambridge press,
Cambridge, 124, 1965.
Giauque W. F., E. W. Hornung, J. E. Kunzler and T. R. Rubin, The thermodynamic
properties of aqueous sulphuric acid solution and hydrates from 15 to 300 K, Vol. 82,
62- 70, 1960.
References ___________________________________________________________________________
124
Hanson D. R., R. A. Ravishankara, Heterogeneous chemistry of Bromine species in
sulphuric acid under stratospheric conditions, Geo phys. Res. Lett., 22, 385- 388,
1995.
Hanson D. R., E. R. Lovejoy, Heterogeneous reactions in liquid sulfuric acid: HOCl +
HCl as a model system, J. Phys. Chem., 100, 6397-6405, 1996.
Hobbs P. V., Ice physics, Clarendon press, Oxford, 1974.
Hurlbut F. C., D. E. Beck, U. C. Eng. Proj. Report No. HE-150-166, University of
California, 1959.
Isakson M.J., G. O. Sitz, Adsorption of HCl on ice, J. Phys. Chem., 103, 2044- 2049,
1999.
King M. E., G. M. Nathanson, M. A. Hanning-Lee, T. K. Minton, Probing the
microscopic corrugation of liquid surface with gas-liquid collision, J. American Phys.
Soc., 70, 1026- 1029, 1993.
Klassen J. K., Z. Hu, L. R. Williams, Diffusion coefficient for HCl and HBr in 30 wt% to
72 wt% sulphuric acid at temperatures between 220 and 300 K, J. Geo phys. Res.,
103, 16197- 16202, 1998.
Knox C. J. H., L. F. Phillips, Maxwell versus Non- Maxwell velocity distributions for
molecules emitted from a liquid surface, J. Phys. Chem., 102, 10515- 10520, 1998.
Kolb C. E., R. A. Cox, J. P. D. Abbatt, M. Ammann, E. J. Davis, D. J. Donaldson, B.
C. Garrett, C. George, P.T. Griffiths, D. R. Hanson, M. Kulmala, G. McFiggans, U.
Pöschl, I. Riipinen, M. J. Rossi, Y. Rudich, P. E.Wagner, P. M. Winkler, D. R.
Worsnop, and C. D. O’ Dowd, An overview of current issues in the uptake of
atmospheric trace gases by aerosols and clouds, atmos. Chem. Phys.,10,10561-
10605, 2010.

References ___________________________________________________________________________
125
Mora S., J. Daillant, K. Mecke, D. Luzet, A. Braslau, M. Alba, B. Struth, X- ray
synchrotron study of liquid- vapour interface at short length scales: effect of long-
range forces and bending energies, Phys. Rev. Lett., 90, 216101/1- 216101/4, 2003.
Morris J.R., P. Behr, M. D. Antman, B. R. Ringeisen, J. Splan, G. M. Nathanson,
molecular beam scattering from supercooled sulphuric acid: collisions of HCl, HBr
and HNO3 with 70 wt% D2SO4, J. Phys. Chem., 104, 6738- 6751, 2000.
Myhre C. E. L., C. J. Nielsen, O. W. Saastad, Density and surface tension of
aqueous H2SO4 at low temperature, J. Chem. Eng. Data, 43, 617- 622, 1998.
Nagayama G., T. Tsuruta, A general expression for the condensation coefficient
based on transition state theory and molecular dynamics simulation, J. Chem. Phys.,
118, 1392- 1399, 2003.
Nathanson G. M., P. Davidovits, D. R. Worsnop, C. E. Kolb, Dynamics and kinetics at
the Gas- Liquid interface, J. Phys. Chem., 100, 13007- 13020, 1996.
Nathanson G. M., Molecular Beam Studies of Gas- Liquid Interface, Annu. Rev.
Phys. Chem., 55, 231- 255, 2004.
Packwood D. M., L. F. Phillips, A stochastic local mode treatment of high- energy
gas- liquid collisions, J. Phys. Chem., 113, 7647- 7653, 2009.
Phillips L. F., Velocity and angular distributions and evaporation at the surface of a
drop, Chem. Phys. Lett., 266, 161- 168, 1997.
Phillips L. F., Capillary wave, slope correlations, and evaporation at the surface of a
drop, Chem. Phys. Lett., 320, 398- 404, 2000.
Phillips L. F., Local Modes and surface- bulk exchange rate at a liquid interface, J.
Phys. Chem., 105, 1041- 1046, 2001a.
References ___________________________________________________________________________
126
Phillips L. F., Gaussian modes of liquid interface, J. Phys. Chem., 105, 11283-
11289, 2001b.
Phillips L. F., A molecular- scale model for the coupling of heat and matter fluxes at a
gas- liquid interface, J. Phys. Chem., 107, 9059- 9062, 2003.
Phillips L. F., A geometrical explanation for the enhanced small- scale roughness of a
liquid surface, J. Phys. Chem., 108, 1986- 1991, 2004a.
Phillips L. F., Surfing the Nanowaves: progress in understanding the Gas- Liquid
interface, Acc. Chem. Res., 37, 982- 988, 2004b.
Phillips L. F., Capillary- wave model for evaporation of a liquid, Chemical Phys. Lett.,
407, 249- 253, 2005.
Pollack G. L., Why gases dissolve in liquids, Science, Vol. 251, 1323- 1330, 1991.
Rabinson GH, D. R. Worsnop, T. J. Jayre, C. E. Kolb, E. Swartz, P. Davidovits,
Heterogeneous uptake of HCl by sulphuric acid solution, J. Geo phys. Res, 103,
25371- 25381, 1998.
Rahimi P., C. A. Ward, Kinetic of evaporation: statistical rate theory approach, Int. J.
of Thermo., Vol. 8, 1- 14, 2005.
Reid J. P., R. M. Sayer, Heterogeneous atmospheric aerosol chemistry: laboratory
studies of chemistry on water droplets, Chem. Soc. Rev., 32, 70- 79, 2003.
Ringeisen B. R., PhD Thesis, collisions and reactions of HCl and HBr with liquid
glycerol, University of Wisconson, 2000.
Ringeisen B. R., A. H. Muenter, G. M. Nathanson, collisions of DCl with liquid
Glycerol: evidence for rapid, near- interface D H exchange and desorption, J.
Phys. Chem., 106, 4999- 5010, 2002.
References ___________________________________________________________________________
127
Ronk W. R., D. V. Kowalski, M. Manning, G. M. Nathanson, Inert gas scattering from
molten metals: probing the stiffness and roughness oft he surfaces of atomic liquids,
J. Chem. Phys., 104, 4842-4848, 1996.
Sabinina L., L. Terpugow, Surface tension of the sulphuric acid- water system, Z.
Phys. Chem., A173, 237- 241, 1935.
Sadtchenko V., K. Knutsen, C. F. Giese, W. R. Gentry, Interactions of CCl4 with thin
D2O amorphous ice films, Part I: a nanoscale probe of ice morphology, J. Phys.
Chem., 104, 2511-2521, 2000a.
Sadtchenko V., C. F. Giese, W. R. Gentry, Interaction of hydrogen chloride with thin
ice films: the effect of ice morphology and evidence for unique surface species on
crystalline vapor-deposited ice, J. Phys. Chem., 104, 9421-9429, 2000b.
Saecker M. E., G. M. Nathanson, Collisions of protic and aprotic gases with hydrogen
bonding and hydrocarbon liquids, J. Chem. Phys., 99, 7056- 7075, 1993.
Samuel G. V., S. Park, G. M. Nathanson, Evaporation of water and uptake of HCl
and HBr through Hexanol films at the surface of supercooled sulphuric acid, J. Phys.
Chem., 110, 7593- 7601, 2006.
Scharfenort U., PhD Thesis, Atom- /Molekülstrahlen und ihre Interaktion mit
Schwefelsäuregrenzflächen unter stratosphärischen Temperaturbedingungen,
university Essen Duisburg, 2007.
Scharge R. W., A theoretical study of inter phase mass transfer, Columbia University
press, New York, Ch. 3, 1953.
Schwell M., H. Baumgärtel, I. Weidinger, B. Krämer, H. Vortisch, L. Wöste, T.
Leisner, E. Rühl, Uptake dynamics and diffusion of HCl in sulphuric acid solution
measured in single levitated micro droplets, J. Phys. Chem., 104, 6726- 6732, 2000.
References ___________________________________________________________________________
128
Scoles G., D. Bassi, U. Buck, D. Laine, Atomic and molecular beam methods, Oxford
University press, New York, Vol. 1, 189, 366, 1988.
Smith J. D., C. D. Cappa, W. S. Drisdell, R. C. Cohen, R. J. Saykally, Raman
thermometry measurements of free evaporation from liquid water droplets, J. AM.
CHEM. SOC., 128, 12892- 12898, 2006.
Tabazadeh A., R. P. Turco, M. Z. Jacobson, A model for studying the composition
and chemical effects of stratospheric aerosol, J. Geo phys. Res.,99, 12897- 12914,
1994.
Tabazadeh A., O. B. Toon, S. L. Clegg, P. Hamill, A new parameterization of H2SO4/
H2O aerosol composition: Atmospheric implications, Geo. Res. Lett., 24, 1931- 1934,
1997.
Tabazadeh A., S. T. Martin, J. Lin, The effect of particle size and nitric acid uptake on
the homogeneous freezing of aqueous sulphuric acid particles, 27, 1111- 1114,
2000.
Tolbert M. A., M. J. Rossi, R. Malhotra, D. M. Golden, Reaction of chlorine nitrate
with hydrogen chloride and water at Antarctic stratospheric temperatures, Science,
238, 1258- 1260, 1987.
Ward C. A., G. Fang, Expression for predicting liquid evaporation flux: Statistical rate
theory approach, Amer. Phys. Society, Vol. 59, 429- 440, 1999.
Ward C. A., F. Duan, Turbulent transition of thermo capillary flow induced by water
evaporation, Phys. Rev. E., Vol. 69, 056308- 1, 2004.
Waschewsky G. C. G., J. P. D. Abbatt, HOBr in sulphuric acid solution: solubility and
reaction with HCl as a function of temperature and concentration, J. Phys. Chem.,
103, 5312- 5320, 1999.
References ___________________________________________________________________________
129
Williams L. R., F. S. Long, Viscosity of supercooled sulphuric acid solution, J. Phys.
Chem., 99, 3748- 3751, 1995.
Worsnop D.R., M. S. Zahniser, C. E. Kolb, J. A. Gardner, L. R. Waston, J. M. Van
Doren, J. T. Jayne, P. Davidovits, Temperature dependence of mass accommodation
of sulphuric dioxide and hydrogen peroxide on aqueous surfaces, J. Phys. Chem.,
93, 1159- 1172, 1989.
Zhang R., M. T. Leu, L. F. Keyser, Heterogeneous reactions of ClONO2, HCl and
HOCl on liquid sulfuric acid surfaces, J. Phys. Chem., 98, 13563-13574, 1994.


![Sulphuric Acid Data[1]](https://img.dokumen.tips/doc/110x75/577d23741a28ab4e1e99d41e/sulphuric-acid-data1.jpg)
