Embed Size (px)
Citation preview

1
SANDIA REPORT
SAND2007-0601 Unlimited Release Printed February 2007 Supercomputer and Cluster Performance Modeling and Analysis Efforts: 2004-2006 Jim Ang, Daniel Barnette, Bob Benner, Sue Goudy, Bob Malins, Mahesh Rajan, Courtenay Vaughan, Amalia Black, Doug Doerfler, Stefan Domino, Brian Franke, Anand Ganti, Tom Laub, Rob Leland, Hal Meyer, Ryan Scott, Joel Stevenson, Judy Sturtevant, and Mark Taylor Prepared by Sandia National Laboratories Albuquerque, New Mexico 87185 and Livermore, California 94550 Sandia is a multiprogram laboratory operated by Sandia Corporation, a Lockheed Martin Company, for the United States Department of Energy’s National Nuclear Security Administration under Contract DE-AC04-94AL85000. Approved for public release; further dissemination unlimited.

2
Issued by Sandia National Laboratories, operated for the United States Department of Energy by Sandia Corporation. NOTICE: This report was prepared as an account of work sponsored by an agency of the United States Government. Neither the United States Government, nor any agency thereof, nor any of their employees, nor any of their contractors, subcontractors, or their employees, make any warranty, express or implied, or assume any legal liability or responsibility for the accuracy, completeness, or usefulness of any information, apparatus, product, or process disclosed, or represent that its use would not infringe privately owned rights. Reference herein to any specific commercial product, process, or service by trade name, trademark, manufacturer, or otherwise, does not necessarily constitute or imply its endorsement, recommendation, or favoring by the United States Government, any agency thereof, or any of their contractors or subcontractors. The views and opinions expressed herein do not necessarily state or reflect those of the United States Government, any agency thereof, or any of their contractors. Printed in the United States of America. This report has been reproduced directly from the best available copy. Available to DOE and DOE contractors from
U.S. Department of Energy Office of Scientific and Technical Information P.O. Box 62 Oak Ridge, TN 37831 Telephone: (865)576-8401 Facsimile: (865)576-5728 E-Mail: [email protected] Online ordering: http://www.osti.gov/bridge
Available to the public from
U.S. Department of Commerce National Technical Information Service 5285 Port Royal Rd Springfield, VA 22161 Telephone: (800)553-6847 Facsimile: (703)605-6900 E-Mail: [email protected] Online order: http://www.ntis.gov/help/ordermethods.asp?loc=7-4-0#online

3
SAND2007-0601 Unlimited Release
Printed February 2007
Supercomputer and Cluster Performance Modeling and Analysis Efforts: 2004-2006*
Jim Ang Daniel Barnette Bob Benner Doug Doerfler Sue Goudy (currently in Org. 5417) Ryan Scott Courtenay Vaughan Scalable Systems Integration (1422) Brian Franke Tom Laub Radiation Transport (1341) Mark Taylor Exploratory Simulation Tech. (1433) Bob Malins ASCI Program (1904)
Hal Meyer Mahesh Rajan Joel Stevenson Judy Sturtevant Scientific Apps & User Support (4326) Stefan Domino Thermal/Fluid Computational Engineering Sciences (1541) Amalia Black V&UQ Processes (1544) Anand Ganti Advanced Networking Integration (4336)
BOLD: Core ‘Performance Modeling and Analysis Team’ (PMAT) members
Sandia National Laboratories PO Box 5800
Albuquerque, NM 87185-1319
Abstract
This report describes efforts by the Performance Modeling and Analysis Team to investigate performance characteristics of Sandia’s engineering and scientific applications on the ASC capability and advanced architecture supercomputers, and Sandia’s capacity Linux clusters. Efforts to model various aspects of these computers are also discussed. The goals of these efforts are to quantify and compare Sandia’s supercomputer and cluster performance characteristics; to reveal strengths and weaknesses in such systems; and to predict performance characteristics of, and provide guidelines for, future acquisitions and follow-on systems. Described herein are the results obtained from running benchmarks and applications to extract performance characteristics and comparisons, as well as modeling efforts, obtained during the time period 2004-2006. The format of the report, with hypertext links to numerous additional documents, purposefully minimizes the document size needed to disseminate the extensive results from our research. Electronic version with navigational hyperlinks available at: http://www.sandia.gov/CSRF_report_2007/Report/csrf_pmat_report_SAND2007-0601.pdf
4
Acknowledgments
Funding for these efforts was provided by Sandia’s Computer Science Research Foundation (CSRF). The Foundation invests in a portfolio of R&D activities in Computer and Computational Science. As opposed to the activities in other ASC program elements, which focus on capability development and deployment, the work of the CSRF focuses on more basic research and feasibility assessments. The current CSRF portfolio includes four large research projects in the following areas: simulation capabilities, next-generation systems, information sciences, and disruptive technologies. The primary purpose of the CSRF is to maintain a fundamental research capability in computer science, computational science, algorithms and enabling technologies in support of ASC's modeling and simulations. This capability is embodied by the staff at Sandia National Laboratories who perform this research and is delivered through solutions to ASC problems and peer-reviewed publications.
The Performance Modeling and Analysis Team, collectively, would like to thank Rob Leland for being the catalyst for the formation of PMAT.
The team also acknowledges the numerous application developers, algorithm/solver developers, systems technology developers, and production computing support people, both within SNL and at LLNL/LANL, with which the team has worked with and co-authored papers.

5
Table of Contents
Abstract................................................................................................................................................................................ 3
Acknowledgments............................................................................................................................................................... 4
Table of Contents ................................................................................................................................................................ 5
1. Introduction...................................................................................................................................................................... 7
2. JASONs Review Support ............................................................................................................................................... 9
3. Janus Jumbo Simulation ............................................................................................................................................... 11
4. Requirements to Move to a Petaflop Platform: ASC Level I Milestone Support...................................................... 13
5. Quick-Look Study of Opteron Single vs. Dual Core Performance ............................................................................ 15
6. Red Storm Scaling Studies ........................................................................................................................................... 18
7. Performance Analysis of the OVERFLOW Computational Fluid Dynamics Code ................................................. 21
8. Performance Analysis and Modeling of Sandia’s Integrated TIGER Series (ITS) Coupled Electron/Photon Monte Carlo Transport Code.................................................................................................................................... 23
9. CTH Analytical and Hybrid Modeling ........................................................................................................................ 25
10. Run-Time Performance Model for Sandia’s Hydrodynamics Code CTH.............................................................. 26
11. Investigations on Scaling Performance of SIERRA/Fuego ...................................................................................... 28
12. A Probabilistic Model for Impact of OS Noise on Bulk-Synchronous Parallel Applications................................. 31
13. Performance Modeling using Queue Theoretic Methods ......................................................................................... 33
14. External Collaborations: Outreach to DoD Performance Improvement Efforts...................................................... 35
15. Database Management System Development ........................................................................................................... 38
16. Future Analyses, Plans, and Approaches................................................................................................................... 40
17. PMAT Presentations and Publications by Author..................................................................................................... 41
18. References ................................................................................................................................................................... 43
Appendix - Computer Descriptions.................................................................................................................................. 46
Internal Distribution .......................................................................................................................................................... 47

6
[This page intentionally blank.]

7
Supercomputer and Cluster Performance Modeling and Analysis Efforts: 2004-2006
1. Introduction
James A. Ang Department Manager, 1422
Sandia National Laboratories' Performance Modeling and Analysis Team, abbreviated as PMAT, was established by Computer Science Research Foundations (CSRF) with a charter to develop a strategic capability to analyze application performance. In addition, PMAT was chartered to develop a quantitative understanding of the scalability limits of our application portfolio on the range of our available ASC and Sandia computational resources. This modeling effort provides a foundation to understand and improve application performance on current and future compute systems. PMAT activities were leveraged with funding from the ASC Computing Systems and Software Environments (CSSE), System Software and Tools, to include performance measurement, analysis, identification of unexpected bottlenecks, and bottleneck resolution for optimizing performance of current large-scale machines for applications of interest to Sandia and the ASC program.
Where possible, performance data is collected by running a workload of well-characterized applications and test
problems on existing large-scale systems. This workload consists of realistic full-scale applications and benchmarks from the Tri-Lab community and beyond, with an emphasis on SNL’s applications. The machines under consideration are all platforms of interest to the ASC program: capacity, capability, and advanced architecture systems.
Application models are developed to provide an understanding of application performance bottlenecks and make
projections for application performance on candidate advanced architecture designs. These application performance models can also offer insight into performance issues, provide quantitative answers to the “why” questions related to application scaling performance limits, and provide the ability to investigate “what if” scenarios that examine the impact on performance from various changes in the application or system.
Over the three year duration of this CSRF project, the PMAT team had several objectives: 1. Determine “baseline” performance on existing systems and build quantitative models towards a predictive
capability of performance on large-scale machines.
2. Explore the root causes when predicted performance is not achieved, and suggest, and in many cases implement, changes in the system to optimize performance.
3. Provide guidance on the optimum mapping of the ASC computational workload to the portfolio of ASC computational resources.
4. Document procedures, analyses, and results through publications in appropriate scientific venues and through technical reports on timely topics.
5. Guide decisions within ASC related to various strategies contemplated by the program, including the ASC Platform Strategy and Advanced Architectures.
6. Support Sandia’s response to ASC Programmatic priorities, including quantitative data on application and system scalability for JASONs, NAS, and Petascale Milestone studies.

8
In particular, this report documents the various projects undertaken, and results obtained, by the PMAT team for FY2004-2006. Focus areas for future efforts are also discussed.
Several applications were used to analyze performance characteristics and comparisons between machines. Some
applications were written at Sandia. Some were pulled in from other institutions due to their acceptance among the ASC and broader high performance computing community as useful application performance benchmarks. Details of the performance analyses follow for each application and programmatic task that the PMAT team supported.
The focus of this research is scalability of current and future applications and systems (both MPP and clusters) to
thousands of processors and beyond for optimal performance in both capability and capacity usage models. This may be broadly classified into three major focus areas:
1. Performance modeling of selected Sandia codes
2. Application scaling studies to support Sandia HPC architectural decisions
3. Identifying, implementing or creating recommendations for code teams and performance improvements in codes, algorithms, OS, and libraries.
The core PMAT team focused on this effort has achieved significant results in each of the three objectives.
Noteworthy accomplishments include:
1. Sandia applications and system characterization in support of FY03 JASONs review of the ASC computing strategy.
2. Executed Janus jumbo mode runs, to acquire evidence in support of both Sandia’s HPC decisions, and future architectural plans (presented at the 2005 ASC PI meeting). The data collected was used by Sandia senior management in DOE briefings for PetaFlops Level 1 milestone.
3. FY06, FY07 Red Storm scaling studies establishing the superior performance of Red Storm in comparison to ‘best-in-class’ systems like ASC Purple and BlueGene/L. The scaling studies in addition to identifying optimal usage metrics of several key Sandia NW problems, directly contributed to the success of capability class simulations and establishing Sandia’s need for large capability systems.
4. Successfully developed a performance model for Sandia’s Monte Carlo Radiation Transport code, ITS, (presented at the 2005 LACSI meeting) and improved its performance through algorithmic modifications in collaboration with the ITS code team.
5. Successfully developed preliminary performance model for Sandia’s hydrodynamics code, CTH. (presented at the Cray User Group meeting, 2006)
6. Worked with the code developers and users of Sandia’s weapon-in-a-fire multi-physics analysis code SIERRA/Fuego, analyzing scalability to thousands of processors. Application and solver teams have used the findings to research ML solver, I/O, and, mesh transfer enhancements to the code (presented at the Cray User Group meeting, 2006)
7. Developed a probabilistic model to predict impact of OS noise on applications. Work is in progress to collect data to validate the model (Ganti, Rajan paper)
8. Researched queue theoretic probabilistic model to predict performance under contention for I/O, network, and memory services. (Ganti presentation).

9
ASCI Red v. Cplant
0.00
0.50
1.00
1.50
2.00
2.50
3.00
0.0 0.1 0.2 0.3 0.4 0.5 0.6 0.7 0.8 0.9 1.0f = comm_time/calc_time
(on ref. machine)
Para
llel E
ffici
ency
(& ra
tio)
Efficiency RatioASCI RedCplant
LAM
MPS
Salin
as
CTH
DSM
C
Pres
to
•Five codes consume >80% of Sandia’s cycles
•Presto alone uses 34%
Figure 1. Performance advantage of MPP over commodity cluster.
2. JASONs Review Support
R. Leland, M. Rajan, R. Benner, C. Vaughan, S. Goudy, J. Ang
Abstract JASON is an independent scientific advisory group that provides consulting services to the U.S. government on matters of defense science and technology. This effort was initiated by Sandia management to acquire data on Sandia applications to analyze our HPC needs. The findings were presented to JASONs in their 2003 summer study. This JASONs study was on the technical requirements of advanced scientific computing and modeling in support of the United States maintaining a safe and reliable nuclear deterrent through the Department of Energy’s and NNSA’s Stockpile Stewardship Program. The Sandia presentation discussed pros and cons of alternate computer architectures for Sandia’s capability and capacity computing needs. Reference [1] is the Sandia OUO document, authored by Rob Leland.
I. APPLICATIONS AND SYSTEMS CHARACTERIZATION
Sandia management briefed the JASONs in the
last calendar quarter of 2004. The focus of the presentation was on effectiveness of HPC compute platforms on meeting engineering analysis needs. The briefing was on the heels of the much publicized success of the Japanese Earth Simulator and the growing popularity of large commodity clusters. Sandia’s principal conclusion arrived at through data gathered by the performance analysis and modeling team, was that a vector based tera-scale system was neither viable nor available from a US manufacturer, and, that a tera-scale commodity clusters did not meet our capability needs. Performance measurement and analysis of several Sandia applications supported Sandia’s requirements for a tightly integrated MPP like the Red Storm. However, the study also revealed that some portion of the analysts needs could be met by capacity cluster platforms. To answer the question of the suitability of a vector architecture, the relative performance of an architecture like Red Storm over NEC SX-6 vector-architecture was
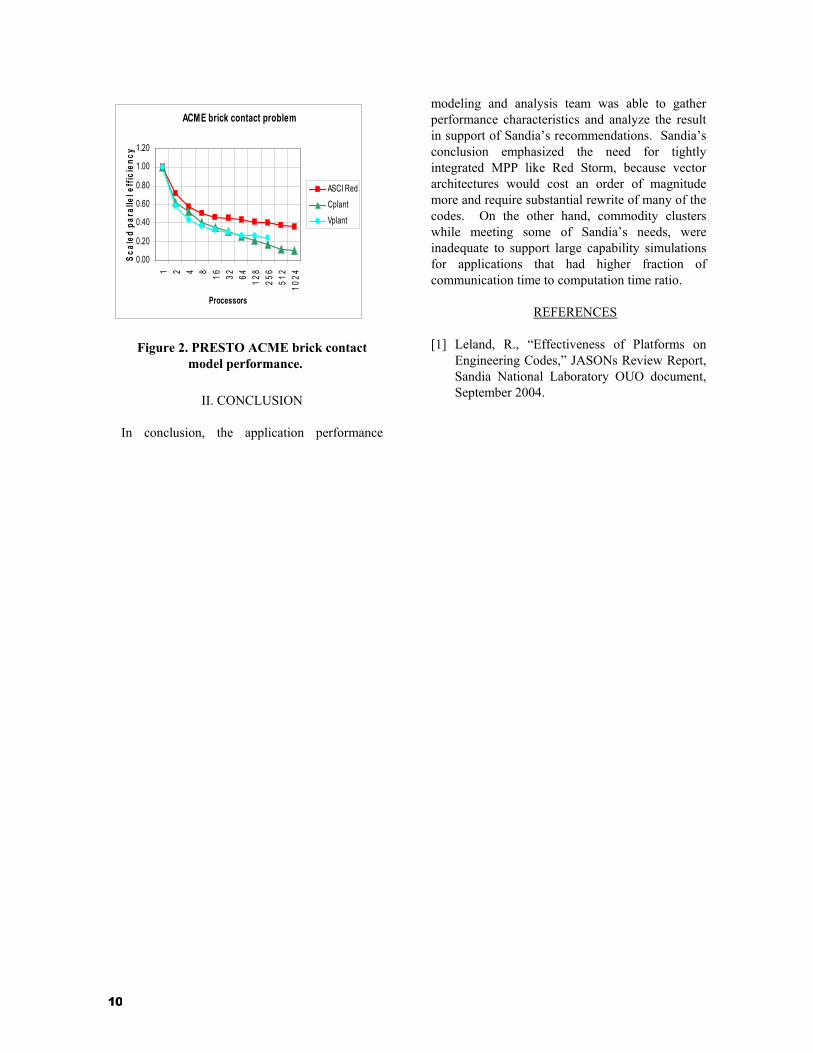
estimated for the applications: CTH, ITS, SALINAS, and, LAMMPS. This showed a Red Storm cost/performance advantage of 20X to 200X for non-vector codes, 5X-20X for partially vectorizable codes and 3X-5X for vector codes. To investigate the suitability of commodity clusters, scaling characteristics of ITS, LAMMPS, CTH, PRESTO were measured on C-Plant and V-Plant (commodity clusters) and contrasted with the efficiency measured on ASCI Red (an MPP). Figure 1 looks across several Sandia applications to measure the parallel efficiency ratio, between MPP and a commodity cluster. Applications like Presto and DSMC have communication intensive algorithms that results in a factor of 2 to 3 better performance on a tightly integrated MPP over a commodity cluster.
Recent measurements using thousands of processor with Sandia’s NW capability simulation models on Red Storm confirm this conclusion. A sample of the kind of data that was gathered by the performance analysis and modeling team to support the conclusions in Figure 1 is illustrated in Figures 2.
10
II. CONCLUSION
In conclusion, the application performance
modeling and analysis team was able to gather performance characteristics and analyze the result in support of Sandia’s recommendations. Sandia’s conclusion emphasized the need for tightly integrated MPP like Red Storm, because vector architectures would cost an order of magnitude more and require substantial rewrite of many of the codes. On the other hand, commodity clusters while meeting some of Sandia’s needs, were inadequate to support large capability simulations for applications that had higher fraction of communication time to computation time ratio.
REFERENCES
[1] Leland, R., “Effectiveness of Platforms on
Engineering Codes,” JASONs Review Report, Sandia National Laboratory OUO document, September 2004.
ACME brick contact problem
0.00
0.20
0.40
0.60
0.80
1.00
1.201 2 4 8 16 32 64 128
256
512
1024
Processors
Scal
ed p
aral
lel e
ffici
ency
ASCI Red
Cplant
Vplant
Figure 2. PRESTO ACME brick contact model performance.

11
3. Janus Jumbo Simulation
M. Rajan, R. Benner, C. Vaughan, S. Goudy, J. Ang
Abstract
Janus is the machine name of Sandia’s ASCI Red HPC system that had more than 9000 processors. Nominally the processors were split 2/3rd into a section serving classified simulations and the other 1/3rd section serving unclassified jobs ( or vice versa), swinging back and forth based on program needs. Between April and November of 2004, on three occasions, it was configured as one Jumbo system dedicated to running large simulations and scaling studies. Several applications were run on this system that met the technical and programmatic needs for such large simulations. This exercise paid rich dividends in improving the scaling behavior of applications and in supporting the performance modeling and analysis team’s efforts to understand architectural balance and operating system issues that would impact future capability class systems and simulations.
I. MOTIVATION AND SUMMARY OF FINDINGS
This effort on ASCI Red was undertaken by
combining the red (classified) and black (unclassified) sections of the ASCI Red to configure a large MPP with close to 9000 processors. The technical motivations for this effort were: Code validation to large processor counts, identification and remediation of application scaling limitations (Alegra, Salinas, ITS), identification and remediation of OS, I/O, tools limitations, investigation of the impact of architectural balance on application scalability, scaling studies and development of performance models (ITS, CTH, Zapotec).
The programmatic motivation were: Support
Sandia investigations for the ASC PetaFlops Level 1 Milestone, support management briefs for JASON’s review, support management briefs for NAS review, Red Storm 7X acceptance tests. An important achievement was identifying and solving a number of system issues. For example, the hardware in Jumbo mode was used for the first time in 4 yrs. Hardware clock and mesh issues surfaced and had to be resolved. In addition faulty
disks, disk controllers and cables were located and the system successfully booted. Memory fragmentation in libpuma and libc libraries were found, fixed and tested using PICO code, FUEGO code and Red Storm memory tests. The Janus MPI parallel job launcher, yod, was modified to reduce disk I/O and memory use several-fold. The usability at scale of profiling tool MPROF and serial I/O module FYOD were identified and related to hardware limitations. The following applications were successfully run on thousands of processors and scaling behavior documented.
1) ALEGRA HEDP – Z-Pinch Simulation 2) FUEGO – Weapon-in-a-Fire 3) DSMC/ICARUS; MEMS and Neutron
Generator 4) ZAPOTEC – Earth Penetrator 5) SALINAS – Structural Dynamics 6) ITS – Particle Transport Monte Carlo
Simulation 7) Other Red Storm 7X Applications.
As an example of the Jumbo mode simulations
leading to performance enhancements, we present results of Alegra HEDP runs in Figure 1. Major improvements in scalability resulted from improvements in memory usage of the multigrid solver, improvements in load balance with Zoltan, and, with use of non-blocking messages in the radiation solve. Similarly improvements in FUEGO for weapon-in-a-fire simulations were achieved with improvements in the implicit solver.
Alegra HEDP; Magnetics Solver Performance(problem size scaled; 10000 Elements/Proc)
02000400060008000
10000
0 1000 2000 3000 4000
Number of Processors
Exec
utio
n Ti
me
in
secs
April 2004 JUMBO runs
Sept. 2004 JUMBO runs
Nove. 2004 JUMBO runs
Figure 1. Performance improvement in
Alegra with JUMBO runs.
12
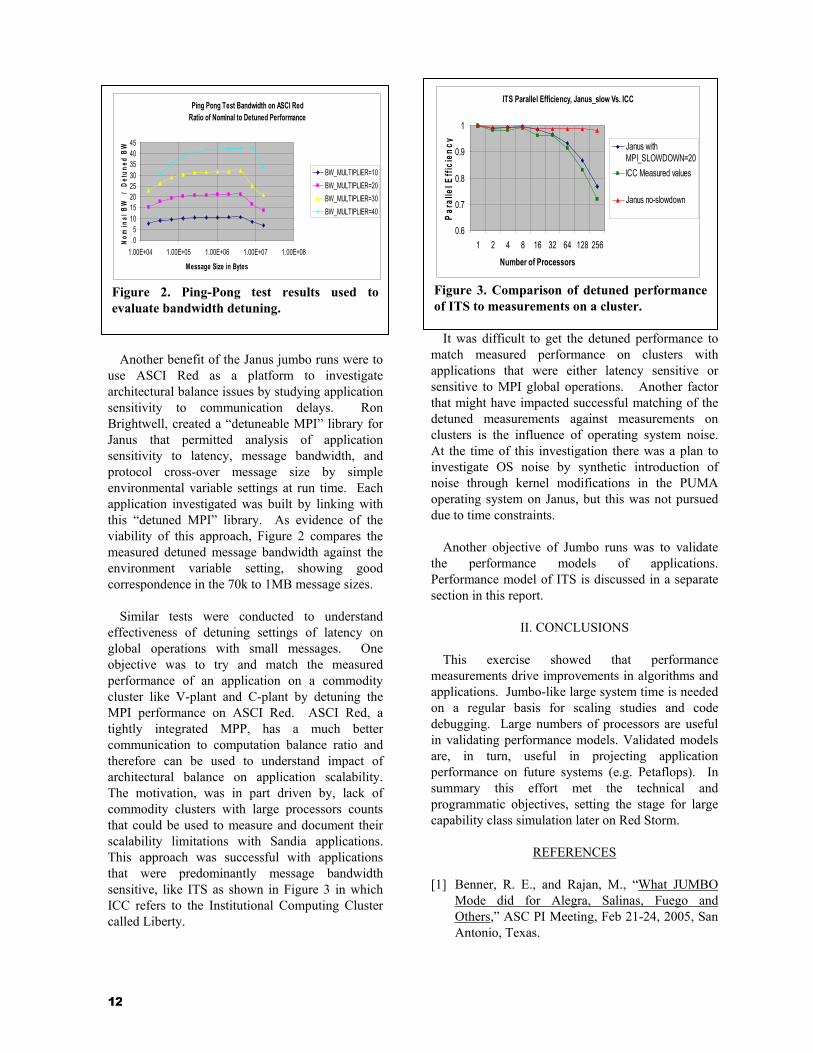
Another benefit of the Janus jumbo runs were to
use ASCI Red as a platform to investigate architectural balance issues by studying application sensitivity to communication delays. Ron Brightwell, created a “detuneable MPI” library for Janus that permitted analysis of application sensitivity to latency, message bandwidth, and protocol cross-over message size by simple environmental variable settings at run time. Each application investigated was built by linking with this “detuned MPI” library. As evidence of the viability of this approach, Figure 2 compares the measured detuned message bandwidth against the environment variable setting, showing good correspondence in the 70k to 1MB message sizes.
Similar tests were conducted to understand effectiveness of detuning settings of latency on global operations with small messages. One objective was to try and match the measured performance of an application on a commodity cluster like V-plant and C-plant by detuning the MPI performance on ASCI Red. ASCI Red, a tightly integrated MPP, has a much better communication to computation balance ratio and therefore can be used to understand impact of architectural balance on application scalability. The motivation, was in part driven by, lack of commodity clusters with large processors counts that could be used to measure and document their scalability limitations with Sandia applications. This approach was successful with applications that were predominantly message bandwidth sensitive, like ITS as shown in Figure 3 in which ICC refers to the Institutional Computing Cluster called Liberty.
It was difficult to get the detuned performance to match measured performance on clusters with applications that were either latency sensitive or sensitive to MPI global operations. Another factor that might have impacted successful matching of the detuned measurements against measurements on clusters is the influence of operating system noise. At the time of this investigation there was a plan to investigate OS noise by synthetic introduction of noise through kernel modifications in the PUMA operating system on Janus, but this was not pursued due to time constraints.
Another objective of Jumbo runs was to validate
the performance models of applications. Performance model of ITS is discussed in a separate section in this report.
II. CONCLUSIONS
This exercise showed that performance
measurements drive improvements in algorithms and applications. Jumbo-like large system time is needed on a regular basis for scaling studies and code debugging. Large numbers of processors are useful in validating performance models. Validated models are, in turn, useful in projecting application performance on future systems (e.g. Petaflops). In summary this effort met the technical and programmatic objectives, setting the stage for large capability class simulation later on Red Storm.
REFERENCES
[1] Benner, R. E., and Rajan, M., “What JUMBO Mode did for Alegra, Salinas, Fuego and Others,” ASC PI Meeting, Feb 21-24, 2005, San Antonio, Texas.
Ping Pong Test Bandwidth on ASCI RedRatio of Nominal to Detuned Performance
05
1015202530354045
1.00E+04 1.00E+05 1.00E+06 1.00E+07 1.00E+08
Message Size in Bytes
Nom
inal
BW
/ D
etun
ed B
W
BW_MULTIPLIER=10BW_MULTIPLIER=20BW_MULTIPLIER=30BW_MULTIPLIER=40
Figure 2. Ping-Pong test results used to evaluate bandwidth detuning.
ITS Parallel Efficiency, Janus_slow Vs. ICC
0.6
0.7
0.8
0.9
1
1 2 4 8 16 32 64 128 256
Number of Processors
Para
llel E
ffici
ency Janus with
MPI_SLOWDOWN=20ICC Measured values
Janus no-slowdown
Figure 3. Comparison of detuned performance of ITS to measurements on a cluster.

13
4. Requirements to Move to a Petaflop Platform: ASC Level I Milestone Support
R. Leland, M. Rajan, R. Benner, C. Vaughan, S. Goudy
Abstract
An ASC tri-lab team was convened to document ASC computing needs beyond 100TF to a Petaflop platform. The focus of the milestone was on future capability computing needs assuming the stockpile mission does not change drastically. The performance analysis team supported Sandia’s effort to collect evidence supporting Sandia’s need for large capability simulations. The unclassified presentation, on the findings of the tri-lab team, is provided in reference [1].
I. INTRODUCTION
HE Tri-Lab team was charged with producing a report by December 31, 2004 on the
requirements for a petaflops class computing platform. The focus of this effort was on capability computing. Petaflop computing needs in three broad areas were identified: stockpile stewardship program, threat mitigation and enabling new technologies. The need for ASC leadership in ensuring that compute system vendors provide an
effective 1 PF delivered performance in the near terms was argued based on the historical success of the ASCI program Table 1 summarizes the application needs across all the three labs, based on estimates of performance and design iteration needs.
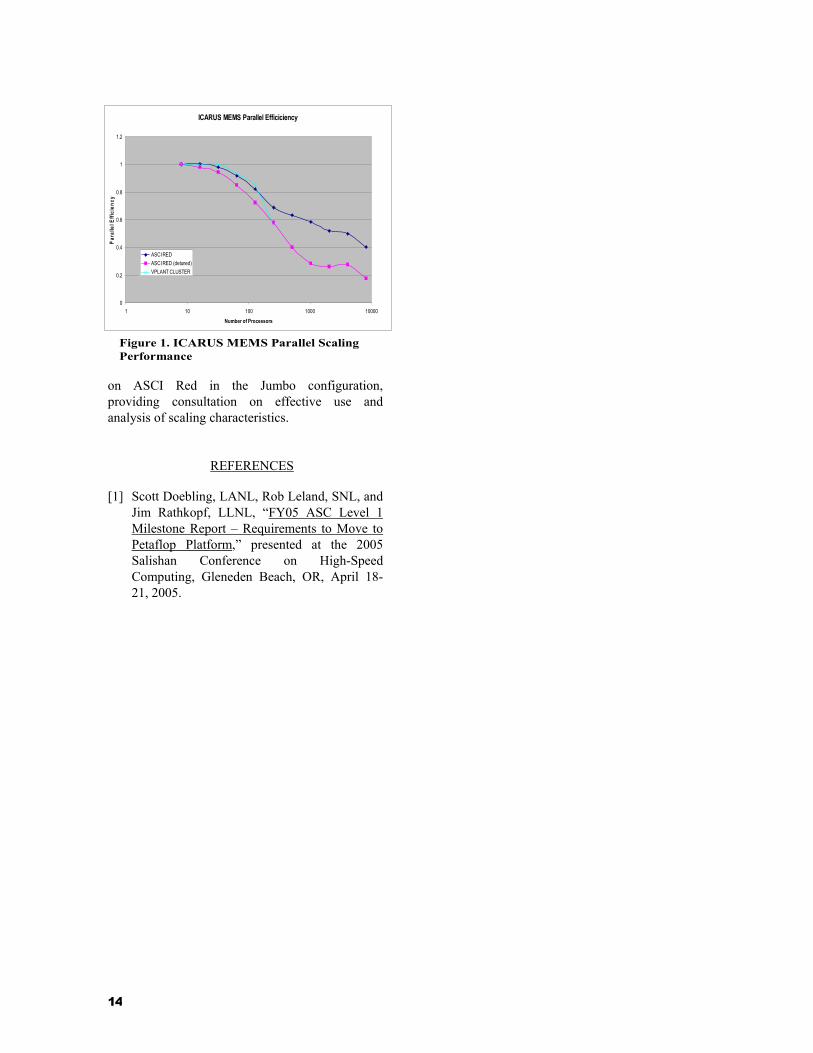
Sandia performance modeling and analysis team supported the development of estimates for the following Sandia modeling needs: MEMS design, Neutron generator tube design, facility vulnerability and mitigation analysis, replacement of the SPR functionality through simulations, and Z-Pinch simulations. The team carried out scaling studies on ASCI Red to enable estimates for Petaflops class simulations. One such example, discussed in further details below, is the MEMS ICARUS simulations. This analysis was for transient noncontinuum microscale gas flow using Direct Simulation Monte Carlo (DSMC) code called ICARUS. The model consisted of a two dimensional Microbeam. Sinusoidal oscillation was investigated to understand transient microscale gas flows. The rectangular domain was meshed with 52,000, 0.05 micrometers square cells and a scaled speed-up problem was constructed with 8125 simulators per cell per processor. The application showed excellent scaling behavior on ASCI Red as shown in Figure 2. Also of interest in this study was the suitability of commodity clusters in carrying out such design calculations. So performance of a well balanced architecture like the ASCI Red was compared against a Myrinet cluster called Vplant. One of the difficulties in such comparisons was the lack of availability of clusters with 10,000 processors. We attempted to overcome this limitation by using ASCI Red in conjunction with a ‘detuned’ MPI library that permitted us to explore lowering the bytes-per-flop ratio through artificially controlled lowering of the message bandwidth and latency.
For other Sandia applications analyzed the performance modeling team supported their runs
T
Table 1. Tri-lab Petaflop Application Need Estimates Application Desired run
time(days) Estimated Petaflops
NW Physics (3D) 14 0.214 1-ns HE chemical dynamics 30 1 NW Physics (3D) 14 1.24 NW Physics (3D) 14 1.47 NW Physics (3D) 14 2.3 DNS of near-asymptotic regime turbulence
30 3
Model NGT design 7 3.7 NW Physics (3D) 48 10.2 LES of far asymptotic regime turbulence
365 10.7
Classical MD of Pu process 30 20 MEMs design 1 1 Replacing SPR 14 2.7 Facility vulnerability and mitigation
7 3.1
NIF laser-plasma interaction 30 0.360 Integrated NIF hohlraum/capsule
1 0.750
Breakeven Z target design 7 1.3
14
on ASCI Red in the Jumbo configuration, providing consultation on effective use and analysis of scaling characteristics.
REFERENCES
[1] Scott Doebling, LANL, Rob Leland, SNL, and Jim Rathkopf, LLNL, “FY05 ASC Level 1 Milestone Report – Requirements to Move to Petaflop Platform,” presented at the 2005 Salishan Conference on High-Speed Computing, Gleneden Beach, OR, April 18-21, 2005.
ICARUS MEMS Parallel Efficiciency
0
0.2
0.4
0.6
0.8
1
1.2
1 10 100 1000 10000
Number of Processors
Par
alle
l Effi
cien
cy
ASCI REDASCI RED (detuned)VPLANT CLUSTER
Figure 1. ICARUS MEMS Parallel Scaling Performance

15
5. Quick-Look Study of Opteron Single vs. Dual Core Performance
R. Malins
In anticipation of the upgrade of Red Storm from single to dual core CPUs, a quick look study was undertaken to examine performance issues for dual core systems. The goal of the quick study was to develop an initial understanding 1) of the order of magnitude performance increase that could be expected from dual cores, and 2) of the code characteristics that would foster or hinder the ability to utilize the second core effectively. The quick look study consisted of two parts. The first part examined benchmark and physics application performance at low processor counts and employed a dual-core Opteron test cabinet. The second part of the study consisted of physics code scaling runs using a portion of the upgraded Red Storm system. This work was performed by Sue Goudy and Courtenay Vaughan.
SMALL CPU COUNT RESULTS The initial examination of single core vs. dual core performance consisted of a series of runs on a small (4 dual core sockets) test cabinet. In this cabinet, one could partition a job to employ either one core per socket or both cores per socket. Runs were performed in both modes in order to assess whether memory or network contention was impacting the ability to utilize the second core fully. HPC benchmarks and physics codes, having different memory and network access patterns, were run in an attempt to gain insight into the contention issues.
HPC Challenge Benchmarks at Small CPU Counts. The HPC Challenge (HPCC) benchmarks are a set of small scale applications that have been tailored to examine different parts of a platform's architecture (reference 1). Five of the benchmarks were selected for the quick look study:
• PTRANS: Parallel Matrix Transpose (emphasizes bandwidth for stride one global memory access)
• HPL: High Performance LINPACK Dense Matrix Linear Algebra (emphasizes CPU mathematical processing)
• STREAM: Simple Linear Algebra Vector Kernels (emphasizes stride one local memory access for Copy/Add/Scale/Triad operations)
• Random: Random Memory Access (emphasizes random memory access issues)
• FFT: FORTRAN Fast Fourier Transform Algorithm (emphasizes complex value computation with simple memory access patterns) The HPCC benchmarks results are shown in Table 1. In this table, the second column provides the results for the original Red Storm test cabinet having only single core sockets and CPUs. The benchmarks emphasizing memory access (PTRANS and STREAM) show the smallest increase from the second core and have the poorest comparison to the single core cabinet. HPL, which is almost exclusively computation, shows the best comparison of single vs. dual cores in the dual core cabinet (nearly the ideal factor of 2) and shows the smallest difference between results for 8 CPUs in the single core cabinet and the dual core cabinet. This suggests that memory contention could be a significant performance limiter for dual core systems. CTH Runtime Results at Small CPU Counts. CTH is a shock physics code commonly used at Sandia in WFO projects for the DoD. The code has a complex combination of characteristics affecting scaling (see sections 9 and 10) and one would expect to see a combination of the effects shown for the HPCC benchmarks. CTH was also run on both the single core socket cabinet and the dual core socket cabinet. By controlling the domain decomposition, results were
Table 1.
HPCC Benchmark
Single Core Cabinet
Dual Core Cabinet Units
8 Single Core Sockets
4 Sockets (1 core/ socket)
4 Sockets (2 core/ socket)
Percent Change
PTRANS 2.251 0.998 1.357 136% GB/sec HPL 27.01 13.75 26.68 194% Gflop/sec STREAM 39.04 19.207 20.863 109% Gbytes/sec Random 0.01078 0.00587 0.00942 160% Gbytes/sec FFT 2.2539 1.2034 1.5574 129% Gflop/sec
16
obtained for both a constant amount of work per socket (for comparing single core sockets to dual core sockets) and a constant amount of work per core (for assessing the utilization of each core in a dual core socket). Wall clock time per iteration was measured for each run configuration (i.e., smaller is better). For these data, two measures of efficiency were composed: Eff(a) = [iteration time for n cores @ 1/socket] / [iteration time for n cores @ 2/socket] Eff(b) = [iteration time @ n sockets single core cabinet] / [iteration time @ n sockets dual cabinet] Eff(a) was measured for constant work assigned to each core; a value of 100% would show that each core is performing the same amount of work independent of whether the other core was also employed (i.e., no contention for memory or network). Eff(b) was measured for constant work assigned to each socket; a value of 200% would indicate that the 2 cores in the dual core were completing the assigned work in half the time of the single core socket (i.e., ideal scaling where one dual core equals twice the compute power of a single core). The results for CTH runs on the shaped charge problem (see section 10) are shown in Table 2. The Eff(a) results show that addition of the second core causes each core to be 10%-15% less efficient. The Eff(b) results show that a given compute load can be completed somewhat faster by a dual core socket than by a single core socket. Note that Eff(b) values improve with additional work assigned to the socket. This suggests that the limiting factor is communications contention rather than memory access contention.
Table 2. Cells Assigned N
(cores or sockets)
Eff(a) Eff(b)
50 x 120 x 50 1 --- 133% 50 x 120 x 50 2 86% 142% 50 x 120 x 50 4 83% 139% 50 x 120 x 50 8 86% ---- 80 x 192 x 80 1 ---- 154% 80 x 192 x 80 2 88% 153% 80 x 192 x 80 4 85% 149% 80 x 192 x 80 8 90% -----
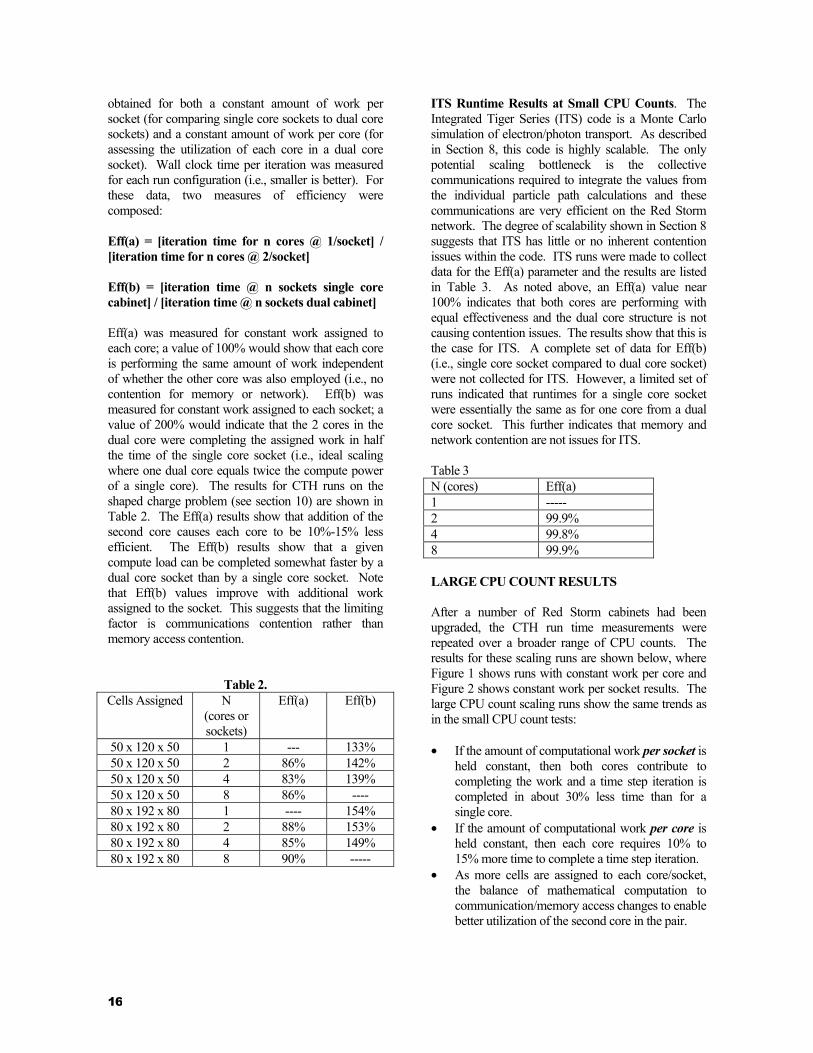
ITS Runtime Results at Small CPU Counts. The Integrated Tiger Series (ITS) code is a Monte Carlo simulation of electron/photon transport. As described in Section 8, this code is highly scalable. The only potential scaling bottleneck is the collective communications required to integrate the values from the individual particle path calculations and these communications are very efficient on the Red Storm network. The degree of scalability shown in Section 8 suggests that ITS has little or no inherent contention issues within the code. ITS runs were made to collect data for the Eff(a) parameter and the results are listed in Table 3. As noted above, an Eff(a) value near 100% indicates that both cores are performing with equal effectiveness and the dual core structure is not causing contention issues. The results show that this is the case for ITS. A complete set of data for Eff(b) (i.e., single core socket compared to dual core socket) were not collected for ITS. However, a limited set of runs indicated that runtimes for a single core socket were essentially the same as for one core from a dual core socket. This further indicates that memory and network contention are not issues for ITS. Table 3 N (cores) Eff(a) 1 ----- 2 99.9% 4 99.8% 8 99.9% LARGE CPU COUNT RESULTS After a number of Red Storm cabinets had been upgraded, the CTH run time measurements were repeated over a broader range of CPU counts. The results for these scaling runs are shown below, where Figure 1 shows runs with constant work per core and Figure 2 shows constant work per socket results. The large CPU count scaling runs show the same trends as in the small CPU count tests: • If the amount of computational work per socket is
held constant, then both cores contribute to completing the work and a time step iteration is completed in about 30% less time than for a single core.
• If the amount of computational work per core is held constant, then each core requires 10% to 15% more time to complete a time step iteration.
• As more cells are assigned to each core/socket, the balance of mathematical computation to communication/memory access changes to enable better utilization of the second core in the pair.

17
Note that the magnitude of these effects appears relatively constant over a very large range of CPU counts. ASSESSMENT Performance Perspective. The results show that a dual core processor clearly accomplishes more work than a single core processor. However, except for unusual circumstances, a dual core processor does not perform twice the work of a single core processor. The HPCC results and ITS runs indicate that these "unusual circumstances" occur when the code is performing primarily mathematical computations and has a very simple, predictable memory access pattern and minimal node to node communication. Since the dual core Opteron processor has only a single cross-bar for both cores to access memory and the network, one would expect that simulations involving complex communications or complicated memory access patterns would encounter some bottlenecking at the crossbar. One would expect that typical physics applications would often display such contentions with the result that a dual core processor performs better than, but less than two times better than, a single core processor. This expectation is borne out by the CTH results.
Cost Effectiveness Perspective. The processors and motherboards of a large MPP machine represent only a fraction of the platform cost. Hence, one would expect the cost of a platform with dual core nodes to be only slightly greater than that of a platform with the same number of single core nodes, even if the dual core processors and motherboards are twice the cost of the single core processors and motherboards. The results here indicate that as long as the total platform cost is no more than 30% greater for the dual core system, then the dual core system would provide a better "compute per dollar" value. Furthermore, when one considers the infrastructure costs associated with a large compute platform (power, thermal management, etc), which are essentially unchanged by the difference in single core vs. dual core costs (i.e., the percentage cost change for the total system is smaller), then it appears that the dual core system would have an even greater cost advantage.
REFERENCES [1] Piotr Luszczek, “HPC Challenge Benchmark,”
presented at SC2004, November 6-12, 2004, Pittsburgh, PA.
CTH - shaped charge
0
2
4
6
8
10
12
1 2 4 8 16 32 64 128 256 512 1024 2048Number of Sockets
Tim
e pe
r Tim
este
p
1 core/soc - (50 x 120 x 50)/soc2 core/soc - (50 x 120 x 50)/soc1 core/soc - (80 x 192 x 80)/soc2 core/soc - (80 x 192 x 80)/soc
Figure 1.
CTH - Shaped Charge
0
2
4
6
8
10
12
14
16
18
1 2 4 8 16 32 64 128 256 512 1024 2048 4096Number of Cores
Tim
e pe
r Tim
este
p
1 core/soc - (50 x 120 x 50)/core1 core/soc - (80 x 192 x 80)/core2 core/soc - (50 x 120 x 50)/core2 core/soc - (80 x 192 x 80)/core
Figure 2.

18
6. Red Storm Scaling Studies
M. Rajan, C. T. Vaughan, H. E. Meyer, J. O. Stevenson,
J. E. Sturtevant, M. A. Taylor
Abstract In 2006 much effort was dedicated to supporting the use of Red Storm as this new HPC system was readied for use by the Tri-Lab user community. Several applications and benchmarks were run on the system to fully understand the scalability of this system and to advise users on the optimal configurations for their production simulations. Additionally comparison of Red Storm’s performance to ASC Purple and BlueGene/L showed that Red Storm meets or exceeds the performance of other ASC systems on “real” applications.
I. RED STORM PERFORMANCE
COMPARISONS
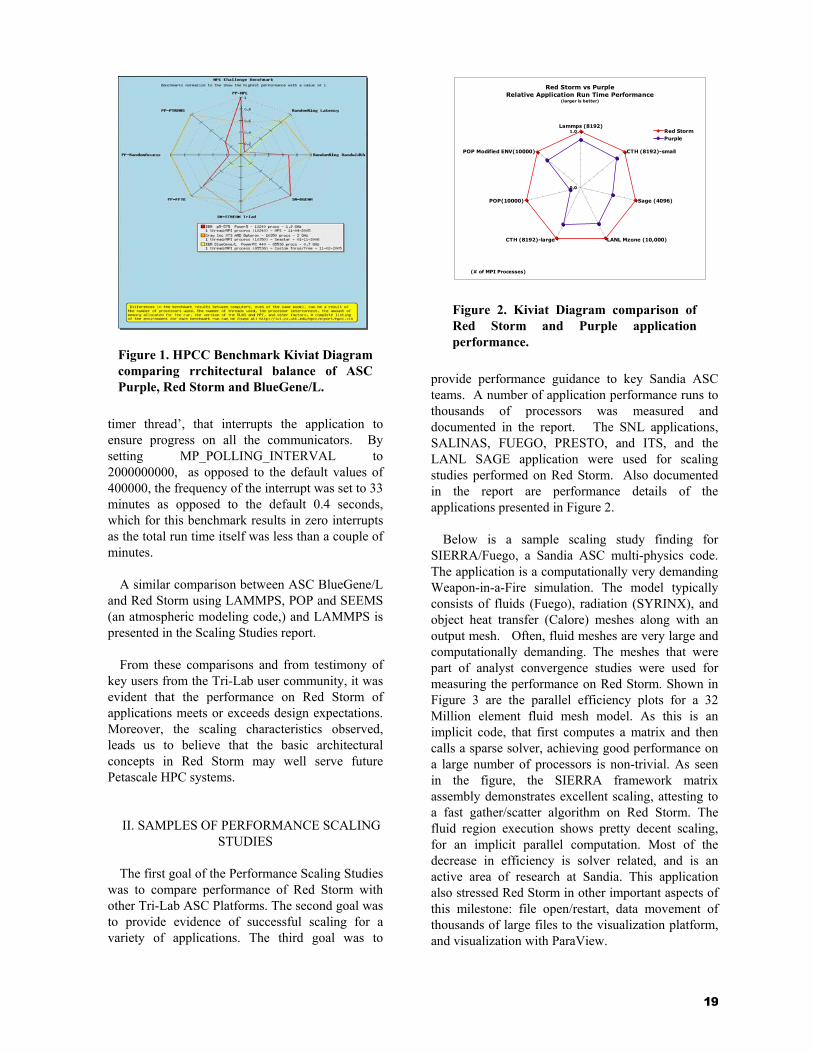
In the spirit of better understanding competing computer architectures, performance of Red Storm was compared to ASC Purple and BlueGene/L between January and July 2006. The performance of Red Storm meets or exceeds the performance of other ASC designs on the selected set of applications benchmarked. Application performance on a system is determined by many factors, chief among which are processor architecture, the memory subsystem architecture, and the interconnect architecture. The operating system may also have a big impact on scalability. Applications differ considerably on how they may stress each of the above. The HPC Challenge benchmark suite (http://icl.cs.utk.edu/hpcc) is designed to give a broad view of supercomputer performance, with measures for floating point compute power (HPL Linpack), memory subsystem performance (STREAMS), and interconnect performance (GUPS, FFT, PTRANS, RandomRing). In a later section on Performance Scaling Studies, comparisons of application performance lead us to the conclusion that Red Storm’s superior architectural balance is the primary differentiator. The HPCC benchmark results have gained popularity in the High Performance Computing (HPC) community in quantifying architectural balance metrics, as summarized below in Figure 1. It presents the
Kiviat diagram downloaded from the published HPCC results at the HPCC website.
In the Kiviat diagram, the larger the normalized
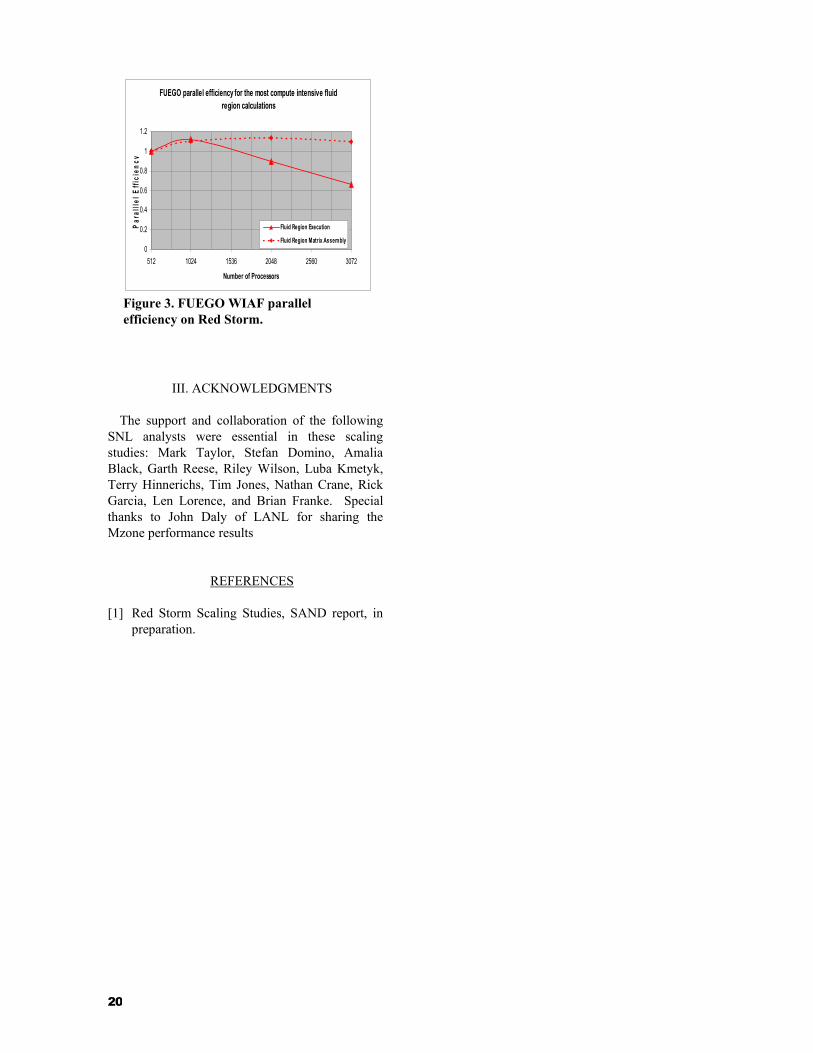
value along any particular measure, the better the performance. In other words, a better balanced system has many points away from the center. In the important interconnect performance categories of Random Access, PTRANS, FFT-PP, RandomRing Latency, and RandomRing Bandwidth, Red Storm’s performance advantage is evident. Even though Red Storm’s LINPACK (HPL) performance is almost one-half that of Purple, indicating a factor of two performance advantage for Purple, the application results at scale, presented in a kiviat summary chart in Figure 2, underscore the importance of a balanced architecture.
Figure 2 summarizes the details of the application
performance comparison from the Performance Scaling Studies section. The applications shown in this figure are as follows:
• LANL Mzone – a classified LANL
application from John Daly • Sage – a LANL hydrodynamics code with
timing_c input • CTH-small – a SNL hydrodynamics code
with a 50x120x50 cells/PE shape-charge input • CTH-large – a SNL hydrodynamics code
with a 90x210x90 cells/PE shape-charge input • LAMMPS – a SNL molecular dynamics
code with Lennard Jones input • POP – a LANL ocean modeling code with
1-block/PE input executed with nominal environmental settings
• POP Modified ENV –a LANL ocean modeling code with 1-block/PE input executed with special environmental settings to eliminate noisy MPI polling thread interrupts on Purple.
It has been suggested by IBM experts that
applications such as POP that do a lot of process synchronization may be adversely affected by a ‘MPI
This document was prepared in November 2006.
19
timer thread’, that interrupts the application to ensure progress on all the communicators. By setting MP_POLLING_INTERVAL to 2000000000, as opposed to the default values of 400000, the frequency of the interrupt was set to 33 minutes as opposed to the default 0.4 seconds, which for this benchmark results in zero interrupts as the total run time itself was less than a couple of minutes.
A similar comparison between ASC BlueGene/L and Red Storm using LAMMPS, POP and SEEMS (an atmospheric modeling code,) and LAMMPS is presented in the Scaling Studies report.
From these comparisons and from testimony of key users from the Tri-Lab user community, it was evident that the performance on Red Storm of applications meets or exceeds design expectations. Moreover, the scaling characteristics observed, leads us to believe that the basic architectural concepts in Red Storm may well serve future Petascale HPC systems.
II. SAMPLES OF PERFORMANCE SCALING
STUDIES The first goal of the Performance Scaling Studies
was to compare performance of Red Storm with other Tri-Lab ASC Platforms. The second goal was to provide evidence of successful scaling for a variety of applications. The third goal was to
provide performance guidance to key Sandia ASC teams. A number of application performance runs to thousands of processors was measured and documented in the report. The SNL applications, SALINAS, FUEGO, PRESTO, and ITS, and the LANL SAGE application were used for scaling studies performed on Red Storm. Also documented in the report are performance details of the applications presented in Figure 2.
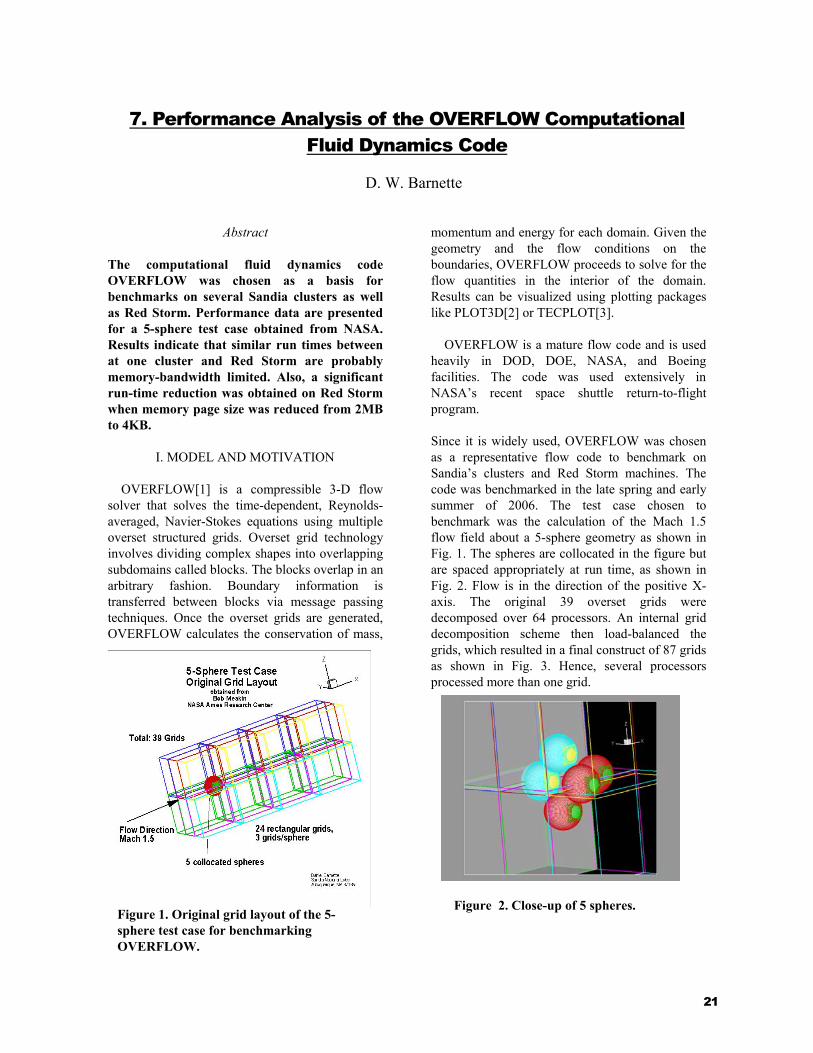
Below is a sample scaling study finding for
SIERRA/Fuego, a Sandia ASC multi-physics code. The application is a computationally very demanding Weapon-in-a-Fire simulation. The model typically consists of fluids (Fuego), radiation (SYRINX), and object heat transfer (Calore) meshes along with an output mesh. Often, fluid meshes are very large and computationally demanding. The meshes that were part of analyst convergence studies were used for measuring the performance on Red Storm. Shown in Figure 3 are the parallel efficiency plots for a 32 Million element fluid mesh model. As this is an implicit code, that first computes a matrix and then calls a sparse solver, achieving good performance on a large number of processors is non-trivial. As seen in the figure, the SIERRA framework matrix assembly demonstrates excellent scaling, attesting to a fast gather/scatter algorithm on Red Storm. The fluid region execution shows pretty decent scaling, for an implicit parallel computation. Most of the decrease in efficiency is solver related, and is an active area of research at Sandia. This application also stressed Red Storm in other important aspects of this milestone: file open/restart, data movement of thousands of large files to the visualization platform, and visualization with ParaView.
Figure 1. HPCC Benchmark Kiviat Diagram comparing rrchitectural balance of ASC Purple, Red Storm and BlueGene/L.
Red Storm vs PurpleRelative Application Run Time Performance
(larger is better)
0.0
1.0Lammps (8192)
CTH (8192)-small
Sage (4096)
LANL Mzone (10,000)CTH (8192)-large
POP(10000)
POP Modified ENV(10000)
Red StormPurple
(# of MPI Processes)
Figure 2. Kiviat Diagram comparison of Red Storm and Purple application performance.
20
III. ACKNOWLEDGMENTS
The support and collaboration of the following SNL analysts were essential in these scaling studies: Mark Taylor, Stefan Domino, Amalia Black, Garth Reese, Riley Wilson, Luba Kmetyk, Terry Hinnerichs, Tim Jones, Nathan Crane, Rick Garcia, Len Lorence, and Brian Franke. Special thanks to John Daly of LANL for sharing the Mzone performance results
REFERENCES
[1] Red Storm Scaling Studies, SAND report, in preparation.
FUEGO parallel efficiency for the most compute intensive fluid region calculations
0
0.2
0.4
0.6
0.8
1
1.2
512 1024 1536 2048 2560 3072
Number of Processors
Par
allle
l Effi
cien
cy
Fluid Region Execution
Fluid Region Matrix Assembly
Figure 3. FUEGO WIAF parallel efficiency on Red Storm.
21
7. Performance Analysis of the OVERFLOW Computational Fluid Dynamics Code
D. W. Barnette
Abstract
The computational fluid dynamics code OVERFLOW was chosen as a basis for benchmarks on several Sandia clusters as well as Red Storm. Performance data are presented for a 5-sphere test case obtained from NASA. Results indicate that similar run times between at one cluster and Red Storm are probably memory-bandwidth limited. Also, a significant run-time reduction was obtained on Red Storm when memory page size was reduced from 2MB to 4KB.
I. MODEL AND MOTIVATION OVERFLOW[1] is a compressible 3-D flow
solver that solves the time-dependent, Reynolds-averaged, Navier-Stokes equations using multiple overset structured grids. Overset grid technology involves dividing complex shapes into overlapping subdomains called blocks. The blocks overlap in an arbitrary fashion. Boundary information is transferred between blocks via message passing techniques. Once the overset grids are generated, OVERFLOW calculates the conservation of mass,
momentum and energy for each domain. Given the geometry and the flow conditions on the boundaries, OVERFLOW proceeds to solve for the flow quantities in the interior of the domain. Results can be visualized using plotting packages like PLOT3D[2] or TECPLOT[3].
OVERFLOW is a mature flow code and is used heavily in DOD, DOE, NASA, and Boeing facilities. The code was used extensively in NASA’s recent space shuttle return-to-flight program.
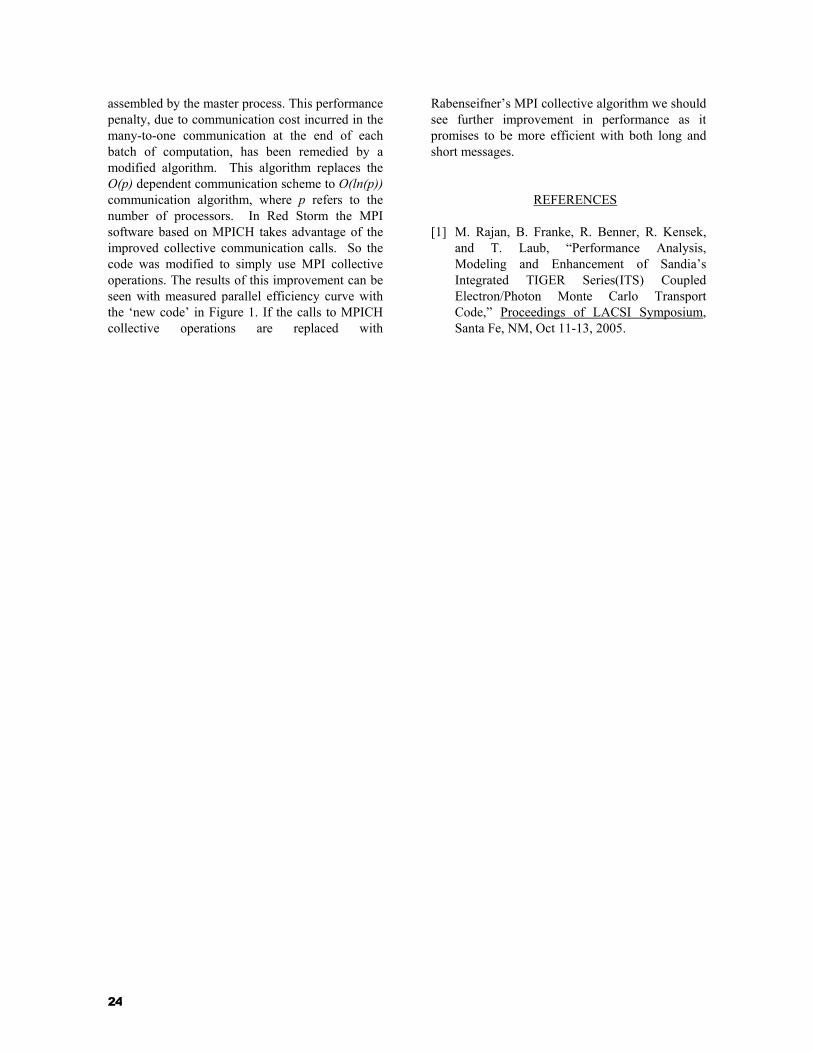
Since it is widely used, OVERFLOW was chosen as a representative flow code to benchmark on Sandia’s clusters and Red Storm machines. The code was benchmarked in the late spring and early summer of 2006. The test case chosen to benchmark was the calculation of the Mach 1.5 flow field about a 5-sphere geometry as shown in Fig. 1. The spheres are collocated in the figure but are spaced appropriately at run time, as shown in Fig. 2. Flow is in the direction of the positive X-axis. The original 39 overset grids were decomposed over 64 processors. An internal grid decomposition scheme then load-balanced the grids, which resulted in a final construct of 87 grids as shown in Fig. 3. Hence, several processors processed more than one grid.
Figure 2. Close-up of 5 spheres.
Figure 1. Original grid layout of the 5-sphere test case for benchmarking OVERFLOW.

22
II. ANALYSIS AND RESULTS For this benchmark, OVERFLOW was run in
five 1000-time-step increments, with artificial smoothing reduced to recommended values by the final run. Timings were taken for the final increment only. The purpose of this approach was to obtain a representative timing sufficiently along the convergence path so that initial start-up procedures would not be an issue. Results were not run to convergence since this is not necessary for timings.
Timings for Red Storm and Sandia clusters Liberty, Spirit, and Red Squall are presented in Fig. 4. Specs for each machine are listed in web sites given in Appendix-Computer Descriptions for comparison. Results are normalized by timings obtained on the machine that ran the slowest for this benchmark, Liberty. Spirit, and Red Storm with the default 2MB-size memory pages, had timings that were essentially the same. It is believed that this is mostly due to memory bandwidth limitations.
It is interesting to note that Red Storm showed an 11% increase in run time when memory pages were reduced to 4KB in size, but with a reduction in parallel efficiency. This is an area to be investigated further.
Results from this benchmarking effort were
presented at the DoD HPCMO Users Group Conference in June 2006[4].
REFERENCES
[1] R.H. Nichols, R.W. Tramel, and P.G. Buning, “Solver and Turbulence Model Upgrades to OVERFLOW 2 for Unsteady and High-Speed Applications,” AIAA-2006-2824, AIAA 36th Fluid Dynamics Conference, San Francisco, CA, June 2006.
[2] P.P. Walatka, P.G. Buning, L. Pierce, and P.A. Elson, “PLOT3D User's Manual,” NASA TM 101067, March 1990.
[3] Tecplot 360. [4] D.W. Barnette, “Performance Analysis of
OVERFLOW on Sandia Compute Clusters,” presented at the DoD HPCMO Users Group Conference, Denver, Colorado, June 2006.
Figure 4. OVERFLOW wall-clock times run on 64 processors for 1000 iterations for the 5-sphere test case.
Figure 3. Run-time grid arrangement for load balancing.

23
8. Performance Analysis and Modeling of Sandia’s Integrated TIGER Series (ITS) Coupled Electron/Photon
Monte Carlo Transport Code
M. Rajan, B. Franke, T. Laub
Abstract
ITS is a powerful and user-friendly software package permitting state-of-the-art Monte Carlo solution of linear time-independent coupled electron/photon radiation transport problems, with or without the presence of macroscopic electric and magnetic fields of arbitrary spatial dependence. As one of a few Sandia applications that are targeted for capability class machines like the ASC Red Storm, we studied the performance of this application, in the time frame 2004 to 2005. This summary is extracted from a paper presented at the Los Alamos Computing Science Institute (LACSI) symposium in 2005 [1]. We had successfully constructed a performance model and verified the model against measurements on a variety of Sandia compute platforms. Use of tools like VAMPIR and PAPI in performance analysis and modeling was discussed. The original algorithm for computing the statistical quantities after each batch of Monte-Carlo computations was modified to yield improved parallel scaling. Models of alternate message passing algorithms were investigated and validated against measurements on the Red Storm.
PERFORMANCE ANALYSIS AND MODEL
Deterministic and Monte-Carlo radiation
transport calculations are major consumers of compute cycles at Sandia. We have investigated the scaling characteristics of ITS to tens of thousands of processors. Execution time measurements have been obtained on various platforms at SNL; ASCI Red, VPLANT (2.4 GHz Xeon cluster with Myrinet), ICC (institutional cluster: 3 GHz Xeon with Myrinet), CPLANT (Alpha cluster with Myrinet) and more recently on the Red Storm. Our performance model for ITS has been validated against these measurements. The model follows a similar approach to that expounded by the LANL PAL team. The model develops an analytical expression for the major portions of the execution time, namely, computation, communication and I/O. Expression for the compute time was obtained by curve-fitting
the plot of the measured execution time vs. the number of histories. For the communication time model we focused on the communications at the end of each batch of computations assigned to the processors. This was accomplished with the VAMPIR tracing tool to obtain the message sizes and messaging patterns and later correlated to the MPI calls in the code. To obtain compute platform communication characteristics such as bandwidth and latency, a set of simple benchmarks were run.
In Reference [1] the details of the model are presented and model predictions are compared against measured performance for different architectures. We also present results of tests on the new ASC Red Storm and use the model to predict performance on it to 10,000 processors. The ITS code has been recently enhanced to introduce Fortran 90/95 features and in the process it has also implemented changes in data structures that would improve performance. ITS can suffer a scaling performance penalty depending on how the history computations are split among the participating processors and the frequency with which the statistical tally of the computations are
This document was prepared in November 2006.
ITS Redstorm Parallel Efficiency
0
0.2
0.4
0.6
0.8
1
1.2
1 10 100 1000 10000
N umber o f Processes
OLd Code M easured Apr. 08
Old Code Perf. M odel
New Code M easured-GlobalReduce
Figure 1. Red Storm; model and measured data showing improved performance with the ‘new code.’
24
assembled by the master process. This performance penalty, due to communication cost incurred in the many-to-one communication at the end of each batch of computation, has been remedied by a modified algorithm. This algorithm replaces the O(p) dependent communication scheme to O(ln(p)) communication algorithm, where p refers to the number of processors. In Red Storm the MPI software based on MPICH takes advantage of the improved collective communication calls. So the code was modified to simply use MPI collective operations. The results of this improvement can be seen with measured parallel efficiency curve with the ‘new code’ in Figure 1. If the calls to MPICH collective operations are replaced with
Rabenseifner’s MPI collective algorithm we should see further improvement in performance as it promises to be more efficient with both long and short messages.
REFERENCES
[1] M. Rajan, B. Franke, R. Benner, R. Kensek, and T. Laub, “Performance Analysis, Modeling and Enhancement of Sandia’s Integrated TIGER Series(ITS) Coupled Electron/Photon Monte Carlo Transport Code,” Proceedings of LACSI Symposium, Santa Fe, NM, Oct 11-13, 2005.

25
9. CTH Analytical and Hybrid Modeling
S. Goudy
During the first three years of the CSRF performance analysis project, numerous system tests were conducted, such as the ASCI Red Jumbo runs [1], and results from analyses in a variety of venues were presented [2]. One major contribution to the team effort is the development of an analytic model for CTH and other parallel applications [3]. In 2005, research was also completed on a performance modeling methodology which was successfully defended as a PhD dissertation [4].
Development of an analytic model for CTH
proceeded in several phases, from discussions with CTH developers to analysis of computational experiments on various platforms. The work has been published at the Cray Users’ Group conference (2006) and at The Department of Defense High Performance Computing Conference (2006) [5]. During collaborations with researchers at IBM, Austin, on the efficacy of Optical Circuit Switching for HPC communications, it was also discovered that computational load imbalance can have a noticeable and quantifiable effect on apparent communication performance. This discovery resulted in an improved model for CTH execution time [6].
Many massively parallel supercomputers, such
as ASCI Purple, employ a hybrid structure in which communication “inside the box” (on the node) can be handled by shared memory operations while communication “outside the box” (extra-nodal) is conducted via message-passing. As a consequence of asking whether the dual-level, or hybrid, programming paradigm could speed up application performance, a modeling methodology for hybrid parallel applications was developed. This work, in its early stage, was published at a Linux Cluster Institute Conference (2004).[7,8] For a class of algorithms that use decomposition on the spatial domain and for two different classes of parallel computers, it was shown that the model and experiment support the conjecture that hybrid parallel techniques are not optimal [4].
REFERENCES [1] Benner, R.E., and Rajan, M., “What JUMBO
Mode did for Alegra, Salinas, Fuego and Others,” ASC PI Meeting, Feb 21-24, 2005, San Antonio, Texas.
[2] Ibid, in Russian. [3] Goudy, S., Wen, Z., and Rajan, M., “Zapotec
Complexity,” June 2004. [4] Goudy, S., “Development of a Modeling
Methodology for Hybrid Parallelism,” PhD dissertation, New Mexico Tech, Socorro, New Mexico, May 2005, SAND2005-2876P.
[5] Goudy, S. P., “Performance Modeling of CTH Run Times on MPP and Cluster Platforms,” presented at the DoD High Performance Computing Modernization Program Users Group Conference, June 2006.
[6] Goudy, S., and Rajan, M., “CTH Model with Load Imbalance.”
[7] Goudy, S., Liebrock, L., and Schaffer, S., “Performance Analysis of a Hybrid Parallel Linear Algebra Kernel,” paper presented at New Mexico Tech, Socorro, New Mexico, May 2004.
[8] Ibid, vugraphs.

26
10. Run-Time Performance Model for Sandia’s Hydrodynamics Code CTH
Courtenay T. Vaughan
Abstract
CTH is a widely used shock hydrodynamics code developed at Sandia. We will investigate scaling on Red Storm to 10000 processors and will use those results to compare with an execution time model of the code. This summary is extracted from a paper presented at the CUG meeting, 2006 [1].
I. MOTIVATION AND ANALYSIS
CTH is a widely used shock hydrodynamics
code developed at Sandia [2]. For this study, we will be using a shaped-charge
problem. The shaped-charge consists of a cylindrical container filled with high explosive capped with a copper liner. When the explosive is detonated from the center of the back of the container, the liner collapses and forms a jet as illustrated in Figure 1 with the image at 0.3 ms, where the colors in the explosive indicate pressure. The problem also has a fourth material that forms a target for the jet, which is not shown in Figure 1.
We ran CTH with the shaped-charge problem on up to 10360 processors. The problem is scaled so that each processor could have a 90 x 216 x 90 grid of cells. The code may distribute the cells differently since it seeks to make the processor domains as cubic as possible. We measured the average time per time step and the results showed a reasonable speedup curve with a parallel efficiency
over 50% at 10350 processors. For this problem, the problem space is divided
into a rectilinear grid of computational cells. Each processor’s domain is a rectilinear subgrid of this grid and includes a layer of ghost cells containing grid information from neighboring processors which is exchanged at several points during each time step. There are also times in the time step, such as determining the size of the next time step, where a global reduction is done.
The model that we are using for CTH timing is
taken from [3]. In general, the computational complexity for each time step is O(N3) where N is the length of one edge of a subdomain assigned to a processor. The communication complexity is O(N2) + O(log(P)), where P is the number of processors used in the simulation. The total run time is the sum of the times for the computational and communication phases since the code does not overlap communication and computation. In equation 1, T represents the run time for a single time step.
T = E(κ,φ)N3 + C(λ + τkN2) + S(γ log(P)) (1) In this model, λ and τ denote the communication
latency and transfer cost. The ghost cell data exchanges occur in parallel and are point-to-point communications between logical nearest neighbors. The count of exchanges, C, depends on the problem, the dimensionality of the problem, and the number of processors that the simulation is run on. The number of variables in any exchange, k, also depends upon the simulation. For this simulation, k = 40. The cost of collective operations is O(log(P)). The number of collectives per time step is S and γ is the cost of transfer of a double precision number along a leg of the communication tree.
The time for a calculation in a cell is E(κ,φ), a
function of the number of floating-point operations per cell, κ, and the effective floating-point
0.0 ms 0.30 ms
Figure 1. Shaped-charge problem.

27
computational rate, φ. Since a typical CTH simulation will have regions of high activity as well as cells with differing numbers of materials, the operation counts per cell can vary widely across the domain. The operation count per cell will also depend on the models used.
For this simulation, there are 58 locations where
ghost cell data can be exchanged. The number of exchanges varies with the number of neighbors that a processor has. The two-processor simulation has 22 exchanges per time step while the 128-processor simulation has 117 exchanges per time step and each processor is sending an average of about 600,000 double precision numbers per exchange.
Every place in the code where the processors
could exchange ghost cell data contains a collective operation and there 31 other collective operations for this simulation for a total of 89 collective operations per time step.
We used the Pallas Benchmark to determine the
communication parameters. Since CTH uses data exchanges, we used the PingPing benchmark to determine that λ = 8.3μs and τ = 0.00102μs/byte or 0.00816μs per double precision number. From the AllReduce benchmark, γ = 10.5μs per double precision reduce.
Using the communication parameters in equation
1, and using the time on one processor for the computational time on multiple processors, the predicted execution time varies from 11.94 seconds on 2 processors to 12.41 seconds on 10360 processors. Clearly, the execution time model does not account for the additional time for running on multiple processors.
This model does not account for the time for
message packing and unpacking or for the load imbalance in the problem. Since the shaped-charge problem starts out with a fairly localized area of high activity, once the problem is distributed onto multiple processors, some processors will be more active than others.
We also used CrayPat to profile CTH on several
problem sizes to compare with the model. We found that the volume of message traffic is consistent with the number and length of messages predicted in the model. We also found that the number of collective operations reported in the
profiles to be consistent with the model of the code. The time reported for the data exchanges are off by a factor of two while the time for the collective operations are off by more and that seems to indicate load imbalance.
II. CONCLUSIONS We have run a weak scaling study using CTH on
up to 10360 processors on Red Storm and then modeled the results. While the model was not completely accurate, we were able to learn things about the code through this modeling effort.
Through profiling, we found that we were able
to correctly predict the volume and types of communication that occur in the code. We were able to get close to the time required for the data exchange operations, but need to get better understanding of the amount of load imbalance the occurs in the code.
We are planning to repeat this experiment with a
problem that exhibits better load balance to see if we are better able to predict the run time. We would also like to repeat this experiment with a current version of the code since performance enhancements have been put into the code. This will also help us to impact the performance of this widely used code.
REFERENCES
[1] C. T. Vaughan, S. P. Goudy, “Analysis of an Application on Red Storm,” Proceedings, Cray User Group 2006 Conference, Lugano, Switzerland.
[2] E. S. Hertel, Jr., R. L. Bell, M. G. Elrick, A. V. Farnsworth, G. I. Kerley, J. M. McGlaun, S. V. Petney, S. A. Silling, P. A. Taylor, L. Yarrington, “CTH: A Software Family for Multi-Dimensional Shock Physics Analysis,” Proceedings, 19th International Symposium on Shock Waves 1, 274ff (Université de Provence, Provence, France) (1993).
[3] S. P. Goudy, “Development of a Modeling Methodology for Hybrid Parallelism,” PhD Dissertation, NM Tech, Socorro, New Mexico, May 2005, SAND2005-2876P.

28
11. Investigations on Scaling Performance of SIERRA/Fuego
M. Rajan, A. Black, S. Domino
Abstract
Performance characteristics for coupled fire/thermal response prediction simulations are investigated using coarse, medium, fine and very-fine unstructured meshes on the Red Storm/XT3. These SIERRA/Fuego simulations have leveraged models used in computationally demanding mesh convergence studies to measure performance of the application to thousand processors. This has been helpful in optimizing production jobs and performance tuning. This summary is extracted from a paper presented at CUG meeting, 2006 [1].
I. INTRODUCTION
HE assessment of the thermal response of a weapon system to abnormal environments, like
fire, for safety qualifications is an area of active investigation at Sandia National Laboratories. Historically, weapon safety qualification was based on tests at both the component and system level. However, the scenario space that could be experimentally covered is quite limited. Accordingly, one of the goals of the DOE/NNSA Advanced Strategic Computing (ASC) programs is to establish models of adequate geometric and physics fidelity to supplement the experiment-based qualification approach by providing additional qualification evidence through means of modeling and simulation. Domino, et al.[2] describe the details of the governing equations, discretization, decomposition and solution procedures used in SIERRA/Fuego. Figure [1] shows an image from a parallel volume rendering of a 150 Million degrees of freedom cross-wind fire simulation using Fuego on 2048 processors of the Red Storm. This simulation was part of a qualification test plan for system testing to be conducted at the new Sandia’s Thermal Test Complex Cross Wind Test Facility. This was one of the biggest fire simulations conducted to show case the capability class simulations needed at Sandia and the capability of the Fuego analysis package.
II. THE MODEL AND SCALING STUDY In the application chosen for this study, coupled fire/thermal response predictions for a weapon-like calorimeter is validated for a quiescent fire representative of a transportation accident scenario. The model constructed was used to compare numerical predictions against experimental data. Temperature measurements were used to validate the coupled Fuego/Syrinx/Calore predictions. The model consists of fluids (Fuego), radiation (Syrinx) and object heat transfer (Calore) meshes along with an output mesh.
The main Fuego fluid mesh was constructed in four different sizes on the order of 500K, 1M, 2M and 4M nodes to investigate mesh convergence as part of a formal V&V solution verification study. Similar mesh sizes were used in the Syrinx radiation calculations. The Calore mesh size is much smaller, and contains only the outer shell of the object. The output mesh is a vertical slice through the centerline of the fire that is only one cell thick. The simulations solve the governing set of complex coupled equations whose solution over a broad range of time and length scales is sought. This complexity in the model and the long run times to resolve the fire for 60-90 seconds could only be carried out on massively-parallel capability
T
Data Analysis and Visualization, Dept 1424
Volume Rendering of Fire Simulation Data
Figure 1. Volume rendering of Fuego fire simulation data
This document was prepared in November 2006.

29
class super-computers. These simulations were routinely conducted on the Red Storm computer.
The scaling study mesh sizes for the Fuego meshes and the time steps chosen for each mesh is shown in Table 1.
For the mesh convergence studies, each run, with a target simulation time of 30 seconds to resolve the fire, requires thousands of time steps and run time exceeding 48 hours. Such long runs are not needed for the scaling studies. However the scaling study must take into account time spent in different portions of the code such as setup and I/O. For the science runs, such as mesh convergence investigations, setup and I/O are typically small fractions of the run time, but they could be a significant fraction in scaling study runs as these overheads do not get amortized over many time steps. The scaling study timings were measured for 24 time steps with a file I/O operation corresponding to the results file output (same as used for the mesh convergence studies) at the final time step. Restart I/O overhead was not included in the scaling study. For the purposes of measuring speed up and parallel efficiency, run times for each mesh was measured starting with a smallest number of processors on which the problem would fit in memory to some upper limit on the number of processors that produced only small reduction in execution time.
The objectives of the scaling study are: determination of the optimal number of elements per node, analysis of SIERRA Framework scaling separate from the linear solver scaling, and identification of opportunities for performance improvement. Fuego has an option to turn on detailed timer information that is useful in identifying the percentage of time spent in different regions and within each region. Figure 2 shows the execution time of the most compute intensive portion of these calculations, namely the computations associated with the Fuego/fluid region. In these simulations the time spent in the Calore region and the Syrinx region
are less than 10%. Looking for the knee of the curve in Figures 2, we can conclude that the optimal processor count for the coarse, medium, fine and very-fine meshes are: 128, 256, 512 and 1024. This is of course a conclusion based on the limited number of discrete processor configurations where we have measured the performance. At each of these configurations the execution time is close to one-half the execution time with half the number of processors. This corresponds to 4000 to 5000 elements per processor.
For the largest mesh, Red Storm gives a parallel
efficiency of 75% for the Fluid Region execution and 68% efficiency for the whole application at 1024 processors [1]. Figure 3 shows the parallel efficiencies for: the full application, the fluid region Execution, the fluid Region Matrix Assembly and the fluid region Matrix Solve. These plots use execution time data with the very-fine mesh. It is clearly seen from Figure 3, that the Matrix Assembly computations which involves the parallel gather/scatter operations to construct the coefficient matrix scales extremely well. This portion of the computations is a key component of the SIERRA framework. On the other hand the parallel efficiency of the Matrix Solve shows a linear decrease with close to 40% efficiency at 1024 processors. However this decrease in efficiency did not correlate with the average number of linear solve iterations for the continuity equation, with the number of linear solve iterations registering a slight increase from 40 iterations at 64 processors to 45 iterations at 1024 processors. Further instrumentation of the solvers is needed to understand the drop in efficiency.
FUEGO Performance; Execution Time
0:00:00
1:12:00
2:24:00
3:36:00
4:48:00
6:00:00
7:12:00
8:24:00
9:36:00
0 128 256 384 512 640 768 896 1024
Number of Processors
Exec
utio
n Ti
me,
hr:m
in:s
ec
Coarse MeshMedium MeshFine MeshVery-Fine Mesh
Figure 2. Execution times for the Fluid Region Computations
Table 1. Scaling Study Mesh Parameters
Coarse Medium Fine VeryFine Number of Elements
574903 1029452 2382951 4190729
Number of Nodes
599156 1064089 2435869 4271179
Time Step(secs)
0.008 0.004 0.002 0.001

30
III. CONCLUSION Our investigations indicate that Fuego will scale
well for an appropriately sized mesh consisting of at least 4000 elements per processor. The most time consuming portion of the simulations, registered an impressive 78% efficiency at 1024 processors. The challenge in scaling implicit codes is in using solvers with good scaling characteristics. While the ML solver used in these investigations shows good scaling based on the very slow growth in the number of solver iterations required, its parallel efficiency as measured by the time spent in the solver, should be improved. The SIERRA framework under which the bulk of the computations setting up the matrix for the solver, showed near perfect scaling for the range of processors considered.
REFERENCES
[1] M. Rajan, A. Black, and S. Domino, “Investigation of scaling performance and mesh convergence with Sandia’s ASC SIERRA/Fuego code for fire model predictions of heat flux,” proceedings of the Cray User Group Meeting, Lugano, Switzerland, 2006.
[2] Domino, S. P., Moen, C. D., Burns, S. P., and Evans, G. H., “SIERRA/Fuego: A Multi-Mechanics Fire Environment Simulation Tool,” AIAA Paper 2003-0149, 41st AIAA Aerospace Sciences Meeting, Reno, NV, January 2003.
FUEGO Very-Fine Mesh Parallel Efficiency for major Computational Sections
0
0.2
0.4
0.6
0.8
1
1.2
0 256 512 768 1024
Number of Processors
Par
allle
l Effi
cien
cy
Full ApplicationFluid Region Execution
Fluid Region Linear SolveFluid Region Matrix Assembly
Fluid Region Matrix Solve
Figure 3. Parallel efficiencies of key com-
ponents for the Very-Fine Mesh

31
12. A Probabilistic Model for Impact of OS Noise on Bulk-Synchronous Parallel Applications
Anand Ganti, Mahesh Rajan
Abstract
The effect of operating system noise on scalability of bulk-synchronous parallel applications is investigated using probabilistic models. We consider two models for synchronization: Master-Slave and Tree. In the first model the bulk synchronous local computations terminate with a sequential collection of results by the master. In the second model they end with a binary-tree all-reduce operation. We derive analytical expressions for the mean cycle time under noisy and noiseless conditions. The models are used to study the impact of model parameters such as noise arrival rate, duration, context switch overhead, on the mean cycle time. The details of the model are documented in Reference [1]. Work is in progress to validate the model with synthetic measurements on Red Storm.
I. OS NOISE IMPACT AND THE MODEL
Scalability of parallel applications is directly impacted by any variations in the execution time of each MPI task, which includes delays due to operating system daemons and interrupts. With the growing popularity of commodity clusters with thousands of processors, it is important to understand the impact of OS noise and its cumulative influence on parallel efficiency. While the effect of noise has been noted and measured on a number of systems, a rigorous probabilistic assessment has not received common scrutiny. Any attempt to model OS noise must consider some underlying computation model. Many applications are characterized by the bulk-synchronous parallel computation (BSPC) model consisting of a portion of time when each processor computes independently on local data, followed by a portion of time when some message exchange must take place before progressing to the next cycle. One simple mechanism to orchestrate the computations is for a master process to receive sequentially the results from the slave processes, before initiating the next cycle of computation. In another common
programming model, at the end of each independent compute portion, all processes call the MPI Allreduce function to determine a global quantity such as time step needed for the next cycle. The granularity of computation, measured as the ratio of compute time to the message exchange time within a cycle, impacts parallel efficiency. This is because the message exchange time is a function of the number of MPI tasks and the communication pattern.
In our analysis we present a detailed stochastic model for the bulk-synchronous computation. We model the OS noise as a Poisson process with arrival rate λ and each arrival taking time N and time C for context switching. We compute the mean cycle time as a function of the various input parameters. We quantify the benefit of minimizing the OS noise, such as using a Light Weight Kernel and also provide insight into scheduling OS noise processes. We consider two common synchronization scenarios at the end of each cycle. In the first analysis, corresponding to a simple master slave (MS-Model) parallel computation, we assume that the each cycle is terminated with the slave processes sequentially exchanging messages with the master process. For this case the mathematical expression for the difference in the expected value of cycle time is captured by a closed form analytical expression. In the second computation model we assume a MPI All-reduce operation is invoked at the end of each cycle. The All-reduce operation is modeled as a binary tree (BT-Model) and leads to a recursive equation in our model for the difference in the expected value of the cycle time.
Both the models rigorously incorporate the effect of noise interruptions in the middle of the synchronization operations. This entails accounting for the probability of interrupt during message exchange and incorporating the context switch and message restart/resend latency overheads. The models utility in understanding how the noise parameters influence the efficiency of
This document was prepared in November 2006.
32
computations is illustrated with a parameter analysis. The details can be found in Ref [1]. Future work remains to correlate the model with measurements. It is planned to use Red Storm as a baseline, with negligible OS noise, and then introduce through interrupts noise into a parallel program to mimic the model. Measurements of run time statistical characteristics would be compared with model prediction.
II. CONCLUSION
We have developed a mathematical framework to analyze the effect of OS noise on parallel applications. Work is in progress to validate the model with synthetic noise interrupts on Red Storm.
REFERENCES
[1] Ganti, and M. Rajan, “A Probabilistic Model for Impact of OS Noise on Bulk-Synchronous Parallel Applications,” in preparation for presentation.

33
13. Performance Modeling using Queue Theoretic Methods
Anand Ganti, Mahesh Rajan
Abstract
The aim of this research effort is to use queuing theory and Renewal Processes to study performance of HPC systems. Resource contention in HPC systems is a common place phenomenon. We want to construct analytic models of contention by modeling the demand for resources as a Renewal processes. The goal is to quantify performance metrics that would provide greater insight into contention, and the tradeoffs in various approaches for reducing contention. The presentation [1] referenced has a summary of the approach and basic theory.
I. BRIEF SUMMARY OF THE INVESTIGATION
What we hoped to accomplish in this research was to use an analytical approach to performance modeling. We wish to address resource contention in HPC systems by constructing models based on queuing theory and Renewal Processes. Possible situations where such a model might be applicable include:
1. Synthetic work load and parallel computer throughput
2. Parallel jobs contenting for I/O resource 3. Master/worker parallel algorithms
contending for the master 4. Processes in a SMP node contending for
memory or network access 5. Parallel job communication network delay
and contention
The biggest advantage of an analytical approach is that it provides explicit formulas for performance metrics in terms of the input parameters. The drawback of the analytical approach is that quite often simplifying assumptions need to be made about the inputs in order to make the model analytically tractable. The key then is to understand the robustness of the results to relaxations in the assumptions of the model.
There is a large body of work in Queuing theory that provides analytical expressions for performance metrics such as mean waiting time,
mean number of requests in the system, throughput and utilization of the system. The most famous result is Little’s Law which states that in steady state the mean number in a Queuing system is equal to the arrival rate times the mean waiting time of the system.
In general, the amount of explicit characterization the Queuing models provide is a function of how close the Queuing system is to a Markov process. In the case when service times and arrival times are independent Poisson processes as in M/M/m and M/M/m/m systems one can obtain expressions for the probability distribution of the occupancy, waiting time and busy periods in the system.
If one relaxes the assumption of the service process being Poisson, which normally isn’t true, then one obtains M/G/m systems. In the case where the number of servers m=1, the number of requests in the system forms a Semi-Markov Process and one can still obtain analytic, but not closed form, expressions for the probability distribution of the occupants. For general m, one can also obtain closed form expressions for the mean waiting time as a function of the first and second moments of the service time and arrival rates given by the famous Pollaczek-Khinchin formula.
Finally there are analytical models to study general arrival and service processes. The idea is to consider model arrivals and service times as Coxian distributions which are dense in probability distributions. One then considers an appropriate state, which incorporates the stages of the Coxian distribution and constructs an infinite state space Markov Process. The equations for the steady state distribution require sophisticated techniques to solve and the computation complexity increases rapidly with the number of stages of the Coxian distribution and the number of servers.
Work still remains to correlate model to measurements. To understand how this approach might be useful, we started with a simple memory contention measurements on a SMP node with 8 processors. Data were collected using PAPI
This document was prepared in November 2006.
34
instrumentation to measure memory contention using the simple streams benchmark as the application. Analysis and correlation of the data the model is yet to be undertaken.
REFERENCES
[1] M. Rajan and A. Ganti, “Performance Modeling Queue Theoretic Modeling,” presented at a Sandia Performance and Modeling Analysis Team meeting, June 15, 2005.

35
14. External Collaborations: Outreach to DoD Performance Improvement Efforts
R. Malins
I. INTRODUCTION While the mission of the ASC program is to
meet the needs of Science-Based Stockpile Stewardship, the program also has the intent to employ its technology accomplishments to benefit the broader National Security related HPC community. To pursue that intent in the specific case of this CSRF project, the ASC Outreach program collaborated with the CSRF project staff to connect project efforts to the corresponding efforts in the DoD HPC community. These outreach efforts were focused on the DoD's High Performance Computing Modernization Office (HPCMO) which sponsors efforts in benchmarking HPC platforms, modeling the performance of platforms and applications, and physics application profiling and optimization. Establishing dialogs with these DoD efforts provided opportunities • For comparing HPC performance needs in
order to assess which performance issues are unique to ASC's computational goals and which are broadly applicable to the National Security HPC community as a whole;
• For evaluating alternative approaches to performance measurement and modeling, to include bringing in measurement tools and models developed by the DoD;
• For exchanging performance measurement data between the two communities so that each has the benefit of a larger and richer database on which to base models;
• For identifying opportunities to evaluate Sandia solutions in alternative environments in order to assess their robustness;
• For creating one-on-one dialogs with DoD researchers addressing similar problems with similar tools.
Accomplishing these benefits was achieved by
way of a number of continuing interactions with key elements of the DoD HPCMO program and user base. The paragraph below synopsizes the interfaces between the CSRF project team and their
DoD counterparts. Included in the discussion are links to workshop reports and other documents that provide example details from the interactions.
II. PARTICIPATION IN THE HPCMO PERFORMANCE MEASUREMENT TEAM
(PMT) HPCMO PMT is comprised of staff from all four
Major Shared Resource Centers and the three Distributed Centers (these centers form the DoD-wide HPC enterprise which supports 4000+ DoD users from over 40 DoD R&D facilities across the country). The HPCMO PMT performs an annual benchmarking of all DoD owned platforms and annually releases benchmarks to vendors for testing their proposed platforms. HPCMO PMT maintains a suite of micro-benchmarks and a suite of physics application benchmarks for internal use and use by vendors.
Throughout the course of this CSRF project,
Sandia staff associated with the project regularly participated in the HPCMO PMT's meetings. The primary intent in this participation was to monitor DoD's employment of the Sandia codes CTH and LAMMPS as part of their physics application benchmark suite. As a result of this routine interaction, the CSRF project staff • Obtained scaling data for CTH and LAMMPS
when run on non-ASC platform architectures and when employing input decks representative of DoD problem sets;
• Obtained scaling data on these same architectures for a broad range of physics applications including ASC-like computational problems (e.g., computational structures and computational fluids) and non-ASC application areas (e.g., ocean modeling, weather forecasting, signal/image processing);
• Obtained a copy of the HPCMO micro-benchmark suite for evaluation;
• Established dialogs with other DoD users of

36
Sandia-developed HPC technology (e.g., Catamount/LWK and Lustre on DoD platforms) to get outside user feedback.
A representative sampling of HPCMO PMT
activities can be found in meeting reports [1-7].
III. PARTICIPATION IN HPCMO-SPONSORED PERFORMANCE MODELING
WORKSHOPS HPCMO funds continuing efforts to develop a
general purpose model of physics application performance on HPC platforms and supports periodic projects to characterize and improve the performance of high profile physics applications on key DoD platforms. Sandia participated in the HPCMO sponsored workshops held to review the progress and outcomes of these efforts. Participation brought the following benefits to the CSRF program: • Monitored development of HPCMO-funded
"PmaC" model; CSRF project staff brought this model in-house for evaluation early in the CSRF project and, at the time, it was not mature enough to meet project needs; however, the model has improved significantly and Sandia now preparing to evaluate it again.[8]
• Collaborated with DoD efforts to optimize the LAMMPS code for the two largest (at the time) platforms in the DoD inventory; several of the DoD-developed optimizations appear to have general applicability and are being incorporated into future LAMMPS releases.[9-10]
• Maintained a dialog with DoD application profiling and optimization support staff that support all the DoD Computational Technology Areas; this dialog brought an awareness of alternative techniques for evaluating codes and an offer of access to the DoD database of code profiling and tracing data for comparison to analogous data from Sandia efforts.
IV. TOPICAL INTERACTIONS WITH DOD
USERS ON CODE PERFORMANCE The contacts made in the above two venues
enabled a number of additional dialogs with the DoD HPC community. While DoD HPC establishment has a very "production computing" orientation, it is highly interested in improving code performance in order to maximize the throughput through limited resources. These topic-focused interactions have included the following: • Brought in DoD's benchmark physics
application for ocean modeling/forecasting in order to demonstrate the utility of ASC platforms for broader National Security applications; the initial demo addressed scaling on ASCI Red to show the benefits of a balanced architecture; unfortunately ASCI Red's limited memory presented difficulties; current discussions are considering scaling runs on Red Storm in order to compare Red Storm performance to DoD results on a commercial XT3.
• Presented results of Sandia performance evaluations at DoD HPCMO's annual User Group Conference; these presentations gathered feedback from DoD researchers and established dialogs to pursue further work.[11]
• Participated in the annual review of DoD's HPC User Needs and planned activities to address these needs; this participation provided insights into where ASC problems are unique and where they are shared in common with the rest of National Security HPC community.[12]
• Established dialogs with the DoD MSRCs to evaluate Sandia's Trilinos library of scalable solvers; the intent with these discussions is to show the robustness and broad applicability of this library to improving application performance; this discussion is still in progress and is being coordinated through the HPCMO main office.
• Monitored developments in the DARPA-funded High Productivity Computing Systems (HPCS) program in order to gain the benefits of their achievements; this interaction included hosting a site visit by the HPCS benchmark project lead[13] and this visit resulted in Sandia contributing to HPCS program in area of system reliability and supportability.[14]

37
V. SUMMARY AND ASSESSMENT
The DoD HPC community has a different
perspective on HPC performance than the ASC program. The DoD is actively developing new military systems and, as a result, its use of HPC is focused on throughput of existing simulations to meet design development milestones. DoD's efforts to improve performance are complementary to work in this CSRF project. Their tools offer new approaches and their data can help by being an external, independent reference for evaluating Sandia-developed performance models. In addition, the DoD might benefit from ASC's efforts to develop next generation simulations and platforms, provided Sandia's advances are relevant to the physics problems driving the design of new military systems. Hence, a close working relationship with the DoD HPC community for performance modeling and measurement will benefit National Security as a whole.
REFERENCES
1. Malins, R. J., “After Action Report,” DoD High Performance Computing Modernization Office Benchmarking Team Meeting, Naval Oceanographic Office, February 18-19, 2004.
2. Malins, R. J., “After Action Report,” DoD High Performance Computing Modernization Office Performance Measurement Team Meeting, Army Engineer R&D Center, September 29-30, 2004.
3. Malins, R. J., “After Action Report,” DoD High Performance Computing Modernization Office Performance Measurement Team Meeting, San Diego Supercomputing Center, January 26-27, 2005.
4. Malins, R. J., “After Action Report,” DoD High Performance Computing Modernization Office Performance Measurement Team Meeting, San Diego Supercomputing Center, December 13-15, 2005.
5. Malins, R. J., “After Action Report,” DoD High Performance Computing Modernization Office Performance Measurement Team Meeting, Vicksburg, MS, August 15-16, 2006.
6. Malins, R. J., “After Action Review,” DoD High Performance Computing Modernization Office Performance Modeling and Code Profiling Workshop, San Diego, CA,
September 05-06, 2006. 7. Malins, R. J., “After Action Review,” DoD
High Performance Computing Modernization Office Performance Measurement Team Meeting, Wright-Patterson AFB, OH, October 17-18, 2006.
8. Carrington, L. C., Gao, X., Wolter, N., Snavely, A., and Campbell, R. L., “Performance Sensitivity Studies for Strategic Applications,” Proceedings of the DoD Users Group Conference, 2005.
9. Fischer, J., Richie, D. A., Natoli, V., “Final Project Technical Report: Optimization of LAMMPS Molecular Dynamics Code,” HPCMO User Productivity Enhancement and Technology Transfer Program, June, 2006.
10. Fischer, J., Natoli, V., and Richie, D., “Optimization of LAMMPS,” Users Group Conference, June, 2006.
11. Malins, R. J., “Sandia National Laboratories Presentations at the DoD High Performance Computing Modernization Office’s (HPCMO) 2006 Users Group Conference,” July 2006.
12. Malins, R. J., “After Action Report,” DoD High Performance Computing Modernization Office Performance User Productivity Enhancement & Technology Transfer (PET) Program Review, Ohio Supercomputing Center, March 21-24, 2006.
13. Malins, R. J., “After Action Report,” Working Meeting on DARPA HPCS/Petascale Challenges, Sandia National Laboratories, Albuquerque, NM, March 31, 2005.
14. Stearley, J., “Defining and Measuring Supercomputer Reliability, Availability, and Serviceability (RAS),” DARPA HPCS Team & PI Meeting, Reston, VA, June 29, 2005.
38
15. Database Management System Development
Ryan D. Scott*
I. INTRODUCTION
During Summer 2006, work was begun on developing a Python-based script-based data mining and database management system for the Performance Modeling and Analysis Team project. The purpose of this effort is to develop web-based tools to aid in quickly analyzing large datasets created in the process of determining performance metrics for Sandia’s compute clusters and supercomputers. Results from these analyses may be used to determine hardware bottlenecks, to aid in efficiently mapping software to hardware, and to aid in determining metrics for future computer acquisitions.
Python was chosen as the programming language. Python code has the characteristics of being a high-level, clean-syntax language with built-in data structures. Also, it is object oriented, has a huge standard library, and is platform independent.
II. METHODOLOGY
With Sue Goudy, the overall structure and scope
of the desired system was strategized and mapped. Various technologies that might facilitate the development were investigated for the project. Also, collaborations were held with Bob Balance who had developed a similar system to the one we were proposing.
Later, with Daniel Barnette, a proof-of-concept
model was created for managing the type of large datasets which might be generated from benchmarking codes, structural codes, or computational fluid dynamics (CFD) codes, for example. Work was begun on • Documenting requirements and specifications
for the end product; • diagramming database schema proposals and
activity diagrams in UML; • coding simple Python scripts to check the
feasibility of the proposed requirements, including the capabilities of the available technologies and the security issues attached to them
• writing Python scripts to access the SMSS and download data; this makes the SMSS look like a Virtual File System, or VFS.
An example of the proposed use of this database
management system is for CFD data. In this case, the NASA CFD code OVERFLOW[1] outputs flow field data in standardized PLOT3D[2] format. Using our database management system to analyze the data then requires the following steps. Python scripts access the SMSS, download Plot3d files to a user’s local machine, mine the number of grid blocks and dimensions from those files, and then upload that data to a mySQL database. That data is then accessible from the Performance Modeling Database System webpage http://www-irn.sandia.gov/perfmod. This web-page is a portal from which a user will be able to securely login and view the mined data in a variety of formats.
III. RESULTS The work done over Summer 2006 provided a
good start for the database management system. Results obtained to-date as well as proposed future efforts were presented at the annual Sandia Student Symposium [3].
IV. FUTURE PLANS Future plans for this project include the
expansion of supported data types on the SMSS. Currently, only Plot3d files are supported. This will be expanded to at least one other data analysis file type. A new virtual file system is also in development that will aid in the indexing of files on the SMSS as well as the extraction of metadata found in those files. The new VFS may later be employed as a means of indexing and categorizing
* This work was performed during Summer 2006. The effort is continuing while Mr. Scott, a year-round Sandia intern, is attending Brigham Young University as a senior during the 2006-7 academic year.
39
files on any number of file systems, possibly enabling other organizations with various but similar needs to integrate these tools.
An overhaul to the webpage is also in future
plans. This will include a more robust security platform, user controls allowing direct access to the VFS and SMSS, capability to export plots and graphs to Excel, and interoperability with well-known 3rd party and/or open source plotting programs such as Excel, Plot3d, Tecplot, and Gnu Plot.
V. SUMMARY
The goal of this effort is to create a tool that can
aid the user in managing, extracting data from, and graphically viewing very large datasets, thereby providing tangible benefits to the Performance Modeling and Analysis Team as well as others. Significant progress has been made toward this end, but much work remains to be done. Once completed, the proposed database management system will be a tool that is easy to use and, being
Python based, easily portable to other operating systems.
REFERENCES
[1] R.H. Nichols, R.W. Tramel, and P.G. Buning, “Solver and Turbulence Model Upgrades to OVERFLOW 2 for Un-steady and High-Speed Applications,” AIAA-2006-2824, AIAA 36th Fluid Dynamics Conference, San Francisco, CA, June 2006.
[2] P.P. Walatka, P.G. Buning, L. Pierce, and P.A. Elson, “PLOT3D User's Manual,” NASA TM 101067, March 1990.
[3] R. D. Scott, “Automated Data Indexing and Web-based Management Systems,” presented at the Sandia Student Symposium, Albuquerque Convention Center, Albuquerque, New Mexico, August 2006.

40
16. Future Analyses, Plans, and Approaches
J. Ang, D. Barnette, R. Benner, R. Malins, M. Rajan, C. Vaughan
Over the next year, and into the future, the team’s efforts will be directed toward performance modeling and analyses required by Next Generation System (NGS) specifications. The team will take lessons learned from the CSRF-funded efforts and extend them to new efforts defined by NGS. Directed, prioritized efforts will necessarily depend on funding levels, staffing, and staffing expertise. The randomly-ordered, non-prioritized wish-list of items currently under consideration is given below.
1. Light-Weight Kernel (LWK) vs. Linux comparisons 2. Mesh vs. Fat Tree interconnect comparisons 3. Light-Weight File System (LWFS) 4. DoD’s High Performance Computing Modernization Office’s (HPCMO) synthetic benchmark suite 5. OS Noise 6. Parallel discrete event simulators 7. MPI, OpenMP, and P-threads investigations 8. Single- vs. Multi-cpu issues (a.k.a., Single- vs. Multi-MPI tasks) 9. Models for
a. ITS b. CTH c. HPCC d. Linpack e. DSMC Icarus
10. Quantify the performance impact of Cray’s baseline node allocation algorithm vs. Sandia’s R&D100 award winning allocator for different application types.
11. Quantify the performance impact of generic vs. accelerated Portals on Red Storm for various application types.
12. Publish in computer architecture and system software journals 13. Participate in conferences 14. Develop better understanding of performance modeling strengths and weaknesses of external
organizations 15. Research relevant areas in prediction and improvements in performance modeling analyses that
strongly impact Red Storm’s follow-on system 16. Desire to impact performance characteristics of codes before, or as, they are written (difficult due to
legacy code being used in newer codes) 17. Closely examine cluster vs. MPP performance characteristics (e.g., Sandia’s Thunderbird vs. Red
Storm) 18. Investigate performance characteristics of newer architectures with cpu accelerators, cell processors,
and processors in memory (PIMs).
41
17. PMAT Presentations and Publications by Author
The references below represent a wide cross-section of presentations and publications in which the core Performance Modeling and Analysis Team has been involved in the past few years. Authors are listed in alphabetical order. Multiply-authored articles are listed under the primary or responsible author’s name only or, if that author is not directly associated with the core PMAT team, under the first PMAT team member’s name. This is a representative, non-exhaustive list of presentations and publications.
1. Ang, J.
• Ang, J. A., “CSRF Focus Project: Next Generation Systems (NGS),” Department Meeting, Sandia National Labs, August 2006, SAND2007-0305P.
2. Barnette, D.
• Barnette, D. W., “Performance Analysis of OVERFLOW on Sandia Compute Clusters,” presented at the DoD High Performance Computing Modernization Project’s Users Group Conference, Denver, CO, June 27, 2006.
3. Benner, R.
• Benner, R.E. and Rajan, M. “What JUMBO Mode did for Alegra, Salinas, Fuego and Others”, ASC PI Meeting, Feb 21-24, 2005, San Antonio, Texas.
4. Ganti, A.
• A. Ganti, and M. Rajan, “A Probabilistic Model for Impact of OS Noise on Bulk-Synchronous Parallel Applications,” in preparation for presentation.
5. Goudy, S.
• Goudy, S. P., “Performance Modeling of CTH Run Times on MPP and Cluster Platforms,” presented at the DoD High Performance Computing Modernization Program Users Group Conference, June 2006.
• Goudy, S., Wen, Z., and Rajan, M., “Zapotec Complexity,” June 2004.
• Goudy, S., “Development of a Modeling Methodology for Hybrid Parallelism,” PhD dissertation, New Mexico Tech, Socorro, New Mexico, May 2005, SAND2005-2876P.
• Goudy, S. P., “Performance Modeling of CTH Run Times on MPP and Cluster Platforms,” presented at the DoD High Performance Computing Modernization Program Users Group Conference, June 2006.
• Goudy, S., and Rajan, M., “CTH Model with Load Imbalance.”
• Goudy, S., Liebrock, L., and Schaffer, S., “Performance Analysis of a Hybrid Parallel Linear Algebra Kernel,” paper presented at New Mexico Tech, Socorro, New Mexico, May 2004.
• Ibid, vugraphs.
• Goudy, Sue, Lorie Liebrock, Steve Schaffer, “Performance Analysis of a Hybrid Parallel Linear Algebra Kernel,” Linux Clusters: The HPC Revolution, LCI Conference, Austin TX, April, 2004.
• Brightwell, R., Goudy, S., Rodrigues, A., Underwood, K., “Implications of Application Usage Characteristics for Collective Communication Offload ,” International Journal of High-Performance Computing and Networking - Special Issue: Design and Performance Evaluation of Group Communication in Parallel and Distributed Systems, Volume 4, Issue 2, 2006.
• Brightwell, Ron, Sue Goudy, Keith D. Underwood, “A Preliminary Analysis of the MPI Queue Characteristics of Several Applications,” International Conference on Parallel Processing, June 2005.

42
6. Leland, R.
• Leland, R., “Effectiveness of Platforms on Engineering Codes,” JASONs Review Report, Sandia National Laboratory OUO document, September 2004.
• Doebling, S., Leland, R., and Rathkopf, J., “The FY05 ASC Level 1 Milestone Report: Requirements to Move to Petaflop Platform,” presented at the 2005 Salishan Conference on High-Speed Computing, Gleneden Beach, OR, April 18-21, 2005.
7. Malins, R.
• Malins, R. J., “Sandia National Laboratories Presentations at the DoD High Performance Computing Modernization Office’s (HPCMO) 2006 Users Group Conference,” July 2006.
8. Rajan, M.
• M. Rajan, B. Franke, R. Benner, R. Kensek, and T. Laub, “Performance Analysis, Modeling and Enhancement of Sandia’s Integrated TIGER Series(ITS) Coupled Electron/Photon Monte Carlo Transport Code,” Proceedings of LACSI Symposium, Santa Fe, NM, Oct 11-13, 2005.
• M.Rajan, A.Black, S. Domino, “Investigation of scaling performance and mesh convergence with Sandia’s ASC SIERRA/Fuego code for fire model predictions of heat flux,” proceedings of the Cray User Group Meeting, Lugano, Switzerland, 2006.
• M. Rajan and A. Ganti, “Performance Modeling Queue Theoretic Modeling,” presented at a Sandia Performance and Modeling Analysis Team meeting, June 15, 2005.
9. Scott, R.
• R. D. Scott, “Automated Data Indexing and Web-based Management Systems,” presented at the Sandia Student Symposium, Albuquerque Convention Center, Albuquerque, New Mexico, August 2006.
10. Vaughan, C.
• C. T. Vaughan, S. P. Goudy, “Analysis of an Application on Red Storm”, Proceedings, Cray User Group 2006 Conference, Lugano, Switzerland, May 2006.

43
18. References
Below is a complete listing of references for each section in the report.
1. Introduction
2. JASONs Review Support
[1] Leland, R., “Effectiveness of Platforms on Engineering Codes,” JASONs Review Report, Sandia National Laboratory OUO document, September 2004.
3. Janus Jumbo Simulation
[1] Benner, R.E. and Rajan, M. “What JUMBO Mode did for Alegra, Salinas, Fuego and Others”, ASC PI Meeting, Feb 21-24, 2005, San Antonio, Texas.
4. Requirements to Move to a Petaflop Platform: ASC Level I Milestone Support
[1] Scott Doebling, LANL, Rob Leland, SNL, and Jim Rathkopf, LLNL, “FY05 ASC Level 1 Milestone Report – Requirements to Move to Petaflop Platform,” presented at the 2005 Salishan Conference on High-Speed Computing, Gleneden Beach, OR, April 18-21, 2005.
5. Quick-Look Study of Opteron Single vs. Dual Core Performance
[1] Piotr Luszczek, “HPC Challenge Benchmark,” presented at SC2004, November 6-12, 2004, Pittsburgh, PA.
6. Red Storm Scaling Studies
[1] Red Storm Scaling Studies, SAND report, in preparation.
7. Performance Analysis of the OVERFLOW Computational Fluid Dynamics Code
[1] R.H. Nichols, R.W. Tramel, and P.G. Buning, “Solver and Turbulence Model Upgrades to OVERFLOW 2 for Unsteady and High-Speed Applications,” AIAA-2006-2824, AIAA 36th Fluid Dynamics Conference, San Francisco, CA, June 2006.
[2] P.P. Walatka, P.G. Buning, L. Pierce, and P.A. Elson, "PLOT3D User's Manual," NASA TM 101067, March 1990.
[3] Tecplot 360, http://www.tecplot.com/products/360/360_main.htm
[4] D. W. Barnette, “Performance Analysis of OVERFLOW on Sandia Compute Clusters,” presented at the DoD HPCMO Users Group Conference, Denver, Colorado, June 2006.
8. Performance Analysis and Modeling of Sandia’s Integrated TIGER Series (ITS) Coupled Electron/Photon Monte Carlo Transport Code
[1] M.Rajan, B.Franke, R. Benner, R. Kensek, and T. Laub, “Performance Analysis, Modeling and Enhancement of Sandia’s Integrated TIGER Series(ITS) Coupled Electron/Photon Monte Carlo Transport Code”, Proceedings of LACSI Symposium, Santa Fe, NM, Oct-11-13 2005.
9. CTH Analytical and Hybrid Modeling
[1] Benner, R.E. and Rajan, M. “What JUMBO Mode did for Alegra, Salinas, Fuego and Others”, ASC PI Meeting, Feb 21-24, 2005, San Antonio, Texas.
[2] Ibid, in Russian.
[3] Goudy, S., Wen, Z., and Rajan, M., “Zapotec Complexity,” June 2004.
44
[4] Goudy, S., “Development of a Modeling Methodology for Hybrid Parallelism,” PhD dissertation, New Mexico Tech, Socorro, New Mexico, May 2005, SAND2005-2876P.
[5] Goudy, S. P., “Performance Modeling of CTH Run Times on MPP and Cluster Platforms,” presented at the DoD High Performance Computing Modernization Program Users Group Conference, June 2006.
[6] Goudy, S., and Rajan, M., “CTH Model with Load Imbalance.”
[7] Goudy, S., Liebrock, L., and Schaffer, S., “Performance Analysis of a Hybrid Parallel Linear Algebra Kernel,” paper presented at New Mexico Tech, Socorro, New Mexico, May 2004.
[8] Ibid, vugraphs.
10. Run-Time Performance Model for Sandia’s Hydrodynamics Code CTH
[1] C. T. Vaughan, S. P. Goudy, “Analysis of an Application on Red Storm”, Proceedings, Cray User Group 2006 Conference, Lugano, Switzerland.
[2] E. S. Hertel, Jr., R. L. Bell, M. G. Elrick, A. V. Farnsworth, G. I. Kerley, J. M. McGlaun, S. V. Petney, S. A. Silling, P. A. Taylor, L. Yarrington, “CTH: A Software Family for Multi-Dimensional Shock Physics Analysis,” Proceedings, 19th International Symposium on Shock Waves 1, 274ff (Université de Provence, Provence, France) (1993).
[3] S. P. Goudy, “Development of a Modeling Methodology for Hybrid Parallelism,” PhD Dissertation, NM Tech, May 2005, SAND2005-2876P.
11. Investigations on Scaling Performance of SIERRA/Fuego
[1] M.Rajan, A.Black, S. Domino, “Investigation of scaling performance and mesh convergence with Sandia’s ASC SIERRA/Fuego code for fire model predictions of heat flux,” proceedings of the Cray User Group Meeting, Lugano, Switzerland, 2006.
[2] Domino, S. P., Moen, C. D., Burns, S. P., and Evans, G. H., 2003, “SIERRA/Fuego: A Multi-Mechanics Fire Environment Simulation Tool,” AIAA Paper 2003-0149, 41st AIAA Aerospace Sciences Meeting, Reno, NV, January 2003.
12. A Probabilistic Model for Impact of OS Noise on Bulk-Synchronous Parallel Applications
[1] A. Ganti and M. Rajan, “A Probabilistic Model for Impact of OS Noise on Bulk-Synchronous Parallel Applications,” in preparation for presentation.
13. Performance Modeling using Queue Theoretic Methods
[1] M. Rajan and A. Ganti, “Performance Modeling Queue Theoretic Modeling,” presented at a Sandia Performance and Modeling Analysis Team meeting, June 15, 2005.
14. External Collaborations: Outreach to DoD Performance Improvement Efforts
[1] Malins, R. J., “After Action Report,” DoD High Performance Computing Modernization Office Benchmarking Team Meeting, Naval Oceanographic Office, February 18-19, 2004.
[2] Malins, R. J., “After Action Report,” DoD High Performance Computing Modernization Office Performance Measurement Team Meeting, Army Engineer R&D Center, September 29-30, 2004.
[3] Malins, R. J., “After Action Report,” DoD High Performance Computing Modernization Office Performance Measurement Team Meeting, San Diego Supercomputing Center, January 26-27, 2005.
[4] Malins, R. J., “After Action Report,” DoD High Performance Computing Modernization Office Performance Measurement Team Meeting, San Diego Supercomputing Center, December 13-15, 2005.

45
[5] Malins, R. J., “After Action Report,” DoD High Performance Computing Modernization Office Performance Measurement Team Meeting, Vicksburg, MS, August 15-16, 2006.
[6] Malins, R. J., “After Action Review,” DoD High Performance Computing Modernization Office Performance Modeling and Code Profiling Workshop, San Diego, CA, September 05-06, 2006.
[7] Malins, R. J., “After Action Review,” DoD High Performance Computing Modernization Office Performance Measurement Team Meeting, Wright-Patterson AFB, OH, October 17-18, 2006.
[8] Carrington, L. C., Gao, X., Wolter, N., Snavely, A., and Campbell, R. L., “Performance Sensitivity Studies for Strategic Applications,” Proceedings of the DoD Users Group Conference, 2005.
[9] Fischer, J., Richie, D. A., Natoli, V., “Final Project Technical Report: Optimization of LAMMPS Molecular Dynamics Code,” HPCMO User Productivity Enhancement and Technology Transfer Program, June, 2006.
[10] Fischer, J., Natoli, V., and Richie, D., “Optimization of LAMMPS,” Users Group Conference, June, 2006.
[11] Malins, R. J., “Sandia National Laboratories Presentations at the DoD High Performance Computing Modernization Office’s (HPCMO) 2006 Users Group Conference,” July 2006.
[12] Malins, R. J., “After Action Report,” DoD High Performance Computing Modernization Office Performance User Productivity Enhancement & Technology Transfer (PET) Program Review, Ohio Supercomputing Center, March 21-24, 2006.
[13] Malins, R. J., “After Action Report,” Working Meeting on DARPA HPCS/Petascale Challenges, Sandia National Laboratories, Albuquerque, NM, March 31, 2005.
[14] Stearley, J., “Defining and Measuring Supercomputer Reliability, Availability, and Serviceability (RAS),” DARPA HPCS Team & PI Meeting, Reston, VA, June 29, 2005.
15. Database Management System Development
[1] R.H. Nichols, R.W. Tramel, and P.G. Buning, "Solver and Turbulence Model Upgrades to OVERFLOW 2 for Unsteady and High-Speed Applications," AIAA-2006-2824, AIAA 36th Fluid Dynamics Conference, San Francisco, CA, June 2006.
[2] P.P. Walatka, P.G. Buning, L. Pierce, and P.A. Elson, "PLOT3D User's Manual," NASA TM 101067, March 1990.
[3] R. D. Scott, “Automated Data Indexing and Web-based Management Systems”, presented at the Sandia Student Symposium, Albuquerque Convention Center, Albuquerque, New Mexico, August 2006.
16. Future Analyses, Plans, and Approaches
17. PMAT Presentations and Publications

46
Appendix - Computer Descriptions
Supercomputers and clusters involved in modeling and analysis by the PMAT team are listed in the table
below along with relevant web sites. Detailed specifications of these and other machines are given here: http://www.ran.sandia.gov/analyst/cgi-bin/m_info.cgi
# Host name Descriptive website Misc. Comments
1. Spirit https://computing.sandia.gov/platforms/spirit
2. Liberty https://computing.sandia.gov/platforms/liberty
3. Red Squall http://www.cs.sandia.gov/platforms/RedSquall.html
4. Thunderbird http://www.cs.sandia.gov/platforms/Thunderbird.html
5. Red Storm http://www.cs.sandia.gov/platforms/RedStorm.html
6. ASCI Red http://www.sandia.gov/ASCI/Red Decommissioned
7. CPlant http://www.cs.sandia.gov/cplant Decommissioned
8. VPlant http://www.cs.sandia.gov/capabilities/ScalableIO
9. BlueGene/L http://www.llnl.gov/asc/computing_resources/bluegenel
10. ASC Purple http://www.llnl.gov/asc/computing_resources/purple

47
Internal Distribution
MS Org Name Copies MS Org Name Copies
1179 1341 T. Laub 1 1179 1341 B. Franke 1
1322 1400 S. Dosanjh 1
1318 1410 W. Camp 1
1318 1411 S. Mitchell 1
1316 1412 M. Rintoul 1
1320 1414 S. Collis 1
1318 1415 S. Rountree 1
1318 1416 A. Salinger 1
1322 1420 J. Tomkins 1
0376 1421 T. Blacker 1
1319 1422 J. Ang 1 1319 1422 D. Doerfler 1 1319 1422 D. Barnette 5 1319 1422 R. Benner 5 1319 1422 S. Kelly 1 1319 1422 R. Scott 1 1319 1422 J. Stearley 1 1319 1422 C. Vaughan 5
1319 1423 N. Pundit 1 1319 1423 R. Brightwell 1 1319 1423 R. Murphy 1 1319 1423 K. Pedretti 1 1319 1423 R. Riesen 1 1319 1423 A. Rodrigues 1 1319 1423 K. Underwood 1 1319 1423 J. VanDyke 1
0321 1430 J. Nelson 1
0378 1431 R. Summers 1
0370 1433 J. Strickland 1 0370 1433 M. Taylor 1
1322 1435 J. Aidun 1
0316 1437 S. Hutchinson 1
0382 1541 S. Domino 1
0828 1544 A. Black 1
0139 1904 R. Malins 5
0813 4311 R. Cahoon 1
0823 4320 J. Zepper 1
0823 4324 F. Jaramillo 1 0823 4324 C. Leishman 1
0823 4326 D. Pavlakos 1 0807 4326 M. Davis 1 0807 4326 K. Haskell 1 0807 4326 H. Meyer 1 0807 4326 M. Rajan 5 0807 4326 J. Stevenson 1 0807 4326 J. Sturtevant 1
0807 4328 J. Noe 1 0807 4328 R. Ballance 1 1319 4328 M. Barnaby 1 0807 4328 V. Kuhns 1 0807 4328 P. Sanchez 1 0823 4328 S. Taylor 1 1303 4328 B. Swartz 1
0832 4335 J. Dexter 1
0806 4336 L. Stans 1 0806 4336 A. Ganti 1
0801 4340 D. White 1
1185 5417 S. Goudy 2
9153 8810 J. Handrock 1
9158 8961 C. Janssen 1
9152 8963 J. Friesen
1
9018 8944 Central Technical Files
2
0899 4536 Technical Libray
2