Embed Size (px)
Citation preview
Nobel Prize® and the Nobel Prize® medal design mark are registrated trademarks of the Nobel Foundation
8 OCTOBER 2014
Scientific Background on the Nobel Prize in Chemistry 2014
S U P E R-R E S O LV E D F L U O R E S C E N C E M I C RO S C O P Y
THE ROYAL SWEDISH ACADEMY OF SCIENCES has as its aim to promote the sciences and strengthen their influence in society.
BOX 50005 (LILLA FRESCATIVÄGEN 4 A), SE-104 05 STOCKHOLM, SWEDEN TEL +46 8 673 95 00, [email protected] HTTP://KVA.SE

1 (15)
Super-resolved fluorescence microscopy
The Royal Swedish Academy of Sciences has decided to award Eric Betzig, Stefan W. Hell and
W. E. Moerner the Nobel Prize in Chemistry 2014 for the development of super-resolution
fluorescence microscopy.
1. Abbe’s diffraction limit
Towards the end of the nineteenth century Ernst Abbe (Abbe, 1873) and Lord Rayleigh
(Rayleigh, 1896) formulated what is commonly known as the “diffraction limit” for microscopy.
Roughly speaking, this limit states that it is impossible to resolve two elements of a structure
which are closer to each other than about half the wave length (λ) in the lateral (x,y) plane and
even further apart in the longitudinal plane (z). In other words, the minimal distances (δxmin,
δymin) that, according to Abbe’s criterion, can be resolved in the lateral plane are approximated
by
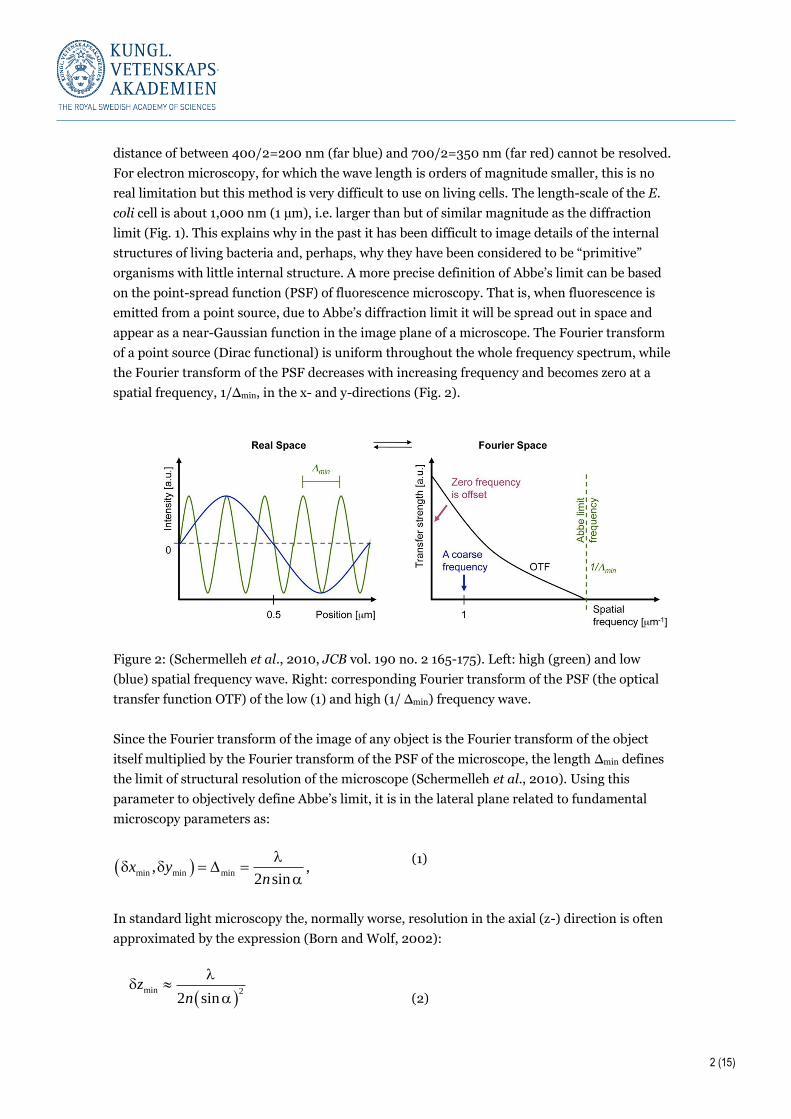
Another consequence of the same diffraction limitation is that it is not possible to focus a laser
beam to a spot of smaller dimension than about λ/2 (Fig. 1).
Figure 1: (Huang et al., 2010, Cell, 143, 1047 – 57). A: (left) Focused laser beam, (middle)
structure, (right) resolved (A) and not resolved (B) structural features. B: from left to right
mammalian cell, E. coli cell, mitochondrion, influenza virus, ribosome, GFP, thymine.
In the case of light (optical) microscopy, which is, together with electron microscopy, the most
important tool for the imaging of biological structures, this means that two objects within a
min min, / 2x y
2 (15)
distance of between 400/2=200 nm (far blue) and 700/2=350 nm (far red) cannot be resolved.
For electron microscopy, for which the wave length is orders of magnitude smaller, this is no
real limitation but this method is very difficult to use on living cells. The length-scale of the E.
coli cell is about 1,000 nm (1 µm), i.e. larger than but of similar magnitude as the diffraction
limit (Fig. 1). This explains why in the past it has been difficult to image details of the internal
structures of living bacteria and, perhaps, why they have been considered to be “primitive”
organisms with little internal structure. A more precise definition of Abbe’s limit can be based
on the point-spread function (PSF) of fluorescence microscopy. That is, when fluorescence is
emitted from a point source, due to Abbe’s diffraction limit it will be spread out in space and
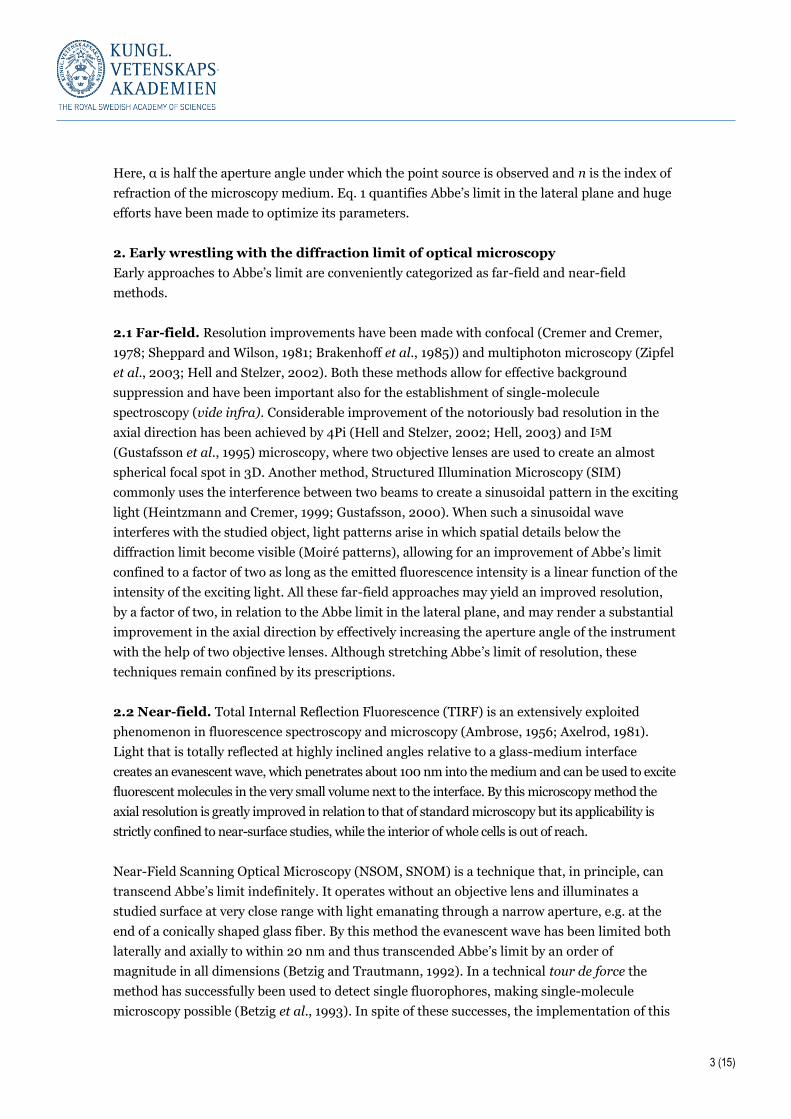
appear as a near-Gaussian function in the image plane of a microscope. The Fourier transform
of a point source (Dirac functional) is uniform throughout the whole frequency spectrum, while
the Fourier transform of the PSF decreases with increasing frequency and becomes zero at a
spatial frequency, 1/Δmin, in the x- and y-directions (Fig. 2).
Figure 2: (Schermelleh et al., 2010, JCB vol. 190 no. 2 165-175). Left: high (green) and low
(blue) spatial frequency wave. Right: corresponding Fourier transform of the PSF (the optical
transfer function OTF) of the low (1) and high (1/ Δmin) frequency wave.
Since the Fourier transform of the image of any object is the Fourier transform of the object
itself multiplied by the Fourier transform of the PSF of the microscope, the length Δmin defines
the limit of structural resolution of the microscope (Schermelleh et al., 2010). Using this
parameter to objectively define Abbe’s limit, it is in the lateral plane related to fundamental
microscopy parameters as:
(1)
In standard light microscopy the, normally worse, resolution in the axial (z-) direction is often
approximated by the expression (Born and Wolf, 2002):
(2)
min min min, ,2 sin
x yn
min 2
2 sinz
n
3 (15)
Here, α is half the aperture angle under which the point source is observed and n is the index of
refraction of the microscopy medium. Eq. 1 quantifies Abbe’s limit in the lateral plane and huge
efforts have been made to optimize its parameters.
2. Early wrestling with the diffraction limit of optical microscopy
Early approaches to Abbe’s limit are conveniently categorized as far-field and near-field
methods.
2.1 Far-field. Resolution improvements have been made with confocal (Cremer and Cremer,
1978; Sheppard and Wilson, 1981; Brakenhoff et al., 1985)) and multiphoton microscopy (Zipfel
et al., 2003; Hell and Stelzer, 2002). Both these methods allow for effective background
suppression and have been important also for the establishment of single-molecule
spectroscopy (vide infra). Considerable improvement of the notoriously bad resolution in the
axial direction has been achieved by 4Pi (Hell and Stelzer, 2002; Hell, 2003) and I5M
(Gustafsson et al., 1995) microscopy, where two objective lenses are used to create an almost
spherical focal spot in 3D. Another method, Structured Illumination Microscopy (SIM)
commonly uses the interference between two beams to create a sinusoidal pattern in the exciting
light (Heintzmann and Cremer, 1999; Gustafsson, 2000). When such a sinusoidal wave
interferes with the studied object, light patterns arise in which spatial details below the
diffraction limit become visible (Moiré patterns), allowing for an improvement of Abbe’s limit
confined to a factor of two as long as the emitted fluorescence intensity is a linear function of the
intensity of the exciting light. All these far-field approaches may yield an improved resolution,
by a factor of two, in relation to the Abbe limit in the lateral plane, and may render a substantial
improvement in the axial direction by effectively increasing the aperture angle of the instrument
with the help of two objective lenses. Although stretching Abbe’s limit of resolution, these
techniques remain confined by its prescriptions.
2.2 Near-field. Total Internal Reflection Fluorescence (TIRF) is an extensively exploited
phenomenon in fluorescence spectroscopy and microscopy (Ambrose, 1956; Axelrod, 1981).
Light that is totally reflected at highly inclined angles relative to a glass-medium interface
creates an evanescent wave, which penetrates about 100 nm into the medium and can be used to excite
fluorescent molecules in the very small volume next to the interface. By this microscopy method the
axial resolution is greatly improved in relation to that of standard microscopy but its applicability is
strictly confined to near-surface studies, while the interior of whole cells is out of reach.
Near-Field Scanning Optical Microscopy (NSOM, SNOM) is a technique that, in principle, can
transcend Abbe’s limit indefinitely. It operates without an objective lens and illuminates a
studied surface at very close range with light emanating through a narrow aperture, e.g. at the
end of a conically shaped glass fiber. By this method the evanescent wave has been limited both
laterally and axially to within 20 nm and thus transcended Abbe’s limit by an order of
magnitude in all dimensions (Betzig and Trautmann, 1992). In a technical tour de force the
method has successfully been used to detect single fluorophores, making single-molecule
microscopy possible (Betzig et al., 1993). In spite of these successes, the implementation of this

4 (15)
technique remains technically cumbersome and its applications have remained limited to
surface studies. The scientific and technical breakthrough in super-resolved fluorescence
microscopy has instead come in the form of far-field excitation techniques of two main types, as
will be described in the next section.
3. Discovery of super-resolved fluorescence microscopy
To date there are two far-field principles that lead to fluorescence-based microscopy with a
resolution far beyond Abbe’s famous limit. The first is here referred to as “super-resolved ensemble
fluorophore microscopy” and the second as “super-resolved single fluorophore microscopy”.
The first principle was originally conceived as and implemented by stimulated emission
depletion (STED) of fluorescence from all molecules in a sample except those in a small region
of the studied object. With saturating stimulated emission, the “active” region can be made
arbitrarily smaller than the diffraction-limited size. By scanning the light spot defining the
fluorescing region across the studied object and monitoring the fluorescence emission
continuously a computer reconstruction of the object can be obtained (Hell, 2000). The
principle can also be implemented by Saturated Structural Illumination Microscopy (SSIM)
(Gustafsson, 2005). These methods can be used when the fluorescing regions contain ensembles
of fluorophores as well as single fluorophores and are therefore generically referred to as
“Super-resolved ensemble fluorophore microscopy”. Their common denominator is that
saturation of the excitation peaks in SSIM and saturation of the stimulated emission in STED
both create spatial frequencies much higher than those allowed by Abbe’s limit (Fig. 2). Their
discovery had two distinct phases. The first relates to the theoretical descriptions of the methods
and the second to their experimental implementation.
The second principle is based on the a priori knowledge that virtually all photons from an object
detected at a given time come from single fluorophores that are separated from each other by
distances larger than Abbe’s limit (Eq. 1). This information is then used to estimate the position
of these emitting point sources with a precision that is much higher than that allowed by Abbe’s
diffraction limit. The second principle is here generically referred to as “Super-resolved single
fluorophore microscopy”. Its discovery may be described as three distinct steps. The first relates
to the discovery of single fluorophore spectroscopy in dense media, the second to the theoretical
description of the principle and the third to its experimental implementation.
3.1 Super-resolved ensemble fluorophore microscopy: STED and its progeny
In the beginning of the 1990s, Stefan Hell moved as a post-doc from Germany to the University
of Turku in Finland to find space and a possibility to develop his, at the time, controversial idea
that it was not only possible but also feasible to transcend Abbe’s diffraction limit in far-field
light microscopy. In two theoretical papers he demonstrated the principles and outlined, in
quantitative terms, the experimental conditions for the ground-breaking novel concept of
Stimulated Emission Depletion (STED) microscopy (Hell and Wichmann, 1994) and similar
(Hell and Kroug, 1995) techniques. Back in Germany he was eventually able to assemble a
sufficiently sophisticated fluorescence microscope to provide the experimental proof-of-
principle of STED microscopy (Klar et al., 2000). In STED, two laser beams are used. A low-

5 (15)
intensity laser beam irradiates the fluorophores that define the structure of the studied object.
This beam displays a broad focal region as determined by Abbe’s diffraction limit. Another,
high-intensity STED beam, red-shifted in relation to the first beam, has a zero intensity
minimum in the focal region and its intensity grows in all directions from the focus. It rapidly
brings fluorophores that have been excited by the first beam, from the vibrational ground state
of the first excited singlet state, S1, down to a high vibrational energy state of the electronic
ground state from which they rapidly move to the vibrational ground state (Fig. 3).
Figure 3: (Hell et al., Current Opinion in Neurobiology 2004, 14:599–609). (a) Excitation from
the electronic ground state S0 to S1 with green light and return to S0 with the emission of yellow
light or by STED with yellow light. (b) Depletion of S1 with STED. (c) Left: yellow fluorescence
density in z- and x-directions in focal plane without STED. Middle: description of STED
microscope (top) and (bottom) green excitation without STED, red low-intensity STED and
green excitation spot and red high-intensity STED and green excitation spot. Right: yellow
fluorescence spot with high intensity STED.
By this arrangement, in conjunction with optimal pulse sequences for the excitation and STED
beams, light emission is turned off everywhere except in a small part of the diffraction-limited
focal region. The latter region shrinks indefinitely with increasing intensity of the maximal
value, I0, of the STED beam. The width, Δmin, of the effectively fluorescing region is in the lateral
plane approximated by (Hell et al., 2004)
(3)
min
02 sin ( 1 / )satn I I
6 (15)
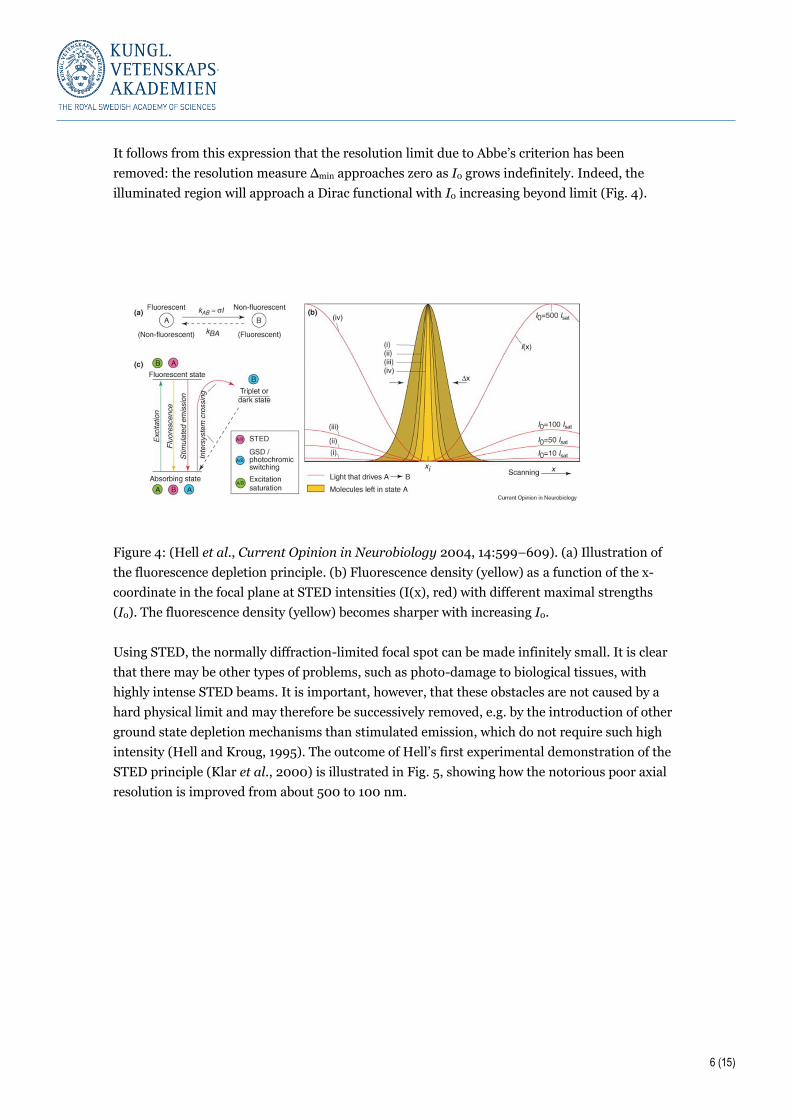
It follows from this expression that the resolution limit due to Abbe’s criterion has been
removed: the resolution measure Δmin approaches zero as I0 grows indefinitely. Indeed, the
illuminated region will approach a Dirac functional with I0 increasing beyond limit (Fig. 4).
Figure 4: (Hell et al., Current Opinion in Neurobiology 2004, 14:599–609). (a) Illustration of
the fluorescence depletion principle. (b) Fluorescence density (yellow) as a function of the x-
coordinate in the focal plane at STED intensities (I(x), red) with different maximal strengths
(I0). The fluorescence density (yellow) becomes sharper with increasing I0.
Using STED, the normally diffraction-limited focal spot can be made infinitely small. It is clear
that there may be other types of problems, such as photo-damage to biological tissues, with
highly intense STED beams. It is important, however, that these obstacles are not caused by a
hard physical limit and may therefore be successively removed, e.g. by the introduction of other
ground state depletion mechanisms than stimulated emission, which do not require such high
intensity (Hell and Kroug, 1995). The outcome of Hell’s first experimental demonstration of the
STED principle (Klar et al., 2000) is illustrated in Fig. 5, showing how the notorious poor axial
resolution is improved from about 500 to 100 nm.

7 (15)
Figure 5: (Klar et al., 2000, PNAS, 97, 8206-8210). (a) Nonlinear decrease in fluorescence
intensity with increasing STED intensity, ISTED. Illustration of fluorescence intensity spot in x-
and z-directions in the absence (b) and presence (d) of STED. Measured fluorescence
distribution in the z-direction in the absence (black) and presence (red) of STED.
Five years later M. Gustafsson demonstrated super-resolution with SSIM techniques
(Gustafsson, 2005). His work was prematurely terminated by his tragic passing in 2011.
3.2 The arduous road to single-fluorophore detection in dense media
Although the existence of molecules and their stochastic modes of action had long been
recognized (Einstein 1905), the view that chemical reactions are parts of a dynamic continuum
obeying deterministic laws has been remarkably persistent.
This illusion was shattered by the experimental demonstration of fluctuations around the
equilibrium state of a DNA-bound fluorescent dye (ethidium bromide). W. W. Webb, with his
collaborators E. Elson and D. Magde, developed the technique of fluorescence correlation
spectroscopy (FCS) and could use the fluctuation-dissipation theorem to estimate the rate
constants that govern the kinetics of the interaction between the fluorescent dye and double-
helical DNA under ambient conditions (Magde et al., 1972; 1974; Elson and Magde, 1974).
Around the same time, R. Rigler and collaborators suggested the use of fluorescence intensity
fluctuations to gain knowledge about rotational molecular motions and fluorescence life times
(Ehrenberg and Rigler, 1974).
A few years later, T. Hirschfeld used polyethyleneimine to tag antibodies (γ globulin) with a
large number of fluorophores (80-100 per protein molecule) (Hirschfeld, 1976). He then used
TIRF microscopy at ambient temperature to observe the diffusion as well as the mechanically
driven movement of the multi-labeled antibodies through a small volume illuminated by an Ar
laser. These results, obtained with near-field excitation and far-field detection microscopy,
8 (15)
defined the beginning of the long and arduous road to reach single fluorophore detection in
dense media.
The first observation of a single fluorophore in a dense medium was made in W. E. Moerner’s
laboratory (Moerner and Kador, 1989). They measured absorption spectra of the statistical fine
structures of inhomogeneously broadened optical transitions of single pentacene molecules in p-
terphenyl crystals at liquid helium temperature (4 K). Moerner’s result was revolutionary, not
the least because he managed to detect single fluorophores by their photon absorption rather
than emission. His results demonstrated that it was indeed possible to measure single
fluorophores and thereby greatly inspired the single-molecule field. The following year, M. Orrit
used the very same experimental system as Moerner to measure the fluorescence of single
fluorophores. As expected, the signal-to-noise ratio was greatly increased in relation to the
absorption-based observations (Orrit and Bernard, 1990). The same year, R.A. Keller and R.
Rigler with collaborators detected single fluorophores in liquid medium at room temperature
(Shera et al., 1990; Rigler and Widengren, 1990). To suppress background radiation, Rigler used
confocal microscopy and Keller used pulsed excitation in conjunction with delayed photon
detection. In 1993, E. Betzig used scanning near-field microscopy to study single fluorophores
on an air-dried surface with super resolution (Betzig and Chichester, 1993). In 1994, R. A. Keller
and collaborators (Ambrose et al., 1994) as well as S. Xie and collaborators (Xie and Dunn,
1994) measured excited state life times of single fluorophores and in an influential study the
same year S. Nie, D. Chiu and R. Zare demonstrated detection of single fluorophore diffusion
with confocal microscopy (Nie et al., 1994). In 1995, Yanagida documented detection of single,
fluorescently labeled ATP molecules interacting with single myosin molecules with a TIRF
microscope; another landmark in single-molecule spectroscopy (Funatsu et al., 1995).
In summary, these scientific results paved the way for both single-molecule spectroscopy and
single-molecule microscopy. A very early discovery of great conceptual impact was the
experimental demonstration of fluctuations in chemical reactions, and the application of the
fluctuation-dissipation connection to determine reaction rate constants as carried out by Magde,
Elson and Webb. Another very early result, anticipating what was to come within the next two
decades, was Hirschfeld’s demonstration with TIRF illumination and far-field detection of the
movement of single antibody molecules with multiple fluorescence labels. A decisive
breakthrough was the first detection of single fluorophores, carried out by Moerner under cryo-
temperature conditions. This step, showing that the apparently impossible had become possible,
paved the way for a host of single-molecule techniques in spectroscopy and microscopy. It
inspired fluorescence detection of single fluorophores at cryo-temperature in Orrit’s laboratory
and became a reference point for single-fluorophore detection under the biologically important
conditions of ambient temperature and liquid medium carried out in the laboratories of Keller,
Rigler and Yanagida.
3.3 Super-resolved single-fluorophore microscopy: PALM, STORM, PAINT and
their progeny
Super-resolved single-fluorophore microscopy should here be understood as a class of
techniques for which the super resolution is obtained by the possibility to ”super-localize” a
9 (15)
point source of photons. As outlined in section 1 above, photons from a point source will hit the
microscope detector with spatial probability density determined by their point spread function
(PSF) (Fig. 6).
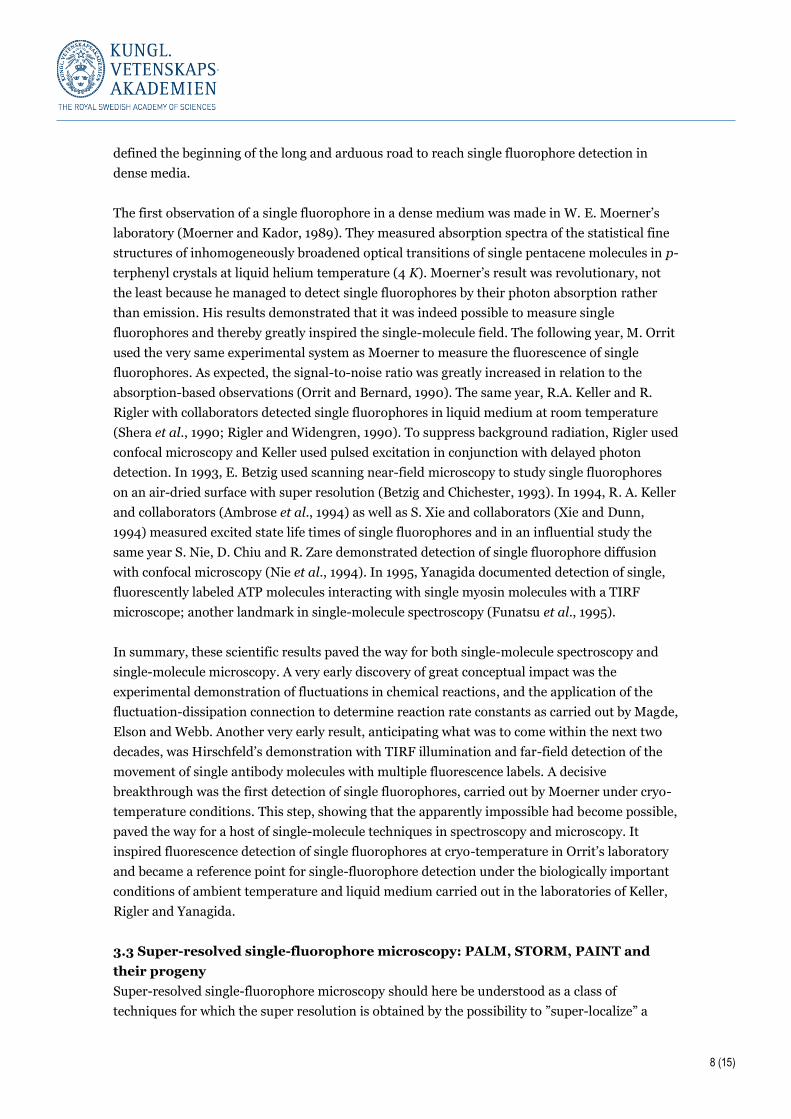
Figure 6: (a) Pixelated fluorescence intensity from single fluorophore in x- and y-directions of
the detector. (b) Fluorescence intensity in x-direction (blue bars) fitted to a Normal distribution
(red line, Eq. 4). (c). Probability density of the center (x=0) of the Normal distribution in (b).
The knowledge that there is a single emitter allows the position of the point source to be
estimated much more precisely (c) than the width of the PSF (b).
Neglecting background and pixelation, the probability density, p (x,y), of photon detection in
the lateral plane is approximately Gaussian (Thompson et al., 2012):
(4)
C is a normalisation constant, µx and µy define the lateral center of the PSF and Δ is equal to
Abbe’s diffraction limit in Eq. 1 above. From the knowledge that the photon distribution on the
detector stems from a point source, the center of the point spread function can be estimated
with a standard error, Δmin, in both the x and y coordinates, given by (Bobroff, 1996; Webb,
2002):
(5)
N is the total number of photons registered by the detector, and it is seen that the spatial
resolution of the microscope, taken as its ability to localize a point source, Δmin , is improved
from Abbe’s original limit by the factor 1/√N. This means that with 100 detected photons from
the single point source Δmin is a factor of 10 smaller than Abbe’s limit and with increasing
numbers of detected photons there is no strict limitation to how much the resolution can be
improved. For this, the structure of interest must be so sparsely labeled with fluorophores that
their separation is larger than the diffraction limit. This condition, however, leads to yet another
problem. According to the sampling theorems by H. Nyqvist (1928) and C. E. Shannon (1948) a
spatial resolution, Δmin, in the reconstruction of a structure requires that the structure is
22
2 22 2( , )
yxyx
p x y Ce
min
1
2 sinnN N

10 (15)
uniformly sampled with a spatial frequency higher than 2/ Δmin. This condition, however, is at
odds with the condition that the nearest neighbor distance between labels is larger than Abbe’s
diffraction limit. In fact, what is required is the dichotomy of a very sparse distribution of
fluorescence labels to save the assumption that they are all separable point sources in
conjunction with a very dense distribution to fulfill the sampling theorems of Nyqvist and
Shannon. A conceptual solution to this logical dilemma was first provided by Eric Betzig.
Despite the success of Betzig´s work on near-field fluorescence microscopy (e.g. Betzig et al.,
1992; 1993) it was becoming increasingly clear that the confinement to surface studies and the
cumbersome implementation limited the use of these methods. Betzig decided to leave academic
science, but continued to think about super-resolved fluorescence microscopy. He eventually
perceived a new way to achieve super-resolution without the shortcomings of near-field
microscopy (Betzig, 1995). The solution, he suggested, was to determine the positions of a large
number of point sources with distinguishable spectral properties in two steps. In a first step the
PSF of each spectral class was determined separately. Making sure that each spectral class
formed a sparse set in space, it would be possible to determine the positions of their members
with super resolution by estimating the centers of their PSFs with the precision of Eq. 5. By
considering the positions of all classes together, a super-resolution image of a densely sampled
structure could be obtained. A particular implementation of this method was subsequently used
in experiments by G.J. Brakenhoff and collaborators (van Oijen et al., 1998), but an optimal way
to experimentally realize Betzig’s vision was still lacking.
Two years after Betzig’s proposal, Moerner was studying the light emission properties of single
molecules of mutants of the green fluorescent protein (GFP) obtained from Roger Tsien’s
laboratory. The studies (Dickson et al., 1997) were performed at ambient temperature with the
protein embedded in an aerated aqueous gel. Unexpectedly, when excited at 488 nm the protein
was seen to undergo several cycles of intermittent fluorescence emission: the GFP molecules
displayed “blinking” behaviour. After several blinking cycles, the molecules went into a stable
dark state. Amazingly, from this dark state they could be re-activated by irradiation at 405 nm.
These results demonstrated for the first time that it was possible to optically guide fluorescent
proteins between active and inactive states by the sophisticated use of the inherent
photochemistry of the protein (Fig. 7).

11 (15)
Figure 7: (Dickson et al., 1997, Nature 388, 355-358). GFP in state A is excited to A* and returns
to A upon photon emission. When I is reached from A, there is no fluorescence until I
spontaneously moves to A: blinking. When I moves to N, there is no fluorescence until N is
activated to N* by 405 nm excitation and GFP returns to A.
Moerner’s demonstration of blinking and photo activation opened the road to exploring a vast
space of GFP mutants for novel optical properties. J. Lippincott-Swartz engineered a GFP
variant with striking properties (Patterson and Lippincott-Schwartz, 2002). This mutant is
initially optically inactive. It can, however, be activated by irradiation at 413 nm and then
displays fluorescence when excited at 488 nm. Eventually, after intense irradiation at 488 nm
the mutant is irreversibly inactivated by photo bleaching.
When Betzig returned to academic science after his post-near-field exile in private industry, he
learnt about Lippincott-Schwartz’ mutant and realized that it could possibly solve the problem
of finding an optimal way to combine sparse sets of fluorophores with distinct spectral
properties to a dense total set of fluorophores. The simple solution would be to activate a very
small and thus sparse, random subset of GFP mutant molecules in a biological structure by low-
level irradiation at 413 nm. Subsequent irradiation at 488 nm would then be used to determine
the positions of the members of the sparse subset at super-resolution, according to Eq. 5 above.
When the first subset had been irreversibly inactivated by bleaching, a second small subset
could be activated and the positions of its members determined at high resolution, and so on
until all subsets had been sampled and used to determine the structure under authentic super-
resolution conditions. This fulfilled both the condition of only a sparse subset being observed at
a time, and the condition of high-frequency (dense) spatial sampling in order to fulfill the
Nyqvist and Shannon theorems, as illustrated in Fig. 8.

12 (15)
Figure 8: (a) Low frequency spatial sampling, (b) Biased sampling, (c) Uniform sampling, (d)
Oversampling.
In collaboration with Lippincott-Schwarz and H. F. Hess, Betzig (Betzig et al., 2006) expressed
fusions of a photoactivatable GFP (PA-GF Kaede), similar to that described above (Patterson
and Lippincott-Schwartz, 2002) and a lysosomal transmembrane protein (CD63) to obtain the
super-resolved structure of a thin section of a fixed mammalian lysosome (Fig. 9).
Figure 9: (Betzig et al., Science, 2006, 313, 1642-1645). Distribution of GFP-labeled lysosome
protein (CD63) without (A) and with (B) PALM. Large box in B at higher magnification (C).
Small box in B at higher magnification (D). Note that the scale bar in D is close to Abbe’s limit.
They called their method PALM (Photoactivated Localization Microscopy). Later the same year
X. Zhuang and collaborators (Rust et al., 2006) and S. T. Hess and collaborators (Hess, 2006)
published super-resolved fluorescence microscopy studies based on similar principles and
named them STORM (Stochastic Optical Reconstruction Microscopy), and fPALM
(fluorescence-PALM), respectively. In addition, R. M. Hochstrasser’s group published yet
13 (15)
another strategy to achieve super-resolution (Sharonov and Hochstrasser, 2006). It takes
advantage of changes in fluorescence parameters (shift in emission spectrum) of a fluorescence
label (Nile Red) as induced upon its binding to an intracellular target (hydrophobic membrane).
The method was named PAINT (Points Accumulation for Imaging in Nanoscale Topography).
Since then many schemes to control active fluorophore concentrations have been developed
(Thompson et al., 2012).
4. After the discovery
The history of super-resolved fluorescence microscopy is short. The ensemble-fluorophore
STED-microscopy was implemented in the year 2000 and single-fluorophore based methods in
the year 2006. In spite of this, the rapidly developing techniques (e.g. Sahl and Moerner, 2013)
of super-resolved fluorescence microscopy are already applied on a large scale in major fields of
the biological sciences, like cell biology, microbiology and neurobiology (e.g. Huang et al.,
2010). At this point there is all reason to forecast that this development, already producing hosts
of novel and previously unreachable results, will accelerate over the next decades. This
development is expected to revolutionize biology and medicine by, not the least, eventually
allowing for realistic, quantitative descriptions at nano-scale resolution of the dynamics of the
complex, multidimensional molecular biological processes that define the phenotypes of all life
forms.
Måns Ehrenberg
Professor of Molecular Biology, Uppsala University
Member of the Nobel Committee for Chemistry
References
(References in bold phase are the key publications of the award) Abbe E (1873) Beiträge zur Theori des Mikroskops und der mikroskopischen Wahrnehmung. Archiv fur mikroskopische Anatomy. 9: 413-418. Ambrose WP, Goodwin PM, Keller RA and Martin JC (1994) Alterations of single molecule fluorescence lifetimes in near-field optical microscopy. Science 265:364-7. Ambrose WP, Goodwin PM, Martin JC, Keller RA (1994) Single molecule detection and photochemistry on a surface using near-field optical excitation. Phys Rev Lett. 72:160-163. Betzig E and Trautman JK (1992) Near-field optics: microscopy, spectroscopy and surface modification beyond the diffraction limit. Science 257: 189-195. Betzig E and Chichester RJ (1993) Single molecules observed by near-field scanning optical microscopy. Science 262:1422-1425. Betzig E (1995) Proposed method for molecular optical imaging. Opt Lett. 20:237-239. Betzig E, Patterson GH, Sougrat R, Lindwasser OW, Olenych S, Bonifacino JS, Davidson MW, Lippincott-Schwartz J, Hess HF (2006) Imaging intracellular fluorescent proteins at nanometer resolution. Science 313:1642-1645.

14 (15)
Born M and Wolf E (2002) Principles of Optics. Cambridge University Press. Brakenhoff GJ, van der Voort HT, van Spronsen EA, Linnemans WA and Nanninga N (1985) Three-dimensional chromatin distribution in neuroblastoma nuclei shown by confocal scanning laser microscopy. Nature 317:748-749.
Cremer C and Cremer T (1978) Considerations on a laser-scanning-microscope with high resolution and depth of field. Microsc. Acta. 81: 31-44.
Dickson RM, Cubitt AB, Tsien RY and Moerner WE (1997) On/off blinking and switching behaviour of single molecules of green fluorescent protein. Nature 388:355-358.
Ehrenberg M and Rigler R (1974) Rotational Brownian motion and fluorescence intensity fluctuations. Chemical Physics 4: 390-401.
Einstein A (1905) Uber die von der molekularkinetischen Theorie Wärme geforderte Bewegung von in ruhenden Flussigkeiten suspendierten Teilchen. Ann. Phys. (Leipz.) 17:549–560.
Elson EL, Magde D (1974) Fluorescence correlation spectroscopy I. Conceptual basis and theory (1974) Biopolymers, 13, 1–27.
Funatsu T, Harada Y, Tokunaga M, Saito K, Yanagida T (1995) Imaging of single fluorescent molecules and individual ATP turnovers by single myosin molecules in aqueous solution. Nature 374:555-559.
Gustafsson MGL, Agard DA and Sedat JW (1995) Sevenfold improvement of axial resolution in 3D wide-field fluorescence microscopy using two objective lenses. Proc. SPIE 2412: 147-156.
Gustafsson MG (2000) Surpassing the lateral resolution limit by a factor of two using structured illumination microscopy. J. Microsc. 198:82-87.
Gustafsson MG (2005) Non-linear structured-illumination microscopy: wide-field fluorescence imaging with theoretically unlimited resolution. Proc. Natl. Acad. Sci. USA. 102: 1301-13086.
Heinzmann R and Cremer C (1999) Lateral modulated excitation microscopy: Improvement of resolution by using a diffraction grating. Proc. SPIE. 3568:185-195.
Hell SW and Stelzer EHK (1992) Fundamental improvement of resolution with 4Pi-confocal fluorescence microscopy using 2-photon exitation. Opt. Commun. 93: 277-282.
Hell SW and Wichman J (1994) Breaking the diffraction resolution limit by stimulated emission: stimulated-emission-depletion-microscopy. Opt. Lett. 19:780-782.
Hell SW and Kroug M (1995) Ground-state depletion fluorescence microscopy, a concept for breaking the diffraction resolution limit. Appl. Phys. B. 60:495-497. Hell SW (2003) Toward fluorescence nanoscopy Nat. Biotechnol. 21:1347-1355. Hess ST, Girirajan TP and Mason MD (2006) Ultra-high resolution imaging by fluorescence photoactivation localization microscopy Biophys J 91:4258-4272. Hirschfeld T (1976) Optical microscopic observation of single small molecules. Applied Optics 15:2965-2966. Huang B, Babcock H and Zhuang X (2010) Breaking the diffraction barrier: Super-resolution imaging of cells. Cell 143, 1047-1058.
15 (15)
Klar TA, Jakobs S, Dyba M, Egner A and Hell SW (2000) Fluorescence microscopy with diffraction resolution barrier broken by stimulated emission. Proc. Natl. Acad. Sci. USA. 97: 8206-8210.
Magde D, Elson EL and Webb WW (1972) Thermodynamic fluctuations in a reacting system Phys. Rev. Lett. 29:705-
Magde D, Elson EL and Webb WW (1974) Fluorescence correlation spectroscopy. II. An experimental realization. Biopolymers 1974 13:29-61.
Moerner WE and Kador L (1989) Optical detection and spectroscopy of single molecules in a solid. Phys. Rev. Lett. 62:2535-2538.
Nie S, Chiu DT and Zare RN (1994) Probing individual molecules with confocal fluorescence microscopy. Science. 266:1018–1021.
Nyquist H (1928) Certain topics in telegraph transmission theory. Trans. AIEE 47:617-644.
van Oijen AM, Kohler J, Schmidt J, Muller M and Brakenhoff GJ (1998) 3-Dimensional super-resolution by spectrally selective imaging. Chem. Phys. Lett. 292:183–187.
Orrit M and Bernard J (1990) Single pentacene molecules detected by fluorescence excitation in a p-terphenyl crystal. Phys. Rev. Lett. 65:2716-2719.
Patterson GH, Lippincott-Schwartz J (2002) A photoactivatable GFP for selective photolabeling of proteins and cells. Science 2002 Sep 297:1873-1877.
Rayleigh, L (1896) On the theory of optical images, with special reference to microscopy. Philos. Mag. 42: 167-195.
Rigler R and Widengren J (1990) Ultrasensitive detection of single molecules by fluorescence correlation spectroscopy. Bioscience 3:180-183.
Rust MJ, Bates M and Zhuang X (2006) Sub-diffraction-limit imaging by stochastic optical reconstruction microscopy. (STORM) Nat Methods 3:793-795.
Sahl SJ and Moerner WE (2013) Super-resolution fluorescence imaging with single molecules. Current Opinion in Structural Biology 23:778-787.
Schermelleh L, Heintzmann, R and Leonhardt, H. (2010) A guide to superresolution fluorescence microscopy. J. Cell Biol. 190: 165-175.
Shannon CE (1949) Communication in the presence of noise. Proc. IRE 37:10-21.
Sharonov A and Hochstrasser RM (2006) Wide-field subdiffraction imaging by accumulated binding of diffusing probes. Proc Natl Acad Sci U S A. 103:18911-18916. Epub.
Sheppard CJ and Wilson T (1981) The theory of the direct-view confocal microscope. J. Microsc. 124:107-117.
Shera EB, Seitzinger NK, Davis LM, Keller RA and Soper SA (1990). Detection of single fluorescent molecules. Chem. Phys. Lett. 174:553-557.
Thompson MA, Lew MD, Moerner WE (2012) Extending microscopic resolution with single-molecule imaging and active control. Annu Rev Biophys. 41:321-342.
Xie XS and Dunn RC (1994) Probing single molecule dynamics. Science 265:361-364, Zipfel WR, Williams RM and Webb WW (2003) Nonlinear magic: multiphoton microscopy in the biosciences. Nat. Biotechnol. 21:1369-1377.