Embed Size (px)
Citation preview


ILLINOIS STATE GEOLOGICAL SURVEY
3 3051 00004 0489


Digitized by the Internet Archive
in 2012 with funding from
University of Illinois Urbana-Champaign
http://archive.org/details/summaryofwaterfl165squi


5576c
no. 165
c.l
State of Illinois
Adlai E. Stevenson, GovernorDEPARTMENT OF REGISTRATION AND EDUCATION
Noble J. Puffer, Director
Division of the
STATE GEOLOGICAL SURVEYM. M. Leighton, Chief
Urbana
CIRCULAR NO. 165
SUMMARY OF WATER-FLOODING OPERATIONS IN ILLINOIS1950
By
Frederick Squires, and Members of the
Secondary Recovery Study Connmittee for Illinois,
Secondary Recovery Division, Interstate Oil Compact Commission
Reprint of the Report Published
by The Interstate Oil Compact Commission,September 1950
Printed by Authority of The State of lUinois
Urbana, Illinois
1950
ILLINOIS GEOLOGICALSURVEY LIBRARY
JAN 19 m\


PREFACE
The Secondary Recovery Division of the Interstate Oil
Compact Comraission with Albert E. Sweeney, Jr., Director, andMr. Paul D. Torrey, Chairnnan of the Secondary Recovery AdvisoryCommittee, has undertaken the accumulation and publication of
information in regard to secondary recovery projects in the
United States. This publication represents the work of the Com-mittee appointed upon the recommendation of Mr. Clarence T.
Snnith, Official Representative of Governor Adlai E. Stevensonof Illinois, with Mr. Frederick Squires of the Illinois GeologicalSurvey as Chairman of the Committee.
The Interstate Oil Compact Commission wishes to
express its appreciation to all companies, organizations, andindividuals who have assisted this Committee in gathering data
on water-flooding operations in Illinois. This information is
being published in order that the oil industry and the public
in general may have factual information regarding the progressof water flooding in Illinois.
Earl FosterExecutive Secretary

FOREWORD
In conformity with the action of the Executive Committee of the Interstate
Oil Compact Commission, taken at Fort Worth, Texas, October 4, 1949, the State
of Illinois is proud to be a leader in the organization of a Secondary Recovery Com-mittee to cooperate with the Conapact in the study of methods for increasing the
recovery of oil.
According to information presented at the recent Summer Meeting of the
Interstate Oil Compact Commission, held at French Lick, Indiana, August 3,4, and
5, 1950, the estimated oil reserves of Illinois recoverable in the future by secondaryraethods exceed 350,000,000 barrels. This is raainly additional to the estimatedproved reserves of 508,500,000 barrels recoverable from existing wells largely
by primary methods. The production of this great secondary reserve could easily
double the life of the Illinois oil industry, and, thereby, result in impressive bene-fits to the State and to the counties in which oil is produced in the form of taxes,
to the people of Illinois in the form of wages and royalty payraents, in addition
to the substantial benefits which will accrue to the oil industry itself, and to the
nation.
Patriotic obligations should cause us to devote a great deal of thought
and attention to the enactment of appropriate laws and to essential technical studies
for the purpose of making large secondary reserves of oil available to aid in naeeting
expected increased armed services needs in the future.
The State of Illinois is eager to encourage the application of methodswhich will insure the maximum economic recovery of oil from every field.' Forthis reason it is a pleasure to commend the constructive work of the Illinois Second-ary Recovery Committee which has resulted in the report on "Summary of Water-Flooding Operations in Illinois, 1950." To the men who have labored so industrious-
• ly in the preparation of this report, the thanks of the State are extended. It is alsourged that every producer of oil in Illinois cooperate actively with the Committeein order that it may serve, in connection with the secondary recovery work of the
Compact, as a clearinghouse for information which will prove to be of great andlasting value to the State of Illinois and its people.
Adlai E. Stevenson I
Governor of Illinois j

ILLINOIS OIL FIELDS
^ Water flood operations Jon. I, 1950
/% Other fields ,
FIGURE 1
INDEX MAP OF WATER-FLOOD OPERATIONSI N
SOUTHERN ILLINOIS

TABLE OF CONTENTS
Page
PREFACE i
FOREWORD ii
INTRODUC TION 1
DATA ON 31 ILLINOIS CONTROLLED WATER FLOODS 3
DESCRIPTIONS OF SIX WATER FLOODS
Siggins Water Floods 9
Bellair Water Flood 15
Ikemire-Henry Lease Flood in the Main Pool, Crawford County 19
Maunie South Water Flood 23
W. E. Robins Bridgeport Water Flood 25
Patoka Water Flood 31
CONCLUSIONS FROM A COMPARISON OF THE SIX DESCRIBED FLOODS 37
TABLE I DATA FOR ILLINOIS CONTROLLED vVATER FLOODS, JANUARY 1, 1950 4
LIST OF ILLUSTRATIONS
Figure Page
1. Index map of water -flood operations in Southern Illinois iii
2. Generalized geologic column for Southern Illinois oil region 2
3. Permeability map of Siggins Pool, 1st Siggins sand... 8
4. Location of Siggins Pool Floods 8
5. Development map, Siggins Pool, Cumberland Covinty, Illinois 10-11
6. Thickness map, 1st Siggins sand, Siggins Pool, Clark and CumberlandCounties, Illinois 12
7. Graph of daily average production by months by leases in the Siggins Floods 13
8. Development map, Bellair Pool, Crawford County, Illinois 16-17
9. Thickness map on net floodable sand, Bellair Pool, Crawford County, Illinoi& 18

LIST OF ILLUSTRATIONS (Continued)
10. Development and structure map, Ikemire-Henry Water Flood, Crawford County,Illinois.. 20
1 1. Cross -sections of the Ikemire-Henry lens and the underlying lens sand 21
12. Tar Springs structure in the Mauriie South Field, White County, Illinois 22
13. Production and injection, Maunie South PooL .,. 23
14. Development map of the W. E. Robins Bridgeport Sand Flood, Lawrence County, Illinois 26
15. Fence diagram of upper and lower Bridgeport sands 27
1 6. Structure on top of lower Bridgeport sand 28
17. Isoperm of pay zone in lower Bridgeport sand 29
18. Isopach of oil pay in lower Bridgeport sand 30
19. Top of sand of Patoka Flood 32
20. Isopach map t)f Patoka Flood. 33
21. Isoperna map of Patoka Flood 34
22. Patoka Benoist Water Flood, daily flood performance, total field 35
23. Patoka Benoist Water Flood, natural and water-flood performance, total field 35
24. Graph of water input and oil produced by water flooding: Patoka, Bellair (Pure),
Siggins, Bellair (Forest), Aden, New Harmony, Johnson North, Johnson South,
and Main (Ikemire-Henry lease) 36
25. Graph of water input and oil produced by water flooding: Blairsville, Grayville West(Albion Consolidated), lola, and New Harmony 38
26. Developnnent maps of Aden, Calvin North (Phillipstown Consolidated), and lola Floods .39
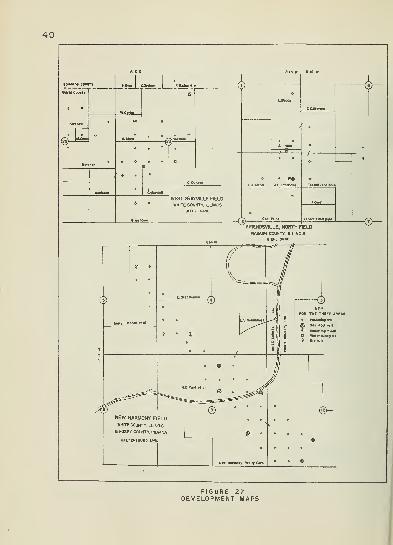
27. Development maps of Grayville West (Albion Consolidated), Friendsville North, and
New Harmony Floods 40


SUMMARY OF WATER-FLOODING OPERATIONS IN
ILLINOIS, 1950
INTRODUCTION
Early in 1950, the Secondary Recovery Study Conmmittee for Illinois was appointed byEarl Foster, Executive Secretary, Interstate Oil Compact Commission, upon the recommendation ofClarence T. Smith, official representative of Governor Adlai E. Stevenson. The report that followsis largely the result of the work done by that committee. The committee memibers are as follows:
Frederick Squires, ChairmanIllinois State Geological Survey100 Natural Resources Building
Urbana, Illinois
A. H. Bell
Illinois State Geological Survey100 Natural Resources Building
Urbana, Illinois
H. R. Bolton
The Ohio Oil CompanyTerre Haute, Indiana
C. V. CameronShell Oil CompanyCentralia, Illinois
W. S. CorwinTide Water Associated Oil CompanyKeensburg, Illinois
R. E. DunnMagnolia Petroleum CompanyP. O. Box 501
Salem, Illinois
R. W. LoveThe Texas CompanyP. O. Box 299Salem, Illinois
R. J. Cassin, SecretaryIllinois State Geological Survey100 Natural Resources BuildingUrbana, Illinois
Paul Phillippi
Forest Oil CorporationCasey, Illinois
Mark PlummerThe Pure Oil CompanyOlney, Illinois
L. C. PowellThe Ohio Oil CompanyTerre Haute, Indiana
Harry SwaneckGulf Refining CompanyCentralia, Illinois
Ray VincentSohio Petroleum CompanyBox 352
Centralia, Illinois
E. C. WellsCarter Oil CompanyMattoon, Illinois
M. R. WilsonThe Texas CompanySalem, Illinois
Albert E. Sweeney, Jr., Director, Secondary Recovery Division, Interstate Oil CompactCommission, attended the committee meetings and gave helpful support to the committee's work.
As a result of this study, it was found that there were 31 controlled water-flood opera-tions in Illinois as of January 1, 1950 (see map Fig. l). Summary data for these are given in
Table I, Data for Illinois Controlled Water Floods, January 1, 1950. Production and water input
graphs for 14 floods and development maps for 10 floods are iacluded. Six floods have been sel-
ected for more detailed discussion herein (l) Siggins, Cumberland County, (2) Bellair, CrawfordCounty, (3) Ikemire-Henry, Crawford County, (4) Maimie South, White County, (5) W. E. Robins,Lawrence County, and (6) Patoka, Marion County.
Data for four of the six descriptions of water floods were taken in part from Universityof Illinois Master of Science theses undertaken in cooperation with the Illinois State GeologicalSurvey. Dr. J. L. Hough, Department of Geology, University of Illinois, was in charge of all four

theses. These reports are (l) The Bellair Flood by William Lang, (2) The Ikemire-Henry Flood
by William Vineyard, (3) The Maunie South Flood by R. M. Stephens, and (4) The W. E. Robins
Flood by Jack Foster. Data for the Siggins floods were assembled by R. J. Cassin and the illus-
trations for the Patoka flood were taken from the article by H. S. Barger published in the PRO-DUCERS MONTHLY and the OIL AND GAS JOURNAL.
Descriptions of pressure maintenance and dump flooding operations were omitted fromthe report because data for these were not available.
FIGURE 2
GEOLOGIC COLUMN FOR SOUTHERN ILLINOIS
SHOWING OIL PRODUCING STRATA(0
DEGONIA
CLOREPALESTINEMENARD^M^^SBURGTAR SPRINGS
GLEN DEANHARDINSBURGGOLCONDACYPRESSPAINT CREEKBETHELRENAULTAUX VASES
FORMATION ORGROUP
STE GENEVIEVE(MCCLOSKY ROSI-CLARE.L.O'HARA)
ST LOUIS
SHAKOPEE
NEW RICHMOND
ONEOTAJORDAN
TREMPEALEAU
FRANCONIA
GALESVILLE
EAU CLAIRE
ILLINOIS STATE GEOLOGICAL SURVEY
DATA ON 31 ILLINOIS CONTROLLED WATER FLOODS
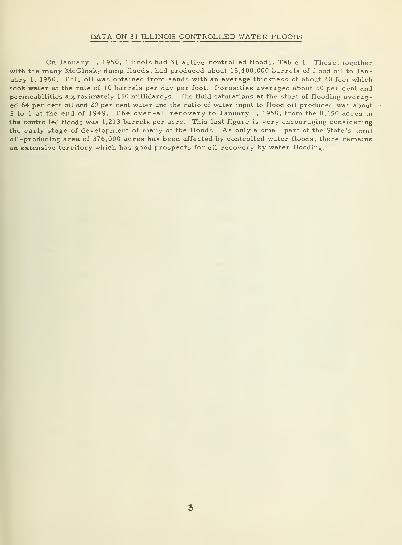
On January 1, 1950, Illinois had 31 active controlled floods, Table 1. These, together
with the many McClosky dump floods, had produced about 15,400,000 barrels of flood oil to Jan-uary 1, 1950. This oil was obtained from sands with an average thickness of about 20 feet whichtook water at the rate of 10 barrels per day per foot. Porosities averaged about ZO per cent andpermeabilities approximately 150 millidarcys. The fluid saturations at the start of flooding averag-ed 64 per cent oil eind 20 per cent water and the ratio of water input to flood oil produced was about
5 to 1 at the end of 1949. The over-all recovery to January 1, 1950, from the 8,450 acres in
the controlled floods was 1,213 barrels per acre. This last figure is very encouraging considering
the early stage of development of many of the floods. As only a small part of the State's total
oil-producing area of 376,000 acres has been affected by controlled water floods, there remainsan extensive territory which has good prospects for oil recovery by water flooding.

TABLE I
DATA FOR ILLINOIS CONTROLLED WATER FLOODS,JANUARY 1, 1950
Field County Proje
Aden Consolidated Wayne Aden
Aden Consolidated Wayne Aden
Albion Consolidated Edwards Albion
Albion Consolidated White Biehl
Bellair Crawford Forest
Bellair Crawford Fulton
Benton Franklin Benton
Friend ville Nort
lola Co nsolidated
Johnsor North
Johnsor South
Lawrence
Lawrence
Maunie South
sburgCoi solidatedKe<New Hai
Keensburg ConsolidatedNew Harmony-Keensburg ConsolidatedNew HarmonyKeensburg Consolidated
Odin
Olney Consolidated
Patoka
Patoka
Ha, iltoi
Wabash
Wabash
Clay
Clark
Crawford
Crawford
Crawford
White
White
White
White
Whit. -111.
Posey-Ind.
Marion
Richland
Marion
McC
Bridgepoi
Upper Bi.
Bellair '"
ky
Hair "500"
r Springs
North Bellmont Cyprt
FrlendsviUe Biehl
Cumberland
Pickens Flood
South
JohnsoRobins
Hughes
Tar SpringsUnit
Greathouse
Ford "A"
Greathouse
Waltersburg
Odin
Olney
Benoist Flood
Rosiclare
North Calvin
Pure
UpperPartlowBridgeport
Kirkwood
Robinson
Robinson
Tar Springs
Bethel
McClosky
McClosky
Waltersburg
Cypress
McClosky
1st Siggin
2nd Siggin
Flood FirstPay Operator Water Input
3200 Texas Aug. 46
3350 Texas Aug. 46
1900 Superior Aug. 46
1900 Yingling Aug. 49
550 Forest Jul. 48
560 Pure Jul. 48
2100 Shell Nov. 49
3275 Texas Jun. 48
2600 Magnolia Nov. 47
1500 Magnolia Jul. 47
2350 Texas Mar. 48
450 Pickens May 49
490 Forest Mar. 49
900 Ohio Aug. 48
1350 Ohio Jul. 47
935 Tidewater Feb. 48
950 Ohio May 48
890 Ohio Sept. 48
2200 Magnolia Aug. 47
2750 Sun Jan. 49
2900 Sun May 48
2900 Sun Aug. 47
2220 Superior Aug. 46
1750 Ashland Oct. 49
3060 Texas Nov. 46
1410 Sohio Sept. 4 3
1550 Sohio 48
1800 Magnolia Sept. 47
400 Forest 42
404 Pure Dec. 46
464 Pure Dec. 46

No. of Wells
Produc tion
28 332
ZO
061
29 181
53 700
3 722
90 877
" 421
4 554
61 585
32, 987
41, 250
29,979
280, 054
543
2, 596
13,
115,
366
791
P r^oduction
. ,620
156
100
141
12
00
,520
,173
v,000
.335
,273
,575
750
000
4/000
15
40
917
722
000
20,000
92,759
230 ,264
219 .577
,227
2,211 ,655
2,894 ,101
815 ,600
208 582
139 241
50 760
39 103
445 000
1,080 663
295 109
63 745
237 200
601 383
188 304
533 150
. 230 588
234 359
469 486
13 877
71 464
3,900 000
2001/
000
43 343
3,526 599
1,543 263
20,612. 253
12,3
20.0

Production and Input TABLE I (Contlnuecl)muary 1, 1950
duction
28 ,952
119 ,942
20 ,188
53 ,700
Nc „e
166 653
70 ,389
Nc ne
4 554
61 485
44 037
9 627
45 000
34 400
9 070
528 086
543
2 596
13 366
315 252
,605 542.
24 None None
25 25,660 23,920
26 5,405,226 9,000,000
27 195,378 50,000
28 24,936 9,306
29 2,497,797 4,000,000
10,392,891 15,336,1
402 596
2,719
3,936
268
711
252
600
611
235 319
102
62
092
662
445
1,080
000
663
364 786
307 690
342 500
714 894
218 923
1,148 565
230 588
24 894
259 338
1.886 225
13 877
345 844
15,593 206
394 904
86 690
14,321
4,021
908
594
50,982 976
Brine Penn. sand Yei
Lake
Cypress sa
Tar Springsand
Penn sand
(300 feet)
Penn. sand No
Produced Yes
Tar Springs No
Produced No
Tar Springs Yes
Tar Springs Yes
Total Controlled Floods 10,398,891
Plus McClosky' Dump Floods 5.000.000
Cumulative Illinois Water-Flood Production to January 1,
1950 15,398,891

At Start of
5 -spot ving flood
ving flood
y Actual core anal
2/ Based on well c
3/ Corrected for h


DESCRIPTIONS OF SIX WATEIR FLOODS
SIGGINS WATER FLOODS
Introduction and History
The primary production history of the Siggins field. Township 10 N., Ranges 10 and 11
East, Clark and Cumberland Coxinties, Illinois, is given in Illinois Geological Survey Bulletin 54
by L. A. Mylius, and the early water flood is described by Frederick Squires in Illinois Geological
Survey Circular 125, "Flood Tide in Illinois." This chapter will be devoted to a description of the
current Siggins floods. (Fig. 4)
Water-Flood History
Systematic water flooding was first begun in the Siggins field in 1942 when the ForestOil Corporation redrilled and flooded 40 acres of the 1st Siggins sand near the center of the
field (flood 2, Fig. 4). Since 1942 the flooding has been expanded to 2,000 acres in both 1st and2nd Siggins sands. These floods are operated by the Forest Oil Corporation and Pure Oil Com-pany. Field daily average production increased from 100 barrels or less per day in 1940 to
3,000 barrels per day in October, 1949, with a cumulative water-flood production to January 1,
1950, of 3,187,000 barrels.
Water-Flood Development
With few exceptions the old wells were plugged and a new five-spot pattern drilled with
input wells 440 feet apart and input to oil well distamces about 300 feet (Fig. 5). Insofar as possibleinput wells are completed to have only net pay open to injection and are selectively shot to minimizethe natural permeability differences. Forest Oil Corporation input wells are connpleted by runninga rag packer on 1 l/2-inch tubing with a few sacks of cement to hold it. Only surface casing is
used. The input wells of the Pure Oil Company are completed by inserting perforated tubing
opposite the pay and gravel packing the annular space. The tubing is then cemented in place andthe casing removed. Well-head equipment on the input wells of both companies consists of a meterbetween two valves with an additional valve located off the injection line, making it possible to
check pressures. Oil wells are conventionally completed pumping wells.
Water Source and Treatment
By the first of January, 1950, 18,344,000 barrels of water had been injected into the
1st and 2nd Siggins sands. This water was obtained frona fresh water wells and produced salt
water. The fresh water comes from a 100-foot deep glacial gravel in Hurricane Creek. Turbine
pumps at the wells lift the water and push it 6 miles through 6-inch pipe to the field where it
is used in Forest Oil Corporation floods 2, 3, and 6, and in Pure Oil Company's flood. Pro-ducing wells furnish the brine. After separation from the oil the brine is aerated, chemically
treated and filtered. Brine is used in Forest Oil Corporation floods 4, 5, and 7, and will be used
in future Forest Oil Corporation floods 8 and 9. Booster pumps force the water at 200-280 pounds
pressure through a series of cement-lined mains, laterals and individual lines to each of the
injection wells. Sand face pressures are kept below the maiximum safe pressure of one pound per
square inch per foot of depth. Daily average injection rates for 1949 average slightly, in excess of
1 barrel of water per foot of exposed sand.
9

10
II,
,^l —r^„ .•." •
i==
1 V ^ ,
f"^"^ <•
»"' ' "' 4-"' *:,
^- 4r 4r
1- -i1^ ^- ^~.
MS- ^2.. ^«. 7 ,f
.t- ^"« ^-*
V
•If ^ J^'*'.'
:i' •• ••
jJJ
\ 4 V '•.••4 '- «f
•• •' *'
r
FI6UR
DEVELOPM
SIGGINS
K
O OIL WELLO *.TER INP
£ 5
ENT MAPPOOLLAND CO. ILLINOIS - V- ^- -
;.. . o^
»"" "" '",- •
• o* ' ," o'"
.... ^,«, ^-^
o'"
0- dH o-'-
4- WATER INPUT COMPL E TION
• OLD WELL PLUGGED <
• OLD WELL PRODUCING (NOT SURVErED)
<
o'" o
»!=! ^^ O*^'^
i('
Prepared by R. J. Cassin from data obtained from

Forest Oil Corporation and Puxe Oil Company.

" lOE- R.IIE.
LEGEND
CD TO 23 FEET ^^ 90 TO 79 FEETEZ3 as TO 90 FEET ^ OVER 75 FEET
FIGURE 6
THICKNESS MAP, 1ST SIGGINS SAND, SIGGINS POOL,CLARK AND CUMBERLAND COUNTIES

13
Results Obtained
During the period 1942 through January 1, 1950, the Siggins field has produced 3,187,000barrels of water-flood oil and, as of January 1, 1950, was producing in excess of 3,000 barrelsdaily. Yields per acre are not yet representative of flood value because most properties arefar from being flooded out. However, water-flood yields per acre to January 1, 1950, on someleases have been as high as 8,000 barrels. Production curves of Forest Oil Corporation floods
(Fig. 7), with all floods shown as though they had been started at the same time, show a gradual
decrease in production after the peak is reached. The marked similarity in decline slope in-
dicates a predictable future life for each flood if present injection and production methods are
continued. From the decline rates it seems certain that Siggins floods will continue at a commer-cial level of production many years after peak production is reached.
Sumnaary
The Siggins water flood is one of the most successful in the State—at present it ranks
third in cumulative water-flood production. Table I, the Patoka and basin McClosky floods rajiking
first and second.
The reservoir characteristics as shown in Table I, Data for Illinois Controlled Water
Floods, January 1, 1950, do not show superior conditions for flooding, but the careful evaluation
and efficient operating techniques employed are proving successful.
_..y--;.^^ ^-^^^^^.„........„„
/ ^y^ ,PIERSON "" _..^^ ,HAYWORTH HEIRS
^n^"""'^y( ^^̂ ^,^''"""'''^
^T. EMRICH N0.3 ~---~«^
'y'L J' _--' ^* «. ^ ^.E.CHRYSLER
'f./ '"^ ' SIGGINS POOL
LEASE PRODUCTION GRAPHS
START OF EACH FLOOD PLOTTED FROM COMMON BASt LINE
'
\oEOP..COO.V,*Bs'
FJ6URE 7GRAPH OF DAILY AVERAGE PRODUCTION BY MONTHS BY LEASES IN THE SIGGINS FLOODS


BELLAIR WATER FLOOD
Introduction and History
The Bellair field is located in Township 8 N., Range 14 W. , Crawford County (Fig. l).
L. A, Mylius, in Illinois Geological Survey Bulletin 54, has described the primary history of this
pool. The field has three pays, the 500- and 800-foot Pennsylvanian sands, and the 900-foot Mis-sissippian sand. Only the 500-foot Pennsylvanian sand is discussed here since it is the only one so
far flooded.
Water-Flood History
The Bellair "500" flood is operated by Forest Oil Corporation and Pure Oil Company,covering 700 acres near the center of the field. Water was first injected in July, 1948, and flood
production first obtained about the middle of 1949. The daily average production for December,1949, was approximately 550 barrels of oil.
Water-Flood Development
With a few exceptions, old wells were plugged and new wells drilled in a five-spot pattern.
Input wells are usually 400 to 440 feet apart, with input to oil well distances about 300 feet (Fig. 8).
Pure Oil Company's producing wells are completed with casing cemented at the top of
the producing zone and wells are flowed through the casing. Input wells are connpleted by run-
ning 1 l/Z-inch tubing perforated opposite the pay, filling the annular space to the top of the
pay with gravel, and then adding about five feet of sand topped with a few sacks of cement. Cas-ing is then removed from the hole. Forest Oil Corporation completes producing and input wells
by running 1 l/Z-inch tubing with a rag packer cemented opposite the top of the injection in-
terval. Only surface casing is left, in the wells. Both companies shoot the sand to even the per-meability profiles and equip each input well with a water -flow meter.
Water Source and Treatment
Fresh water alon^ is used in the Bellair flood with approximately 6,656,000 barrels in-
jected into the sand to the first of January, 1950. Water is obtained from gravel beds 100 feet
deep, l/Z to 3/4 miles SW of the Bellair field (Fig. 8). Turbine pumps lift the water and push it
through the 6-inch main lines. Pure Oil Company uses two diesel engines close to the source wells
to raise the pressure to 400 pounds per square inch, a pressure sufficient to move the water 1 l/Z
miles to the filter plajit, through the pressure filters, and into the wells at a pressure of about 225
pounds per square inch. Forest Oil Corporation uses the turbine pumps at the wells to lift and pushthe water to their booster pump and filter station about 1 l/4 miles away (Fig. 8). Forest Oil
Corporation's well-head pressures are about 250 pounds per square inch. Both companies use
closed systems with pressure filtrations. Iron precipitates on the filter elements have causedconsiderable difficulty. Recently "Calgon" and Calcium Hypochlorite treatment have been addedby Pure Oil Company. The 225-280 pounds per square inch well-he-ad pressure plus the static
head is close to the maximum safe flooding pressure of one pound per square inch per foot of depth.
Results Obtained
Because the Bellair "500" flood is new, yields per acre, cumulative production, or other
yardsticks of flood productivity are not yet significant. However, a few interesting point«^ of
flood behavior of the Bellair "500" are now known. Production since the start of water flood to
January 1, 1950, was 83,000 barrels with daily production increasing from a few barrels in June to
550 barrels in December, 1949. Water was produced from the start of flood production and hadincreased to a 70 per cent water cut by January 1, 1950. The production from the wells of PureOil Company which are flowed continuously and from those of Forest Oil Corporation which areflowed intermittently is similar.
15

^t-
Prepared by William Lang from data furnished byForest Oil Corporation and Pure Oil Company.
I


R.I4W.
Prepared by-
William Lang from data furnishedby Forest Oil Corporation andPure Oil Company.

IKEMIRE-HENRY LEASE FLOOD IN THE MAIN POOL, CRAWFORD COUNTY
Introduction and History
The following is a description of the Tide Water Associated Oil Company flood of the
Robinson sand on the Ikemire - Henry leei.se of sees. 10 and 25, T. 7 N. , R. 13 W., CrawfordCounty (Fig. l), and a brief history of primary and secondary recovery prior to the new flood.
Oil was discovered in this area in 1906, and the Ikeinire-Henry lease was developedin 1907 and 1908. The wells had average initial productions of 80 barrels of oil per day. In
1911 daily production was down to 3 barrels of oil per well per day. In attempts to increaseproduction vacuum was used in 1919 and air injection in 1932. These methods recovered 800-
1 ,000 barrels per acre over a 14-year period. The present Ikennire -Henry water flood wasstarted in 1946.
General Geologic Conditions
The Ikemire -Henry flood pay is a small Robinson sand lens l/2 x 1 mile, trending
NE-SW (Fig. 10). Sand thickness ranges from about 35 feet at the center to zero at the lens edge.
The main Robinson sand body underlies the lens and in most places is separated from it by a
considerable thickness of shale, but at some places by only a thin shalv sand (Fig. 11). The top
of the lens is about 940 feet below the surface.
Water-Flood History
The Tide Water Associated Oil Company first injected water into the Ikemire -Henrylens in February, 1948, and flood production was first obtained in August, 1948, when production
of the 45-acre flood area increased from a few barrels to 35 barrels per day. By the end of
December, 1949, the daily average production was 140 barrels of oil and cumulative water-floodproduction was 45,000 barrels.
Water-Flood Development
A somewhat irregular five -spot pattern is used in the Ikemire-Henry lease flood (Fig. 10).
Input to input well distances are generally 440 feet; oil well to input well distances are about
300 feet. Variation in spacing results from the use of a few original wells in the five-spot pattern.
Wells are drilled with cable tools and shot to equalize pernneability profiles. Producing
wells are completed with 5 l/2-inch casing and pumped through 2 3/8-inch tubing. Input wells
are conapleted with|4 l/2-inch casing cenaented through the drained upper part of the sand. In-
dividual meters are used on input wells.
Water Source and Treatment
One old oil well deepened to a basal Pennsylvanian sand at 1,200 feet has furnished the
entire 342,500 barrels of water injected into the Ikemire-Henry lens to January 1, 1950. A con-
ventional- oil well pump is used to lift the water and distribute it to the nine injection wells. Iron
precipitates have caused a reduction of intake rates at times, but acid treatment has been an aid
in remedying this condition. The daily injection rate as of January 1, 1950, was approximately
670 barrels of water at 130 pounds per square inch, or 4 barrels per foot of sand per day.
Results Obtained
By the end of December, 1949, the 45-acre flooded area of the Ikemire-Henry lease had
produced 45,000 barrels of flood oil and the rate of production was increasing each month. The
per cent water cut has increased, from 38 per cent in Septennber, 1948, to 51 per cent in December,
1949. Table I, Data on Illinois Controlled Floods, January 1, 1950, shows the Ikemire-Henry
lens to have high oil and low water content. This fact, together with the encouraging early water
flood recovery, promises success for this flood.
19

20
^ -'^ TIDEWATER dlL CO. / •' >^0*'"*^'^ .5 ^10
\ TIDEWATER OIL C.4^0' x' \
24 / A ' ^.-*-7 ^^
^•l^''"*'0/»^
''"V e" ,,5 ,13 .12; ,„ ,7 «8 \•6
E. stifle > /I "•V E. Birch \
TIDEWATER OIL CO TIDEWATER OIL CO. ^ • 10 TIDEWAteRX)!!- CO•' .« .2 •^ •^ ^«"^' ' •
'^^~o_ ''"''''»''°^'Cir^~
—~~^>>12- \ *^'^^^^
''*'"
''^'^5v-*v-^
\
•
>C^>^^^-^^ \^ -^ .' \ •' ^y^ /V V ^y^^^J^^^y^ .)
T Randolph ^^'^J. PDr;rfraX yA ,^^y^ y^^fi^T^t^''^ \ J_
12 •, ^^^Z \ ft^V, /„ ^* o^-^.^-'^ .'^ ^—r\
- - —T+OPWAT&i OJL CO. X \/ / / TIOEWATEB^L CO.^sS^'^sN / rC-^ ^3
^-**''' // ^X^/^^/^Z/^"^^ XW /' ^^HIO OIL C0.\
\/?'/ •'J">A/ /^^•">o'^/V//^.
X^^ ' /^"^^^,^j!(U^
0."J. Darrough
.'6
Ax ^ ^^ / OHIO 3IL CO. OHIO OIL CO
//^^^^V ,5 A ..6 .-</ •' ,2
(C^ \ ,
r\ *^ ^•' .^^^\ |20
K^\V^.^-^^"T^^"^ ?
•=^
J. Hill Ste ntz Walters Heirs
Ikemire- Henry Water Flood ProjectTIDEWATER ASSOCIATED OIL GO.
CRAWFORD Co, ILLINOIS
R.I3W.,T7N.,SEC !0
• PRODUCING WELL ,44c 'CONTOUR ON TOP OF IKEMIRE LENS
^ ABANDONED WELL '^^^gO' CONTOUR ON TOP OF E. STIFLE LENS
® GAS INPUT WELL ""' CONTOUR INTERVAL = lO'
« WATER INPUT WELL
© WATER SOURCE
LOCATION OR COM.TEMPLATED CHANGE 220 440 _._880FEET
FIGURE 10DEVELOPMENT AND STRUCTURE MAP
Prepared by William Vineyard from data furnished by
Tide Water Associated Oil Company.

g g g
I I IKEMIRE-HENRY LENS
Prepared by William Vineyard from data furnished by Tide Water Associated Oil Company.

22
FIGURE 12
TAR SPRINGS STRUCTURE IN THE MAUNIE SOUTH, FIELD, WHITE COUNTY, ILLINOIS
Prepared by R. M. Stephens from data furnished by Magnolia Petroleum Company.

MAUNIE SOUTH WATER FLOOD
Introduction and Histo
The Maunie South field is located in the southeast part of White County in Township6 S., Range 10 and 11 E., (Fig. l). The water-flooded area is in sees. 24 and 25, T. 6 S., R. 10E. and in sec. 19, T. 6S., R. 11 E. Since the discovery of the field in 1941, 10 pays have beenfound in the Pennsylvanian and Mississippian systems. Only the water-flooded sand, the TarSprings of the Upper Mississippian, is discussed here. Initial production from Tar Springswells ranged from 10 to 500 barrels of oil per day. Primary production from the Tar Springs is notaccurately known because production from the many pays was not separated, but it is estimatedat 486,000 barrels.
General Geologic Conditions
The Maunie South Tar Springs reservoir is on a NE-SW elongated rise with little clos-
ure, 25 feet, and of varying sand thickness, 10-30 feet. It is about 20 miles southeast of thedeepest part of the Illinois basin. The structurally highest Tar Springs in the Maunie Southfield is 1,820 feet below sea level (Fig. 12).
Water-Flood History
Water was first injected into the Tar Springs sand August 11, 1947, and by January 1,
1950, 1,148,565 barrels of water had been injected into the 230 acres of water-flooded sand.
FIGURE 13
PRODUCTION AND INJECTION XTAR SPRINGS SAND y/^
WATER INJECTION. X
X /^X OIL PRODUCTION.
^"""^
START OF y^WATER FLOOD/^ ^ PRODUCED WATER.
23

24
Water-Flood History (Continued)
Immediately prior to water flooding, Tar Springs oil production from the flood acreage was a-
bout 40 barrels per day; in July, 1948, it was 1,040 barrels per day. The cumulative water-flood
production to January 1, 1950, was 528,086 barrels.
Water-Flood Development
A five-spot pattern was made by converting alternate wells of a regular 10-acre spacing
to water-input wells (Fig. 12). This arrangement puts input to input wells 930 feet apart and
input to oil wells 660 feet apart. Water is injected through tubing with upside-down hookwall
packers. Water lines and tubing are plastic lined and each input well is equipped with a meter.Producers are conventional pumping wells.
Water Source and Treatment
Water is obtained from a Pennsylvanian sand by one well located 20 feet NW of the
NE NW SE, sec. 24, T. 6 S., R. 10E.(Fip. 12). In September , 1948, this water source was aug-mented by returning produced water to the sand. Water injection is maintained in a closed systemwithout treatment although occasional acid treatments have been used to clean tight wells. AReda pump is used in the source well and two horizontal triplex plunger pumps furnish the line
pressure. Initially input wells took water under vacuum or with very little pressure. In December,1949, plant pressures of approximately 800 pounds per square inch were used and a daily injectionrate was nnaintained of close to 1,550 barrels, or about 8.5 barrels per day per foot' of sand.
Results Obtained
By the end of December, 1949, 528,086 barrels of flood oil had been produced fromthe 230-acre flooded area. This is approximately 2,300 barrels per acre, or 144 barrels peracre foot. Daily average production has remained high with cumulative production showing a
constant rate of increase.
Summary
The Tar Springs flood in the Maunie South field was the first 10-acre spacing sandflood in Illinois and the first in Illinois to convert producing wells to input wells. Its successhas greatly influenced water-flood procedures in the State, because of the great saving in cost
]
of the operation in comparison with the drilling of new wells for input wells and of closer spac-
ing of wells. The secondary recovery to January 1, 1950, of 528,086 barrels is greater than the
prinaary production of 486,000 barrels, and the secondary recovery production rate at the endof 1949 is still high. The success of the Maunie South flood is of particular importance to the
new fields of Illinois where there is much pay sand of similar physical characteristics.

W. E. ROBINS BRIDGEPORT WATER FLOOD
Introduction and History
The W. E. Robins Bridgeport Water Flood is being operated by the Ohio Oil Companyin Lawrence Field, Lawrence County, Illinois.
The flooded zone is the lower Bridgeport sand. The part of the flood now active coversthe whole of the Robins lease which occupies the SE l/4 of Section 5, T. 3 N. , R. 12 W. (Fig. 1).
The first Bridgeport producer in this area was completed in 1906, and the Robins leasewas developed between 1909 and 1913. The initial production of the wells averaged 80 barrelsof oil per day, but production dropped off rapidly to a few barrels of oil per day.
Repressuring by air and gas was used from 1944 to 1948 in an attempt to increaseproduction. Production which had been 450 barrels. per week for the lease was increased to a
maximum of 900 barrels per week as a result of the operation. The present flood on the Robinslease was started in 1948.
General Geologic Conditions
The W. E. Robins Bridgeport water-flood pay is located on the eastern flank of the
La Salle Anticline just down dip from the crest. The sand thickness ranges frona a few feet to slight-
ly over 100 feet in the center of the lease. On the west side of the lease the sand body is largely
replaced by shale (Fig. 15). The top of the lower Bridgeport sand is about 900 feet below the
surface.
Water-Flood History
The Ohio Oil Company first injected water in the lower Bridgeport sand on the Robins
lease in August, 1948, and a definite increase in production was noticed by April, 1949. A total of
1,306,585 barrels of water had been injected into the twenty-nine intake wells of the flood byJuly 31, 1950. An estimated 35,000 barrels of water-flood oil have been produced from the start
of the flood to July 31, 1950.
Water-Flood Developmient
An irregular five -spot pattern is used in the Robins flood. The distance between wells
is quite variable as a result of including the original producing wells in the five -spot pattern
(Fig. 14).
The intake wells are drilled with a rotary rig and completed with 4 l/Z-inch casing set
with cement through a depleted zone in the upper part of the sand. The wells are cleaned with a
wall-scratcher prior to water injection. Water is injected through the 4 l/Z-inch casing. Eachinjection well is equipped with -an individual meter. The producers on the lease are pumped, somefrom a central power unit and others from individual units powered by" electric motors
Although 34 injection wells were completed, water was being supplied to the 24 wells
on and immediately adjacent to the Robins lease due to limitations of water supply.
Water Source and Treatment
During the early part of the flood, water was supplied from a well in the Buchanan sand,
and injected into the reservoir through a closed system without treatment. Since October, 1949,
a fresh water well in alluvial gravels along the Embarras River six miles north of the lease has
supplied the water for the flood. The water is pumped through a pressure filter enroute to the
intake wells. The water system is closed. No chemical treatment i-s used. Water is supplied to
the well-heads at pressures up to 325 pounds per square inch, but most of the intake wells receive
water at littl-e or no pressure. Reduction of intake rates due to plugging of the sand face has been
corrected by the use of scratchers. Intake rates range from 0.5 barrels per foot of sand per dayto 10 barrels per foot per day with an average of five barrels per foot per day.
25

26
R. 12 W. 1
1
1i
• 'V
',
iT'
"• -4'.
•; ~r^ ;
V,.^ "•
6
ySHESHELUU r ^»»^= 5,L»WRENCE COUNTY ,NFm-.«r T
1
19^,.,
y "•". •• "» "•
. '!)'
> 'I " ®'"-^'^
'.
r'.
',®-
"' "/§'I
-.'. '.
•'V
,_ '««'-',.,_. i" wcnosms -' V
.*- >.
•
«H..,'•
'V '.^^^^1 \
®'° ', , ®'°
in .FJUDY
'• ^ '• '• H BRIDGEF ORT
DEVELOPMENT MAP — WE. R OBINS BRID ®•;;;;;;;„•;;
(SHOWING BRIOGEPORT^WELL 5 ONLY)y PLU««0 OIL WILL
LAWRENCE FIELD, LAWRENC E COUNTY, ILLINOIS
FIGURE 14
Prepared by Jack Foster from information furnished by the Ohio Oil Company.

27
FENCE DIAORAM
UPPER AND LOWER
BRIOSEPORT
WE. ROBINS BRI08EPORT WATER
LAWRENCE FIELD, LAWRENCE COUNTY,

28
STRUCTURE ON TOP OF LOWER BRIOGEPOR-
WE ROBINS BRIDGEPORT WATER FLOOD
LAWRENCE FIELD, LAWRENCE COUNTY IL

29
ISOPERM OF PAY ZONE IN LOWER BRIDGEPORT SAND
W.E. ROBINS BRIDGEPORT WATER FLOOD
LAWRENCE FIELD, LAWRENCE COUNTY, ILLINOIS
FieURE IT

50^iiSl*i-2^^2il^ . productivity of the flood
FJ6UIIE «8
.SOPACH OF 0.L PAY .N LOWER BRIDGEPORT SAND
*E. ROBINS BRIDGEPORT WATER FLOOD
LAWRENCE FIELD. LAWRENCE COUNTY. ILLINOIS
PATOKA WATER FLOOD
Introduction and History
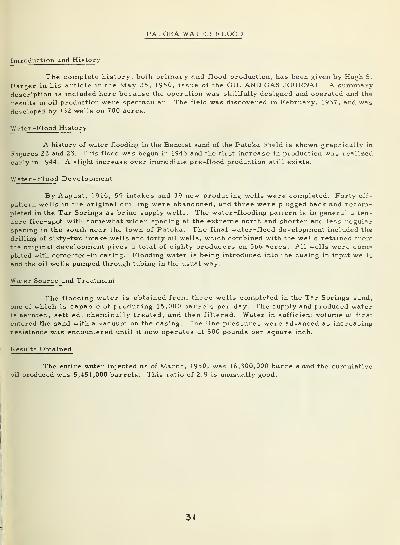
The complete history, both primary and flood production, has been given by Hugh S.
Barger in his article in the May 25, 1950, issue of the OIL AND GAS JOURNAL. A summarydescription is included here because the operation was skillfully designed and operated and the
results in oil production were spectacular. The field was discovered in February, 1937, and wasdeveloped by 132 wells on 700 acres.
Water-Flood History
A history of water flooding in the Benoist sand of the Patoka Field is shown graphically in
Figures 22 and 23. This flood was begun in 1943 and the first increase in production was realized
early in 1944. A slight increase over immediate pre-flood production still exists.
Water-Flood Development
By August, 1946, 59 intakes and 39 new producing wells were completed. Forty off-
pattern wells in the original drilling were abandoned, and three were plugged back and recom-pleted in the Tar Springs as brine supply wells. The water -flooding pattern is in general a ten-
acre five-spot with somewhat wider spacing at the extreme north and shorter and less regular
spacing in the south near the town of Patoka. The final water-flood development included the
drilling of sixty-two intake wells and forty oil wells, which combined with the wells retained fromthe original development gives a total of eighty producers on 566. acres. All wells were com--
pleted with cemented-in casing. Flooding water is being introduced into the casing in input wells
and the oil wells pumped through tubing in the usual way.
Water Source and Treatment
The flooding water is obtained from three wells completed in the Tar Springs sand,
one of which is capable of producing 15,000 barrels per day. The supply and produced wateris aerated, settled, chemically treated, and then filtered. Water in sufficient volume at first
entered the sand with a vacuum on the casing. The line pressures were advanced as increasing
resistance was encountered until it now operates at 500 pounds per square inch.
Results Obtained
The entire water injected as of March, 1950, was 16,300,000 barrels and the cumulativeoil produced was 5,451,000 barrels. This ratio of 2.9 is unusually good.
31


DDDD
ssem


o j^ /"i/"'
'''\ ,./
,oS r~'
3 =-r ,^"",,v/"\/'
i r ,.-y-\/ /v'^
y/ \
,-,'^«-" «o.ucx,o.
,--•
^^'°~ r,o.
^ / /
/
S^^ ^PLA^RE 5.«E
/-' ^-^...j^^Ui^

,».o
r°"j:irL
i;*
/
.z:?s::i /.-. f-
/
"ifus!;
|„o»
ii' y .~~
11
1
L71,.,, j:
7/
/
/'^^^^ i1"°"
i
.^^__^ ^ 1 liBELLAIR S SIGGINS \ ftOOD 0,1. PBODUCEO
s^
|. / BELLAIR -SOO- S-.ND | „„s'i""nV"°nd Y
il
1/ i
'
' °" /r
/...,.. r^"1 /j..
/" S- /
/ i/.O.C.W,,..,.
/ 1
"'
/ '"°>°^^"oo.o.P»nouc« 1 ^-^^J-^..0O0O.P«O0,.EO
T BELLAIR NEW HARMONY ^^^ JOHNSON SOUTH
i
i
/ i
/ 1
1"/ 1'" / 1
""
i
.. ^ !... / !.=.. /s
/ ^ """x/ ; '-\l
/„„.. 5- / 5'" L. 0.1
/"-: y ;^^Sci^>_,----
,„ o„c. i ^/^""°
ADEN , S
i
'
t MC CLOSKY LIME / | 1ROBINSON SANtt „„,„ „„„ ,„,„T li
|. / Lo / i„. Y fL£_^o,L
1.
/ i/
) ~ in
1.....^ / 1 / _,.. r°
/
i"^...,..
1 / J / - /
r / h / t- / ;^„?2Sc.°:^
1 ,. ...J.
1 PR0.UC.0 .„.» 3 ^ 7 P™.UC0> W.
1
« ..
1

CONCLUSIONS FROM A COMPARISON OF THE SIX DESCRIBED FLOODS
The six floods described have some notable similarities. Probably the most important
of these is that much was known concerning the physical characteristics of the reservoir rocks
and fluids before the floods were started. Other similarities are that all of the floods are pat-
tern floods and that flood development covers an extensive area. Some of the more important
dissimilarities are different operating techniques, different geologic ages of flood pays, and
the great difference in the term of primary production.The data given above for the six floods will be useful in considering the flooding pos-
sibilities of other areas where some information on reservoir characteristics is available. In
addition the behavior of these six floods should furnish a sound basis on which to check conn-
putations on fill-up time, water requirements, oil production, and life of flood production once
a flood project is started.
General Conclusions
Although all of the thirty-one controlled floods tabulated in this report were started
since 1942, five out of the seven Chester (upper Mississippian) sand zones and the two most im-portant lower Mississippian producing zones now have water floods in operation. These Mis-sissippian floods plus the fifteen floods in the many Pennsylvanian sands give Illinois a nearlycomplete check on the general floodability of its many producing zones.
The Pennsylvanian sand floods are numerically in the lead because of their shallow
depth and because they are closer to primary depletion than the more recently drilled producing
formations. McClosky floods are next in numerical order primarily because their high per-meability makes flooding on the primary well spacing feasible and because McClosky producingareas have generally been favored by abundant water supplies in the shallower formations. Theremaining zones undergoing water flooding in Illinois have from 1 to 3 floods each. Of these
zones, two have been outstandingly successful, the Tar Springs in Maunie South, and the Benoistin the Patoka Field. The three floods in the high water content Aux Vases sand have not yet
settled the question of the floodability of the Aux Vases sand, but the progress of these floods hasimproved the prospects for the eventual successful flooding of this horizon.
There does not appear to be any "best" formation for flooding in Illinois. All forma-tions seem capable of possessing the necessary characteristics for successful flooding in oneor more places within the state.
37

38
300
BLAIRSVILLE GRAYVILLE WEST o
s AUX VASES SAND BIEHL SAND |
fe"0
/1
'^
Loo / RATIO WATER INPUT \
O
^ /FLOOD OIL PRODUCED'^
(-
1
WATER INPUT / z
^1
1 > 1^ ^1^ JS / 2g,00
1 /
o^ 100
%2
/ 1WATER / "^
>/ 11
INPUT. 1
' FLOOD OIL
3i
/ PRODUCED
/ "^'^^
/ i .. FLOOD OIL
/ ^_^^PROOUCED
- H / PRODUCED
2
1 //^,.4-PRODUCED WATER
48 49
lOLA
\
\ .
NEW HARMONy\.
3 AUX VASES SAND FORD "A" LEASE \ offl V
MCCLOSKY LIME Jfe
RATIO'''^
a 55 WATER INPUT
iS TO oo FLOOD OIL 31- PRODUCED
i 2
.o
z< ^i
* EZ "
bi '°°
i-
O- .00 ^3 8 2 S
u; 50-
WATER INPUT—*^/UJ X BO
'
1
>
y^ PRODUCED WATER
^"f^' • : NO FLOOD OIL PRODUCE
>H WATER INPUT
*i-1
\ FLOOD
X —--' OIL
i3
i" 3
—'^ PRODUCEDPRODUCED
48 49 "«' 49
FIGURE 25GRAPH OF WATER INPUT AND OIL PRODUCED BY WATER FLOODING

39
<^ (g>_^-^
„ I
""'"'T (^
-4>-
^
Reed Heirs
@N Birch
,
•
^ CB.Oo.l>
A
mj^eTcomm
ffl Water (uppJy wi
FIGURE 26DEVELOPMENT MAPS
40
»>»m»I
CBforiem|
F SchwHtl
(gP*^ -@^
WEST GfWVLLE FIELD
WHITE COUNTY, ILLINOIS
BIEHL SAND
I THE THREE AREAS
NEW HARMONY FIELDWHITE COUNTY, ILLINOIS
a POSEY COUNTY, INDIANA
WALTERSBURG SAMO
-ay-
Ni» Hormony Rtalty Cocni I
FIGURE 27DEVELOPMENT MAPS


![Development of a Correlation to Predict Water-Flooding ... · from reservoir rock and fluid properties [16]. Schauer -flood behavior of Illinois Basin water flooding performance [4]](https://img.dokumen.tips/doc/110x75/5f9bb75b2ff60931c04f2663/development-of-a-correlation-to-predict-water-flooding-from-reservoir-rock-and.jpg)