Embed Size (px)
Citation preview

Summary of recent photocathode studies
S. Lederer, S. SchreiberDESY
L. Monaco, D. SertoreINFN Milano – LASA
FLASH seminar November 17 th, 2009

S. Lederer, DESY FLASH seminar, November 17th, 2009
Outlook
• Cs2Te photocathodes• Pulsed QE measurements
– laser transmission– measurements
• Cathode life time• Dark current investigations• Summary and conclusion

S. Lederer, DESY FLASH seminar, November 17th, 2009
Cs2Te photocathodes
Cs2Te photocathodes for FLASH prepared at INFN-Milano, LASA, Italy
Preparation Chamber @ LASA
Transport Box • UHV Vacuum System - base pressure 10 -10
mbar• 6 sources slot available• Te sources out of 99.9999 % pure element• Cs sources from SAES ®
• High pressure Hg lamp and interference filter for online monitoring of QE during production
• Masking system• 5 x UHV transport box
After preparation transport to FLASH or PITZ under UHV conditions

S. Lederer, DESY FLASH seminar, November 17th, 2009
Cs2Te photocathodes
band gap EG
CB
VB
vacuum level
electron affinityEA
Cs2Te photocathodes• semiconductor• band gap EG = 3.3 eV• positive electron affinity EA = 0.2 eV
+ ability to release high peak current electron bunches+ high QE+ stabe under RF operation+ response time ~ 1 ps
- need UHV (<10-9 mbar)- UV laser needed
For DESY:active area 5 mmthickness controlled by Te amount (no co-evaporation), standard 10 nm Te
S. Lederer, DESY FLASH seminar, November 17th, 2009
12000 14000 16000 18000 20000 22000 240000.0
0.2
0.4
0.6
0.8
1.0
1.2
1.4
1.6
1.8
2.0
12000 14000 16000 18000 20000 22000 2400036
38
40
42
12000 14000 16000 18000 20000 22000 240000.0
0.1
0.2
0.3
0.4
0.5
0.6
0.7
data sin 2 fit
laser data
Ela
ser
( µµ µµJ)
attenuator
calculated transmissionmean: 37.3568 %
trans
mis
sion
attenuator
data sin 2 fit
tunnel data iris 3 mm
E (
µµ µµJ)
attenuator
QE measurements
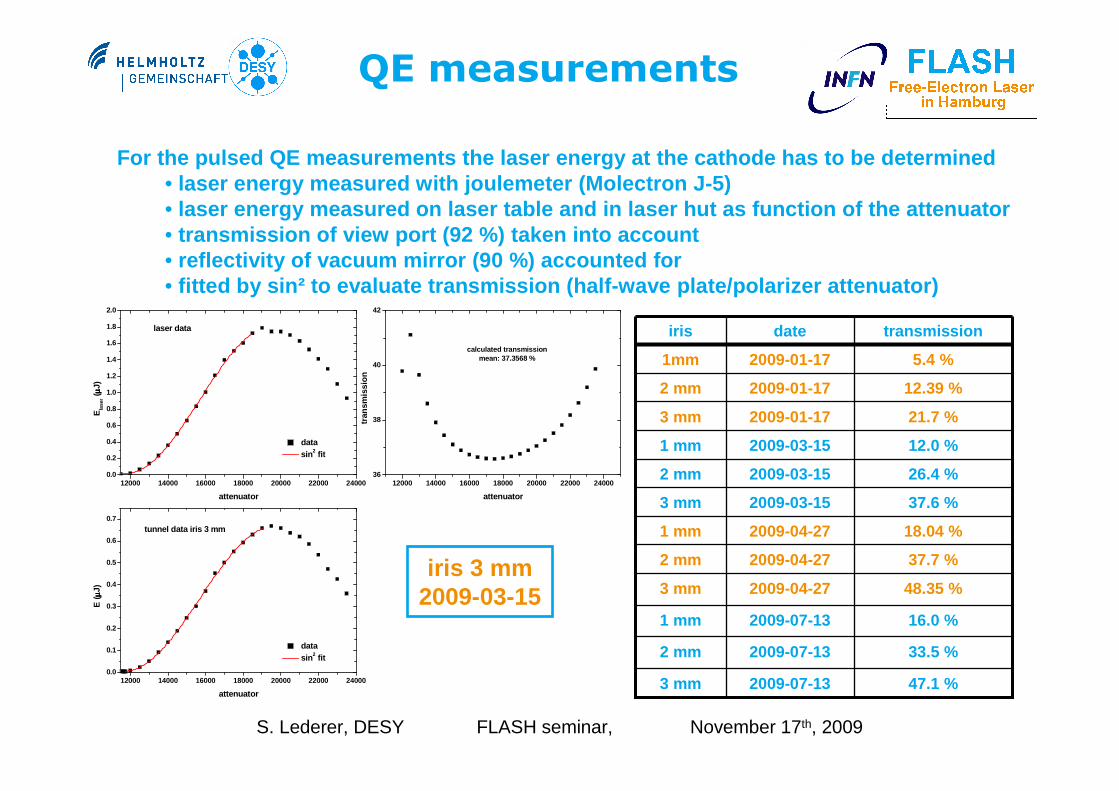
47.1 %2009-07-133 mm
33.5 %2009-07-132 mm
16.0 %2009-07-131 mm
48.35 %2009-04-273 mm
37.7 %2009-04-272 mm
18.04 %2009-04-271 mm
37.6 %2009-03-153 mm
26.4 %2009-03-152 mm
12.0 %2009-03-151 mm
21.7 %2009-01-173 mm
12.39 %2009-01-172 mm
5.4 %2009-01-171mm
transmissiondateiris
For the pulsed QE measurements the laser energy at the cathode has to be determined• laser energy measured with joulemeter (Molectron J-5)• laser energy measured on laser table and in laser h ut as function of the attenuator• transmission of view port (92 %) taken into account• reflectivity of vacuum mirror (90 %) accounted for• fitted by sin² to evaluate transmission (half-wave plate/polarizer attenuator)
iris 3 mm2009-03-15
S. Lederer, DESY FLASH seminar, November 17th, 2009
0 0.05 0.1 0.15 0.2 0.25 0.30
0.2
0.4
0.6
0.8
1
1.2
1.4
1.6
1.8
2
Laser Energy (uJ)
Cha
rge
(nC
)
QE measurements
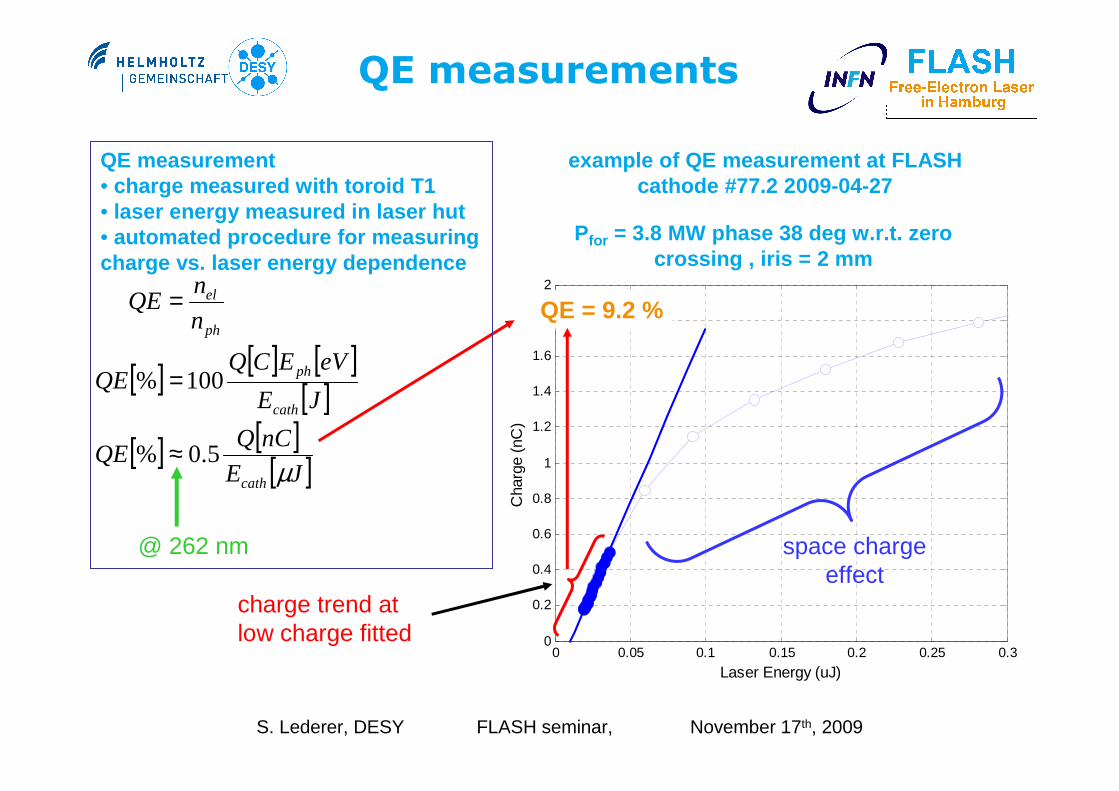
example of QE measurement at FLASHcathode #77.2 2009-04-27
QE = 9.2 %
Pfor = 3.8 MW phase 38 deg w.r.t. zero crossing , iris = 2 mm
[ ] [ ] [ ][ ]
[ ] [ ][ ]JE
nCQQE
JE
eVECQQE
n
nQE
cath
cath
ph
ph
el
µ5.0%
100%
≈
=
=
@ 262 nm space chargeeffect
charge trend at low charge fitted
QE measurement• charge measured with toroid T1• laser energy measured in laser hut• automated procedure for measuring charge vs. laser energy dependence
S. Lederer, DESY FLASH seminar, November 17th, 2009
QE measurements
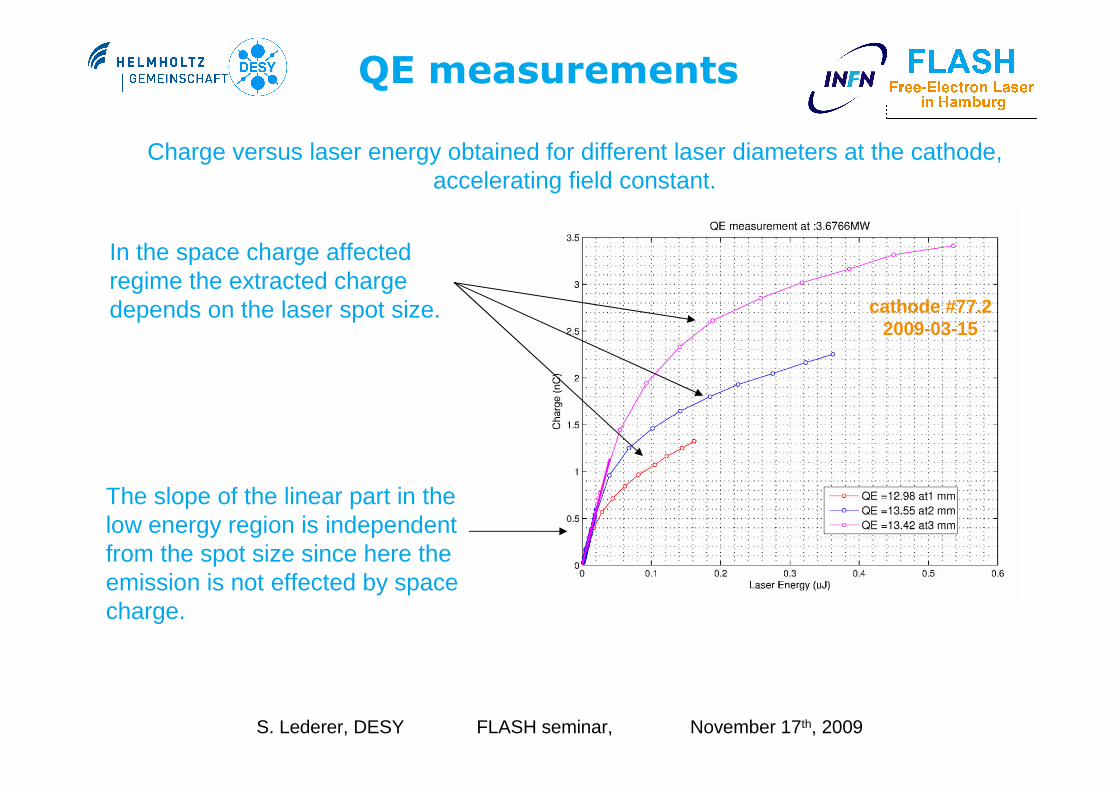
Charge versus laser energy obtained for different laser diameters at the cathode,accelerating field constant.
The slope of the linear part in the low energy region is independent from the spot size since here the emission is not effected by space charge.
In the space charge affected regime the extracted charge depends on the laser spot size. cathode #77.2
2009-03-15

S. Lederer, DESY FLASH seminar, November 17th, 2009
QE – vs. field
( ) ( )m
eeAG
EqqEEhAQE
⋅⋅⋅⋅⋅⋅++−⋅=επ
φβν4
sin
From the fit of QE versus electric field at the cathode one gets information about the work function and the geometric enhancement factor.
EG+EA = 3.5 eVββββ = 4.7QE @ zero field = 11.2 %
RF data analysis – QE enhancement– QE @ given acc. gradient E and phase φφφφ– with a given laser energy without space charge
where E is the accelerating field, φφφφ is the phase RF/laser, ββββ is the geometric enhancing factor
cathode #77.22008-01-17

S. Lederer, DESY FLASH seminar, November 17th, 2009
QE – vs. field
cathode #77.2 2009-01-17QE @ zero gradient = 11.2 %
W = EG+EA = 3.5 eVββββ = 4.7
cathode #77.2 2009-03-15QE @ zero gradient = 4.5 %
W = EG+EA = 3.8 eVβ= 12.7
56 days of operation
→ QE decreased→ EG+EA increased→ field enhancement increased
measurements impossible

S. Lederer, DESY FLASH seminar, November 17th, 2009
Cathode life time
0 20 40 60 80 100 120 140 160 1800
4
8
12
16
20
24 cathode #13.4 cathode #77.2
QE
(%
)
days of operation
For the actual operation mode of FLASH, there are NO life time problems.Cathode changes have not been motivated by low QE!Since summer 2008 only 3 cathodes have been used
(#13.4, #77.2, and #53.2)!
open question: life time for long pulse train operation
S. Lederer, DESY FLASH seminar, November 17th, 2009
QE maps
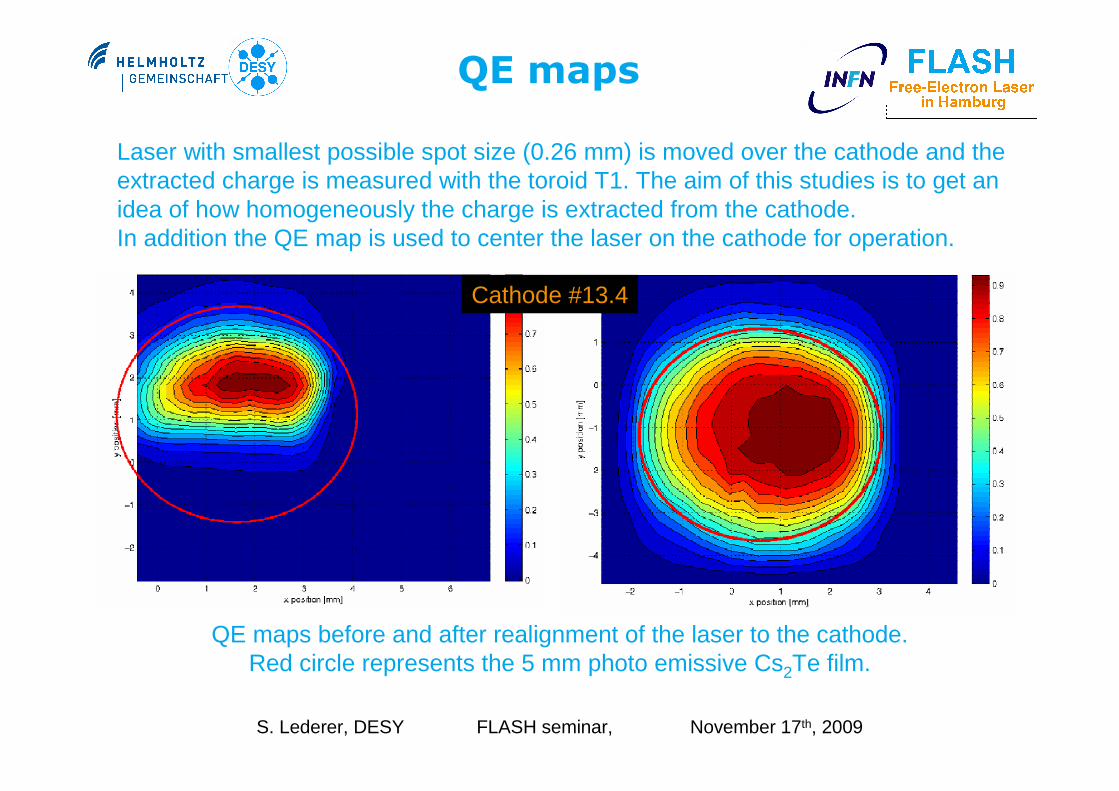
Laser with smallest possible spot size (0.26 mm) is moved over the cathode and the extracted charge is measured with the toroid T1. The aim of this studies is to get an idea of how homogeneously the charge is extracted from the cathode.In addition the QE map is used to center the laser on the cathode for operation.
QE maps before and after realignment of the laser to the cathode. Red circle represents the 5 mm photo emissive Cs2Te film.
Cathode #13.4
S. Lederer, DESY FLASH seminar, November 17th, 2009
QE maps
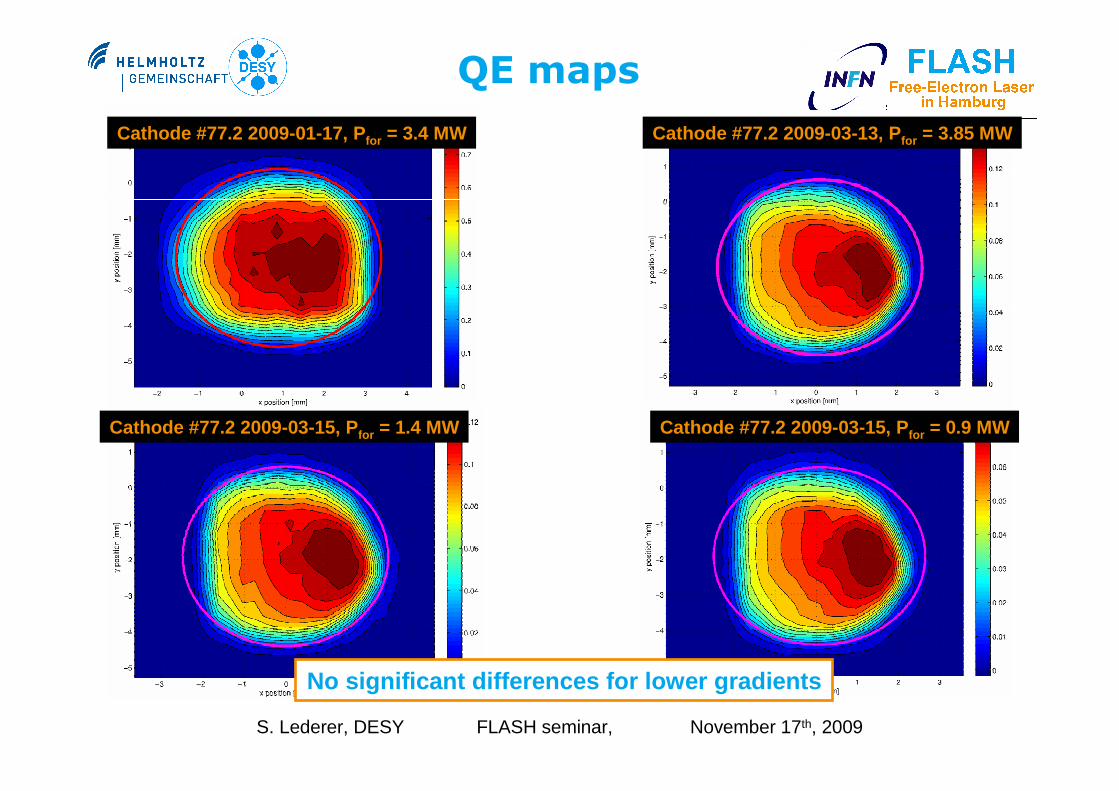
Cathode #77.2 2009-01-17, P for = 3.4 MW Cathode #77.2 2009-03-13, P for = 3.85 MW
Cathode #77.2 2009-03-15, P for = 1.4 MW Cathode #77.2 2009-03-15, P for = 0.9 MW
No significant differences for lower gradients

S. Lederer, DESY FLASH seminar, November 17th, 2009
Optical inspection
before usage (2009-01-17) after usage (2009-06-08)
cathode #77.2
2009-07-13

S. Lederer, DESY FLASH seminar, November 17th, 2009
Pfor=3.94 MWrf length 400 µµµµssolenoid 305 Abucking -22.8 A
dc level 500 µµµµA
Pfor=3.94 MWrf length 400 µµµµssolenoid 250 Abucking -22.8 A
dc level 500 µµµµA
Pfor=3.94 MWrf length 400 µµµµssolenoid 305 Abucking -22.8 A
dc level 480 µµµµA
Pfor=3.94 MWrf length 400 µµµµssolenoid 250 Abucking -22.8 A
dc level 400 µµµµA
cathode #77.2
cathode #53.2
In general dc hard to measure!! The hot spots for #53.2 go from left to right while increasing the solenoid field
Dark current

S. Lederer, DESY FLASH seminar, November 17th, 2009
Dark current
• Dark current constantly high and only acceptable if no problem with the cathode
• In addition caused by ageing of the gun full scans have been impossible (vacuum interlocks)
2.0 2.5 3.0 3.5 4.00.0
0.1
0.2
0.3
0.4
0.5
Mo: #90.2 2009-01-16
Cs2Te:
#13.4 2008-10-02 #13.4 2009-01-15 #77.2 2009-01-17 #77.2 2009-03-13
dark
cur
rent
(m
A)
RF power (MW)
200 220 240 260 280 300 320 340 360 3800.14
0.16
0.18
0.20
0.22
0.24
0.26
0.28
0.30
0.32
0.34
dark
curr
ent (
mA
)
main solenoid current (A)
Dark current vs. main solenoid currentMax. dark current from solenoid
scan vs. RF power

S. Lederer, DESY FLASH seminar, November 17th, 2009
Dark current
2.0 2.5 3.0 3.5 4.0 4.5 5.0 5.5 6.0 6.5 7.00.0
0.1
0.2
0.3
0.4
0.5
dark
cur
rent
(m
A)
RF power (MW)
FLASH gun#2
PITZ gun #4.2typical dark current with Cs2Te cathode (#128.1)
Gun 4.2 will be mounted at FLASH January 2010
S. Lederer, DESY FLASH seminar, November 17th, 2009
Summary and Conclusion
• Results from last beam times presented– Laser beam line transmission (from January until Ju ly 2009)– pulsed QE
• Measurements and analysis• Evolution over time• Life time
– QE maps
• More studies needed for further understanding the Q E behaviour under influence of RF field
• More studies needed after long pulse train operatio n
• Dark current issues– dc images– dc vs. main solenoid scans– dc for different RF power