Embed Size (px)
Citation preview

BOARD OF REGENTS
Summary of Item for Action,Information or Discussion
TOPIC: Report to the Board titled: “Climate Actions and Progress Toward the Reduction of
Greenhouse Gas Emissions at Institutions of the USM” COMMITTEE: Finance DATE OF COMMITTEE MEETING: June 18, 2013 SUMMARY: All USM institutions are signatories to the American College and University Presidents Climate Commitment (ACUPCC). The ACUPCC is a “high-visibility effort” to address global climate change by creating a network of colleges and universities that have committed to neutralize their greenhouse gas emissions and accelerate the research and educational efforts of higher education to equip society to re-stabilize the earth’s climate. Signatories of the Presidents’ Climate Commitment are required to submit Implementation Profiles, Greenhouse Gas Reports, Climate Action Plans, and Progress Reports in the ACUPCC Reporting System. These reports are made regularly, based on a series of scheduled milestones established by the Commitment. All are publicly available online. What follows is a report from each campus based on their individual goals and progress toward GHG reductions as reported to the ACUPCC. This report is provided for your information. Future reports and discussion can be incorporated into the Board meeting schedule as needed. ALTERNATIVE(S): This is an Information Item. FISCAL IMPACT: This is an Information Item. CHANCELLOR’S RECOMMENDATION: This is an Information Item. COMMITTEE RECOMMENDATION: DATE: BOARD ACTION: DATE: SUBMITTED BY: Joseph F. Vivona 301.445.1923
c:\home\lem\bor\2013 - 061813\climate report.doc


CLIMATE ACTIONS AND PROGRESS TOWARD
THE REDUCTION OF GREENHOUSE GAS EMISSIONS
AT INSTITUTIONS OF THE USM
A REPORT TO THE BOARD OF REGENTS May 30, 2013
The USM adopted the American College & University Presidents Climate Commitment
(ACUPCC) as the standard mitigation approach for all institutions, and the presidents of all USM
institutions have signed the Commitment. The ACUPCC process, with its nationally
benchmarked implementation program of milestones, schedules and resources geared
specifically to higher education provides the ideal implementation tool for mitigation efforts at
USM institutions.
Climate change mitigation efforts are similar for all institutions in all states and proven and
measurable tools and methodologies are available from other signatory schools that will
ultimately accelerate our success in this important effort. Furthermore, the ACUPCC includes
incentives in the form of deadlines and public reporting of uniform achievement measures to
help encourage all institutions to maintain their momentum, thus making it the most effective
and efficient way for USM institutions to move toward carbon neutrality.
The Presidents’ Climate Commitment*
The ACUPCC is a “high-visibility effort” to address global warming (global climate disruption)
by creating a network of colleges and universities that have committed to neutralize their
greenhouse gas emissions and accelerate the research and educational efforts of higher education
to equip society to re-stabilize the earth’s climate.
What is Sustainable Development? The commonly accepted definition of sustainable
development is defined as, “development that meets the needs of the present with- out
compromising the ability of future generations to meet their own needs.”
However, as pointed out by Lander Medlin (executive vice president, Association of Physical
Plan Administrators), “sustainability is not just about protecting the environment—it is also
about finding ways to meet the basic needs of all current and future generations of humans.” The
ACUPCC seeks to encourage higher education institutions to give their students tools to think
with a sustainable perspective for the future.
What is the role of the ACUPCC? The ACUPCC seeks to create connections with higher
educational institutions in order to carry out two goals:

1. The first is to make an agreement with these colleges and universities that they will
commit to eliminate their net greenhouse gas emissions from specified campus
operations.
2. The second focuses on education and the institutions’ ability to promote research of
sustainability programs and empower the "higher education sector to educate students,
create solutions, and provide leadership-by-example for the rest of society."
ACUPCC provides “a framework and support” for America’s colleges and universities. The
ACUPCC relies on institutions of higher education to be role models for their communities as
well as students, and to educate people who will contribute to fighting to reverse global warming
and create a sustainable society.
This Report to the Board of Regents
It has been said that "the first step towards getting somewhere is to decide that you are not going
to stay where you are." Institutions of the University System of Maryland have been pursuing
sustainability and energy conservation for decades.
The accelerated pace of climate change, however, has pushed sustainability initiatives into high
gear and USM institutions are pursuing mitigation and adaptation activities on their campuses at
a pace that has drawn the attention of the Governor and agencies of the State. USM is a
recognized leader in climate change mitigation, recycling and energy reduction; and it is
important that we maintain this positive momentum.
Signatories of the Presidents’ Climate Commitment are required to submit Implementation
Profiles, Greenhouse Gas Reports, Climate Action Plans, and Progress Reports in the ACUPCC
Reporting System. These reports are made regularly, based on a series of scheduled milestones
established by the Commitment.
What follows is a report from each campus based on their individual goals and progress toward
GHG reductions as reported to the ACUPCC. This report is provided for your information.
Regular reports and ongoing discussion can be incorporated into the Board meeting schedule as
needed.
*This section is from public statements published at http://www.presidentsclimatecommitment.org/

University of Maryland, Baltimore PROGRESS TOWARD CLIMATE ACTION GOALS
I. GHG Emissions and Reduction Targets
Climate Neutrality Target Date:
Interim Milestone Emission-Reduction Target Target Date Baseline
25 2020 2007
35 2030 2007
50 2040 2007
GHGs Summary
Reporting Year Gross Emissions Net Emissions FTES Enrollment Total Bldg SF
2012 159,749 146,893 6368 5,816,308
2011 166,436 160,030 6395 5,762,219
2010 168,859 164,490 6349 6,246,553
2009 166,356 162,405 6382 6,117,962
2008 161,482 157,567 5868 5,842,508
2007 169,059 165,806 5884 5,842,508
Summary Totals
Change in GHG gross emissions: -9310
Change in GHG emissions per 1000 sq.ft. building space: 1.33
Change in GHG emissions per full time enrollment (FTE): -1.04

University of Maryland, Baltimore PROGRESS TOWARD CLIMATE ACTION GOALS
II. Action Plan Summary
Guided by the Campus Sustainability Committee and its four subgroups (Design/Construction,
Operations, Education and Awareness, and Transportation), the University has made significant
progress in making sustainability part of the UMB culture.
Design/Construction Successes:
Exploring the development of a combined heat/power facility
Implementation of energy-saving space temperature set points and night setbacks
LEED Gold certification for the School of Pharmacy Addition
All programs for new construction and major renovations include the requirement for LEED
Silver or better
Adopted the use of low flow fume hoods and a maximum of six air changes in lab buildings
Retrofitting all campus fluorescent lighting from T12 and T8 to T5
Eliminated incandescent lighting campus-wide and replaced with CFL or LED lighting
Established a building re-commissioning program and will hire a re-commissioning manager to
oversee the process
Increased green space; i.e, turn hard surfaces to green space
Redesigned Plaza Park to be a vibrant and useful green space
Operations Successes:
Recycling of electronics and batteries
Achieved a campus-wide 41.25% recycle rate for paper, plastic, and cans
Goodwill containers on campus
Goodwill shop located in the BioPark
Participate in the govedeals.com websites to auction used equipment
Eliminated the use of personal trash containers by encouraging the use of a centralized location to
deposit trash, bottles, cans, and other recyclable items
Transportation Successes:
Electric vehicle charging stations in every garage
New, energy efficient shuttle buses
Zipcars on campus, a car sharing alternative to having a vehicle on campus
Bike Racks, secure bike cage
Improved carpooling programs with designated carpool parking spaces
Participation in the Guaranteed Ride Home Program
Partnered with Zimride, a program that allows people to search for rides or post information
about needing a ride. The program interfaces with all social media including Facebook, Twitter,
and the University’s website
In partnership with the City of Baltimore, the Charm City Shuttle, which makes several stops
throughout the UMB campus, service residents, downtown employees, students and tourists and
anyone else who wishes to ride. The shuttle is intended to reduce congestion and greenhouse gas
pollution by offering a convenient, reliable and eco-friendly form of public transportation.

Education and Awareness Successes:
Created a sustainability website that highlights campus efforts
Promotion of major University initiatives such as the Farmers Market, campus recycling,
alternative transportation, the Green Room, and energy conservation
Educating the University community regarding sustainability initiatives and how they can get
involved
The development of effective communication and outreach tools, such as the UM Go Green
website, the use of digital displays, Facebook, Twitter, the University website, the University
newsletter (VOICE) and the VOICE online
Monthly lunch and learn sessions with invited guest speakers who discuss sustainability

University of Maryland (College Park) PROGRESS TOWARD CLIMATE ACTION GOALS
I. GHG Emissions and Reduction Targets Climate Neutrality Target Date: 2050 Interim Milestone Emission-Reduction Target Target Date Baseline 15 % reduction in carbon emissions 2012 2005 25% reduction in carbon emissions 2015 2005 50% reduction in carbon emissions 2020 2005 60% reduction in carbon emissions 2025 2005 GHGs Summary Reporting Year Gross Emissions Net Emissions FTES Enrollment Total Bldg SF 2005 325,015 325,015 31,726 13,236,841 2006 316,255 316,255 31,589 13,236,841 2007 305,365 305,365 32,420 13,236,841 2008 303,579 303,579 33,211 13,367,415 2009 268,695 268,965 33,518 13,436,383 2010 274,699 237,141 33,838 14,004,247 2011 change since 2005
280,337 (13.7% reduction)
278,356 (14.4 % reduction)
34,033 (7.3 % increase)
14,242,643 (7.6% increase)
Graphs
Summary Totals • Change in GHG gross emissions: Reduction of 46,658 MTCO2e • Change in GHG emissions per 1000 sq.ft. building space: Reduction of 5.0 MTCO2e • Change in GHG emissions per full time enrollment (FTE): Reduction of 2.1 MTCO2e

University of Maryland (College Park) PROGRESS TOWARD CLIMATE ACTION GOALS
II. Action Plan Summary
Overall • 14.4 % net reduction in carbon emissions achieved as of 2011. • A 2012 carbon footprint will be completed this summer; Projections indicate that the 2012 target of a
15% reduction will be met. • In April 2013, a Sustainable Buildings and Energy Sources Work Group chaired by the Associate Vice
President for Facilities Management recommended new energy policies to the University Sustainability Council that would cap carbon from campus growth and require 20 percent energy savings for all campus buildings by 2020. If approved by the President and Senate, the implementation of these policies will keep UMD on track to meet the 2015 target of a 25% reduction in carbon emissions from power and operations.
• Additional work groups are needed to address challenges in reducing carbon emissions associated with on-site power generation and air travel.
Energy Conservation • $20 million contract for improved energy efficiency in nine buildings completed (23% of carbon savings) • Multiple energy conservation projects including lighting upgrades in hallways, classrooms and offices;
installation of occupancy sensors in general purpose classrooms; installation of variable frequency drives on chillers and other HVAC equipment; additional controls on laboratory fume hoods; and optimization of computer equipment and usage in limited areas (at least 12% of carbon savings)
• Green Office Program developed to encourage behavior changes to reduce energy use in offices (small, unmeasurable percentage of carbon savings)
• Energy Performance Contract with Intercollegiate Athletics (ICA) currently under construction (a reduction of approximately 535 MT-CO2e will be factored into 2013 carbon footprint and will increase to 765 MT-CO2e in 2014)
Renewable Energy • Three 20-year contracts through USM to purchase energy from regional wind and solar projects ( a
reduction of over 7,500 MT-CO2e will be factored into 2012 carbon footprint ) • One 20-year contract to purchase energy from on-site rooftop solar project (a reduction of approximately
440 MT-CO2e will be factored into 2016 carbon footprint) • One-time student purchase of 66,000 Renewable Energy Certificates (RECs) to reduce emissions from
purchased power in 2010
Transportation • 5,130 commuter parking permits eliminated by students, faculty and staff choosing to use alternative
modes of transportation (28% of carbon savings) • Outreach, education, support and incentives for commuters to use public transportation, ride sharing,
biking or walking to get to campus
Solid Waste • Single stream recycling, “Can-the-Can, construction waste recycling, and other strategies increased
campus waste diversion from landfills to 64%; remaining waste is sent to landfills that use carbon capture technologies (15% of carbon savings)
• Composting programs to collect organic waste from dining halls, landscaping and campus barns (1% of carbon savings)
Education & Research • New sustainability minor developed and launched in 2012 is now second largest minor on campus • Education for Sustainability Work Group began meeting in spring 2013 to develop a list of core
competencies that all students should have to address; and to map strategies/courses that teach these core competencies.

BOWIE STATE UNIVERSITY
PROGRESS TOWARD CLIMATE ACTION GOALS
I. GHG Emissions and Reduction Targets
Climate Neutrality Target Date:
Interim Milestone Emission-Reduction Target Target Date Baseline
20% reduction in Total Scopes 1, 2, 3 emissions By 2019 Baseline of 2007
15% reduction in Total Scopes 1, 2, 3 emissions By 2025 Baseline of 2007
10% reduction in Total Scopes 1, 2, 3 emissions By 2035 Baseline of 2007
GHGs Summary
Reporting Year Gross Emissions Net Emissions FTES Enrollment Total Bldg SF
2007 25444 24907 4647 1191996
2008 24367 24070 4926 1257430
2009 23743 23448 5045 1257430
2010 24306 24002 5113 1275485
2011 27325 26991 5060 1372130
2012 25669 25669 5608 1372130
Summary Totals
Change in GHG gross emissions: 32851
Change in GHG emissions per 1000 sq.ft. Building space: 21.139

Change in GHG emissions per full time enrollment (FTE): 3.766
Bowie State University PROGRESS TOWARD CLIMATE ACTION GOALS
II. Action Plan Summary:
In the years since the BSU Climate Action plan was developed the university has made
significant strides towards reaching carbon neutrality such as:
Implementing an Energy Performance Contract (i.e., lighting and bathroom retrofits,
fortifying building envelope)
Purchase of electric service vehicles
Employed energy-efficiency principles during the design of the Fine and Performing
Arts Center
In addition, other efforts undertaken by the university to enhance sustainability awareness and
promote sustainable lifestyles include:
Forging partnerships with Toyota Green Initiative and Verizon.
BSU was the launching ground for the Nationwide Toyota Green Initiative (TGI)
BSU staged a fully immersive TGI event including:
o A student-focused lecture series, recycling and other activities relating to
sustainability as a way of life, and
o A greenhouse re-planting activity undertaken where student groups separated and
replanted 87 day lilies and 16 irises, which yielded upward of 250 perennials in
the spring for replanting as part of the campus landscape.
o Student involvement in the TGI recycle event yielding upward of 7,000 pounds
or over 3 tons of recyclable materials to include:
Plastic: 5,365 lbs.
Aluminum: 1,172 lbs.
Paper: 367 lbs.
Clothing: 21 lbs.
Glass: 267 lbs.
BSU was awarded a Verizon Sustainability Grant. The proceeds from this grant are being used for the
following:
The purchase of 1,000 room-sized recycles bins to be placed in each student room of the 7
campus residence halls.
Purchase of 4 outdoor recycle centers
Purchase of (5) bike racks
Sustainability Poster campaign using student poster designs.

Towson University PROGRESS TOWARD CLIMATE ACTION GOALS
I. GHG Emissions and Reduction Targets Climate Neutrality Target Date: Interim Milestone Emission-Reduction Target Target Date Baseline 25% reduction in emissions per full time equivalent enrollment 2020 2008 50% reduction in emissions per full time equivalent enrollment 2030 2008 100% reduction in emissions per full time equivalent enrollment 2050 2008 GHGs Summary: Reporting Year Gross Emissions Net Emissions FTES Enrollment Total Bldg SF 2008 118,057 114411.0 18,699 4,296,237 2009 113,825 109183.0 18,860 4,441,170 2010 109,428 109798.8 19,343 4,552,210 2011 112,361 112625.0 19,160 4,552,210
Graphs: Table 1: Towson Greenhouse Gas Emissions FY 2008 – FY 2011 Table 2: Towson Greenhouse Gas Emissions FY 2011
Summary Totals:
Change in GHG gross emissions: Towson University’s net GHG emissions have decreased by 4.8 percent relative to the 2008 baseline.
Change in GHG emissions per 1000 sq.ft. building space: Emissions decreased 10.2 percent from 2008. Change in GHG emissions per full time enrollment (FTE): Emissions decreased 7.1 percent from 2008.
Table 3. Normalized net GHG emissions and energy consumption by FY w/ trends
Metric FY 2008 FY 2009 FY 2010 09-10 % Change FY 2011
10-11 % Change*
08-11% Change
MTCO2e/ FTE Student 6.314 6.035 5.657 -6.26% 5.864 3.66% -7.11%
MTCO2e/1000 GSF Physical Space 27.479 25.630 24.039 -6.21% 24.683 2.68% -10.18%
MTCO2e/Community Member 5.384 5.139 4.824 -6.13% 4.964 2.92% -7.79%
Mil. BTU/ FTE Student 88.981 85.222 82.697 -2.96% 87.079 5.30% -2.14%
Mil. BTU/ 1000 GSF Physical Space 387.280 361.899 351.381 -2.91% 366.511 4.31% -5.36%
Mil. BTU/Community Member 75.874 72.561 70.507 -2.83% 73.714 4.55% -2.85%
MTCO2e/Mil. BTU 0.071 0.071 0.068 -3.40% 0.067 -1.56% -5.09%
Towson University PROGRESS TOWARD CLIMATE ACTION GOALS
II. Action Plan Summary Highlights of Progress: Between FY 2008 and FY 2009:
Towson University’s total GHG emissions have decreased by 4.8 percent relative to the 2008 baseline. GHG emissions from stationary fuel decreased by 10 percent, faculty and staff commuting by 31 percent, student
commuting by 10 percent, and solid waste by 7 percent. GHG emissions from purchased electricity increased 7 percent. Fewer GHGs are emitted and less energy consumed per gross square foot of space, per full-time equivalent
student, and per community member. Goals: TU will be increasing its enrollment in the next ten years. As a result new facilities will be built and old ones renovated or demolished. TU must be prepared for near-term growth in physical space and associated increases in energy demand. Specifically, electricity consumption on-campus will likely continue to rise with an anticipated addition of 1.2 million gross square feet by FY 2015. Offsetting this growth in greenhouse gas emissions to a degree is the addition of 700 beds on campus, which will reduce GHG emissions from student commuting. Towson’s climate goals are to
Reduce greenhouse gas emissions per full time equivalent enrollment (FTE) by 25 percent by 2020. Reduce GHG emissions per FTE by 50 percent by 2030. Reduce GHG emissions per FTE by 100 percent by 2050.
Actions Taken: TU completed an $8 million Energy Services Contractor (ESCO) project to increase the energy efficiency of campus
lighting in 2012. The project will reduce greenhouse gas emissions by 10,000 tons annually and save more than $1 million in energy costs each year.
In late 2010, the lighting fixtures on the east canopy of the Enrollment Services building were replaced with high-efficiency LED fixtures. The new lighting consumes 70 percent less energy than the previous fixtures.
Electric SmartMetering systems have been installed in almost all campus buildings providing accurate, real time monitoring of electrical usage and demand.
The Campus Utility Plant Addition, completed in 2009, has expanded the production and distribution of heating, cooling and electricity on campus. The efficiencies gained from buildings being connected to the plant are expected to reduce the university’s cooling power consumption significantly.
The University has engaged the services of a Curtailment Services Provider (CSP) to enroll in demand side management programs with the Pennsylvania-New Jersey-Maryland (PJM) regional transmission organization. These programs provide cost incentives, usually based on wholesale market rates, for voluntary electrical load reduction during periods of high electrical demand in the regional area.
The university built two LEED Gold certified buildings—The College of Liberal Arts and West Village Commons. All future buildings will be built to Leadership in Energy and Environmental Design (LEED) Silver standard or better.
The campus fleet contains five electric and hybrid vehicles. Shuttle buses, increased parking costs, and a car share have been expanded to reduce emissions from commuting.
In 2013 TU installed 18 electric vehicle charging stations in its parking garages.
In 2011, the University received an estimated 7 percent of its purchased electricity from renewable sources as part of Maryland’s Renewable Portfolio Standard.
The university’s single stream recycling program currently diverts 18 percent of the trash to recycling.
In fall 2011 the university expanded its composting program to all major dining halls on campus. The program reduced campus carbon emissions by 1,682 metric tonnes of carbon dioxide equivalents.
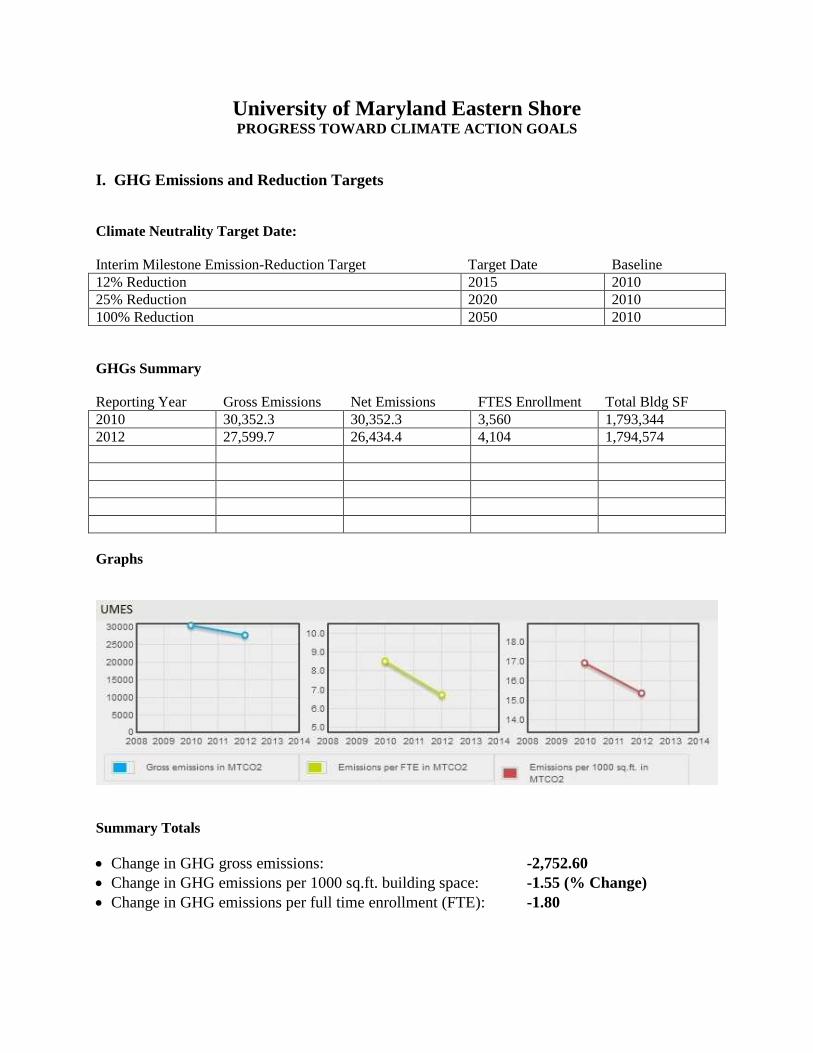
University of Maryland Eastern Shore PROGRESS TOWARD CLIMATE ACTION GOALS
I. GHG Emissions and Reduction Targets
Climate Neutrality Target Date:
Interim Milestone Emission-Reduction Target Target Date Baseline
12% Reduction 2015 2010
25% Reduction 2020 2010
100% Reduction 2050 2010
GHGs Summary
Reporting Year Gross Emissions Net Emissions FTES Enrollment Total Bldg SF
2010 30,352.3 30,352.3 3,560 1,793,344
2012 27,599.7 26,434.4 4,104 1,794,574
Graphs
Summary Totals
Change in GHG gross emissions: -2,752.60
Change in GHG emissions per 1000 sq.ft. building space: -1.55 (% Change)
Change in GHG emissions per full time enrollment (FTE): -1.80

University of Maryland Eastern Shore PROGRESS TOWARD CLIMATE ACTION GOALS
II. Action Plan Summary
1. The UMES Greenhouse Gas (GHG) overall reduction level in 2012 was 12%. This target was realized
three years ahead of the 2015 target of 12%. Future GHG targets are 25% by 2020, and 100% by 2050.
2. UMES with SunEdison installed and commissioned a 2.2 MW Solar Farm in March, 2011 It produces over
3,000 megawatt hours annually and will account for about 10% of UMES’ annual electricity usage. To
date, this facility has produced more than 7,635 megawatt hours of clean electricity.
3. UMES received a LEED Gold Certification on its renovation of a 64 year old Somerset Hall Building
which houses the School of Pharmacy.
4. UMES have several grants in sustainability efforts and research in bio-fuel and bio energy research, carbon
capture and coastal ecosystems. UMES received $245,000 in external funds in January 2011 from the U.S.
Department of Education and established a laboratory used in carbon capture research.
5. UMES established the Center for the Integrated Study of Coastal Ecosystem Processes and Dynamics in
the Mid-Atlantic Region in fall 2010 funded by the National Science Foundation’s CREST (Center for
Research Excellence in Science and Technology) program for $5 million over a five-year period.
6. UMES is developing a workforce development program with area community colleges and utilities
companies aimed at providing education for the workforce in renewable energy industry.
7. UMES has incorporated sustainability courses in many academic programs.
8. UMES is negotiating with a Wind Turbine developer to install 3 MW Wind Turbine on campus as a pilot
program for a larger proposed 150 MW Wind Turbine project in Maryland’s Eastern Shore.
9. UMES has strengthened the role of the Student’s Sustainability Engagement Committee. Students in 2012
conducted a campus wide climate change survey, and conducted UMES Green Campus Awareness
Campaign rally in spring 2012 that included a Green Fashion Show.
10. Wicomico Hall, a residential dormitory renovated in August 2010, utilized geothermal energy system in
heating and cooling of the building and geothermal system will be used in the new Aviation Science &
Engineering building planned to open in July 2015.
11. UMES’ successful energy conservation programs includes efficient building and lighting systems,
replacement of older heating, ventilation, and air condition (HVAC) systems and equipment, replacement
of metal halide light fixtures with LED fixtures, thus reducing energy consumption in facilities and the
institution’s carbon footprint.
12. The use of hybrid/flex fueled vehicles, procurement of energy star products, and the use of environmentally
friendly housekeeping products are part of the UMES campus e-operation.
13. UMES 2011-2016 Strategic Plan: includes: (1) engagement of faculty, staff and students in the
implementation of the Climate Action Plan (CAP); (2) promotion of existing alternative transportation
solutions to stakeholders; (3) development and implementation of waste reduction targets and programs; (4)
creation of a smoke free campus; (5) the conduct of climate-specific research programs on carbon capture
and sequestration, and gas mitigation strategies; and (6) the conduct of research on the indirect impact of
ammonia reductions in poultry houses and use of growth regulators on grass to reduce energy use for
maintenance.

FROSTBURG STATE UNIVERSITY PROGRESS TOWARD CLIMATE ACTION GOALS
I. GHG Emissions and Reduction Targets
Climate Neutrality Target Date:
Interim Milestone Emission-Reduction Target Target Date Baseline
15% reduction in Total Scopes 1, 2, 3 Emissions 2010 2007
20% reduction in Total Scopes 1, 2, 3 Emissions 2014 2007
25% reduction in Total Scopes 1, 2, 3 Emissions 2016 2007
2030 2007
GHGs Summary
Reporting Year Gross Emissions Net Emissions FTES Enrollment Total Bldg SF
2012 24,986 metric tons of CO2e
14,438 metric tons of CO2e
4517.0 1,435,431.0 sq ft
2011 21,479 metric tons of CO2e
10,479 metric tons of CO2e
4606.0 1,435,431.0 sq ft
2010 20,747 metric tons of CO2e
14,809 metric tons of CO2e
4791.0 1,435,431.0 sq ft
2009 No information provided
2007 30,308 metric tons of CO2e
30,088 metric tons of CO2e
4652.0 1,435,431.0 sq ft
Graphs:
0
5000
10000
15000
20000
25000
30000
35000
2007 2010 2011 2012
Gross Emissions per MTCO2
Net Emissions per MTCO2
*

Net emissions change is primarily due to purchase of renewable energy.
Summary Totals
Change in GHG gross emissions: 21,479.00
Change in GHG emissions per 1000 ft² building space: 14.96
Change in GHG emissions per full time enrollment (FTE): 4.66
*
*
*

FROSTBURG STATE UNIVERSITY PROGRESS TOWARD CLIMATE ACTION GOALS
II. Action Plan Summary
GOALS ACTIONS TAKEN PROGRESS Completed Projects
CLIMATE ACTION PLAN Sustainability Leadership
Structure
Office of Sustainability and
Sustainability Coordinator
established
Completed Completed
Shift to Renewable Purchased
Energy
Greater than 15%
renewable energy
purchased/year
Ongoing Ongoing
Offset Plan In Progress Not Completed
TRACKING
Tracking Emissions and
Resource Use
solid waste, recycling and
metered energy is tracked
Ongoing All most all buildings are
individually metered for electricity
use, meters are read monthly
Sub-Metering Analysis System In Progress Not completed
Surveys and Benchmarking In Progress Not Completed
Mitigation through Reduce, Reuse, Recycle Resource and Energy
Conservation Plan
In Progress Ongoing Performing Arts stage relamping with LED’s, Ort Library relamping, All exit signs replaced with LED’s across campus, Installed low-flow
shower heads in all campus residence halls, Sustainable Energy Research Facility (SERF) (Hope for LEED Platinum)
Recycling In Progress Ongoing Participation in RecycleMania
Composting In Progress
Not Completed
Transportation Plan No action to date Not Completed
Mitigation through Land Use and Foods LEED and Renewable Energy
for New Construction
Ongoing Lane University Center renovated to LEED Gold, new buildings to meet LEED guidelines.
Grounds Maintenance and
Forest Preservation
FSU is recognized by the Arbor Day Foundation as a member of “Tree Campus USA”.
Ongoing
FSU is a member of “Tree Campus USA” meeting the five core standards for sustainable campus.
Sustainable Cuisine Continuing discussions Ongoing

Coppin State University PROGRESS TOWARD CLIMATE ACTION GOALS
I. GHG Emissions and Reduction Targets
Climate Neutrality Target Date:
Interim Milestone Emission-Reduction Target Target Date Baseline
15% reduction of purchased electricity emissions 2015 2008
GHGs Summary
Reporting Year Gross Emissions Net Emissions FTES Enrollment Total Bldg SF
2008 21,648 metric ton 21,648 metric ton 2759 961,064
2010 21,148 metric ton 20,830 metric ton 3148 1,207,423
Graphs
Summary Totals
Change in GHG gross emissions: 501MTCO2
Change in GHG emissions per 1000 sq. ft. building space: 5 MTCO2
Change in GHG emissions per full time enrollment (FTE): 1.1 MTCO2

Coppin State University PROGRESS TOWARD CLIMATE ACTION GOALS
II. Action Plan Summary
The Energy Performance Contract was awarded and we are working towards
implementing the ECM.
Water reduction ECM was completed.
Mechanical ECM is in process with the fume hood work at HHSB completed.
Lighting ECM is proceeding as scheduled.
Building envelop ECM was completed.
Several other projects are being analyzed to increase the energy savings at the
Campus.
The Recycling Policy of the Campus was reviewed and signed by the VPAF.
Implementation is in progress and we have been able to double our recycling rate from
6.586% in 2011 to 12.78% in 2012.

Salisbury University PROGRESS TOWARD CLIMATE ACTION GOALS
I. GHG Emissions and Reduction Targets
Climate Neutrality Target Date:
Interim Milestone
Emission-Reduction Target
Target Date Baseline
15% in Total Scopes 1,2,3
2012
2012 2005
25% in Total Scopes 1,2,3 2015 2005
30% in Total Scopes 1,2,3 2020 2005
50% in Total Scopes 1,2,3 2025 2005
100% in Total Scopes 1,2,3 2050 2005
GHGs Summary
Reporting Year Gross Emissions Net Emissions FTES Enrollment Total Bldg SF
2005 26696.0 26678.0 6277.0 1444989.0
2008 26441.0 26413.62 7074.0 1444989.0
2010 25679.0 24841.62 7747.0 1871731.0
2011 27868.0 26672.62 7716.0 1889463.0
2012 27003.0 24650.62 7881.0 2206748.0
Graphs
Summary Totals
Change in GHG gross emissions: 1485.0
Change in GHG emissions per 1000 sq.ft. building space: -5.70450589278
Change in GHG emissions per full time enrollment (FTE): -0.600706121148

II. Action Plan Summary
Since Salisbury University President Janet Dudley-Eshbach signed the American College &
University Presidents’ Climate Commitment in 2007, the campus has grown physically while
keeping its carbon footprint in check. From 2008-2012, SU has received U.S. Green Building
Council LEED Silver or Gold certification for two newly constructed academic buildings, a new
residence-retail complex housed in the largest building on campus, and four renovated traditional
residence halls. Four of these buildings are climate controlled, in total or in part, by geothermal
systems.
In 2010, SU released a plan to reduce its net greenhouse gas emissions to zero by 2050. Many of
the efforts in the plan built on SU’s ongoing sustainability commitment, including its 2006
partnership with Pepco Energy Services, Inc. on campus-wide energy conservation measures
expected to total more than $5.3 million in savings by 2021—a plan lauded by the Maryland
Board of Public Works. Through the partnership, PEPCO replaced many of SU’s lighting,
plumbing and HVAC fixtures with more energy-efficient models. With renovations making
many of SU’s buildings more carbon-friendly since then, the University has widened its scope to
focus on vehicle emissions. Initiatives have included replacing many cars in SU’s motor pool
fleet with hybrid fuel models, adding more bike racks and partnering with the City of Salisbury
to create a bike lane on one of the most popular routes to the University to encourage students to
cycle instead of drive, creating a shared ride program to promote carpooling, and installing what
are believed to be the Eastern Shore’s first public electric vehicle charging stations.
In the classroom, SU established an official Environmental Studies Department in 2012. Since
2010, Salisbury students have won five coveted U.S. Environmental Protection Agency Greater
Research Opportunity fellowships. For several years, those with environmental interests have
been able to study and reside together through SU’s Living Learning Community Green Floor.
The Student Government Association hosts annual celebrations for Earth Week and Campus
Sustainability Day, and recently proposed a mandatory student sustainability fee that would
assist with “green” efforts. Other student organizations such as the Smart Growth Club and Gulls
Going Green promote sustainability to SU and the surrounding community by hosting public
events including environmental speakers and film screenings. Students also have volunteered
their time to help create and maintain organic gardens on and off campus.
SU also has made great strides in waste management. In 2012, the campus signed an agreement
with Blue Hen Organics that allows 100 percent of food waste (including paper products) from
SU’s dining hall to be composted into a soil enhancement product used by area farmers and the
University’s Horticulture Department. The effort helps keep some 300 tons out of local landfills
annually and allowed SU to recycle more than 50 percent of its total waste for the first time since
its recycling program began in 1990.
Other initiatives have included installing water bottle filling stations throughout campus to
encourage students to drink from reusable water bottles instead of buying bottled water and
converting washers and dryers in SU’s traditional residence halls to high-efficiency models.
Many beyond the campus have taken notice. In addition to earning local and state “green”
honors, SU has been named among the most environmentally responsible universities nationwide
by The Princeton Review, which has included Salisbury in its Guide to Green Colleges for four
consecutive years.

University of Baltimore PROGRESS TOWARD CLIMATE ACTION GOALS
I. GHG Emissions and Reduction Targets
100% by 2040
Climate Neutrality Target Date: 2040
Interim Milestone Emission-Reduction Target Target Date Baseline
30% 2015 2008
60% 2025 2008
90% 2035 2008
GHGs Summary
Reporting Year Gross Emissions Net Emissions FTES Enrollment Total Bldg SF
2008 18038 18038 4458 749361
2010 16045.6 16045.6 4960 816129
2012 11139 11139 4855 816129
Graphs
Summary Totals
Change in GHG gross emissions: -6899
Change in GHG emissions per 1000 sq.ft. building space: -10.4225976935
Change in GHG emissions per full time enrollment (FTE): -1.75187332601
University of Baltimore PROGRESS TOWARD CLIMATE ACTION GOALS
II. Action Plan Summary
Accomplishments include:
Exceeding 2015 GHG goal by 2012. UB initiatives yielded a GHG reduction of over 35% from 2008 baseline. GHG reduction achieved by the combination of a reduced commuting footprint and the implementation of energy saving upgrades financed through performance contracting. Such energy upgrades include: -building envelope upgrades -installation of low flow aerators -installation of skylights -installation of green roof -retrofitting/replacement of inefficient chillers/boilers and other mechanical equipment -energy efficient computer sleep modes -new energy efficient lighting
Creating a Sustainability & Human Ecology major in the Fall of 2010 that now has 42 affiliated with major
Incorporating sustainability in staff orientations
Heavy marketing of alternative transportation leading to quadrupling of annual student transit passes purchases since 2007
Large increase in the number of student living close to campus
Introduction of pre-tax faculty and staff transit passes
Eliminating almost five acres of surface parking
Since 2008, UB and partners developed 95 percent of campus surface parking into LEED silver or higher buildings
The creation of a designated LEED silver student residential facility, which will functionally eliminated school commuting GHG's for these students
LEED Platinum law facility completed in 2013, pending certification
Not listed in the 2009 Climate Action, but significant related accomplishments include:
Planting 60 new mature trees on campus
Planting over 300 plus native trees off-campus
Utilizing social media to promote sustainable initiatives and educational opportunities on and off campus

University of Maryland University College PROGRESS TOWARD CLIMATE ACTION GOALS
I. GHG Emissions and Reduction Targets
1
The University of Maryland University College has made significant progress towards climate neutrality and
sustainability since signing the American Colleges and Universities President’s Climate Commitment in 2007. The
University has continued to serve a growing student body, employ more faculty and staff, and expand its building
space without significant increases in overall greenhouse gas emissions. This accomplishment can be attributed to
the strategies adopted and implemented as a part of UMUC’s 2009 Climate Action Plan. Specifically, UMUC has
adopted an environmentally preferable procurement policy, expanded its recycling and composting program, and
created the position of sustainability coordinator.
UMUC has realized electricity cost savings and GHG stability despite adding new facilities as a result of ambitious
energy efficiency investments. The University has implemented multiple energy efficiency measures in the past
three years including installation of occupancy censors, demand control ventilation and an energy recovery unit.
Also, low efficiency T8 light bulbs were replaced by more efficient, high-output T5 light bulbs throughout several
buildings, and the University adopted Smart power strips in most of its facilities. On the transportation front, the
University has purchased alternate fuel vehicles, made video conferencing available as an alternative to air travel,
and continues to communicate alternative transportation options with faculty and staff. UMUC’s transportation
management plan for the new Academic Center at Largo features subsidies for faculty, staff and students who
commute by bicycle and reserves premium parking locations for low emissions and hybrid vehicles. UMUC
continues to make climate change outreach and education a priority. The University is a member of the Maryland
Green Business Registry as well as the Maryland Department of the Environment’s College Climate Action
Workgroup. These initiatives serve as important forums for recognizing and improving our climate neutrality
efforts. Also of note, UMUC participated in the 2011 MADE-CLEAR event. Funded by the National Science
Foundation, this event brought together climate science experts, sustainability managers, government officials, and
k-12 teachers to discuss climate change education. Finally, the University's growing undergraduate and graduate
Environmental Management programs and certificates incorporate sustainability tenets and practices.
Climate Neutrality Target Date: 2050
Interim Milestone Emission-Reduction Target Target Date Baseline
10 percent 2012 2008
15 percent 2015 2008
25 percent 2020 2008
GHGs Summary
Reporting Year Gross Emissions Net Emissions FTES Enrollment Total Bldg SF
2007 (FY) 22070.6 22070.6 16588 764839
2008 (FY) 22155.6 22155.6 17055 764839
2009 (CY) 22620.6 22572 18368 995198
2010 (CY) 23960.1 23650.3 20602 995198
2011 (CY) 23796.4 23354.1 22089 995198
1 All progress report data and responses are from 2012 Progress Report (Submitted January 15, 2012).
Available online at: http://rs.acupcc.org/progress/330/.

Graphs
Summary Totals
Change in GHG gross emissions: 167.180
Change in GHG emissions per 1000 sq.ft. building space: -6.734
Change in GHG emissions per full time enrollment (FTE): -.124
II. Action Plan Summary2
The UMUC Climate Action Plan (CAP) primarily focuses on strategies that will mitigate GHG emissions from
electricity and transportation, which accounted for 95 percent of the University’s emissions in FY 2008. The CAP
puts forward 13 strategies to mitigate GHG emissions including 7 specific strategies targeted at electricity
procurement (e.g., purchase electricity from sources, efficiency improvements) and 6 strategies targeted at
transportation (e.g., expanding ride sharing and flexible scheduling for employees) (See Figure 1 below). Follow
through of mitigation strategies will be facilitated by specific deadlines, goals and designation of responsibilities.
Figure 1. UMUC mitigation strategies with expected GHG reductions and milestones
Concerning education and outreach, UMUC will employ both formal (e.g., classroom) and informal educational
strategies for its students and employees. The University will expand upon the Environmental Management Program
by offering more courses, expanding enrollment and additional integration of climate-relevant topics. All students
and employees will receive educational material during the orientation process regarding the University's
commitment to sustainability and neutrality. Furthermore, a Sustainability Coordinator will be hired at UMUC to
expand educational opportunities including sustainability-focused emails, seminars, and workshops.
2 All climate action plan data and responses are from 2010 Climate Action Plan (Submitted January 15,
2010). Available online at: http://rs.acupcc.org/cap/462/.

UMBC PROGRESS TOWARD CLIMATE ACTION GOALS
I. GHG Emissions and Reduction Targets
Climate Neutrality Target Date:
Interim Milestone Emission-Reduction Target Target Date Baseline 10% Reduction In Total Scopes 1, 2, 3 Emissions By 2012 Relative To Baseline Emissions In 2007
15% Reduction In Total Scopes 1, 2, 3 Emissions By 2015 Relative To Baseline Emissions In 2007
25% Reduction In Total Scopes 1, 2, 3 Emissions By 2020 Relative To Baseline Emissions In 2007
40% Reduction In Total Scopes 1, 2, 3 Emissions By 2030 Relative To Baseline Emissions In 2007
60% Reduction In Total Scopes 1, 2, 3 Emissions By 2040 Relative To Baseline Emissions In 2007
80% Reduction In Total Scopes 1, 2, 3 Emissions By 2050 Relative To Baseline Emissions In 2007
100% Reduction In Total Scopes 1, 2, 3 Emissions By 2075 Relative To Baseline Emissions In 2007
GHGs Summary
Reporting Year Gross Emissions Net Emissions FTES Enrollment Total Bldg SF 2007 89761.0 88710.0 10295.0 3259224.0
2008 90952.0 88878.0 10509.0 3259224.0
2009 88902.0 82346.0 10824.0 3198968.0
2010 87061.0 78867.0 11263.0 3198968.0
2011 87614.0 78709.0 11429.0 3198968.0
2012 85534.0 76919.0 11693.0 3299351.0
Graphs
Summary Totals
Change in GHG gross emissions: -2147.0
Change in GHG emissions per 1000 sq.ft. building space: -0.152397060469
Change in GHG emissions per full time enrollment (FTE): -1.052955139

UMBC PROGRESS TOWARD CLIMATE ACTION GOALS
II. Action Plan Summary
Comparing FY 2012 to the FY 2007 baseline, UMBC's net CO2 emissions have been reduced by 13.3%.
Leadership has been provided by the Climate Change Task Force, comprised of faculty, staff, and students, and
its four work groups- Energy and Waste Management, Transportation, Outreach, and Education and Research. A
Climate Action Plan was put in place in September 2009, establishing targets to achieve Climate Neutrality by
2075.
Successful initiatives UMBC has undertaken to achieve climate goals include:
Energy and Waste Management successes include:
Implementation of energy-saving space temperature set points and night setbacks.
Improved occupied/unoccupied scheduling and space utilization.
Chilled Water optimization project underway to reduce carbon footprint another 3.5%.
Composting on campus initiated in True Grits dining hall, and moving to retail areas.
Central Plant high-efficiency boiler upgrades including stack economizer.
Energy Star vending machines.
Reduced waste in Dining Hall via tray-less service and napkin dispensers on each table.
Transportation successes include:
New, more efficient shuttles, biodiesel buses.
2 Zipcars on campus, a car sharing alternative to having personal vehicles campus.
More bike racks installed on campus and on buses/shuttles.
Improved Carpooling program with designated carpool parking spaces.
2 Electric Vehicle charging stations.
Outreach successes include:
Creation of sustainability website.
Sustainability internship program.
"Spotlights" highlighting sustainability initiatives, seminars, and events.
Five year report on campus efforts to address climate change issued in 2012
Education & Research successes include:
First Year Seminar courses on climate change and sustainability initiated.
Undergraduate program in Environmental Engineering initiated.
Sustainability topics are included as part of new student orientation.
Curriculum and research pertaining to sustainability is better documented and included on website.
Faculty curriculum workshop to integrate sustainability across the disciplines this summer.
2013 New Student Book Experience selection is focused on climate change.
Campus awareness rose with weeklong Earth Day events, including documentaries, tree plantings, bike
clinic, speakers and more.
Planning is underway to advance further progress through the following projects:
Introducing a green office program to reduce energy use through changes in practices and policies
adopted by campus offices.
Upgrading outdoor lighting efficiency.
Improving biking policies and infrastructure, introducing a bike share pilot program.
Standardizing new containers and signage for waste, dual stream recycling, and composting.

UNIVERSITY OF MARYLAND
CENTER FOR ENVIRONMENTAL SCIENCE PROGRESS TOWARD CLIMATE ACTION GOALS
I. GHG Emissions and Reduction Targets
Climate Neutrality Target Date:
Interim Milestone Emission-Reduction Target Target Date Baseline
10% 2012 2008
15% 2015 2008
23% 2020 2008
90% 2050 2008
GHGs Summary
Reporting Year Gross Emissions Net Emissions FTES Enrollment Total Bldg SF
2008 13,399 12,480 63 375,979
2010 13,692 12,773 74 374,339
2012 12,212 11,291 55 403,637
Graphs
Summary Totals
Change in GHG gross emissions: -1187
Change in GHG emissions per 1000 sq. building space: -5.3
Change in GHG emissions per full time enrollment (FTE): 9.3

UNIVERSITY OF MARYLAND
CENTER FOR ENVIRONMENTAL SCIENCE PROGRESS TOWARD CLIMATE ACTION GOALS
II. Action Plan Summary
Our Climate Action Plan outlines the steps we will be taking to reduce our environmental impact.
We have taken greenhouse gas inventories and set goals for reducing emissions at each of our laboratories.
We have upgraded aging infrastructure to newer, more energy-efficient alternatives by working with
Constellation Energy. Recently signed agreements will save both energy and reduce costs over the next 15
years. All new campus construction will be built to at least the U.S. Green Building Council's LEED Silver
standard or equivalent. We will purchase or produce at least 15% of our institution's electricity consumption
from renewable sources. We are a member of the Maryland Green Registry.
In addition to leading the Center’s efforts, President Donald Boesch also leads the University System of
Maryland’s 12-campus environmental sustainability effort as the system’s Vice Chancellor for Environmental
Sustainability.
Our commitment to climate change is echoed in the development of an UMCES-wide Environmental
Sustainability Council (ESC) that consists of students, faculty and staff from the Center's three laboratories,
Center Administration, UMCES @IMET and Maryland Sea Grant College Program. The ESC functions as a
task group and advisory body to the President and Administrative Council and serves as the "institutional
structure" to guide the development and implementation of a comprehensive climate action plan in fulfillment
of the ACUPCC.
GOALS
Implement and enforce policies to “power down” during non-working hours
Upgrade existing IVN video conferencing systems at all locations
Install on-campus renewable energy sources
Convert on-site fossil fuel use to biofuels
Selectively redesign or replace HVAC systems and further insulate facilities
Capture and re-use gray water and rainwater
Utilize Renewable Energy Certificates and/or Carbon Offsets
PROGRESS
Projects which have been completed within the past year or are in progress:
Replace chiller at Bernie Fowler Lab – CBL
Waterproof and insulate porch at DuPont Bldg. – CA
Replace windows Beaven Hall and Swift House with 70 low-e windows, vinyl insulated frames - CBL
Replace air handling unit (AHU) in Morris Marine Lab with a programmable unit to allow for shut
down at night and more closely regulate heat. This will reduce both electric and propane usage. – HPL
Replace six split-system heat pumps at various locations at CBL
Replace and relocate air handling unit at Appalachian Lab from an interior to exterior unit. New unit is
more energy efficient and will free up mechanical room space. – AL
Replace air handling unit heating and cooling coils at Bernie Fowler Lab – CBL
Laboratory Exhaust System Upgrades - Installation of the variable frequency drives (VFDs) on the
exhaust fans as a recommend ECM during Constellations Energy’s site audit – AL (MEA SALP)
New computer and software purchases that support web-based video conferencing so that meetings can
be held for small groups over the web in lieu of traveling – all UMCES units
Recycling and waste minimization programs in place - all UMCES units
Increased purchasing of recycled office and maintenance products. – all UMCES units
When necessary, replacing office computers with laptops instead of traditional desktop computers. In
addition to providing portability, these machines can use as little as 25% of the electricity of a standard
desktop computer and monitor – all UMCES units
When necessary, replacing non-energy efficient equipment with newer Energy Star models – all UMCES units

The Universities at Shady Grove PROGRESS TOWARD CLIMATE ACTION GOALS
I. GHG Emissions and Reduction Targets [from ACUPCC Progress Report tab of the same name]
Climate Neutrality Target Date:
Interim Milestone Emission-Reduction Target Target Date Baseline
Reduce emissions by 25% 2020 2009
Reduce emissions by 50% 2035 2009
Carbon Neutrality 2050 2009
GHGs Summary
Reporting Year Gross Emissions Net Emissions FTES Enrollment Total Bldg SF
2009 9370.6 3656 501,800
2010 10,261.1 3870 501,800
2011 10,492.2 4042 501,800
Graphs
FY 2009 FY 2010 FY 2011
Gross Emissions 9,396.1 10,317.9 10,616.3
Offsets -25.5 -56.8 -124.1
Net Emissions 9370.6 10,261.1 10,492.2
Summary Totals (above)
Change in GHG gross emissions: Increase of 1,122 metric tons
Change in GHG emissions per 1000 sq.ft. space: Reduction of 9.5 mtCo2e/1,000 GSF
Change in GHG emissions per full time enrollment (FTE): Reduction of 0.4 mtCo2e/FTE

PROGRESS TOWARD CLIMATE ACTION GOALS
II. Action Plan Summary
Transportation:
A transportation survey developed as part of Greenhouse Gas Inventory. Another survey was
conducted for the Shuttle service to and from College Park.
Developed a “Transportation Task Force” that is looking at all aspects of transportation on
campus and ways to reduce our GGI.
We are working with County officials to look at the campus comprehensively and see how public
transportation to and from the campus can be increased or decreased.
We were recently chosen by the County to have a bike share station here at USG.
Buildings:
We had a feasibility study done on the two older buildings to consider the LEED® EB rating
system.
Working with administration to determine if we are going to apply for this rating system.
Emissions:
We submitted a revised GGI for the years 2009-2011
We converting an entire building (Building I) to LED lighting.
We were able to change 662 fixtures, yielding an annual energy savings of $20,825.47 and kWh
Savings of 160,196. Using EPA Regional Emission Factors, the following Power Plant Emissions
will be avoided:
Carbon Dioxide, 128.16 tons
Sulfur Dioxide, 656.80 tons
Nitrogen Oxides 208.25 tons
Procurement Practices:
We are in the process of reviewing all of our procurement procedures.
Waste Reduction/Recycling:
USG continues its efforts toward waste reduction and recycling,
Recognized by Montgomery County Government for our recycling efforts.
Energy:
As noted under ‘buildings’ we are in the process of looking into LEED/EB for our two older buildings.
Outreach:
Hosted a “Community Day” for over 4,000 people, with a green theme and partnered with many local
green businesses, non-profits, and educational partners .