Embed Size (px)
Citation preview

Summary
We analyzed Montgomery County Public School’s 3rd through 8th grade1 PARCC2 scores in ELA and Math over the three most recent school years and across eight comparison schools districts.3 This report first identifies five areas of concern, which are grades4 and subjects where students’ tests scores are lower than other students’ scores within Montgomery County. Each area of concern is described in detail, noting if certain subgroups are more heavily impacted or the persistence of the problem, for example. Finally, comparison districts are used to identify which school districts have been more successful in the specific grade level or student subgroup than Montgomery County, and therefore provide a possible resource in addressing these areas of concern.
The areas of concern and recommendations are as follows:
1. Area of Concern: 3rd grade ELA. Montgomery County’s ELA proficiency levels are 6 percentage points lower in 3rd grade than in either 4th or 5th grades.
o Recommendation: Analyze the 3rd and 4th grade ELA curricula in order to better understand why students who perform strongly in 4th grade are not performing as strongly in 3rd grade. This analysis should keep in mind that some groups of students appear to be impacted more strongly by the short-comings of the 3rd grade curriculum. Anne Arundel County’s 3rd grade ELA curriculum might serve as a
1 This includes data from both the 8th grade Math and the Algebra I test scores. 2 Partnership for Assessment of Readiness for College and Careers 3 Comparison districts were identified because they are one of the 100 largest school districts in the United States, also administer PARCC exams, and have similar demographic characteristics as Montgomery County for at least one subgroup of students. Appendix B provides a more detailed explanation of how the comparison districts were selected. 4 or student subgroups

useful resource5—Anne Arundel County typically has lower proficiency levels than Montgomery County, but has particularly strong 3rd grade ELA PARCC scores.
2. Area of Concern: 6th grade ELA. The ELA proficiency level is lower in 6th grade than in the two years before or after.
o Recommendation: Analyze the 5th and 6th grade ELA curricula in order to better understand why certain subgroups of students are not performing as strongly in 6th grade as they did in 5th grade. Curricula in other school districts might provide good examples. For example, Jefferson County has a similar percentage of Hispanic students and students with limited English proficiency and also performs significantly better among both of these student subgroups than Montgomery County in 6th grade ELA. In addition, Cherry Creek County has a similar percentage of students who qualify for free-or-reduced-priced meals and has significantly higher proficiency levels among this group of students.6
3. Area of Concern: ELA Scores of students with limited English proficiency (LEP). The percent of LEP
students that achieve proficiency in ELA is lower than any other subgroup in Montgomery County. o Recommendation: Cherry Creek County and Jefferson County perform significantly better in both 3rd
and 4th grade ELA among LEP students. In 5th through 8th grades, the percentage of LEP students that achieve proficiency in Cherry Creek County and Jefferson County is higher than Montgomery County, although not significantly so. Both of these school districts perform similarly to Montgomery County in comparisons with all students.7 Further, both districts are relatively large and have similar percentages of LEP students. Therefore, the ELA curricula in Cherry Creek and Jefferson Counties might be a useful resource, especially in 3rd and 4th grades, for understanding how to better meet the learning needs of LEP students.
5 Anne Arundel’s success in 3rd grade might also be due to their early childhood ELA curriculum and this might also serve as a useful resource. 6 See Appendix B for more information about the demographic comparisons between these school district. 7 See pages 2-14 in the appendix for these comparisons.

4. Area of Concern: 7th Grade Math. There is a large decrease in the percentage of Montgomery County students
who meet proficiency in 7th grade math, compared to 6th grade. o Recommendation: These data suggest a further look at the 7th grade curriculum in order to better
understand why students who are able to reach proficiency in 6th grade, fail to do so in 7th grade. A comparison with other school districts shows that Cherry Creek has similar proficiency levels in 6th grade math as Montgomery County, and higher proficiency levels in 7th grade. Further investigation into Cherry Creek’s 7th grade math curriculum might be beneficial.
5. Area of Concern: 8th Grade Math/Algebra. Montgomery County’s 8th grade mathematics proficiency level
dramatically declined between the 2015/2016 and 2016/2017 school years, but there was no increase in the 2016/2017 algebra proficiency level.
o Recommendation: Review the criteria for selecting students into algebra, so that the students who take algebra in 8th grade will successfully reach proficiency. Perhaps the 8th grade math curriculum can be adjusted in order to address the learning needs of the students who remain in 8th grade math (e.g. serve as a remediation course).

Area of Concern: 3rd Grade ELA
The problem: Montgomery County’s ELA proficiency levels are 6 percentage points lower in 3rd grade than in either 4th or 5th grades.
Analysis:
1. The graphs below show that the difference in the test score distributions between 3rd and 4th grades was concentrated among level 1 and level 5 scores—there is a greater percentage of level 1 scores and a smaller percentage of level 5 scores in 3rd grade, compared with 4th grade, across all three school years analyzed. This suggests a general shift among 3rd graders towards stronger scores in 4th grade.
2. However, some groups of students were more likely to have higher scores in 4th grade than in 3rd grade:
a. The graphs show that Hispanic students, African American students, and students who qualify for free-or-reduced meals were more likely to earn a 4 in 4th grade, than in 3rd grade.
b. Further, white students, African American students, and students who qualify for free-or-reduced priced meals were more likely to earn a 5 in 4th grade, than in 3rd grade.
Recommendation: Analyze the 3rd and 4th grade ELA curricula in order to better understand why students who perform strongly in 4th grade are not performing as strongly in 3rd grade. This analysis should keep in mind that some groups of students appear to be impacted more strongly by the short-comings of the 3rd grade curriculum. Anne Arundel County’s 3rd grade ELA curriculum might serve as a useful resource8—Anne Arundel County typically has lower proficiency levels than Montgomery County, but has particularly strong 3rd grade ELA PARCC scores.
8 Anne Arundel’s success in 3rd grade might also be due to their early childhood ELA curriculum and this might also serve as a useful resource.

Detailed Analysis:
Synopsis: Within Montgomery County, proficiency levels in 3rd grade are 6 percentage points lower than in 4th or 5th grades. Comparing Montgomery County to other school districts shows that while several other districts experience similar proficiency patterns, some school districts do not.
Graph 1 shows the percentage of students who have met ELA proficiency requirements on the PARCC in 3rd through 8th grades9 in Montgomery County (in the upper left-hand corner) and five comparison school districts:10 Cherry Creek County, Anne Arundel County, Howard County, Jefferson County, and Prince George’s County. Proficiency levels for each grade and school district are averaged across the three most recent school years for which test scores are available (2014/2015, 2015/2016, 2016/2017).
Elaboration: Comparing Montgomery County’s ELA proficiency levels shows that 44% of 3rd graders, on average, meet ELA proficiency requirements in Montgomery County, while 50% of 4th and 5th graders meet their grade level’s ELA proficiency requirements, on average.
Note that some other school districts show a similar pattern of lower 3rd grade proficiency levels than those of 4th and 5th grades. For example, Howard County proficiency levels increase 5 percentage points from 3rd to 4th grade and both Cherry Creek County and Jefferson County school districts’ proficiency levels increase 6 percentage points from 3rd to 4th grade.
However, data from other counties shows that lower proficiency levels in 3rd grade are not inevitable. For example, third grade students in Anne Arundel County have higher proficiency levels than in 4th and 5th grades, and proficiency levels are relatively flat in 3rd through 5th grades in Prince George’s County.
9 The unit of measurement on the y-axis is the percentage of students who reach ELA proficiency for each grade level and the unit of measurement on the y-axis are grade levels, 3rd through 8th. 10 See the Appendix B for an explanation of how the comparison school districts were determined.

Graph 1: ELA Proficiencies Across 3rd-8th Grades, All Students, Averaged Across 2015-2017
0.440.50 0.50
0.450.49 0.49
0.20
0.30
0.40
0.50
0.60
3 4 5 6 7 8
Montgomery County
0.44
0.50 0.49 0.51 0.50 0.48
0.20
0.30
0.40
0.50
0.60
3 4 5 6 7 8
Cherry Creek County0.55
0.460.49
0.410.45 0.45
0.20
0.30
0.40
0.50
0.60
3 4 5 6 7 8
Anne Arundel County
0.520.57 0.55
0.510.54 0.54
0.20
0.30
0.40
0.50
0.60
3 4 5 6 7 8
Howard County
0.44
0.50 0.49 0.51 0.50 0.48
0.20
0.30
0.40
0.50
0.60
3 4 5 6 7 8
Jefferson County
0.23 0.24 0.24 0.270.30 0.29
0.20
0.30
0.40
0.50
0.60
3 4 5 6 7 8
Prince George's County

Synopsis: Changes in proficiency levels over time provide additional information about the duration and depth of the proficiency decrease in 3rd grade. The graph below shows that lower proficiency levels in 3rd grade has been a problem for the past three school years (at least).
Graph 2 shows the percentage of students who earned each PARCC score in 3rd and 4th grade ELA in Montgomery County across three years: the 2014/2015 (blue columns), 2015/2016 (gray columns), and 2016/2017 (green columns) school years.
Elaboration: Notice that both 3rd and 4th grades show some improvement in scores over the past three school years. For example, there is an increase in the percentage of students who earn a score of 4 or 5 and a decrease in the percentage of students earning 1 (in 3rd grade), 2, and 3 over the three years. Despite these positive trends, however, the scores are relatively stable across all three years11 and the proficiency gap is not closing. This graph shows that the problem in 3rd grade is not a recent phenomenon.
Graph 2: Distribution Comparison of Montgomery County ELA, All Students
11 For example, no scores change even 5 percentage points over the three years.
0.000.050.100.150.200.250.300.350.40
1 2 3 4 5
3rd Grade
2015 2016 2017
0.000.050.100.150.200.250.300.350.40
1 2 3 4 5
4th Grade
2015 2016 2017

Synopsis: The next graph shows that the difference in the distributions between 3rd and 4th grade PARCC scores are mainly in the tails, that is, among the weakest and strongest scores. The increase in the percentage of students who earned the strongest scores helps explain the increase in proficiency levels between 3rd and 4th grades.
Graph 3 shows the average percentage of students who earned a level 1,2,3,4, and 5 on the ELA PARCC exam in 3rd and 4th grades in Montgomery County. Percentages are averaged over the 2014/2015 to 2016/2017 school years.
Elaboration: The largest difference between the score distributions in 3rd and 4th grades are the level 1 and 5 scores. Specifically, there is an 8 percentage point decrease in the percentage of students earning a level 1 and a 7 percentage point increase in the percentage of students who earn a 5 between 3rd and 4th grades. The percentage of students who earned a 2, 3, or 4 in either grade level is relatively stable. While the decrease in level 1 scores is important, it is unlikely that many students who scored a level 1 in 3rd grade reached proficiency by 4th grade. Therefore, the increase in proficiency levels can be seen in this graph through the increase in level 5 scores.
Graph 3: Distribution Montgomery County ELA Scores, All Students, Averaged Across 2015-2017
0.18 0.170.21
0.38
0.06
0.00
0.05
0.10
0.15
0.20
0.25
0.30
0.35
0.40
1 2 3 4 5
3rd Grade
0.10
0.16
0.24
0.37
0.13
0.00
0.05
0.10
0.15
0.20
0.25
0.30
0.35
0.40
1 2 3 4 5
4th Grade

Synopsis: In order to better understand which students were most effected by the increase in proficiency levels between 3rd and 4th grade, the next graphs decompose students’ level 4 and 5 scores in 3rd and 4th grades by student subgroup. These graphs show that the increase in proficiency levels from 3rd to 4th grade were primarily among white students, African American students, Hispanic students, and students who qualify for free-or-reduced lunch. No gains or losses were made among special education students. Students with limited English proficiency and students of “other” 12 race were less likely to earn a 4 or 5 in 4th grade compared with 3rd grade.
Graphs 4 and 5 show the percentage of students who earned a level 4 (graph 4) and 5 (graph 5) in 3rd grade (the left bar in each panel), compared with 4th grade, by student subgroup. The leftmost panel shows scores decomposed by racial composition; the next panel shows these scores decomposed by English language proficiency status; the following panel shows this information by free-and-reduced-priced meal qualification; and the right-most panel shows the decomposition of scores by special education status. All percentages are averaged over the three most recent school years, 2014/2015 to 2016/2017.
Elaboration: Graph 4 shows that the students who earned a 4 in 4th grade are more likely to be Hispanic, African American, or qualify for free-or-reduced lunches, compared to the students who scored a 4 in 3rd grade. Students who earned a 4 in 4th grade were less likely to be white, “other” race, or have limited English proficiency.13
Graph 5 shows that the students who earned a 5 in 4th grade are more likely to be white, African American, or qualify for free-or-reduced priced lunches, compared to the group of students who earned a 5 in 3rd grade. Students who earned a 5 in 4th grade were less likely to be designated as “other” race.
12 Other race is defined as non-white/Hispanic/African American students 13 Note that less than 5% of students with limited English proficiency (LEP) earned a 4 or 5 in 4th grade. Therefore the exact percentage of students in each of these two score levels is unclear in publically available data. The percentages presented in graph 4 might be an over estimate of the percentage of LEP students who earned a 4 in 4th grade compared with 3rd grade. The percentages presented in graph 5 might be an under estimate of the percentage of LEP students who earned a 5 in 4 th grade compared with 3rd grade (if no students earned a 4 in 4th grade then 3% of students who scored a 5 would be designated as LEP).

Graph 4: Montgomery County 3rd and 4th Grade Level 4 ELA Score Comparison, Student Subgroups, Averaged Across 2015-2017
Graph 5: Montgomery County 3rd and 4th Grade Level 5 ELA Score Comparison, Student Subgroups, Averaged Across 2015-2017
41% 40%
16% 17%
17% 19%
27% 24%
0%
10%
20%
30%
40%
50%
60%
70%
80%
90%
100%
3rd Grade 4th Grade
White African AmericanHispanic Other Race
4% 1%
96% 99%
0%
10%
20%
30%
40%
50%
60%
70%
80%
90%
100%
3rd Grade 4th Grade
LEP non-LEP
19% 23%
81% 77%
0%
10%
20%
30%
40%
50%
60%
70%
80%
90%
100%
3rd Grade 4th Grade
FARM non-FARM
3% 3%
97% 97%
0%
10%
20%
30%
40%
50%
60%
70%
80%
90%
100%
3rd Grade 4th Grade
SPED non-SPED
46% 49%
7% 8%7%
7%
40% 36%
0%
10%
20%
30%
40%
50%
60%
70%
80%
90%
100%
3rd Grade 4th GradeWhite African American
Hispanic Other Race
0% 0%
100% 100%
0%
10%
20%
30%
40%
50%
60%
70%
80%
90%
100%
3rd Grade 4th Grade
LEP non-LEP
5% 7%
95% 93%
0%
10%
20%
30%
40%
50%
60%
70%
80%
90%
100%
3rd Grade 4th Grade
FARM non-FARM
2% 2%
98% 98%
0%
10%
20%
30%
40%
50%
60%
70%
80%
90%
100%
3rd Grade 4th Grade
SPED non-SPED

Recommendation Synopsis: Graph 6 provides evidence that some comparison school districts have been more successful at helping their 3rd grade students meet ELA proficiency requirements. Specifically, students in Cherry Creek County, Anne Arundel County, and Howard County school districts all perform significantly better in ELA than 3rd grade students in Montgomery County in the three most recent school years. Anne Arundel County’s curriculum might be an especially useful resource.
Graph 6 shows students’ ELA proficiency levels in 3rd grade both over time and across different school districts.14 Montgomery County is shown in the left most position; seven other school districts— Prince George’s County; Baltimore County; Anne Arundel County; Howard County; Washington D.C.; Jefferson County; and Cherry Creek County—serve as comparison districts, as they are all relatively large school districts and have some similar student demographic characteristics.15
Elaboration: Graphs 6 provides evidence that Montgomery County has significantly lower proficiency rates for 3rd grade students than Cherry Creek, Anne Arundel, and Howard Counties. Note that the tables in Appendix A show that Montgomery County’s proficiency levels are typically lower than Howard County; similar to Cherry Creek County; and significantly better than Anne Arundel County’s proficiency levels. This suggests that while the 3rd grade ELA curricula in all three school districts might serve as useful references, Anne Arundel’s 3rd grade ELA curricula might be particularly interesting.
14 The horizontal axis of each graph provides both information about the school district and the year of PARCC scores. Each school district is represented by a single color on the graph—where the leftmost bar represents the district’s PARCC scores in the 2014-2015 school year (labeled 2015 at the bottom of the graph); the middle most bar represents the school district’s PARCC scores from the 2015-2016 school year (labeled 2016 at the bottom of the graph); and the right most bar for the school district represents the PARCC scores from the 2016-2017 school year (labeled 2017 at the bottom of the graph). Note that only data from the 2014/2015 school year disaggregated by student subgroup is available for the Colorado school districts. The vertical axis measures the percentage of students that earned a score of either 4 or 5 on the PARCC exam.
15 See the appendix for an explanation of how comparison school districts were determined.

Graph 6: Proficiency Levels 3rd Grade ELA, All Students
0.41
0.45
0.47
0.210.23
0.25
0.42
0.360.38
0.560.54
0.56
0.490.51
0.56
0.250.26
0.28
0.440.42
0.45
0.48 0.490.50
0.00
0.10
0.20
0.30
0.40
0.50
0.60
2015 2016 2017 2015 2016 2017 2015 2016 2017 2015 2016 2017 2015 2016 2017 2015 2016 2017 2015 2016 2017 2015 2016 2017
Area of Concern: 6th Grade ELA
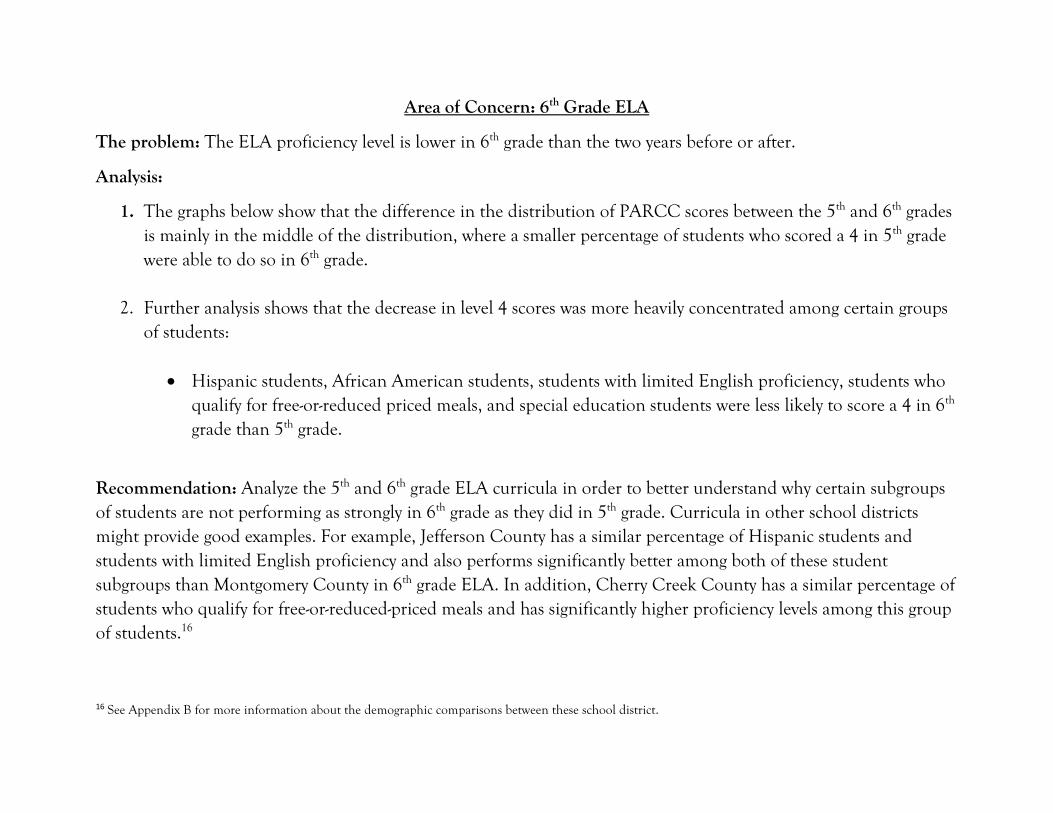
The problem: The ELA proficiency level is lower in 6th grade than the two years before or after.
Analysis:
1. The graphs below show that the difference in the distribution of PARCC scores between the 5th and 6th grades is mainly in the middle of the distribution, where a smaller percentage of students who scored a 4 in 5th grade were able to do so in 6th grade.
2. Further analysis shows that the decrease in level 4 scores was more heavily concentrated among certain groups of students:
• Hispanic students, African American students, students with limited English proficiency, students who qualify for free-or-reduced priced meals, and special education students were less likely to score a 4 in 6th grade than 5th grade.
Recommendation: Analyze the 5th and 6th grade ELA curricula in order to better understand why certain subgroups of students are not performing as strongly in 6th grade as they did in 5th grade. Curricula in other school districts might provide good examples. For example, Jefferson County has a similar percentage of Hispanic students and students with limited English proficiency and also performs significantly better among both of these student subgroups than Montgomery County in 6th grade ELA. In addition, Cherry Creek County has a similar percentage of students who qualify for free-or-reduced-priced meals and has significantly higher proficiency levels among this group of students.16
16 See Appendix B for more information about the demographic comparisons between these school district.

Detailed Analysis:
Synopsis: The percentage of students who meet 6th grade proficiency requirements in Montgomery County is 5 percentage points lower than 4th and 5th grades and 4 percentage points lower than 7th and 8th grade ELA proficiency.
Recall that graph 1 shows the percentage of students who have met ELA proficiency requirements on the PARCC exam in 3rd through 8th grades17 in Montgomery County, in the upper left-hand corner, and five comparison school districts. Proficiency levels for each grade and school district are averaged across the three most recent school years for which test scores are available (2014/2015, 2015/2016, 2016/2017).
Elaboration: Comparing ELA proficiency levels within Montgomery County shows a decrease in 6th grade, compared with the proceeding and subsequent two grade levels.
Other school districts also experience decreases in proficiency levels in 6th grade ELA. For example, Howard and Anne Arundel Counties experience similar decreases in 6th grade proficiency—Howard County’s average proficiency level drops 4 percentage points from 5th to 6th grade and then rises 3 percentage points in 7th grade and Anne Arundel’s average proficiency level drop 8 percentage points from 5th to 6th grade and increase 4 percentage points in 7th grade.
However, Cherry Creek and Jefferson Counties, which have similar proficiency rates as Montgomery County in comparisons across other grade levels do not experience a drop in proficiency in 6th grade (and indeed have slightly higher proficiency levels in 6th grade that in either 5th or 7th grades). Thus, proficiency levels in Cherry Creek and Jefferson Counties suggest that there is not an inevitable drop in 6th grade.
17 The unit of measurement on the y-axis is the percentage of students who reach ELA proficiency for each grade level and the unit of measurement on the y-axis are grade levels, 3rd through 8th.

Synopsis: Changes in proficiency levels over time provide additional information about the duration and depth of the proficiency decrease in 6th grade. Graph 8 shows that there are no large changes in 5th – 7th grade scores from 2014-2017, indicating that this has been a problem for at least the past three years.
Graph 7 shows the percentage of Montgomery County students who earned each PARCC score in 5th, 6th, and 7th grades, in ELA, across three years: the 2014/2015 (blue columns), 2015/2016 (gray columns), and 2016/2017 (green columns) school years.
Elaboration: Notice that all three grades show some improvement in scores over the three school years: there is a general increase in the percentage of students who earn a score of 4 or 5 and a general decrease in the percentage of students earning 1 (in 6th and 7th grades), 2, and 3. Despite these positive trends, however, the scores are relatively stable across all three years, with no scores changing as much as 5 percentage points over the years. Thus, there is no recent narrowing or widening of the 6th grade gap. It therefore appears that the problem in 6th grade is not a recent phenomenon.
Graph 7: Distribution Comparison, Montgomery County ELA Scores, All Students
0.000.050.100.150.200.250.300.350.400.45
1 2 3 4 5
5th Grade
2015 2016 2017
0.000.050.100.150.200.250.300.350.400.45
1 2 3 4 5
6th Grade
2015 2016 2017
0.000.050.100.150.200.250.300.350.400.45
1 2 3 4 5
7th Grade
2015 2016 2017

Synopsis: In order to see how PARCC scores differ from 5th to 7th grades, the next graph shows the distribution of average ELA test scores in 5th, 6th, and 7th grades. This graph shows that the difference in the distributions between the 5th and 6th grades are mainly in the middle of the distribution, where a smaller percentage of students who scored a 4 in 5th grade were able to do so in 6th grade.
Graph 8 shows the average percentage of Montgomery County students who earned each score on the ELA PARCC exam in 5th, 6th, and 7th grades. Percentages are averaged over the 2014/2015 to 2016/2017 school years.
Elaboration: The most notable difference between the 5th and 6th grade distributions is a 4 percentage point increase in level 3 scores and a 5 percentage point decrease in level 4 scores, between 5th and 6th grades. This implies that students who were just able to meet proficiency in 5th grade are unable to do so in 6th grade. Notice that the percentage of students who earned a 1, 2, or 5 in either grade level is stable between 5th and 6th grade. In contrast, there is a widening of scores in 7th grade, as a greater percentage of students earn either a 1 or 5. This suggests some students fall behind, but a larger percentage of students increase their scores between 6th and 7th grades in ELA.
Graph 8: Distribution Comparison, Montgomery County ELA Scores, All Students, Averaged Across 2015-2017
0.09
0.17
0.24
0.44
0.06
0.00
0.05
0.10
0.15
0.20
0.25
0.30
0.35
0.40
0.45
0.50
1 2 3 4 5
5th Grade
0.09
0.18
0.28
0.39
0.06
0.00
0.05
0.10
0.15
0.20
0.25
0.30
0.35
0.40
0.45
0.50
1 2 3 4 5
6th Grade
0.120.15
0.23
0.35
0.14
0.00
0.05
0.10
0.15
0.20
0.25
0.30
0.35
0.40
0.45
0.50
1 2 3 4 5
7th Grade

Synopsis: In order to understand which groups of students were most effected by the decrease in 6th grade ELA proficiency, the next graph decomposes students’ level 4 scores in 5th and 6th grades by student subgroup. These graphs show that Hispanic students, African American students, and students who qualify for free-or-reduced priced meals were less likely to score a 4 in 6th grade than 5th grade. In contrast, white students were more likely to score a 4 in 6th than 5th grade.
Graph 9 compares the percentage of students who earned a level 4 in 5th and 6th grades by student subgroup. The leftmost panel shows the change in the percent of students who earned a 4 in 5th versus 6th grade by racial composition; the next panel provides this comparison by English language proficiency status; the following panel shows this information by free-or-reduced-priced meal qualification; and the right-most provides this comparison by special education status. All percentages are averages from the three most recent school years, 2014/2015 to 2016/2017.
Elaboration: Graphs 9 shows that students were differentially impacted by the decline in level 4 scores between 5th and 6th grades. Hispanic students, African American students, students with limited English proficiency, students who qualify for free-or-reduced priced meals, and special education students are less likely to earn a level 4 in 6th grade compared to 5th grade. However, students who qualify for free-or-reduced priced meals experienced the largest percentage point decline—20% of students who earned a 4 in 5th grade also qualified for free-or-reduced priced meals, compared with 16% in 6th grade. In addition, both Hispanic and African American students each comprised 16% of level 4 scorers in 5th grade, but both subgroups declined to 14% each of level 4 scorers in 6th grade. Students with limited English proficiency and special education students’ level 4 presence dropped 1 percentage point. In contrast, white students and students of “other” race are more likely to earn a level 4 in 6th grade compared to 5th grade.

Graph 9: Montgomery County 5th and 6th Grade Level 4 ELA Score Comparison, Student Subgroups, , Averaged Across 2015-2017
42% 45%
16% 14%
16% 14%
26% 27%
0%
10%
20%
30%
40%
50%
60%
70%
80%
90%
100%
5th Grade 6th Grade
White African American
Hispanic Other Race
1% 0%
99% 100%
0%
10%
20%
30%
40%
50%
60%
70%
80%
90%
100%
5th Grade 6th Grade
LEP non-LEP
20% 16%
80% 84%
0%
10%
20%
30%
40%
50%
60%
70%
80%
90%
100%
5th Grade 6th Grade
FARM non-FARM
3% 2%
97% 98%
0%
10%
20%
30%
40%
50%
60%
70%
80%
90%
100%
5th Grade 6th Grade
SPED non-SPED

Recommendation Synopsis: Given the fact that the decrease in 6th grade ELA scores were most heavily concentrated among Hispanic students, African American students, and students who qualify for free-or-reduced priced meals, is there evidence that other school districts are more effective in helping these groups of students achieve proficiency in 6th grade ELA? The graphs below suggest that Cherry Creek and Jefferson Counties have a stronger track record of helping a greater percentage of students from some of these subgroups meet proficiency requirements in 6th grade ELA.
Graphs 10 through 13 compare the percentage of students who meet ELA proficiency requirements in 6th grade, among Hispanic students, African American students, students who qualify for free-or-reduced-priced meals, and special education students, respectively. 18 Montgomery County is shown in the left most position; while statistics from comparison school districts, which are both relatively large and have similar percentages of the student subgroup of interest, are to the right of Montgomery County’s statistics. 19
Elaboration: Graphs 11 and 12 show that Montgomery County has lower 6th grade ELA proficiency levels than Cherry Creek and Jefferson Counties, among students who qualify for free-or-reduced-priced meals and Hispanic students, respectively. Specifically, Cherry Creek’s proficiency level is 9 percentage points higher, among students who qualify for free-or-reduced-priced meals, in the 2014/2015 school year than Montgomery County’s average 6th grade ELA proficiency level. Jefferson County’s proficiency level is 12 percentage points higher in the 2014/2015 school year than Montgomery County’s average 6th grade ELA proficiency level among Hispanic students. Note that
18 Note that students with limited English proficiency are discussed in detail in the next section. 19 The horizontal axis of each graph provides both information about the school district and the year of PARCC scores. Each school district is represented by a single color on the graph—where the leftmost bar represents the district’s PARCC scores in the 2014-2015 school year (labeled 2015 at the bottom of the graph); the middle most bar represents the school district’s PARCC scores from the 2015-2016 school year (labeled 2016 at the bottom of the graph); and the right most bar for the school district represents the PARCC scores from the 2016-2017 school year (labeled 2017 at the bottom of the graph). Note that only data from the 2014/2015 school year disaggregated by student subgroup is available for the Colorado school districts. The vertical axis measures the percentage of students that earned a score of either 4 or 5 on the PARCC exam.

the tables in Appendix A show that Montgomery County’s proficiency levels are typically similar to both Cherry Creek and Jefferson Counties when comparisons are amongst all students.
Graph 10 shows that Montgomery County’s proficiency levels among African American students are similar to Cherry Creek and Howard Counties and higher than Prince George’s County in 6th grade ELA. This graph does not therefore provide a suggested comparison curriculum that better meets the needs of African American students in 6th grade ELA.
Graph 13 shows that Montgomery County’s proficiency level in 6th grade ELA among special education students is statistically significantly higher than Anne Arundel and Howard Counties.20 This graph does not therefore provide a suggested comparison curriculum that better meets the needs of special education students in 6th grade ELA.
20 Specifically, Montgomery County’s proficiency level among 6th grade special education students is statistically significantly higher than Anne Arundel County in all three years and Howard County in the 2016/2017, but there is no statistical different between Howard County and Montgomery County’s proficiency levels in 2014/2015 or 2015/2016.

Graph 10: Proficiency Levels 6th Grade ELA, African American Students
0.23
0.280.29
0.19
0.21
0.240.23
0.28 0.29
0.22
0.28
0.00
0.05
0.10
0.15
0.20
0.25
0.30
0.35
2015 2016 2017 2015 2016 2017 2015 2016 2017 2015 2015
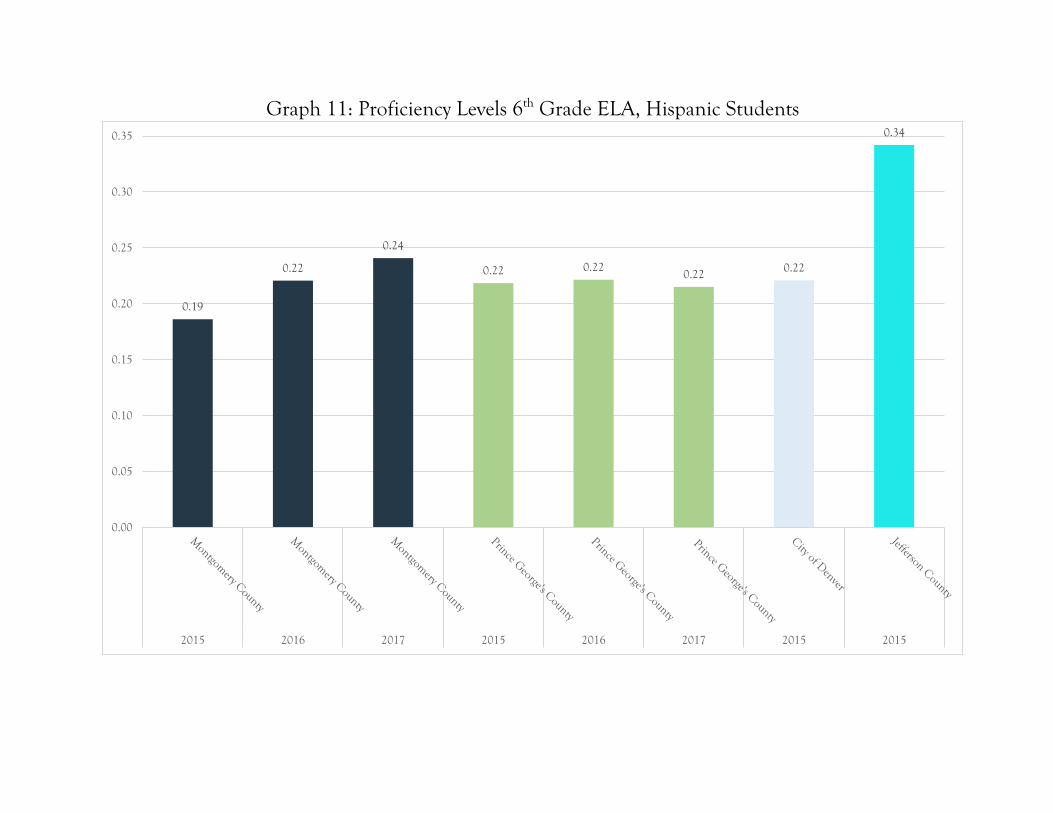
Graph 11: Proficiency Levels 6th Grade ELA, Hispanic Students
0.19
0.22
0.24
0.22 0.220.22 0.22
0.34
0.00
0.05
0.10
0.15
0.20
0.25
0.30
0.35
2015 2016 2017 2015 2016 2017 2015 2015
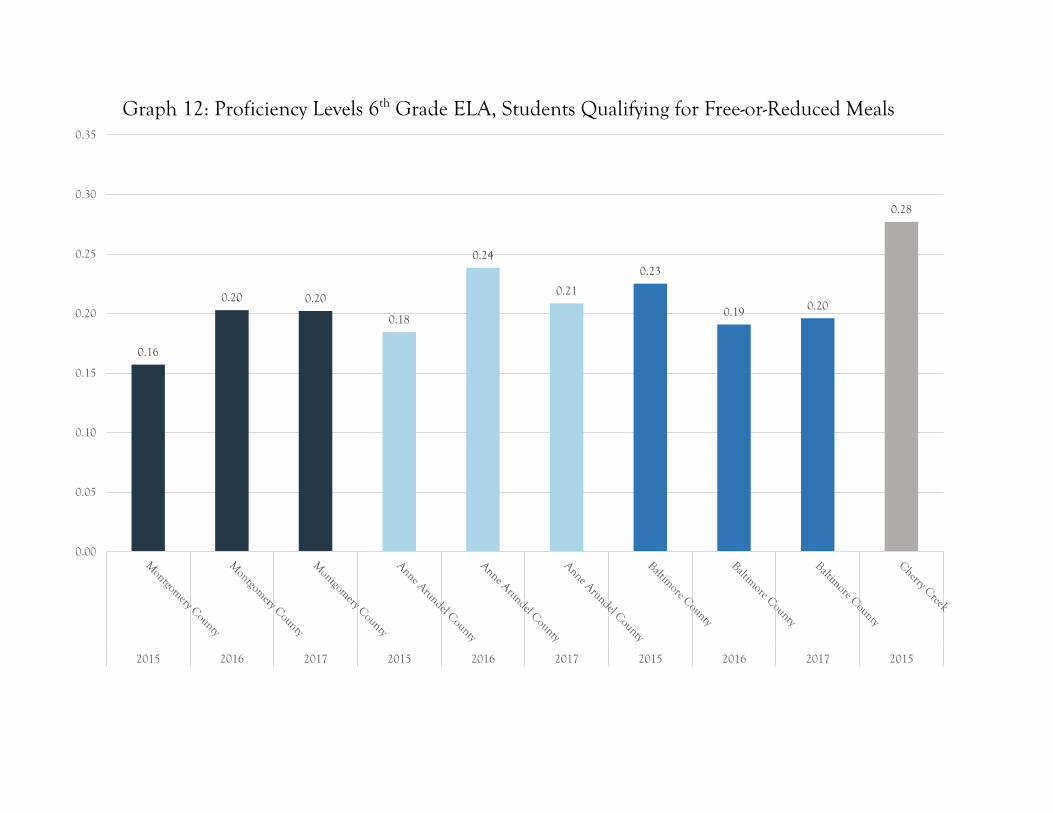
Graph 12: Proficiency Levels 6th Grade ELA, Students Qualifying for Free-or-Reduced Meals
0.16
0.20 0.20
0.18
0.24
0.21
0.23
0.19 0.20
0.28
0.00
0.05
0.10
0.15
0.20
0.25
0.30
0.35
2015 2016 2017 2015 2016 2017 2015 2016 2017 2015

Graph 13: Proficiency Levels 6th Grade ELA, Special Education Students
0.080.09
0.12
0.050.04
0.060.05
0.08
0.06
0.00
0.05
0.10
0.15
0.20
0.25
0.30
0.35
2015 2016 2017 2015 2016 2017 2015 2016 2017

Area of Concern: ELA Scores of students with limited English proficiency (LEP)
The problem: The percent of LEP students that achieve proficiency in ELA is lower than any other subgroup in Montgomery County.21
Analysis:
1. Less than 8% of LEP students achieve grade level ELA proficiency requirements in any school year from 2014/2015 to 2016/2017 and in any grades, 3rd through 8th grades.
2. Most LEP students are well below grade level—the most common score for LEP students in ELA is 1, on average, across 3rd through 8th grades.
3. Further, the percent of LEP students who score level 1 uniformly increases from 4th through 8th grades, while the percent of students who earn a level 2,3,4, or 5 decreases from 4th through 8th grades.
Recommendation: Cherry Creek County and Jefferson County perform significantly better in both 3rd and 4th grade ELA among LEP students. In 5th through 8th grades, the percentage of LEP students that achieve proficiency in Cherry Creek County and Jefferson County is higher than Montgomery County, although not significantly so. Both of these school districts perform similarly to Montgomery County in comparisons with all students.22 Further, both districts are relatively large and have relatively similar percentages of LEP students. Therefore, the ELA curricula in Cherry Creek and Jefferson Counties might be a useful resource, especially in 3rd and 4th grades, for understanding how to better meet the learning needs of LEP students.
21 See proficiency levels by subgroup in the appendix. 22 See pages 2-14 in the appendix for these comparisons.

Detailed Analysis:
Synopsis: In order to understand the academic performance of students with limited English proficiency (LEP), graph 14 shows the percentage of Montgomery County’s 3rd through 8th grade LEP students who have met grade level proficiency requirements on their PARCC exams. This graph shows that while proficiency rates generally decrease with each passing grade in both math and ELA, math proficiency levels are roughly double those of ELA among LEP students. Therefore graph 14 evidence that ELA is of greater concern among LEP students than math.
Graph 14 shows the percentage of LEP students who earned either a 4 or 5 on 3rd through 8th grade PARCC exams in Montgomery County. The left panel shows proficiency levels in ELA and the right panel shows proficiency levels in math. Proficiency levels are averaged across the three most recent school years: 2014/2015, 2015/2016, and 2016/2017.
Elaboration: Both panel show a general decline in proficiency levels with each passing grade. For example, 6% of 3rd graders meet ELA proficiency requirements in 3rd grade; while 4% of 4th and 5th graders meet their grade level ELA requirements; and 2% of 6th and 8th graders meet their grade level ELA proficiency requirements. Note that in algebra, where 11% of LEP students meet proficiency requirements (compared with 2% in 8th grade math), and a small increase in 7th grade ELA are the exception to this general decrease in proficiency levels.
In addition, while both panels show that proficiency rates are both generally low for LEP students in both math and ELA, math proficiency rates are roughly double ELA proficiency rates. 23 For example, 15% of LEP students meet proficiency requirements in 3rd grade math, compared with 7% in ELA; 7% of LEP students meet proficiency requirements in 5th grade math, compared with 4% in ELA; and 5% of 7th grade students meet math proficiency requirements, compared with 3% in ELA.
23 Note that 8th grade appears to be the exception to this general observation, where 2% of LEP students meet math and ELA proficiency levels respectively. However, 8th grade ELA students are taking either 8th grade math or algebra, so both of these scores serve as the correct comparison group.

Graph 14: Proficiency levels in Montgomery County of LEP Students, Averaged Across 2015-2017
0.06
0.04 0.040.02 0.03 0.02
0.00
0.02
0.04
0.06
0.08
0.10
0.12
0.14
0.16
0.18
0.20
3rd Grade 4th Grade 5th Grade 6th Grade 7th Grade 8th Grade
ELA
0.15
0.07 0.07
0.05 0.05
0.02
0.11
0.00
0.02
0.04
0.06
0.08
0.10
0.12
0.14
0.16
0.18
0.20
3rd Grade 4th Grade 5th Grade 6th Grade 7th Grade 8th Grade Algebra
Math

Synopsis: In order to understand how far below proficiency LEP students are, the next graph provide the distribution of LEP students’ ELA PARCC scores. This graph shows that most LEP students are well below proficiency—the most common score for LEP students in ELA is 1, on average, across 3rd through 8th grades.
Graph 15 shows the percentage of LEP students, in a given grade, that earned each score on the ELA PARCC exam. Each panel shows the distribution for a different grade level across the three most recent school years 2014/2015 (in blue), 2015/2016 (in gray), and 2016/2017 (in green).
Elaboration: Graph 14 shows that few LEP students are proficient in ELA, graph 15 shows that the vast majority of LEP students are actually well below proficient. The mode24 in each grade level is, on average, a level 1 in 3rd through 8th grades. Further, over 75% of LEP students earn either a 1 or 2 on their ELA PARCC exam in each of the last three school years in 3rd through 8th grades.
Graph 15 also shows that LEP students’ scores are generally improving in 3rd, 4th, 6th, and 7th grades over the past three school years. For example, the percent of students who earned a level 1 decreased from 2014/2015 to 2016/2017 in 3rd, 4th, and 6th grades and the percentage of students who earned a level 3 increased from 2014/2015 to 2016/2017 in 3rd, 4th, 6th, and 7th grades. However, in 5th and 8th grades the percentage of students earning a 1 has increased and the percentage of students who have achieved proficiency has decreased from 2014/2015 to 2016/2017.
24 or score most commonly earned

Graph 15:Distribution of Montgomery County ELA PARCC Scores in 3rd-8th Grades, LEP Students
0.00
0.10
0.20
0.30
0.40
0.50
0.60
0.70
1 2 3 4 or 5
3rd Grade
2015 2016 2017
0.00
0.10
0.20
0.30
0.40
0.50
0.60
0.70
1 2 3 4 or 5
4th Grade
2015 2016 2017
0.00
0.10
0.20
0.30
0.40
0.50
0.60
0.70
1 2 3 4 or 5
5th Grade
2015 2016 2017
0.00
0.10
0.20
0.30
0.40
0.50
0.60
0.70
1 2 3 4 or 5
6th Grade
2015 2016 2017
0.00
0.10
0.20
0.30
0.40
0.50
0.60
0.70
1 2 3 4 or 5
7th Grade
2015 2016 2017
0.00
0.10
0.20
0.30
0.40
0.50
0.60
0.70
1 2 3 4 or 5
8th Grade
2015 2016 2017

Synopsis: In order to better understand how ELA scores change across grades, the next graph shows the percentage of students in each grade that earned each PARCC score. This graph shows that the percentage of LEP students who score level 1 uniformly increases from 4th through 8th grades, while the percentage of students who earn a level 2,3,4, or 5 decreases from 4th through 8th grades.
Graph 16 shows the percentage of LEP students, at each grade level, that earned a particular PARCC score. For example, the top left-hand panel shows the average percentage of 3rd grade LEP students that earned a level 1 score on their ELA PARCC exam in the left-most column and the average percentage of 8th graders that earned a level 1 score on their ELA PARCC exam in the right-most column. Percentages are averaged over the three most recent school years: 2014/2015, 2015/2016, and 2016/2017.
Elaboration: This graph shows a steady decline in the percentage of LEP students that earn a level 3, 4, and 5 on their ELA PARCC exams from 3rd through 8th grades, with the exception of a 1% increase in level 4 or 5 scores in 7th grade. The percentage of LEP students that earn a level two on their ELA PARCC exams also generally declines from 3rd through 8th grade (although there is an 8 percentage point increase in the percentage of students that earn a 2 from 3rd to 4th grade, and then the percentage of students earning a 2 declines from 4th through 8th grades).
In contrast, the percentage of LEP students that earn a level 1 on their ELA PARCC exams increases 17 percentage points from 3rd through 8th grade. By 6th grade, the majority of LEP students earn a level 1 scores in ELA.
This suggests that while LEP students never perform very well on the ELA PARCC exams, students are either falling further behind each year they are in school or LEP students who enter the Montgomery County school system at later grades are further behind grade level expectations that students who enter at earlier grades.

Graph 16: Distribution of Montgomery County ELA PARCC Scores in 3rd-8th Grades, LEP Students, Averaged Across 2015-2017
0.450.41
0.490.53
0.61 0.62
0.00
0.10
0.20
0.30
0.40
0.50
0.60
0.70
3rd Grade 4th Grade 5th Grade 6th Grade 7th Grade 8th Grade
Level1
0.30
0.380.36 0.35
0.27 0.27
0.00
0.10
0.20
0.30
0.40
0.50
0.60
0.70
3rd Grade 4th Grade 5th Grade 6th Grade 7th Grade 8th Grade
Level 2
0.19 0.170.11 0.10 0.09 0.09
0.00
0.10
0.20
0.30
0.40
0.50
0.60
0.70
3rd Grade 4th Grade 5th Grade 6th Grade 7th Grade 8th Grade
Level 3
0.060.04 0.04 0.02 0.03 0.02
0.00
0.10
0.20
0.30
0.40
0.50
0.60
0.70
3rd Grade 4th Grade 5th Grade 6th Grade 7th Grade 8th Grade
Levels 4 or 5

Recommendation Synopsis: Given the challenges of meeting the needs of LEP students, especially in ELA, is there evidence that other school districts are helping their LEP students reach proficiency in ELA more effectively? The graphs below show that Cherry Creek and Jefferson Counties perform significantly better in both 3rd and 4th grade ELA among LEP students. In 5th through 8th grades, the percent of LEP students that achieve proficiency in Cherry Creek and Jefferson County are higher than Montgomery County, although not significantly so.
Graphs 17 through 22 compare LEP students’ ELA proficiency levels in 3rd through 8th grades both over time and across different school districts.25 Montgomery County is shown in the left most position; three other school districts—Prince George’s County, Jefferson County, and Cherry Creek—serve as comparison districts, as they are all relatively large and have similar percentages of LEP students.
Elaboration: Graphs 17 and 18 show that Montgomery County has significantly lower proficiency rates for students with limited English proficiency than Cherry Creek and Jefferson Counties in 3rd and 4th grades. Note that the tables in the appendix show that Montgomery County’s proficiency levels are typically similar to both Cherry Creek and Jefferson Counties when comparisons are amongst all students.
Graphs 19 through 22 show that the gaps remain in 5th through 8th grades between the percentage of LEP students that reach proficiency in Montgomery County and both Cherry Creek and Jefferson Counties. However, these gaps are not statistically significant. Nonetheless, taken together, graphs 17-22 provide evidence that Cherry Creek and Jefferson Counties are teaching their LEP students more effectively.
25 The horizontal axis of each graph provides both information about the school district and the year of PARCC scores. Each school district is represented by a single color on the graph—where the leftmost bar represents the district’s PARCC scores in the 2014-2015 school year (labeled 2015 at the bottom of the graph); the middle most bar represents the school district’s PARCC scores from the 2015-2016 school year (labeled 2016 at the bottom of the graph); and the right most bar for the school district represents the PARCC scores from the 2016-2017 school year (labeled 2017 at the bottom of the graph). Note that only data from the 2014/2015 school year disaggregated by student subgroup is available for the Colorado school districts. The vertical axis measures the percentage of students that earned a score of either 4 or 5 on the PARCC exam.
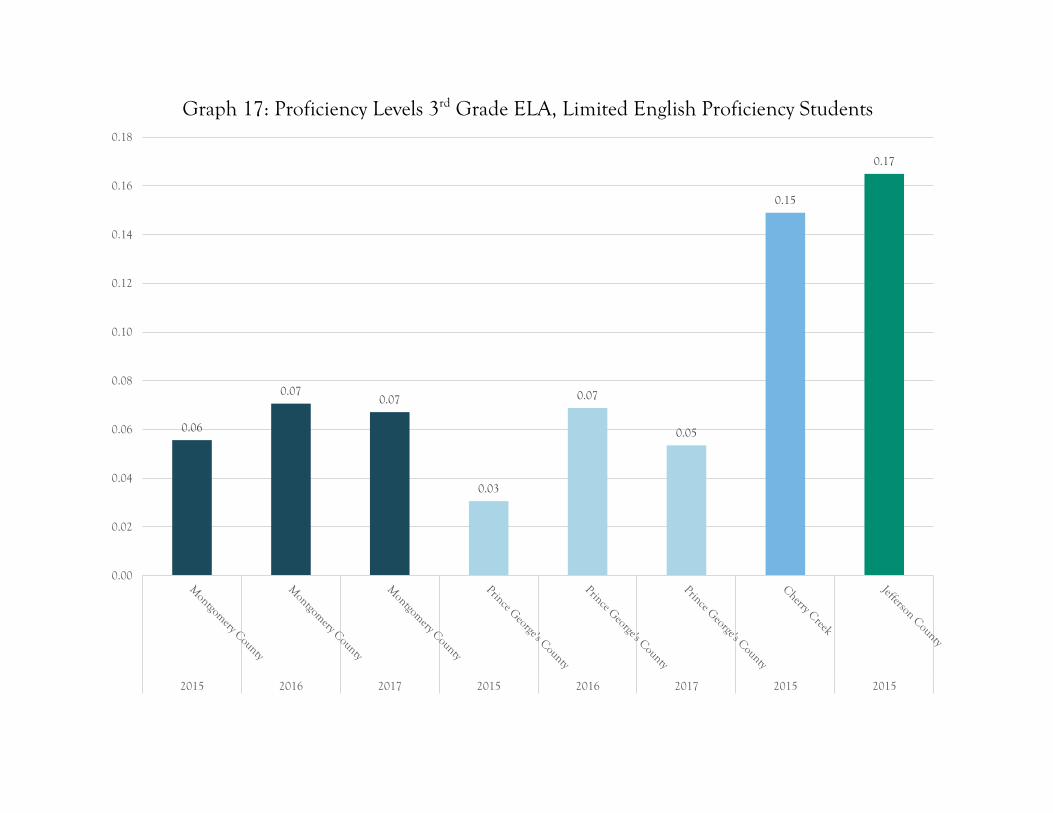
Graph 17: Proficiency Levels 3rd Grade ELA, Limited English Proficiency Students
0.06
0.070.07
0.03
0.07
0.05
0.15
0.17
0.00
0.02
0.04
0.06
0.08
0.10
0.12
0.14
0.16
0.18
2015 2016 2017 2015 2016 2017 2015 2015

Graph 18: Proficiency Levels 4th Grade ELA, Limited English Proficiency Students
0.030.04 0.04
0.01
0.03 0.02
0.13
0.13
0.00
0.02
0.04
0.06
0.08
0.10
0.12
0.14
0.16
0.18
2015 2016 2017 2015 2016 2017 2015 2015

Graph 19: Proficiency Levels 5th Grade ELA, Limited English Proficiency Students
0.03
0.06
0.02
0.01
0.03
0.01
0.07
0.07
0.00
0.02
0.04
0.06
0.08
0.10
0.12
0.14
0.16
0.18
2015 2016 2017 2015 2016 2017 2015 2015

Graph 20: Proficiency Levels 6th Grade ELA, Limited English Proficiency Students
0.020.03
0.02
0.01
0.02
0.01
0.03
0.07
0.00
0.02
0.04
0.06
0.08
0.10
0.12
0.14
0.16
0.18
2015 2016 2017 2015 2016 2017 2015 2015

Graph 21: Proficiency Levels 7th Grade ELA, Limited English Proficiency Students
0.020.02
0.03
0.010.02 0.02
0.05 0.05
0.00
0.02
0.04
0.06
0.08
0.10
0.12
0.14
0.16
0.18
2015 2016 2017 2015 2016 2017 2015 2015

Graph 22: Proficiency Levels 8th Grade ELA, Limited English Proficiency Students
0.020.02
0.02 0.02 0.020.01
0.030.04
0.00
0.02
0.04
0.06
0.08
0.10
0.12
0.14
0.16
0.18
2015 2016 2017 2015 2016 2017 2015 2015

Area of Concern: 7th Grade Math
The problem: There is a large decrease in the percentage of Montgomery County students who meet proficiency in 7th grade math, compared to 6th grade.
Analysis:
1. This analysis below shows a decrease in the percentage of students that earn a 4 or 5 and a decrease in the percentage of students that earn a 2 or 3 in 7th grade, compared to 6th grade. Specifically:
a. There is a 6 percentage point decline in both level 4 and 5 scores in 7th grade.
b. There is a 7 and 4 percentage point increase in level 3 and 2 scores, respectively, in 7th grade.
2. Further investigation shows that all student subgroups were equally impacted by the change in level 3 and 4 scores between 6th and 7th grades.
Recommendation: These data suggest a further look at the 7th grade curriculum in order to better understand why students who are able to reach proficiency in 6th grade, fail to do so in 7th grade. A comparison with other school districts shows that Cherry Creek has similar proficiency levels in 6th grade math as Montgomery County, and higher proficiency levels in 7th grade. Further investigation into Cherry Creek’s 7th grade math curriculum might be beneficial.

Detailed Analysis:
Synopsis: The graph below shows that there is, on average, a 10 percentage point decrease in average math proficiency rates between 6th and 7th grade.
Graph 23 compares average math proficiency levels in 3rd through 8th grades. Montgomery County is shown in the upper-left-hand panel and five other school districts serve as comparison districts: Prince George’s County; Anne Arundel County; Howard County; Jefferson County; and Cherry Creek. Proficiency levels are averaged across the three most recent school years: 2014/2015, 2015/2016, and 2016/2017
Elaboration: This graph shows that Montgomery County has average proficiency level of 40% in 6th grade and an average proficiency level of 29% in 7th grade. This decline is not unique to Montgomery County—Howard County experiences a steeper decline and Jefferson County and Prince George’s County also experience proficiency declines between 6th and 7th grades. However, the decrease in proficiency rates is also not inevitable—Cherry Creek County has a similar average proficiency level in 6th grade and an average proficiency level of one percentage point lower in 7th grade. Further, Anne Arundel County’s proficiency levels drops 3 percentage points from 6th to 7th grades.
As seen in the tables in graph 30, Montgomery County’s 8th grade proficiency level increased from 7th to 8th grades in both the 2014/2015 and 2015/2016 school years—from an average proficiency level of 29% to 37.5%. This suggests that there is a problem present in 7th grade that does not exist in either 6th or 8th grades.

Graph 23: Math Proficiencies Across 3rd-8th Grades, All Students, Averaged Across 2015-2017
0.500.45 0.43 0.40
0.29 0.27
0.42
0.000.100.200.300.400.500.600.70
3rdGrade
4thGrade
5thGrade
6thGrade
7thGrade
8thGrade
algebra
Montgomery County
0.520.43 0.44 0.40 0.39
0.27
0.48
0.000.100.200.300.400.500.600.70
3rdGrade
4thGrade
5thGrade
6thGrade
7thGrade
8thGrade
algebra
Cherry Creek County
0.470.40 0.40 0.36 0.33
0.12
0.42
0.000.100.200.300.400.500.600.70
3rdGrade
4thGrade
5thGrade
6thGrade
7thGrade
8thGrade
algebra
Anne Arundel County
0.58 0.54 0.51 0.50
0.25 0.26
0.55
0.000.100.200.300.400.500.600.70
3rdGrade
4thGrade
5thGrade
6thGrade
7thGrade
8thGrade
algebra
Howard County
0.450.38 0.40 0.41
0.34
0.18
0.41
0.000.100.200.300.400.500.600.70
3rdGrade
4thGrade
5thGrade
6thGrade
7thGrade
8thGrade
algebra
Jefferson County
0.230.18 0.17 0.15
0.10 0.12 0.16
0.000.100.200.300.400.500.600.70
3rdGrade
4thGrade
5thGrade
6thGrade
7thGrade
8thGrade
algebra
Prince George's County

Synopsis: In order to better understand the duration and depth of the proficiency decrease in 7th grade, changes in proficiency levels over time are next investigated. Graph 24 shows that there are no large changes in scores from 2014-2017, indicating that the gap in math proficiency levels between 6th and 7th grade has been a problem for at least the past three years.
Graph 24 shows the percentage of students who earned a score of 1,2,3,4, or 5 on the PARCC exam in 6th and 7th grade math in Montgomery County across three years: the 2014/2015 (pink columns), 2015/2016 (yellow columns), and 2016/2017 (red columns) school years.
Elaboration: Both grades show some improvement in scores over the three school years, such as a decrease in the percentage of students earning a 2 from the 2014/2015 to 2015/2016 school years in both 6th and 7th grades and an increase in the percentage of level 4 scores in 7th grade. Further, while graph 24 shows that the 6th to 7th grade proficiency gap has narrowed, from a 19 to 15 percentage point difference in 2014/2015 to 2016/2017, a persistent gap in proficiency levels remains across all three years.
Graph 24: Distribution Comparison, Montgomery County Math, All Students
0.00
0.05
0.10
0.15
0.20
0.25
0.30
0.35
0.40
0.45
1 2 3 4 5
PARCC Scores
6th Grade
2015 2016 2017
0.00
0.05
0.10
0.15
0.20
0.25
0.30
0.35
0.40
0.45
1 2 3 4 5PARCC Scores
7th Grade
2015 2016 2017

Synopsis: In order to compare the difference in the how students score between 6th and 7th grades, the next graph shows the average distribution of scores. This graph shows a decline in the percentage of 4 and 5 scores in 7th grade coupled with an increase in the percentage of 2 and 3 scores. There was no change in the percentage of level 1 scores.
Graph 25 shows the average percentage of students who earned each PARCC score in 6th and 7th grade math in Montgomery County. The percentages are averaged over the 2014/2015 to 2016/2017 school years.
Elaboration: Graph 25 shows that the mode in 6th grade math is 4, while the most common score earned in 7th grade is a 3. Indeed, there is a general shift in scores from 6th to 7th grade—the percentage of students who earned a 2 or 3 increased from 6th to 7th grade and the percentage of students who earned a 4 and 5 decreased from 6th to 7th grade. Further, the greatest change between 6th and 7th grade happened amongst higher scores—there is a 7 percentage point increase in the percentage of students earning a 3 from 6th to 7th grade and a 6 percentage point decrease in the percentage of both level 4 and 5 scores from 6th to 7th grade. Note that there is very little change in scores among the weakest students—the proportion of students who scored a 1 remained the same across both grades.
Graph 25: Distribution Comparison, Montgomery County Math Scores, All Students, Averaged Across 2015-2017
0.11
0.22
0.27
0.33
0.08
0.00
0.05
0.10
0.15
0.20
0.25
0.30
0.35
1 2 3 4 5PARCC Scores
6th Grade
0.11
0.26
0.34
0.27
0.02
0.00
0.05
0.10
0.15
0.20
0.25
0.30
0.35
1 2 3 4 5
PARCC Scores
7th Grade

Synopsis: The next graphs show that there were no large changes in subgroup representation between 6th and 7th grades for students who score either level 3 or level 4, despite the overall increase in the percentage of students who earn level 3 and the decrease in the percentage of students who earn a level 4. Thus, all subgroups of students were equally impacted by the decline in math PARCC scores between 6th and 7th grades.
Graphs 26 and 27 compare the percentage of students who earned a level 3 and 4, respectively, in 6th and 7th grades by subgroup. The leftmost panel shows the change in the percentage of students who earned a given score in 6th versus 7th grade by racial composition; the next panel provides this comparison by English language proficiency status; the following panel shows this information by free-or-reduced-priced meal qualification; and the right-most panel provides this comparison by special education status. All percentages are averages from the three most recent school years, 2014/2015 to 2016/2017.
Elaboration: Both graphs show that the demographic decomposition of scores remains stable across both 6th and 7th grade, despite the overall changes in the percentage of students who earned each of these scores. For example, the largest changes in subgroups between 6th and 7th grades are a 2 percentage point increase in white and Hispanic students and a 2 and 1 percentage point decrease in “other” race and African American students earning a level 4 score, respectively. The decomposition by student subgroup remains within a one percentage point difference between 6th and 7th grade for the rest of the subgroups investigated below. This suggests that all student subgroups were equally impacted by the decrease in math PARCC scores from 6th to 7th grades.
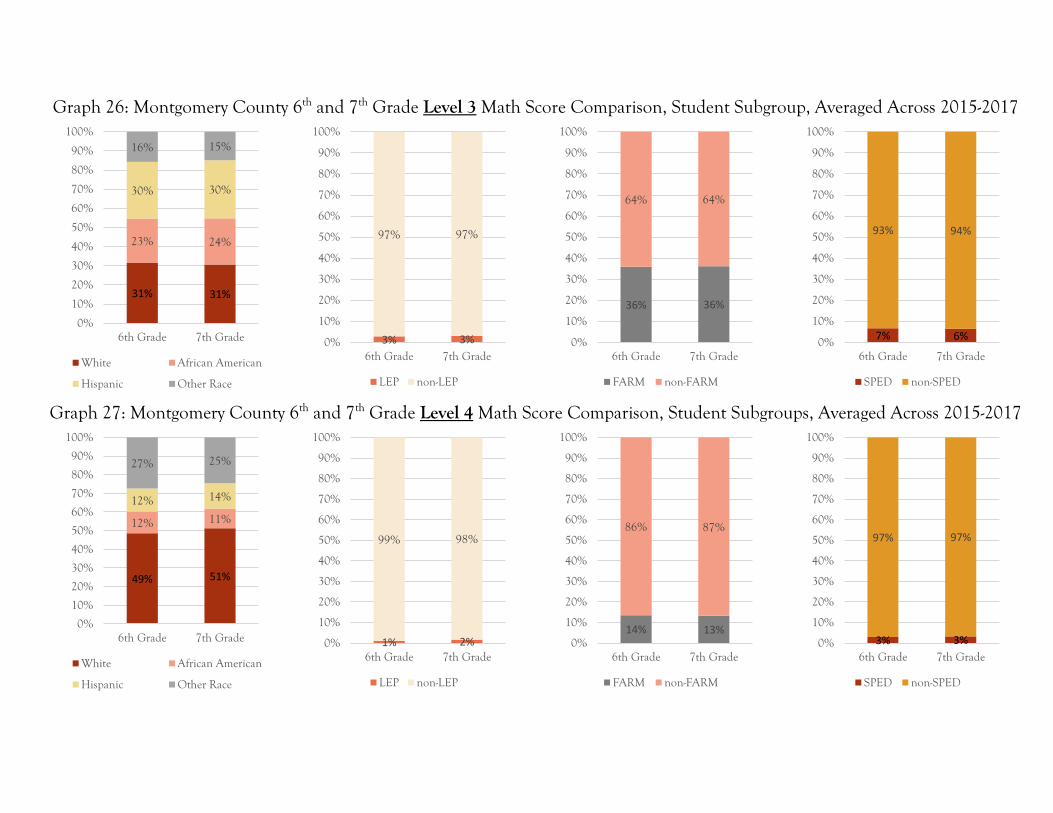
Graph 26: Montgomery County 6th and 7th Grade Level 3 Math Score Comparison, Student Subgroup, Averaged Across 2015-2017
Graph 27: Montgomery County 6th and 7th Grade Level 4 Math Score Comparison, Student Subgroups, Averaged Across 2015-2017
31% 31%
23% 24%
30% 30%
16% 15%
0%
10%
20%
30%
40%
50%
60%
70%
80%
90%
100%
6th Grade 7th Grade
White African American
Hispanic Other Race
3% 3%
97% 97%
0%
10%
20%
30%
40%
50%
60%
70%
80%
90%
100%
6th Grade 7th Grade
LEP non-LEP
36% 36%
64% 64%
0%
10%
20%
30%
40%
50%
60%
70%
80%
90%
100%
6th Grade 7th Grade
FARM non-FARM
7% 6%
93% 94%
0%
10%
20%
30%
40%
50%
60%
70%
80%
90%
100%
6th Grade 7th Grade
SPED non-SPED
49% 51%
12% 11%
12% 14%
27% 25%
0%
10%
20%
30%
40%
50%
60%
70%
80%
90%
100%
6th Grade 7th Grade
White African American
Hispanic Other Race
1% 2%
99% 98%
0%
10%
20%
30%
40%
50%
60%
70%
80%
90%
100%
6th Grade 7th Grade
LEP non-LEP
14% 13%
86% 87%
0%
10%
20%
30%
40%
50%
60%
70%
80%
90%
100%
6th Grade 7th Grade
FARM non-FARM
3% 3%
97% 97%
0%
10%
20%
30%
40%
50%
60%
70%
80%
90%
100%
6th Grade 7th Grade
SPED non-SPED

Recommendation Synopsis: Given the decrease in 7th grade math scores, is there evidence that other school districts are more effective in helping these groups of students achieve proficiency in 7th grade math? The graphs below provide evidence that Cherry Creek County is more effective in 7th grade math than Montgomery County.
Graphs 28 through 29, below, compare students’ math proficiency levels in 6th and 7th grades both over time and across different school districts.26 Montgomery County is shown in the left most position; while statistics from comparison school districts, which are both relatively large and have similar percentages of the student subgroup of interest, are to the right of Montgomery County.
Elaboration: Graph 28 shows that in 6th grade, Montgomery County has higher proficiency levels than Prince George’s County, Baltimore County, Anne Arundel County, and Washington D.C.; similar proficiency levels as Jefferson County and Cherry Creek County; and lower proficiency levels than Howard County on the math PARCC exam.
Graph 29 shows that in 7th grade, Montgomery County has higher proficiency levels than Prince George’s County, Baltimore County, Washington D.C., and Howard County; similar proficiency levels as Jefferson County and Anne Arundel County; and lower proficiency levels than Cherry Creek County on the math PARCC exam.
Therefore, proficiency levels in Cherry Creek County and Montgomery County are similar in 6th grade math, but Cherry Creek County has significantly higher proficiency levels in 7th grade math. This suggests that Cherry Creek County’s 7th grade math curriculum might serve as a useful resource.
26 The horizontal axis of each graph provides both information about the school district and the year of PARCC scores. Each school district is represented by a single color on the graph—where the leftmost bar represents the district’s PARCC scores in the 2014-2015 school year (labeled 2015 at the bottom of the graph); the middle most bar represents the school district’s PARCC scores from the 2015-2016 school year (labeled 2016 at the bottom of the graph); and the right most bar for the school district represents the PARCC scores from the 2016-2017 school year (labeled 2017 at the bottom of the graph). Note that only data from the 2014/2015 school year disaggregated by student subgroup is available for the Colorado school districts. The vertical axis measures the percentage of students that earned a score of either 4 or 5 on the PARCC exam.
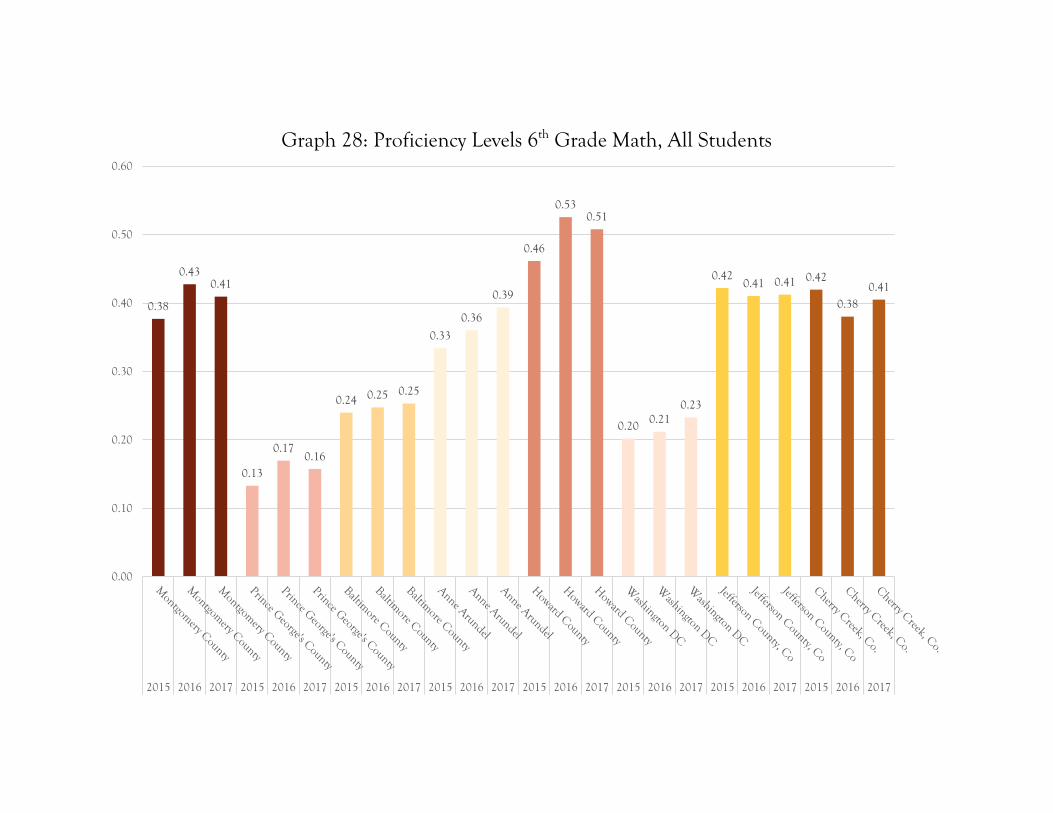
Graph 28: Proficiency Levels 6th Grade Math, All Students
0.38
0.430.41
0.13
0.170.16
0.24 0.25 0.25
0.33
0.36
0.39
0.46
0.530.51
0.200.21
0.23
0.420.41 0.41 0.42
0.38
0.41
0.00
0.10
0.20
0.30
0.40
0.50
0.60
2015 2016 2017 2015 2016 2017 2015 2016 2017 2015 2016 2017 2015 2016 2017 2015 2016 2017 2015 2016 2017 2015 2016 2017

Graph 29: Proficiency Levels 7th Grade Math, All Students
0.24
0.32 0.31
0.13
0.04
0.13
0.09 0.09 0.09
0.30
0.330.34
0.22
0.25
0.28
0.14
0.17
0.20
0.33
0.350.33
0.40 0.40
0.37
0.00
0.10
0.20
0.30
0.40
0.50
0.60
2015 2016 2017 2015 2016 2017 2015 2016 2017 2015 2016 2017 2015 2016 2017 2015 2016 2017 2015 2016 2017 2015 2016 2017

Area of Concern: 8th Grade Math/Algebra
The problem: Montgomery County’s 8th grade mathematics proficiency level dramatically declined between the 2015/2016 and 2016/2017 school years, but there was no increase in the 2016/2017 algebra proficiency level.
Analysis:
1. The decline in 8th grade math proficiency levels was presumably due to a policy that increases the proportion of students who take algebra in 8th grade. However, if the purpose of placing stronger math students in algebra is because they are prepared to be successful in algebra, then there should have been an increase in algebra proficiency rates in the 2016/2017 school year. Algebra proficiency levels did not increase.
2. In addition, 95% of students who remain in 8th grade math in 2016/2017 failed to meet proficiency. Over 50% of students in 8th grade math in 2016/2017 earned a score of 1 on the 8th grade math PARCC exam.
Recommendation: Review the criteria for selecting students into algebra, so that the students who take algebra in 8th grade will successfully reach proficiency. Perhaps the 8th grade math curriculum can be adjusted in order to address the learning needs of the students who remain in 8th grade math (e.g. serve as a remediation course).

Detailed Analysis:
Synopsis: The graphs below show the decline in 8th grade math proficiency level in the 2016/2017, compared with earlier years, and no increase in algebra during 2016/2017.
Graphs 30 and 31 compare students’ proficiency level in 8th grade math and algebra, respectively, both over time and across different school districts.27 Montgomery County is shown in the left most position; seven other school districts serve as comparison districts, as they are all relatively large school districts and have some similar student demographic characteristics.28
Elaboration: Graph 30 shows that Montgomery County’s proficiency levels declined from 39% in 2015/2016 to 5% in 2016/2017. This change was presumably due to a shift in policy towards enrolling more students in algebra during 8th grade. However, graph 31 shows that proficiency levels in algebra remained stable—44% in 2015/2016 and 43% in 2016/2017.
This suggests that the algebra selection process needs improvement in order to more accurately identify students who will successfully gain proficiency in algebra. That is, we would expect proficiency rates to increase in algebra in the 2016/2017 school year, if Montgomery County can accurately identify students who are able to reach proficiency in algebra after taking the course for a year. Therefore, the overall trend expected in the data, is a decline in 8th grade proficiency level coupled with an increase in algebra proficiency level. Note that this is exactly what happened in Howard County, who experienced a similar large decline in 8th grade proficiency and an increase in algebra proficiency—from 46% to 57%—in the 2014/2015 to 2015/2016 school years.
27 The horizontal axis of each graph provides both information about the school district and the year of PARCC scores. Each school district is represented by a single color on the graph—where the leftmost bar represents the district’s PARCC scores in the 2014-2015 school year (labeled 2015 at the bottom of the graph); the middle most bar represents the school district’s PARCC scores from the 2015-2016 school year (labeled 2016 at the bottom of the graph); and the right most bar for the school district represents the PARCC scores from the 2016-2017 school year (labeled 2017 at the bottom of the graph). The vertical axis measures the percentage of students that earned a score of either 4 or 5 on the PARCC exam.
28 See the appendix for an explanation of how comparison school districts were determined.
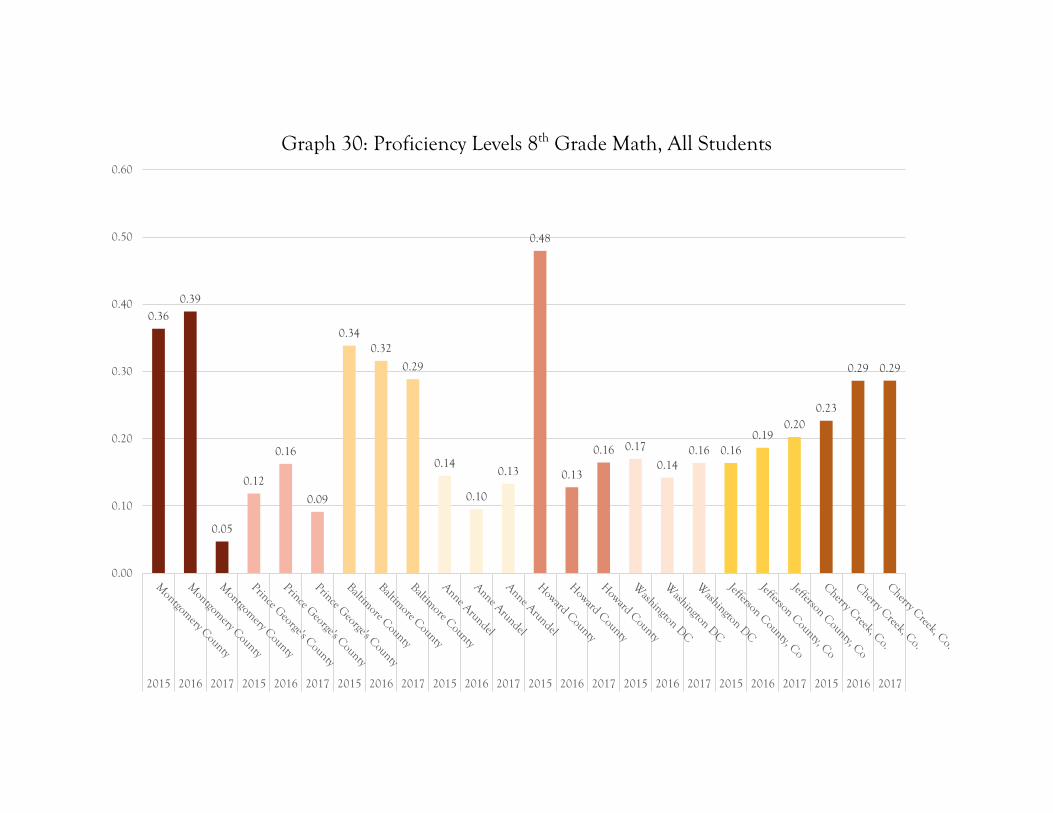
Graph 30: Proficiency Levels 8th Grade Math, All Students
0.36
0.39
0.05
0.12
0.16
0.09
0.340.32
0.29
0.14
0.10
0.13
0.48
0.13
0.16 0.17
0.140.16 0.16
0.190.20
0.23
0.29 0.29
0.00
0.10
0.20
0.30
0.40
0.50
0.60
2015 2016 2017 2015 2016 2017 2015 2016 2017 2015 2016 2017 2015 2016 2017 2015 2016 2017 2015 2016 2017 2015 2016 2017

Graph 31: Proficiency Levels Algebra, All Students
0.39
0.440.43
0.150.16 0.16
0.230.24 0.24
0.39
0.44 0.440.46
0.57
0.63
0.29
0.380.40
0.410.40
0.42
0.45
0.500.48
0.00
0.10
0.20
0.30
0.40
0.50
0.60
0.70
2015 2016 2017 2015 2016 2017 2015 2016 2017 2015 2016 2017 2015 2016 2017 2015 2016 2017 2015 2016 2017 2015 2016 2017

Synopsis: In order to better understand how PARCC scores might change with different algebra enrollment policies, the next graph shows the distribution of algebra scores across several districts. This graph shows how Howard County’s scores increased after an expansion of algebra enrollment, and serves as a comparison for Montgomery County.
Graph 32 shows the distribution of algebra test scores over time and across school districts. Here, Montgomery County is compared to Howard County, who had a similar push towards increased participation in algebra in 8th grade,29 and Cherry Creek School District, which had no large change in the number of students taking the 8th grade PARCC in over these school years.
Elaboration: Note that when Howard County initiated their push in increased algebra participation in the 2015/2016 school year, they experienced a decline in the proportion of students earning a 2 or 3 on the PARCC and an increase in the proportion of students earning a 4 or 5. Where the largest increase was experienced right after the policy change, although similar changes were also experienced the following year.
Cherry Creek County, in contrast, had no large change in their policy for algebra participation and the proportion of students scoring at each level remained relatively stable, with some improvement over time.30 Graph 30 also shows, however, that Cherry Creek County did not experience the same changes in 8th grade proficiency levels as Howard and Montgomery Counties.
Note that while Montgomery County’s trends over time are similar to Cherry Creek County’s, a more effective algebra participation selection process would mean that their trends should look more like Howard County’s.
29 Where the number of students taking the 8th grade PARCC in Howard County dropped roughly 40% from 2014/2015 to 2015/2016. This is compared with Montgomery County, where the number of students taking the 8th grade PARCC dropped roughly 60% from 2015/2016 to 2016/2017. 30 Especially from the 2014/2015 to 2015/2016 school years.

Graph 32: Comparison of Algebra PARCC Scores Across Districts, All Students
0.00
0.10
0.20
0.30
0.40
0.50
0.60
1 2 3 4 5PARCC Scores
Montgomery County
2015 2016 2017
0.00
0.10
0.20
0.30
0.40
0.50
0.60
1 2 3 4 5
PARCC Scores
Howard County
2015 2016 2017
0.00
0.10
0.20
0.30
0.40
0.50
0.60
1 2 3 4 5PARCC Scores
Cherry Creek
2015 2016 2017

Synopsis: In order to understand the learning outcomes of students who remain in 8th grade math, the distribution of their scores are next displayed. This graph shows low proficiency rates and a high percentage of level 1 scores among the students that remain in 8th grade math.
Graph 33 shows the distribution of 8th grade math scores in Montgomery County in the 2014/2015 (left-most column); 2015/2016 (middle column); and 2016/2017 (right-most column) school years. Note that roughly 6,200 students took 8th grade math in 2014/2015; approximately 6,000 students took 8th grade math in 2015/2016; and 2,400 students took 8th grade math in 2016/2017.
Elaboration: Graph 33 shows that only 5% of the students who remained in 8th grade math were able to reach proficiency. Further, there is a large increase in the percentage of students who score level 1 on the 8th grade PARCC exam—which more than doubled from roughly 25% in the 2014/2015 and 2015/2016 school years to 53% in the 2016/2017 school year. Note that over 75% of the students receiving a level 1 or 2 on the 8th grade PARCC.
Both of these statistics—the low percentage of students reaching proficiency in 8th grade math and the vast majority of students earning the lowest scores on the 8th grade PARCC—suggest that the 8th grade math curriculum is not meeting the academic needs of the students who remain in the course. Perhaps the 8th grade mathematics could serve as a remediation mathematics course, where the curriculum could be targeted towards these students who are clearly struggling with grade-level content.

Graph 33: Montgomery County’s Distribution of 8th Grade Math Scores Over Time, All Students
0.260.23
0.14
0.27
0.09
0.24 0.210.16
0.27
0.12
0.53
0.25
0.17
0.050.00
0.00
0.10
0.20
0.30
0.40
0.50
0.60
1 2 3 4 5PARCC Scores
2015 2016 2017


Appendix A
The charts below compare students’ proficiency rates within each grade-level subject both (1) over time,1 and (2) across different school districts. Note that Montgomery County is shown in the left most position and the seven main comparison school districts are: Prince George’s County; Baltimore County; Anne Arundel County; Howard County; Washington D.C.; Jefferson County (Colorado); and Cherry Creek (Colorado).2
Each graph presents one subject and a single grade level (except for Algebra). The horizontal axis of each graph provides both information about the school district and the year of PARCC scores. Each school district is represented by a single color on the graph—where the leftmost bar represents the district’s PARCC scores in the 2014-2015 school year (labeled 2015 at the bottom of the graph); the middle most bar represents the school district’s PARCC scores from the 2015-2016 school year (labeled 2016 at the bottom of the graph); and the right most bar for the school district represents the PARCC scores from the 2016-2017 school year (labeled 2017 at the bottom of the graph). The vertical axis measures the percentage of students that earned a score of either 4 or 5 on the PARCC exam.
The graphs are presented in the following order:
Student Group
Pages
All Students 2-14 White Students 15-27 African American Students 28-40 Hispanic Students 41-53 Students with limited English proficiency 54-66 Students that qualify for free-and-reduced meals 67-79
1 by comparing each school district’s PARCC scores from the 2014-2015, 2015-2016, and 2016-2017 school years. 2 The process for choosing comparison districts is described in Appendix B. Note, however, that the City of Denver is used as a comparison across white, African American, and Hispanic groups because the city has similar percentages of these groups of students as Montgomery County. Denver is not compared to Montgomery County more generally, due to urban\suburban differences and differences in poverty rates.

Special Education Students 80-92
Notes: The following school districts generally perform worse than Montgomery County across all three years: Prince George’s County; Baltimore County; Washington D.C.; and Jefferson County (although both Baltimore County’s and Jefferson County’s proficiency rates are higher in 2015).
The following school districts generally perform better than Montgomery County across all three years: Anne Arundel County; Howard County; and Cherry Creek.
0.410.45
0.47
0.210.23
0.25
0.42
0.36 0.38
0.560.54
0.56
0.490.51
0.56
0.25 0.260.28
0.44 0.420.45
0.48 0.49 0.50
0.00
0.10
0.20
0.30
0.40
0.50
0.60
0.70
0.80
2015 2016 2017 2015 2016 2017 2015 2016 2017 2015 2016 2017 2015 2016 2017 2015 2016 2017 2015 2016 2017 2015 2016 2017
All Students: 3rd Grade ELA

Notes: The following school districts generally perform worse than Montgomery County across all three years: Prince George’s County; Baltimore County; Anne Arundel County; Washington D.C.; and Jefferson County.
The following school districts generally perform better than Montgomery County across all three years: Howard County and Cherry Creek.
0.470.50
0.52
0.23 0.240.26
0.47
0.370.40
0.46 0.450.48
0.56 0.570.59
0.23
0.29
0.32
0.50 0.500.52
0.550.58
0.55
0.00
0.10
0.20
0.30
0.40
0.50
0.60
0.70
0.80
2015 2016 2017 2015 2016 2017 2015 2016 2017 2015 2016 2017 2015 2016 2017 2015 2016 2017 2015 2016 2017 2015 2016 2017
All Students: 4th Grade ELA

Notes: The following school districts generally perform worse than Montgomery County across all three years: Prince George’s County; Baltimore County; and Washington D.C..
Note that Anne Arundel County’s proficiency rate is higher in 2015; the same in 2016; and worse in 2017 than Montgomery County’s proficiency rates. Jefferson County’s proficiency rate is higher in 2015; lower in 2016; and the same in 2017 as Montgomery County’s proficiency rates.
The following school districts generally perform better than Montgomery County across all three years: Howard County and Cherry Creek.
0.480.50 0.52
0.24 0.230.27
0.46
0.38 0.39
0.49 0.500.47
0.570.53
0.56
0.260.29
0.34
0.49 0.47
0.52 0.520.54
0.58
0.00
0.10
0.20
0.30
0.40
0.50
0.60
0.70
0.80
2015 2016 2017 2015 2016 2017 2015 2016 2017 2015 2016 2017 2015 2016 2017 2015 2016 2017 2015 2016 2017 2015 2016 2017
All Students: 5th Grade ELA

Notes: The following school districts generally perform worse than Montgomery County across all three years: Prince George’s County; Baltimore County; Anne Arundel County; Washington D.C.; and Cherry Creek (although Cherry Creek’s proficiency rate is higher in 2015).
The following school districts generally perform better than Montgomery County across all three years: Howard County and Jefferson County.
0.41
0.46 0.47
0.260.28 0.27
0.39
0.33 0.34
0.39 0.39
0.440.46
0.53 0.53
0.230.26
0.29
0.520.49
0.52
0.45 0.45 0.46
0.00
0.10
0.20
0.30
0.40
0.50
0.60
0.70
0.80
2015 2016 2017 2015 2016 2017 2015 2016 2017 2015 2016 2017 2015 2016 2017 2015 2016 2017 2015 2016 2017 2015 2016 2017
All Students: 6th Grade ELA

Notes: The following school districts generally perform worse than Montgomery County across all three years: Prince George’s County; Baltimore County; Anne Arundel County; and Washington D.C..
Note that both Jefferson County’s and Cherry Creek’s proficiency rates are the same in 2015; higher in 2016; and lower in 2017 than Montgomery County’s proficiency rates.
The following school district generally performs better than Montgomery County across all three years: Howard County.
0.49
0.44
0.53
0.28
0.32 0.31
0.40
0.33 0.35
0.430.45 0.46
0.500.54
0.59
0.240.27
0.32
0.49 0.480.51
0.490.51 0.52
0.00
0.10
0.20
0.30
0.40
0.50
0.60
0.70
0.80
2015 2016 2017 2015 2016 2017 2015 2016 2017 2015 2016 2017 2015 2016 2017 2015 2016 2017 2015 2016 2017 2015 2016 2017
All Students: 7th Grade ELA

Notes: The following school districts generally perform worse than Montgomery County across all three years: Prince George’s County; Baltimore County; Anne Arundel County; and Washington D.C..
Note that Jefferson County’s proficiency rate is lower in 2015 and 2016, but higher in 2017 than Montgomery County’s proficiency rates. Further, Cherry Creek’s proficiency rate is the same in 2015, but higher in 2016 and 2017 than Montgomery County’s proficiency rates.
The following school district generally performs better than Montgomery County across all three years: Howard County.
0.510.48 0.48
0.28 0.29 0.29
0.41
0.32 0.32
0.50
0.410.43
0.53 0.54 0.54
0.260.29 0.30
0.48 0.46
0.51 0.510.49 0.50
0.00
0.10
0.20
0.30
0.40
0.50
0.60
0.70
0.80
2015 2016 2017 2015 2016 2017 2015 2016 2017 2015 2016 2017 2015 2016 2017 2015 2016 2017 2015 2016 2017 2015 2016 2017
All Students: 8th Grade ELA

Notes: The following school districts generally perform worse than Montgomery County across all three years: Prince George’s County; Baltimore County; Anne Arundel County; Washington D.C.; and Jefferson County.
Note Cherry Creek’s proficiency rate is higher in 2015; lower in 2016; and the same in 2017 as Montgomery County’s proficiency rates.
The following school district generally performs better than Montgomery County across all three years: Howard County
0.43
0.54 0.54
0.19
0.25 0.25
0.32
0.46
0.42
0.470.49
0.45
0.53
0.60 0.60
0.30
0.370.39
0.430.45
0.470.49
0.53 0.54
0.00
0.10
0.20
0.30
0.40
0.50
0.60
0.70
0.80
2015 2016 2017 2015 2016 2017 2015 2016 2017 2015 2016 2017 2015 2016 2017 2015 2016 2017 2015 2016 2017 2015 2016 2017
All Students: 3rd Grade Math

Notes: The following school districts generally perform worse than Montgomery County across all three years: Prince George’s County; Baltimore County; Anne Arundel County; Washington D.C.; Jefferson County; and Cherry Creek (although both Anne Arundel County and Cherry Creek had higher proficiency rates in 2015 than Montgomery County).
The following school district generally performs better than Montgomery County across all three years: Howard County
0.38
0.49 0.48
0.150.17
0.20
0.24
0.36 0.360.39
0.42 0.41
0.50
0.570.56
0.280.32 0.32
0.360.39 0.40 0.41
0.45 0.44
0.00
0.10
0.20
0.30
0.40
0.50
0.60
0.70
0.80
2015 2016 2017 2015 2016 2017 2015 2016 2017 2015 2016 2017 2015 2016 2017 2015 2016 2017 2015 2016 2017 2015 2016 2017
All Students: 4th Grade Math

Notes: The following school districts generally perform worse than Montgomery County across all three years: Prince George’s County; Baltimore County; Anne Arundel County; Washington D.C.; and Jefferson County.
Note Cherry Creek’s proficiency rate is higher in 2015 and 2016, but the same in 2017 as Montgomery County’s proficiency rates.
The following school district generally performs better than Montgomery County across all three years: Howard County
0.37
0.45 0.45
0.150.18
0.16
0.24
0.360.33
0.37
0.44
0.38
0.48
0.54 0.53
0.25
0.30 0.30
0.38
0.420.41 0.39
0.470.45
0.00
0.10
0.20
0.30
0.40
0.50
0.60
0.70
0.80
2015 2016 2017 2015 2016 2017 2015 2016 2017 2015 2016 2017 2015 2016 2017 2015 2016 2017 2015 2016 2017 2015 2016 2017
All Students: 5th Grade Math

Notes: The following school districts generally perform worse than Montgomery County across all three years: Prince George’s County; Baltimore County; Anne Arundel County; and Washington D.C..
Note that both Jefferson County’s and Cherry Creek’s proficiency rates are higher in 2015; lower in 2016; and the same in 2017 as Montgomery County’s proficiency rates.
The following school district generally performs better than Montgomery County across all three years: Howard County.
0.38
0.430.41
0.130.17 0.16
0.24 0.25 0.25
0.330.36
0.39
0.46
0.530.51
0.20 0.210.23
0.42 0.41 0.41 0.420.38
0.41
0.00
0.10
0.20
0.30
0.40
0.50
0.60
0.70
0.80
2015 2016 2017 2015 2016 2017 2015 2016 2017 2015 2016 2017 2015 2016 2017 2015 2016 2017 2015 2016 2017 2015 2016 2017
All Students: 6th Grade Math

Notes: The following school districts generally perform worse than Montgomery County across all three years: Prince George’s County; Baltimore County; Howard County; and Washington D.C..
The following school districts generally perform better than Montgomery County across all three years: Anne Arundel County; Jefferson County; and Cherry Creek.
0.24
0.32 0.31
0.13
0.04
0.13
0.09 0.09 0.09
0.300.33 0.34
0.220.25
0.28
0.140.17
0.20
0.330.35
0.33
0.40 0.400.37
0.00
0.10
0.20
0.30
0.40
0.50
0.60
0.70
0.80
2015 2016 2017 2015 2016 2017 2015 2016 2017 2015 2016 2017 2015 2016 2017 2015 2016 2017 2015 2016 2017 2015 2016 2017
All Students: 7th Grade Math
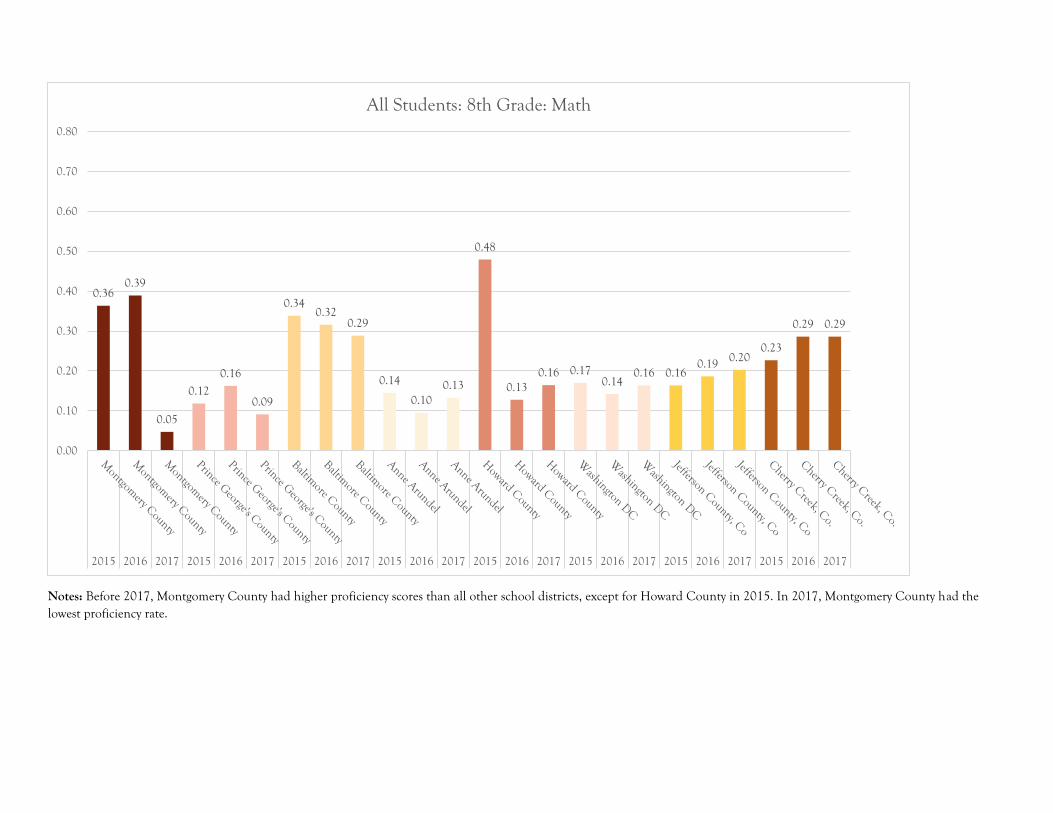
Notes: Before 2017, Montgomery County had higher proficiency scores than all other school districts, except for Howard County in 2015. In 2017, Montgomery County had the lowest proficiency rate.
0.360.39
0.05
0.12
0.16
0.09
0.340.32
0.29
0.14
0.100.13
0.48
0.130.16 0.17
0.140.16 0.16
0.19 0.200.23
0.29 0.29
0.00
0.10
0.20
0.30
0.40
0.50
0.60
0.70
0.80
2015 2016 2017 2015 2016 2017 2015 2016 2017 2015 2016 2017 2015 2016 2017 2015 2016 2017 2015 2016 2017 2015 2016 2017
All Students: 8th Grade: Math

Notes: The following school districts generally perform worse than Montgomery County across all three years: Prince George’s County; Baltimore County; Washington D.C.; and Jefferson County (although Jefferson County had a higher proficiency rate in 2015 than Montgomery County).
Note that Anne Arundel County’s proficiency rate is the same in 2015 and 2016, but higher in 2017 than Montgomery County’s proficiency rates. Further, Cherry Creek’s proficiency rate is the same in 2015, but higher in 2016 and 2017 than Montgomery County’s proficiency rates.
The following school districts generally perform better than Montgomery County across all three years: Howard County and Cherry Creek.
0.39
0.44 0.43
0.15 0.16 0.16
0.230.24 0.24
0.39
0.44 0.440.46
0.57
0.63
0.29
0.38 0.400.41 0.40
0.420.45
0.500.48
0.00
0.10
0.20
0.30
0.40
0.50
0.60
0.70
0.80
2015 2016 2017 2015 2016 2017 2015 2016 2017 2015 2016 2017 2015 2016 2017 2015 2016 2017 2015 2016 2017 2015 2016 2017
All Students: Algebra

0.60
0.63
0.68
0.53
0.480.50
0.560.58
0.65
0.60
0.00
0.10
0.20
0.30
0.40
0.50
0.60
0.70
0.80
2015 2016 2017 2015 2016 2017 2015 2016 2017 2015
White Students 3rd Grade ELA
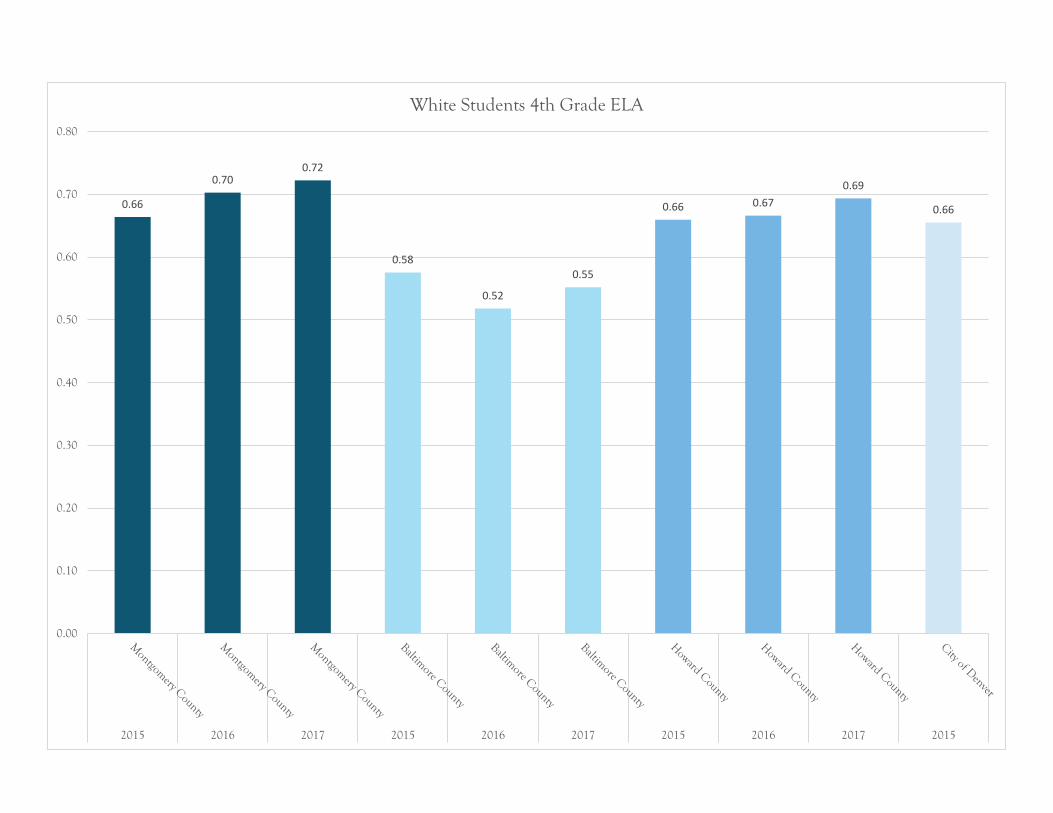
0.66
0.700.72
0.58
0.52
0.55
0.66 0.67
0.69
0.66
0.00
0.10
0.20
0.30
0.40
0.50
0.60
0.70
0.80
2015 2016 2017 2015 2016 2017 2015 2016 2017 2015
White Students 4th Grade ELA

0.69 0.680.70
0.57
0.50
0.53
0.640.62
0.650.67
0.00
0.10
0.20
0.30
0.40
0.50
0.60
0.70
0.80
2015 2016 2017 2015 2016 2017 2015 2016 2017 2015
White Students 5th Grade ELA

0.59
0.66
0.64
0.51
0.430.45
0.53
0.620.64
0.69
0.00
0.10
0.20
0.30
0.40
0.50
0.60
0.70
0.80
2015 2016 2017 2015 2016 2017 2015 2016 2017 2015
White Students 6th Grade ELA

0.69
0.62
0.74
0.53
0.44
0.48
0.59
0.62
0.69
0.75
0.00
0.10
0.20
0.30
0.40
0.50
0.60
0.70
0.80
2015 2016 2017 2015 2016 2017 2015 2016 2017 2015
White Students 7th Grade ELA

0.680.65 0.66
0.53
0.42 0.43
0.60
0.63 0.64
0.72
0.00
0.10
0.20
0.30
0.40
0.50
0.60
0.70
0.80
2015 2016 2017 2015 2016 2017 2015 2016 2017 2015
White Students 8th Grade ELA
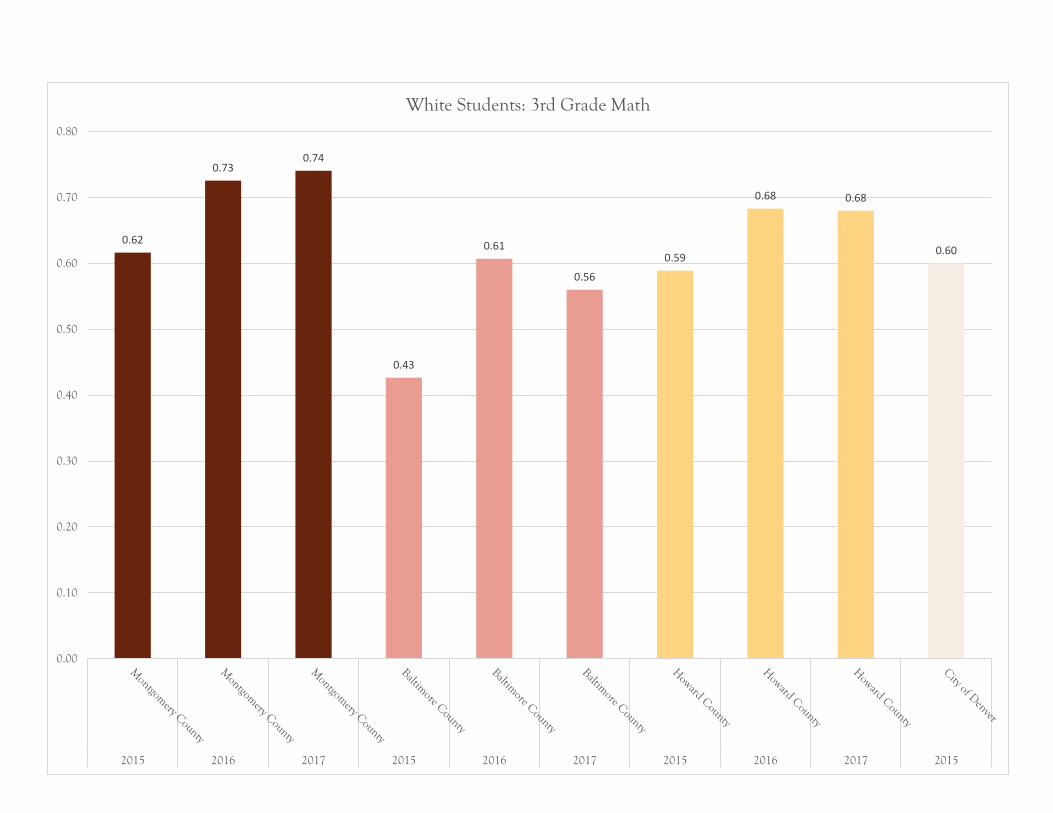
0.62
0.730.74
0.43
0.61
0.56
0.59
0.68 0.68
0.60
0.00
0.10
0.20
0.30
0.40
0.50
0.60
0.70
0.80
2015 2016 2017 2015 2016 2017 2015 2016 2017 2015
White Students: 3rd Grade Math

0.56
0.69 0.68
0.33
0.500.51
0.58
0.660.65
0.54
0.00
0.10
0.20
0.30
0.40
0.50
0.60
0.70
0.80
2015 2016 2017 2015 2016 2017 2015 2016 2017 2015
White Students: 4th Grade Math

0.52
0.630.65
0.35
0.48 0.48
0.54
0.64
0.600.58
0.00
0.10
0.20
0.30
0.40
0.50
0.60
0.70
0.80
2015 2016 2017 2015 2016 2017 2015 2016 2017 2015
White Students: 5th Grade Math

0.56
0.64
0.61
0.360.37 0.38
0.53
0.62 0.620.64
0.00
0.10
0.20
0.30
0.40
0.50
0.60
0.70
0.80
2015 2016 2017 2015 2016 2017 2015 2016 2017 2015
White Students: 6th Grade Math

0.00 0.00 0.00
0.140.16 0.16
0.00
0.33
0.00
0.62
0.00
0.10
0.20
0.30
0.40
0.50
0.60
0.70
0.80
2015 2016 2017 2015 2016 2017 2015 2016 2017 2015
White Students: 7th Grade Math
Please note that the percentage of white students that earned a level 5 Montgomery County in 2015-2017 and Howard County in 2015 and 2017 are not publically available. We could therefore not calculate the percentage of students who are proficient in these school distiricts in these years.

0.62
0.57
0.12
0.51 0.50
0.44
0.60
0.19
0.27
0.59
0.00
0.10
0.20
0.30
0.40
0.50
0.60
0.70
0.80
2015 2016 2017 2015 2016 2017 2015 2016 2017 2015
White Students: 8th Grade Math

0.00 0.00
0.69
0.350.37
0.40
0.00 0.00
0.77
0.39
0.00
0.10
0.20
0.30
0.40
0.50
0.60
0.70
0.80
0.90
2015 2016 2017 2015 2016 2017 2015 2016 2017 2015
White Students Algebra

0.26
0.320.34
0.38
0.34
0.38
0.31
0.350.37
0.17
0.31
0.00
0.10
0.20
0.30
0.40
0.50
0.60
0.70
0.80
2015 2016 2017 2015 2016 2017 2015 2016 2017 2015 2015
African American Students: 3rd Grade ELA

0.30
0.36
0.39
0.300.32 0.33
0.35
0.39 0.39
0.20
0.37
0.00
0.10
0.20
0.30
0.40
0.50
0.60
0.70
0.80
2015 2016 2017 2015 2016 2017 2015 2016 2017 2015 2015
African American Students: 4th Grade ELA

0.31
0.34
0.38
0.300.28
0.32
0.350.33
0.36
0.25
0.31
0.00
0.10
0.20
0.30
0.40
0.50
0.60
0.70
0.80
2015 2016 2017 2015 2016 2017 2015 2016 2017 2015 2015
African American Students: 5th Grade ELA

0.23
0.280.29
0.19
0.210.24 0.23
0.28 0.29
0.22
0.28
0.00
0.10
0.20
0.30
0.40
0.50
0.60
0.70
0.80
2015 2016 2017 2015 2016 2017 2015 2016 2017 2015 2015
African American Students: 6th Grade ELA

0.29
0.26
0.35
0.22
0.26 0.27 0.27
0.32 0.31
0.24
0.32
0.00
0.10
0.20
0.30
0.40
0.50
0.60
0.70
0.80
2015 2016 2017 2015 2016 2017 2015 2016 2017 2015 2015
African American Students: 7th Grade ELA

0.310.30
0.310.30
0.23 0.22
0.30
0.33
0.29
0.26
0.31
0.00
0.10
0.20
0.30
0.40
0.50
0.60
0.70
0.80
2015 2016 2017 2015 2016 2017 2015 2016 2017 2015 2015
African American Students: 8th Grade ELA

0.26
0.390.38
0.280.29
0.24
0.30
0.41
0.37
0.16
0.29
0.00
0.10
0.20
0.30
0.40
0.50
0.60
0.70
0.80
2015 2016 2017 2015 2016 2017 2015 2016 2017 2015 2015
African American Students: 3rd Grade Math

0.19
0.31 0.31
0.16
0.230.20
0.24
0.35
0.31
0.12
0.18
0.00
0.10
0.20
0.30
0.40
0.50
0.60
0.70
0.80
2015 2016 2017 2015 2016 2017 2015 2016 2017 2015 2015
African American Students: 4th Grade Math

0.17
0.250.28
0.18
0.210.19
0.21
0.28 0.28
0.14
0.18
0.00
0.10
0.20
0.30
0.40
0.50
0.60
0.70
0.80
2015 2016 2017 2015 2016 2017 2015 2016 2017 2015 2015
African American Students: 5th Grade Math

0.180.20 0.19
0.110.14
0.17
0.20
0.250.23
0.14
0.21
0.00
0.10
0.20
0.30
0.40
0.50
0.60
0.70
0.80
2015 2016 2017 2015 2016 2017 2015 2016 2017 2015 2015
African American Students: 6th Grade Math

0.08
0.15 0.15
0.110.12 0.13
0.100.11 0.12
0.13
0.21
0.00
0.10
0.20
0.30
0.40
0.50
0.60
0.70
0.80
2015 2016 2017 2015 2016 2017 2015 2016 2017 2015 2015
African American Students: 7th Grade Math

0.16 0.17
0.02
0.08
0.05 0.06
0.18
0.06 0.05
0.15
0.11
0.00
0.10
0.20
0.30
0.40
0.50
0.60
0.70
0.80
2015 2016 2017 2015 2016 2017 2015 2016 2017 2015 2015
African American Students: 8th Grade Math

0.17
0.250.23
0.14
0.22
0.180.20
0.31
0.36
0.07
0.27
0.00
0.10
0.20
0.30
0.40
0.50
0.60
0.70
0.80
2015 2016 2017 2015 2016 2017 2015 2016 2017 2015 2015
African American Students: Algebra

0.19
0.220.25
0.11
0.16 0.160.18
0.25
0.00
0.10
0.20
0.30
0.40
0.50
0.60
0.70
0.80
2015 2016 2017 2015 2016 2017 2015 2015
Hispanic Students: 3rd Grade ELA

0.23
0.270.29
0.16 0.15
0.19 0.19
0.30
0.00
0.10
0.20
0.30
0.40
0.50
0.60
0.70
0.80
2015 2016 2017 2015 2016 2017 2015 2015
Hispanic Students: 4th Grade ELA

0.24
0.28 0.29
0.20
0.170.18
0.20
0.29
0.00
0.10
0.20
0.30
0.40
0.50
0.60
0.70
0.80
2015 2016 2017 2015 2016 2017 2015 2015
Hispanic Students: 5th Grade ELA

0.19
0.220.24
0.22 0.22 0.22 0.22
0.34
0.00
0.10
0.20
0.30
0.40
0.50
0.60
0.70
0.80
2015 2016 2017 2015 2016 2017 2015 2015
Hispanic Students: 6th Grade ELA

0.25
0.22
0.29
0.23
0.270.25 0.24
0.29
0.00
0.10
0.20
0.30
0.40
0.50
0.60
0.70
0.80
2015 2016 2017 2015 2016 2017 2015 2015
Hispanic Students: 7th Grade ELA

0.28
0.25 0.250.23 0.24
0.230.25
0.28
0.00
0.10
0.20
0.30
0.40
0.50
0.60
0.70
0.80
2015 2016 2017 2015 2016 2017 2015 2015
Hispanic Students: 8th Grade ELA

0.21
0.320.33
0.13
0.210.19
0.18
0.25
0.00
0.10
0.20
0.30
0.40
0.50
0.60
0.70
0.80
2015 2016 2017 2015 2016 2017 2015 2015
Hispanic Students: 3rd Grade Math

0.15
0.26 0.26
0.110.13
0.17
0.14
0.18
0.00
0.10
0.20
0.30
0.40
0.50
0.60
0.70
0.80
2015 2016 2017 2015 2016 2017 2015 2015
Hispanic Students: 4th Grade Math

0.15
0.220.24
0.11
0.14
0.11
0.15
0.19
0.00
0.10
0.20
0.30
0.40
0.50
0.60
0.70
0.80
2015 2016 2017 2015 2016 2017 2015 2015
Hispanic Students: 5th Grade Math

0.15
0.17 0.17
0.120.14
0.13
0.17
0.23
0.00
0.10
0.20
0.30
0.40
0.50
0.60
0.70
0.80
2015 2016 2017 2015 2016 2017 2015 2015
Hispanic Students: 6th Grade Math

0.09
0.13 0.14
0.11
0.04
0.10
0.160.18
0.00
0.10
0.20
0.30
0.40
0.50
0.60
0.70
0.80
2015 2016 2017 2015 2016 2017 2015 2015
Hispanic Students: 7th Grade Math

0.13 0.14
0.03
0.10
0.15
0.08
0.18
0.07
0.00
0.10
0.20
0.30
0.40
0.50
0.60
0.70
0.80
2015 2016 2017 2015 2016 2017 2015 2015
Hispanic Students: 8th Grade Math

0.170.19
0.18
0.090.10
0.12 0.13
0.20
0.00
0.10
0.20
0.30
0.40
0.50
0.60
0.70
0.80
2015 2016 2017 2015 2016 2017 2015 2015
Hispanic Students: Algebra

0.060.07 0.07
0.03
0.070.05
0.150.17
0.00
0.10
0.20
0.30
0.40
0.50
0.60
0.70
0.80
2015 2016 2017 2015 2016 2017 2015 2015
Students with Limited English Proficiency: 3rd Grade ELA

0.03 0.04 0.04
0.010.03 0.02
0.13 0.13
0.00
0.10
0.20
0.30
0.40
0.50
0.60
0.70
0.80
2015 2016 2017 2015 2016 2017 2015 2015
Students with Limited English Proficiency: 4th Grade ELA

0.030.06
0.020.01
0.030.01
0.07 0.07
0.00
0.10
0.20
0.30
0.40
0.50
0.60
0.70
0.80
2015 2016 2017 2015 2016 2017 2015 2015
Students with Limited English Proficiency: 5th Grade ELA

0.02 0.03 0.02 0.010.02 0.01
0.03
0.07
0.00
0.10
0.20
0.30
0.40
0.50
0.60
0.70
0.80
2015 2016 2017 2015 2016 2017 2015 2015
Students with Limited English Proficiency: 6th Grade ELA

0.02 0.020.03
0.01 0.02 0.02
0.05 0.05
0.00
0.10
0.20
0.30
0.40
0.50
0.60
0.70
0.80
2015 2016 2017 2015 2016 2017 2015 2015
Students with Limited English Proficiency: 7th Grade ELA

0.02 0.02 0.02 0.02 0.02 0.010.03 0.04
0.00
0.10
0.20
0.30
0.40
0.50
0.60
0.70
0.80
2015 2016 2017 2015 2016 2017 2015 2015
Students with Limited English Proficiency: 8th Grade ELA
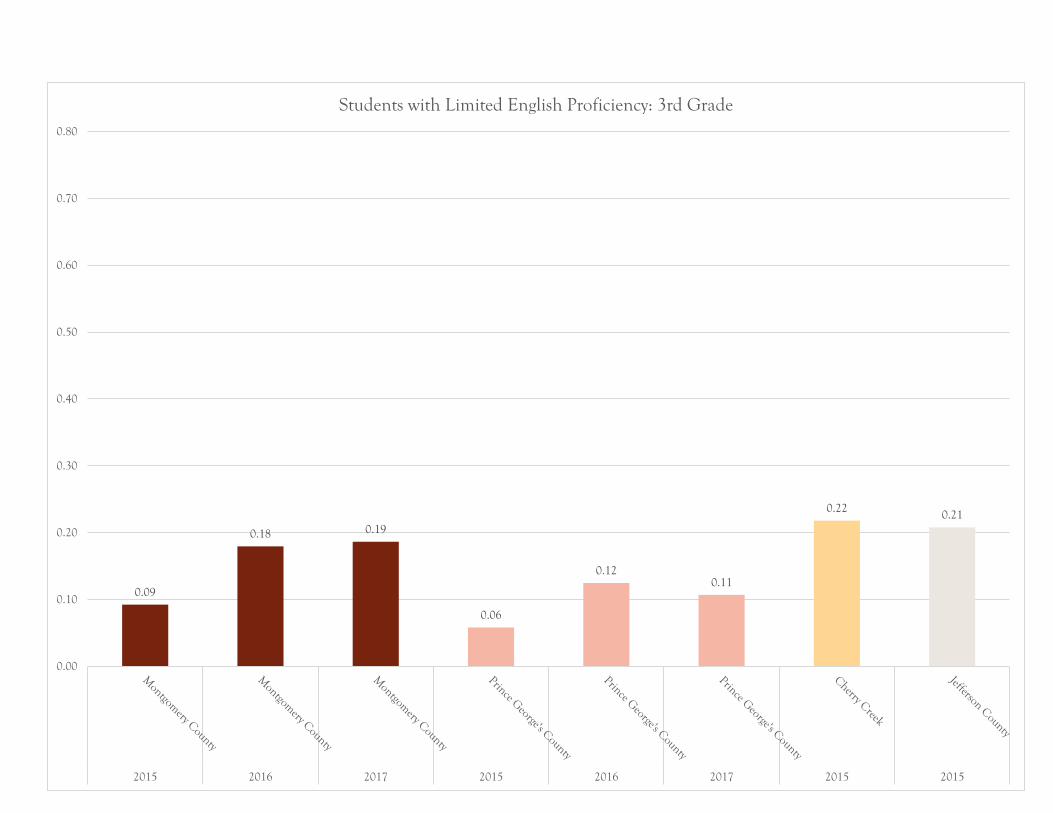
0.09
0.18 0.19
0.06
0.120.11
0.22 0.21
0.00
0.10
0.20
0.30
0.40
0.50
0.60
0.70
0.80
2015 2016 2017 2015 2016 2017 2015 2015
Students with Limited English Proficiency: 3rd Grade

0.06
0.090.07
0.020.03 0.03
0.080.10
0.00
0.10
0.20
0.30
0.40
0.50
0.60
0.70
0.80
2015 2016 2017 2015 2016 2017 2015 2015
Students with Limited English Proficiency: 4th Grade

0.080.10
0.04
0.01 0.02 0.01
0.090.07
0.00
0.10
0.20
0.30
0.40
0.50
0.60
0.70
0.80
2015 2016 2017 2015 2016 2017 2015 2015
Students with Limited English Proficiency: 5th Grade
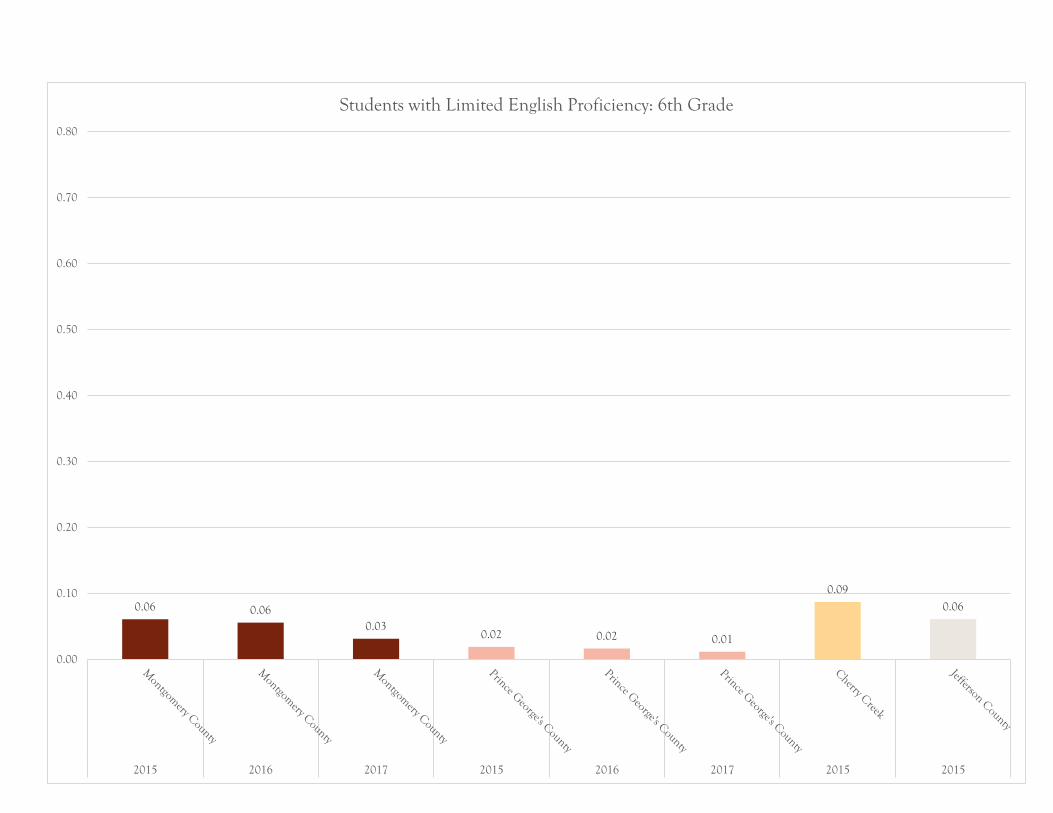
0.06 0.060.03
0.02 0.02 0.01
0.09
0.06
0.00
0.10
0.20
0.30
0.40
0.50
0.60
0.70
0.80
2015 2016 2017 2015 2016 2017 2015 2015
Students with Limited English Proficiency: 6th Grade

0.04 0.05 0.04
0.01 0.01 0.01
0.12
0.03
0.00
0.10
0.20
0.30
0.40
0.50
0.60
0.70
0.80
2015 2016 2017 2015 2016 2017 2015 2015
Students with Limited English Proficiency: 7th Grade

0.02 0.02 0.01 0.01 0.01 0.02
0.050.02
0.00
0.10
0.20
0.30
0.40
0.50
0.60
0.70
0.80
2015 2016 2017 2015 2016 2017 2015 2015
Students with Limited English Proficiency: 8th Grade

0.11 0.110.09
0.03 0.02 0.02
0.11
0.07
0.00
0.10
0.20
0.30
0.40
0.50
0.60
0.70
0.80
2015 2016 2017 2015 2016 2017 2015 2015
Students with Limited English Proficiency: Algebra

0.16
0.200.22
0.350.34 0.33
0.27
0.21 0.22
0.28
0.00
0.10
0.20
0.30
0.40
0.50
0.60
0.70
0.80
Students Qualifying for Free and Reduced Meals: 3rd Grade ELA
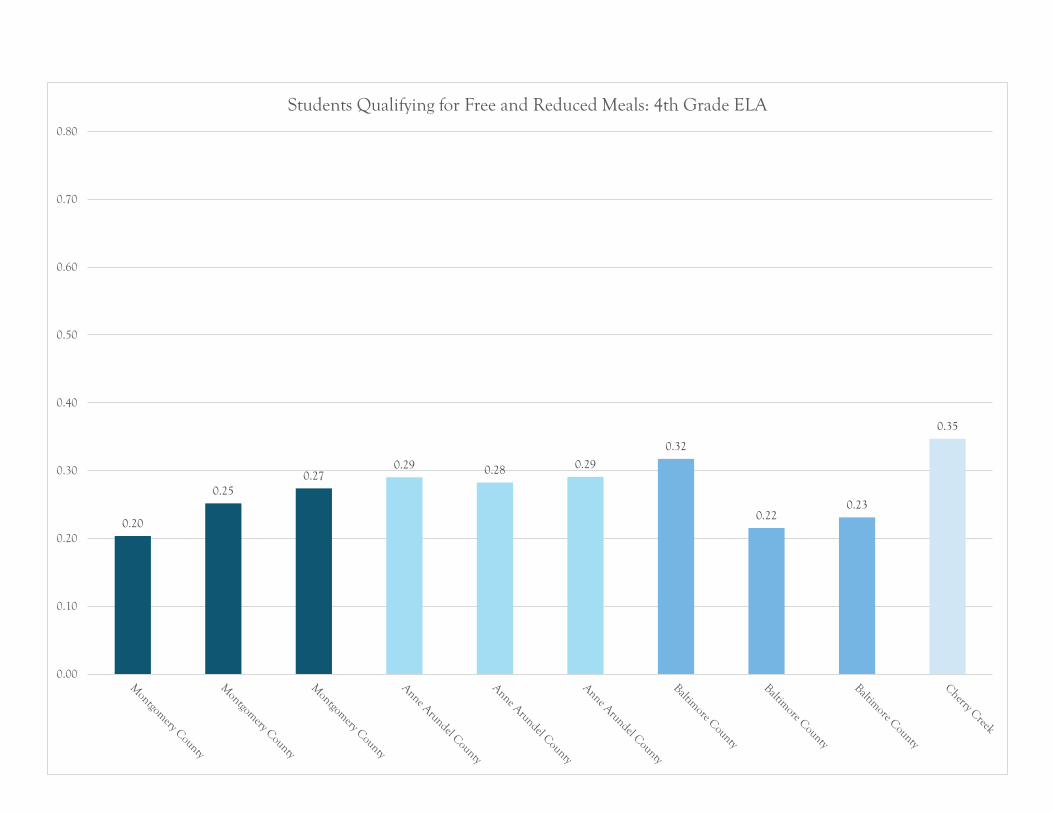
0.20
0.250.27
0.29 0.28 0.29
0.32
0.220.23
0.35
0.00
0.10
0.20
0.30
0.40
0.50
0.60
0.70
0.80
Students Qualifying for Free and Reduced Meals: 4th Grade ELA

0.21
0.260.28 0.27 0.27 0.27
0.29
0.22 0.23
0.29
0.00
0.10
0.20
0.30
0.40
0.50
0.60
0.70
0.80
Students Qualifying for Free and Reduced Meals: 5th Grade ELA

0.16
0.20 0.200.18
0.24
0.210.23
0.19 0.20
0.28
0.00
0.10
0.20
0.30
0.40
0.50
0.60
0.70
0.80
Students Qualifying for Free and Reduced Meals: 6th Grade ELA

0.21
0.18
0.25
0.220.23 0.24
0.22
0.19 0.19
0.31
0.00
0.10
0.20
0.30
0.40
0.50
0.60
0.70
0.80
Students Qualifying for Free and Reduced Meals: 7th Grade ELA

0.23 0.23 0.22
0.28
0.21 0.21
0.25
0.18 0.18
0.32
0.00
0.10
0.20
0.30
0.40
0.50
0.60
0.70
0.80
Students Qualifying for Free and Reduced Meals: 8th Grade ELA

0.18
0.29 0.300.28 0.28
0.22
0.18
0.30
0.25
0.29
0.00
0.10
0.20
0.30
0.40
0.50
0.60
0.70
0.80
2015 2016 2017 2015 2016 2017 2015 2016 2017 2015
Students Qualifying for Free and Reduced Meals: 3rd Grade Math

0.13
0.24 0.24
0.17
0.24
0.20
0.12
0.20 0.20 0.20
0.00
0.10
0.20
0.30
0.40
0.50
0.60
0.70
0.80
2015 2016 2017 2015 2016 2017 2015 2016 2017 2015
Students Qualifying for Free and Reduced Meals: 4th Grade Math
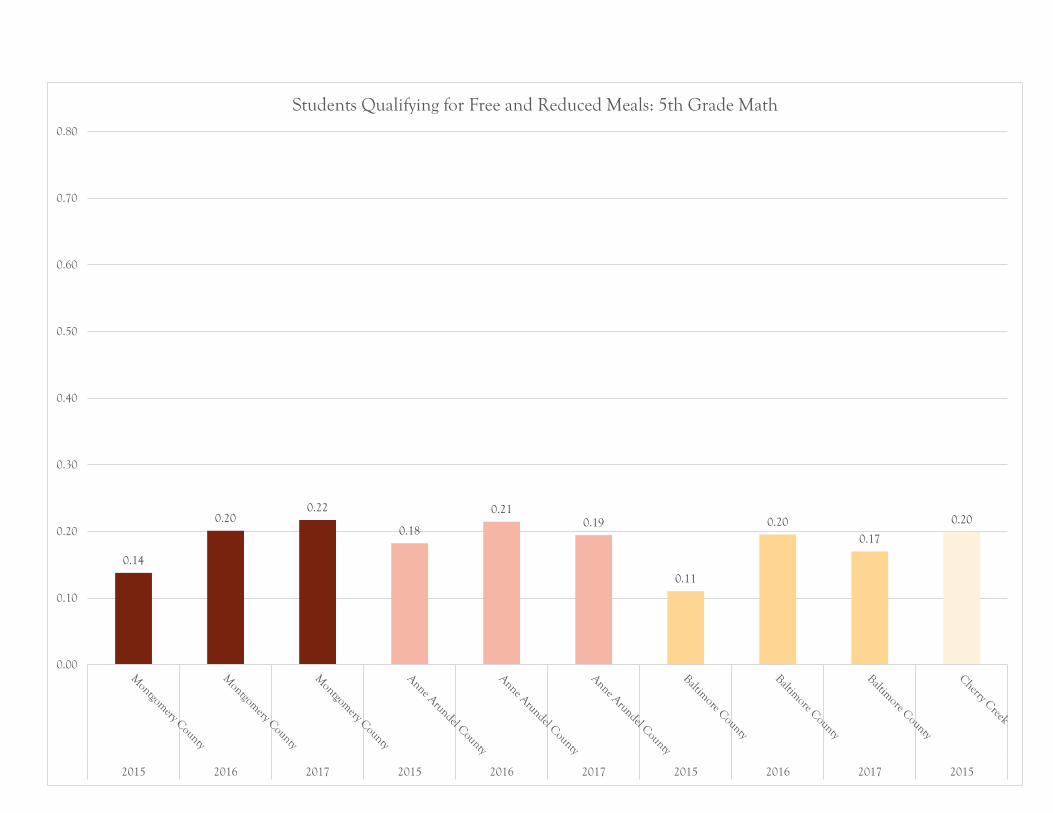
0.14
0.200.22
0.18
0.210.19
0.11
0.200.17
0.20
0.00
0.10
0.20
0.30
0.40
0.50
0.60
0.70
0.80
2015 2016 2017 2015 2016 2017 2015 2016 2017 2015
Students Qualifying for Free and Reduced Meals: 5th Grade Math

0.12
0.16
0.13 0.130.15
0.16
0.100.11 0.11
0.24
0.00
0.10
0.20
0.30
0.40
0.50
0.60
0.70
0.80
2015 2016 2017 2015 2016 2017 2015 2016 2017 2015
Students Qualifying for Free and Reduced Meals: 6th Grade Math
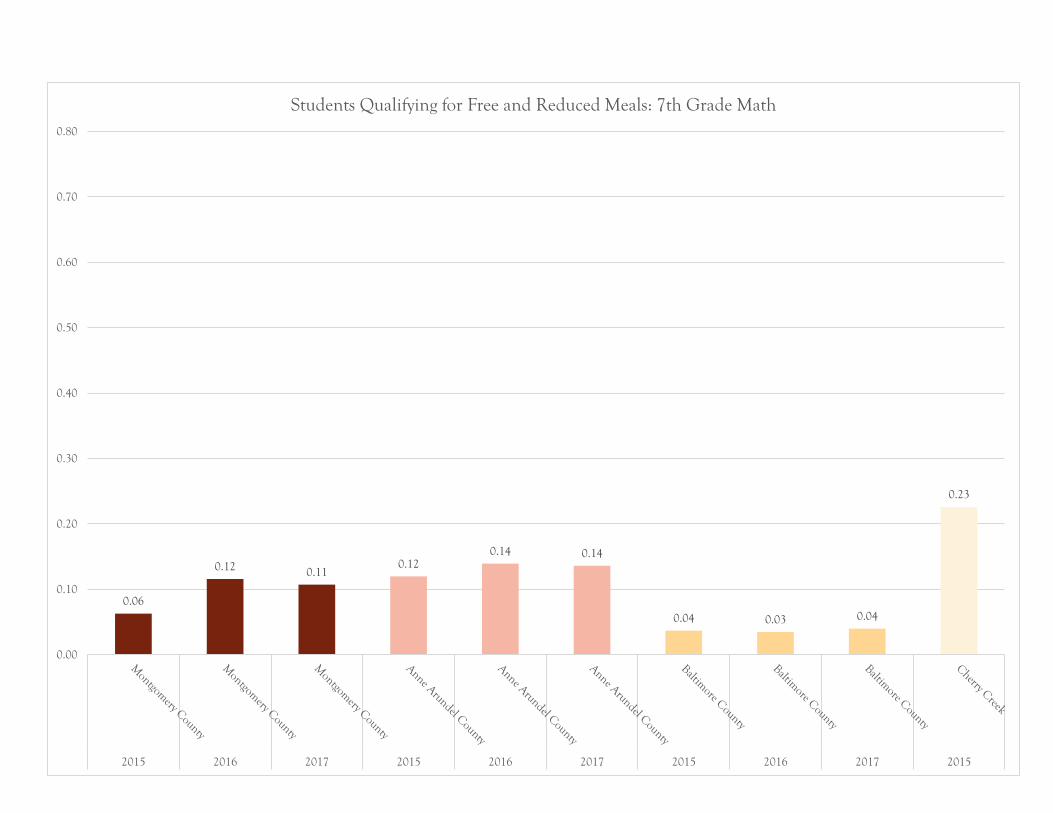
0.06
0.12 0.110.12
0.14 0.14
0.04 0.03 0.04
0.23
0.00
0.10
0.20
0.30
0.40
0.50
0.60
0.70
0.80
2015 2016 2017 2015 2016 2017 2015 2016 2017 2015
Students Qualifying for Free and Reduced Meals: 7th Grade Math

0.11 0.12
0.02
0.080.06 0.07
0.130.12 0.12 0.13
0.00
0.10
0.20
0.30
0.40
0.50
0.60
0.70
0.80
2015 2016 2017 2015 2016 2017 2015 2016 2017 2015
Students Qualifying for Free and Reduced Meals: 8th Grade Math

0.150.18 0.17 0.17
0.22 0.21
0.090.11
0.10
0.28
0.00
0.10
0.20
0.30
0.40
0.50
0.60
0.70
0.80
2015 2016 2017 2015 2016 2017 2015 2016 2017 2015
Students Qualifying for Free and Reduced Meals: Algebra

0.12 0.120.15 0.15
0.170.15
0.12 0.12
0.16
0.00
0.10
0.20
0.30
0.40
0.50
0.60
0.70
0.80
Special Education Students: 3rd Grade ELA
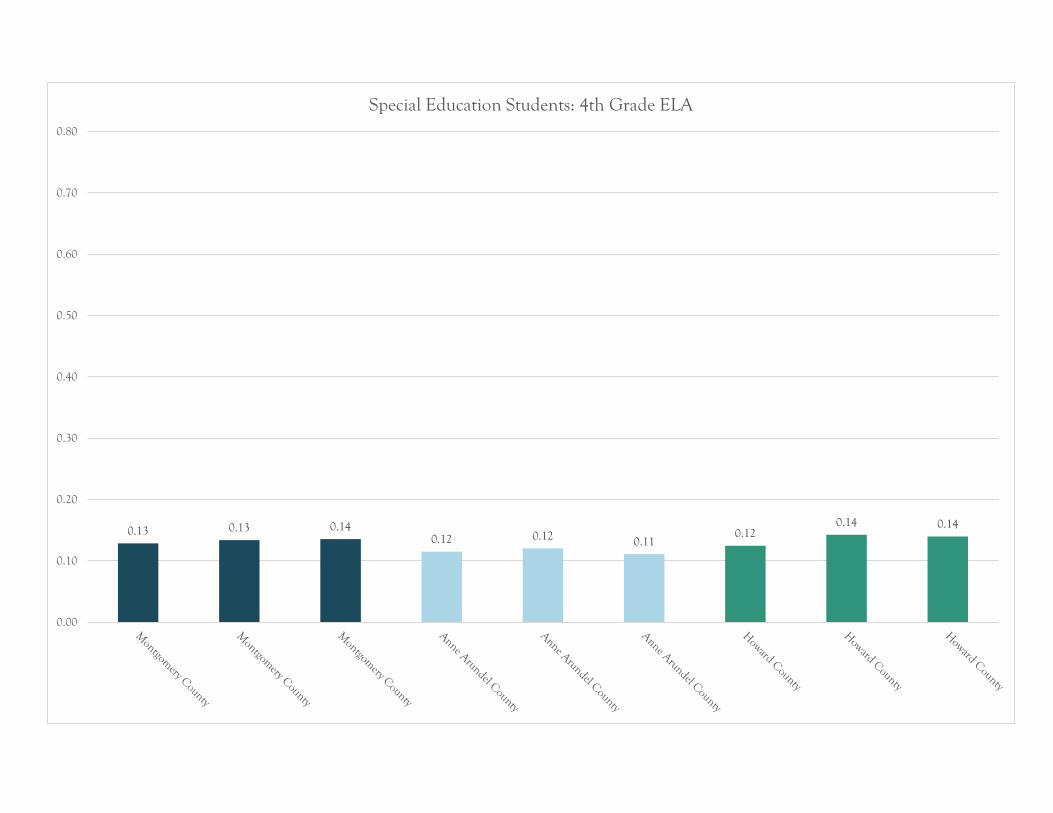
0.13 0.13 0.140.12 0.12 0.11
0.120.14 0.14
0.00
0.10
0.20
0.30
0.40
0.50
0.60
0.70
0.80
Special Education Students: 4th Grade ELA

0.10
0.130.12
0.07
0.110.09 0.09 0.09 0.09
0.00
0.10
0.20
0.30
0.40
0.50
0.60
0.70
0.80
Special Education Students: 5th Grade ELA

0.08 0.09
0.12
0.050.04
0.060.05
0.080.06
0.00
0.10
0.20
0.30
0.40
0.50
0.60
0.70
0.80
Special Education Students: 6th Grade ELA

0.09 0.100.11
0.03
0.060.04
0.05
0.090.12
0.00
0.10
0.20
0.30
0.40
0.50
0.60
0.70
0.80
Special Education Students: 7th Grade ELA

0.09 0.100.11
0.07
0.03 0.04
0.090.08
0.06
0.00
0.10
0.20
0.30
0.40
0.50
0.60
0.70
0.80
Special Education Students: 8th Grade ELA

0.15
0.200.22
0.14
0.170.15
0.14
0.19 0.19
0.00
0.10
0.20
0.30
0.40
0.50
0.60
0.70
0.80
2015 2016 2017 2015 2016 2017 2015 2016 2017
Special Education Students: 3rd Grade Math

0.11
0.15 0.15
0.090.11 0.11 0.10
0.15 0.16
0.00
0.10
0.20
0.30
0.40
0.50
0.60
0.70
0.80
2015 2016 2017 2015 2016 2017 2015 2016 2017
Special Education Students: 4th Grade Math

0.08
0.13 0.13
0.090.11
0.070.09
0.120.10
0.00
0.10
0.20
0.30
0.40
0.50
0.60
0.70
0.80
2015 2016 2017 2015 2016 2017 2015 2016 2017
Special Education Students: 5th Grade Math
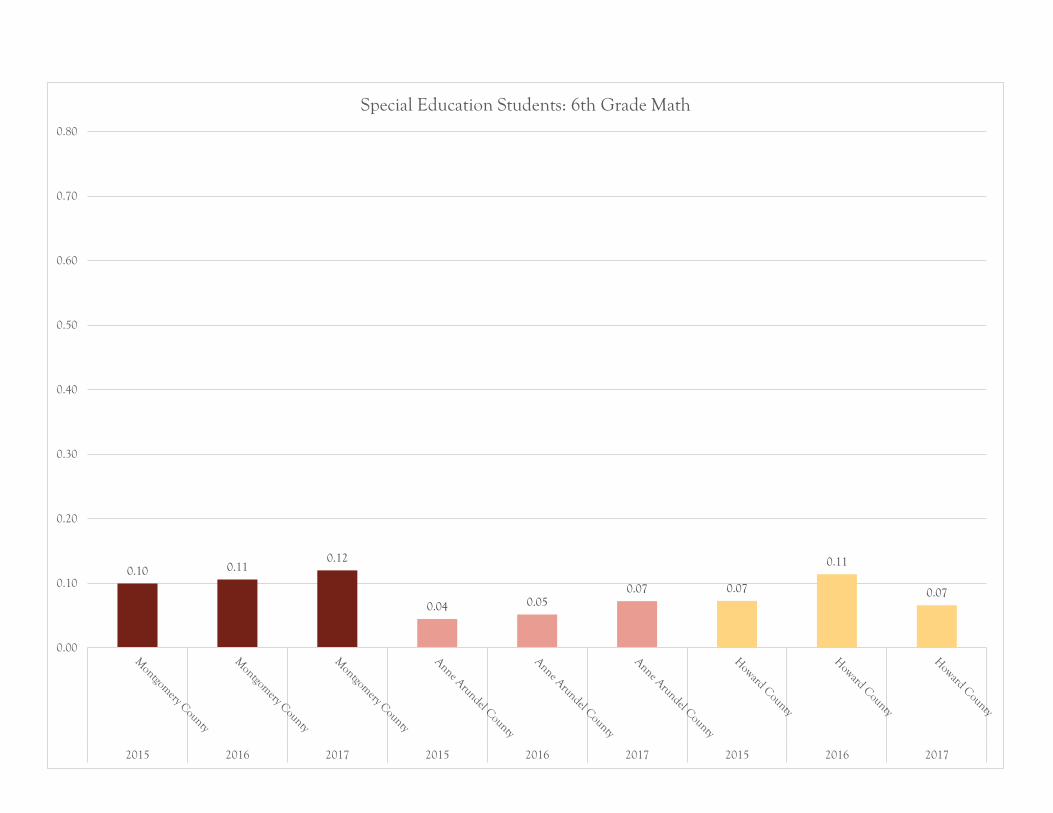
0.10 0.110.12
0.04 0.050.07 0.07
0.11
0.07
0.00
0.10
0.20
0.30
0.40
0.50
0.60
0.70
0.80
2015 2016 2017 2015 2016 2017 2015 2016 2017
Special Education Students: 6th Grade Math

0.06
0.10
0.07
0.030.04 0.04
0.10
0.050.07
0.00
0.10
0.20
0.30
0.40
0.50
0.60
0.70
0.80
2015 2016 2017 2015 2016 2017 2015 2016 2017
Special Education Students: 7th Grade Math

0.05 0.050.03 0.03 0.03 0.03
0.05 0.05 0.05
0.00
0.10
0.20
0.30
0.40
0.50
0.60
0.70
0.80
2015 2016 2017 2015 2016 2017 2015 2016 2017
Special Education Students: 8th Grade Math

0.10
0.150.17
0.040.07
0.08 0.08
0.11
0.15
0.00
0.10
0.20
0.30
0.40
0.50
0.60
0.70
0.80
2015 2016 2017 2015 2016 2017 2015 2016 2017
Special Education Students: Algebra

Appendix B: How Comparison Districts were Chosen
We used a multi-step process to select school districts to compare to Montgomery County Public Schools. Broadly, we wanted to find other school districts with similar enrollment sizes and demographic characteristics to Montgomery County, which could be compared across the same measures. The process we used to identify these schools is described in detail below:
1. We first limited our search of school districts to large school districts by identifying the 100 largest school districts in the United States.3
2. Because we needed to be able to compare student outcomes across the same measures, we next selected large school districts that also participated in PARCC.
3. We next compared demographic characteristics of these school districts to Montgomery County’s characteristics. In addition to enrollment, we looked at: the percentage of white, Hispanic, and black students; the percentage of students designated as having limited English proficiency; the percentage of special education students; the percentage of students who qualify for free or reduced meals; and the poverty rates of 5-17 year olds in the school district.
4. Based on this data, we identified at least two districts that had the most similar demographic composition4 as Montgomery County. These districts are listed below:
White Students District Enrollment District Percentage Youth Poverty Rates (in 2011) Montgomery County 156,380 30% 9% Baltimore County 112,139 40% 7% City of Denver 87,398 21% 27% Howard County 55,638 39% 5%
Black Students District Enrollment District Percentage Youth Poverty Rates (in 2011) Montgomery County 156,380 21% 9% City of Denver 87,398 14% 27% Anne Arundel County 81,000 21% 6%
3 Note that we added Washington D.C. to our list of large school districts, as it is a relatively large, geographically nearby district that uses PARCC and is also rapidly improving. 4 Note that comparisons, particularly with urban areas (which have much higher rates of poverty, are less comparable.

Howard County 55,638 23% 5% Cherry Creek 54,695 11% 9%
Hispanic Students District Enrollment District Percentage Youth Poverty Rates (in 2011) Montgomery County 156,380 29% 9% Prince Georges County 128,937 30% 11% City of Denver 87,398 58% 27% Jefferson County 85,482 25% 10%
ELL Students District Enrollment District Percentage Youth Poverty Rates (in 2011) Montgomery County 156,380 13% 9% Prince Georges County 128,937 16% 11% Jefferson County 85,482 7% 10% Cherry Creek 54,695 8% 9%
Special Education District Enrollment District Percentage Youth Poverty Rates (in 2011) Montgomery County 156,380 6% 9% Anne Arundel County 81,000 10% 6% Howard County 55,638 9% 5%
Free and Reduced Meals District Enrollment District Percentage Youth Poverty Rates (in 2011) Montgomery County 156,380 33% 9%
Baltimore County 112,139 45% 7% Anne Arundel County 81,000 35% 6% Cherry Creek 54,695 29% 9%