Embed Size (px)
Citation preview

Page | 134
CHAPTER 5
SUMMARY AND CONCLUSIONS
This chapter presents conclusion and recommendations drawn from quantitative
analysis. Conclusions are drawn on the basis of literature review and reference available in the
area, as well as statistical analysis .The framework concluded from hypotheses testing, is also
presented in this chapter. Observations and insight of the researcher is duly incorporated in this
chapter. Subsequently recommendations based on the same are listed below. At the end,
unique contributions of the research, managerial implications, limitations of the research and
some future research directions are given.
5.1 Conclusions drawn from study:
The present study utilizes literature review, instrument reliability using Chronbach’s
Alpha, factor analysis, descriptive statistics and inferential statistics to explore the dimension of
Lean manufacturing, its constructs, degree of association among constructs, their role and
relationship with firm performance specially in context to Indian manufacturing industry.
Exhaustive literature review was done through available secondary sources like books, journals,
monographs, reports, magazines, newspapers, online sources. The aim of the literature review is
to understand lean manufacturing, its origin, conceptual development, definition, its present
status and the practices adopted. The various tools or dimensions of lean manufacturing were
studied in detail to assess the dimensions that lead to effective implementation of lean
manufacturing and its relationship with firm performance. Each of the conclusions is discussed
in detail below.
5.1.1 Lean Production: Lean production is a dynamic system that requires fewer resources
(material, labor, overhead) and brings better outputs (quality, variety, cost & safety) to add
value. Most of the works that has been done in lean manufacturing was based on the these
approaches. Lean structure. (Shah & Ward, 2003) framework consists of four “bundles” of
interrelated and internally consistent practices; these are Just-in-Time, Total Quality
Management, Total Preventive Maintenance, and Human Resource Management.

Page | 135
5.1.2 Evolution of “Lean Concept”:
The historical evolution of Lean manufacturing has taken place from TPS. Lean is the
westernization of a Japanese concept that has carried several names. It has variously been
known as the Toyota Production System, JIT (Just in Time), Pull manufacturing, TQM (Total
Quality Management), and by various other names. Each of these names incorporates some
aspects of lean, and vice versa. Lean should not be viewed in the narrow sense as merely a set of
tools, techniques and practices, but rather as a holistic approach that transcends the boundaries
of the shop floor thus affecting apart from the production itself almost to all the operational
aspects, e.g. design, development, quality, maintenance etc., as well as the entire organization
and management of the company and now a step ahead & moved even on the customer choice
of consumption also.
5.1.3 Definitions of Lean Manufacturing:
Numerous definitions have been given on Lean by management gurus, practitioners and
academicians. It can be holistically mentioned as an integrated philosophy as well as a strategic
tool, to gain competitive advantage. Lean manufacturing is viewed as a philosophy(Bhasin &
Burcher, 2006) && as a long term journey, which enhances business performance and is aimed
to harness the human and material resources of an organization, in the most effective way to,
achieve the objectives of the organization on one hand and customer satisfaction on the other
hand.
5.1.4 Lean Production System Guiding Principles
The lean production system guidelines include Just in time (pull production system),
Kanban production system, total quality control, total productive maintenance
(preventive maintenance, corrective maintenance & maintenance prevention), total
employee involvement.
5.1.5 Dimensions of Lean:
Lean manufacturing has been the symbol of efficiency and optimal performance since the
1980’s.It has been shown to outperform the traditional production model of large batches on
several occasions (Boyer, Leong, Ward, & Krajewski, 1997; Nakamura, Sakakibara, & Schroeder,
1998). Key elements of lean approach are Just-in-time, Kanban, setup time reduction, quality
circles, worker empowerment, effective communication, training etc

Page | 136
Table 5.1: Dimensions of Lean
Variables Items
Just in Time
VMI
Pull production system
Kanban
lot size reduction
SMED
High inventory turnover
suppliers manage inventory; pull production is employed at shop floor using visual card; automatic replenishment of raw materials at workstation takes place through pull system; single piece flow; reduction of set up time; reducing inventory to avoid defects and highlights hidden issues which act as a bottleneck in the production system;
Employee Involvement
Quality circle
KAIZEN
Shop floor employees are involved in solving problems Shop floor employees are encouraged to provide their needful suggestion Shop floor employees are key to process improvement activities
Total Productive Maintenance
5S
proper maintenance strict adherence to compliance routine maintenance to avoid breakdown preventive maintenance to improve maintainability and improve service availability
Relationship Management with Partners
CRM
Customers feedbacks are analyzed & used for product offerings, product design & product development.
Human resource functions
HR planning
Recruitment and selection
Training and development
Performance appraisal
Compensation
management
Work and Jobs are carefully designed, organized and managed to provide opportunities for individual initiative and self –directed responsibility Compensation and recognition Employee well-being, satisfaction, and motivation Training programs are designed Formal training programs to teach new hires , for promotion, Everyone is given an opportunity to be trained. Training programs designed as per job requirements & also in order to increase promotability
Total Quality Management
HR focus
Relationship with
partners
Modularity
Reduction in variability
Benchmarking
Product quality
QFD
Empowering shop operators to rectify quality problems Quality is one of the most important criteria for supplier selection & evaluation over price Modularity is emphasized to reduce variability & increase standardization Continuous improvement Using statistical process control to reduce variability and improve product quality translating voice of the customer in product design/new product development..
Some of the important conclusions that can be drawn from the Table 5.1 are:

Page | 137
The role of JIT is an important aspect for successful implementation of Lean. It
includes VMI, pull production system, kanban, lot size reduction, SMED &reducing
inventory to avoid defects and highlights hidden issues.
Employee are empowered to take decisions and encouraged to participate in problem
solving exercise.
Total productive maintenance is about strict compliance, corrective maintenance,
preventive maintenance and self discipline.
The relationship with partners is an important aspect for successful implementation of
Lean. Customers feedbacks are analyzed & used for product offerings, product
design & product development.
Human Resource Functions of an organization has an important role in successful
implementation of lean. It includes the planning function, recruitment and selection,
training and development, performance appraisal, compensation management and
communication.
The role of TQM is to improve product quality by reducing defects and variability by
involving employees, customers and suppliers.TQM is thus regarded as a philosophy
which involves each stakeholders in entire process right from sourcing to final
delivery of product or services so that customers or end users derives maximum
utility from product or services.
5.1.6 Lean Manufacturing and its Impact on firm performance:
The concept of firm performance hasevolved from traditional economic theory with an
emphasis on market power and industry structure as determinants of firm performance
(Chadwick 1999; Chandler, 1994; Knight, 1997; Wiklund, 1999). Earlier, performance
measurement is defined as the process of quantifying effectiveness and efficiency of economic
activities (Neely et al., 1995).
In modern business management, performance measurement assumes a far more significant
role than quantification and accounting (Chan and Qi, 2003). Performance may vary according to
whose viewpoint is taken (e.g., customers or stockholders), the time period observed, criteria
used, and so on. According to Hitt and Ireland (1985) different fields of study should use
different measures of firm performance because of the difference in their research questions.
Page | 138
For measuring a firm’s performance, objective and subjective measures have been used. The
objective measures include measures such as return on investment, operating profit (EBIDTA),
Quality of product & services, Overstock reduction and waste reduction. Similar measures are
used by previous researcher (e.g. Hitt et al., 1982, 1985). Similarly, the subjective measures of
performance include management’s perceptions of productivity, profitability, market share, and
customer satisfaction relative to competitors. The possibility of using subjective performance
measures (the management perceptions) was suggested by Dess and Robinson (1984) if the
accurate objective measures are unavailable. Subjective measures of performance have been
used by several researchers (e.g. Li, 2000, Akimova, 2000).
Many study suggested that lean manufacturing implementation has positive effects on
employee satisfaction. Indeed many industry practitioners believe that implementing lean
manufacturing practices is an effective means of improving product quality, productivity,
profitability, removing waste etc. It is a way of managing to improve not only product quality,
but also the effectiveness, flexibility and competitiveness of a business as a whole. Recent
papers suggest that lean manufacturing implementation leads to quality conformance and
customer satisfaction & increasing profitability & productivity of the organization. Some scholars
also suggested that lean manufacturing implementation has also an impact on customer
satisfaction, product quality; firms’ accounting variables and stock returns have improved due to
adopting lean.
5.1.7 Indian Manufacturing industry:
Most of the large scale manufacturing industry in India has implemented lean
Management System completely or partially in plants. Indian manufacturing companies have
also adopted world class manufacturing practices like
JIT,TQM,TPM,BPR,5S,KAIZEN,GSCM,Benchmarking,Six-Sigma,VMI,CPFR and many more evolving
practices. In one of the interesting work carried out by Chandra and Sastry (2002) has identified
the status of the implementation of the world class manufacturing practices and its limitations,
suggest that there is tremendous scope for further development in Indian manufacturing sector
which has been the major contributor to the Indian GDP during post independence period (IBEF,
2010;Chandra and Sastry,2002).
5.2 Research framework and hypotheses:
Keeping the research objectives in mind a research model is proposed to study the role
of dimensions on successful implementation of Lean manufacturing which will be measured in

Page | 139
terms of financial and non-financial benefits with reference to Indian manufacturing industry in
India, as shown below in Figure 5.1. The main components that constitute the conceptual
framework include the various dimensions for lean implementation which will be measured in
terms of firm performance variables.
Figure 5.1: Research framework
5.3 Conclusion from quantitative analysis:
In order to empirically validate the model quantitative analysis is carried out. Some of the
important conclusions for each of the identified variables are as follows:
Just in Time (JIT): It is regarded as a major driver which has significantinfluence on
implementation of Lean manufacturing. It refers to how JIT guides, supervises and controls
various dimension of a firm in an appropriate manner to achieve the objectives of Lean
manufacturing. The reliability test, Chronbach’s α value =0.804, which is more than 0.7. As the
value of α > 0.5, hence it can be concluded the items selected and the scale is reliable. After
reliability analysis the validity of construct items are checked using exploratory factor
analysis.The items of the JIT construct explain the structure validity as the value r>0.5. The
regression analysis further shows that JIT has a positive impact on firm performance.
Table 5.2: Summary of JIT focus and 9 models beta co-efficient
Scale ROI
Items having positive impact on ROI Items having negative impact on ROI
JIT Production is pulled by the current demand of the
next station (.201)
Supplier manage inventory
(-.058)
Use of Kanbans, squares, or containers as signals
(.145)
Pull production system (-.158)
Dimensions
Just in Time Employee
Involvement TPM Relationship with
partners Human Resource
Focus TQM
Lean
Implementation
Financial Indicators
for firm performance
Non-financial
Indicators for firm
performance
Page | 140
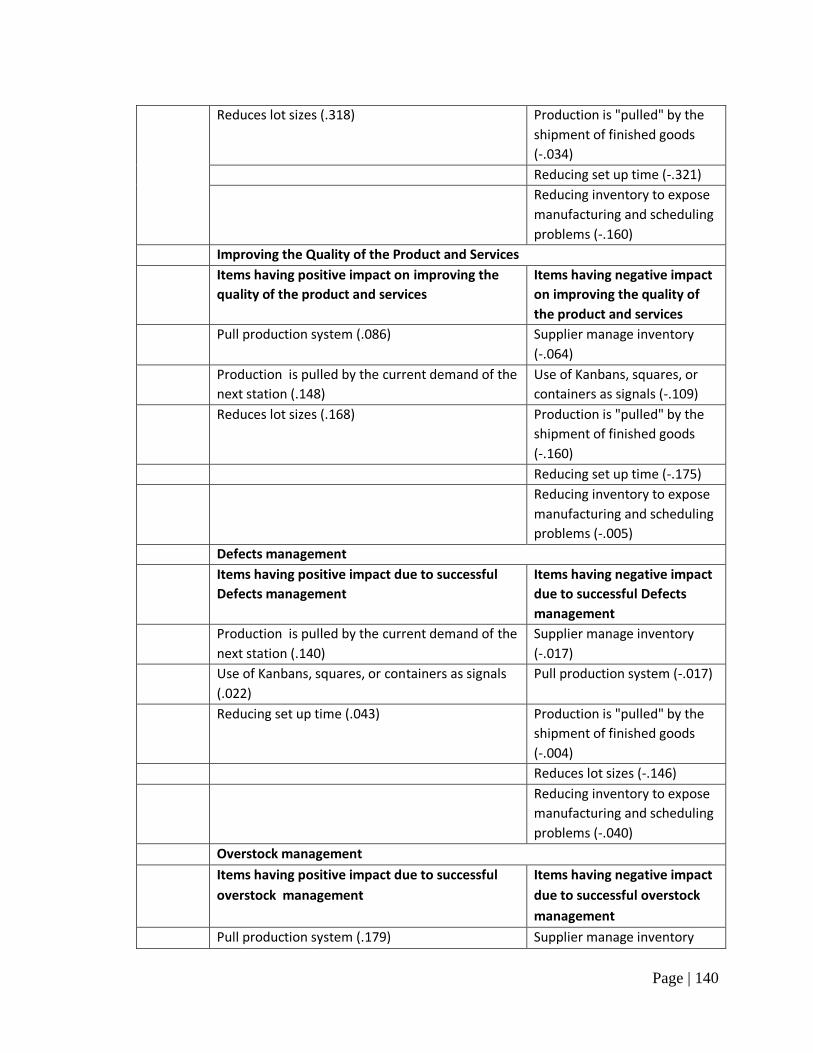
Reduces lot sizes (.318) Production is "pulled" by the
shipment of finished goods
(-.034)
Reducing set up time (-.321)
Reducing inventory to expose
manufacturing and scheduling
problems (-.160)
Improving the Quality of the Product and Services
Items having positive impact on improving the
quality of the product and services
Items having negative impact
on improving the quality of
the product and services
Pull production system (.086) Supplier manage inventory
(-.064)
Production is pulled by the current demand of the
next station (.148)
Use of Kanbans, squares, or
containers as signals (-.109)
Reduces lot sizes (.168) Production is "pulled" by the
shipment of finished goods
(-.160)
Reducing set up time (-.175)
Reducing inventory to expose
manufacturing and scheduling
problems (-.005)
Defects management
Items having positive impact due to successful
Defects management
Items having negative impact
due to successful Defects
management
Production is pulled by the current demand of the
next station (.140)
Supplier manage inventory
(-.017)
Use of Kanbans, squares, or containers as signals
(.022)
Pull production system (-.017)
Reducing set up time (.043) Production is "pulled" by the
shipment of finished goods
(-.004)
Reduces lot sizes (-.146)
Reducing inventory to expose
manufacturing and scheduling
problems (-.040)
Overstock management
Items having positive impact due to successful
overstock management
Items having negative impact
due to successful overstock
management
Pull production system (.179) Supplier manage inventory

Page | 141
(-.017)
Production is pulled by the current demand of the
next station (.042)
Use of Kanbans, squares, or
containers as signals (-.009)
Reducing set up time (.140) Production is "pulled" by the
shipment of finished goods
(-.255)
Reducing inventory to expose manufacturing and
scheduling problems (.110)
Reduces lot sizes (-.183)
Management of movement of products and services
Items having positive impact due to management
of movement of products and services
Items having negative impact
due to management of
movement of products and
services
Production is pulled by the current demand of the
next station (.089)
Supplier manage inventory
(-.198)
Production is "pulled" by the shipment of finished
goods
(.127)
Pull production system (-.076)
Reducing set up time (.376) Use of Kanbans, squares, or
containers as signals (-.273)
Reducing inventory to expose manufacturing and
scheduling problems (.340)
Reduces lot sizes (-.183)
Employee turnover
Items having positive impact on employee
turnover
Items having negative impact
on employee turnover
Supplier manage inventory
(.025)
Pull production system (-.171)
Production is pulled by the current demand of the
next station (.300)
Use of Kanbans, squares, or
containers as signals (-.055)
Production is "pulled" by the shipment of finished
goods
(.135)
Reduces lot sizes (-.387)
Reducing set up time (.125)
Reducing inventory to expose manufacturing and
scheduling problems (.063)
Customer satisfaction level
Items having positive impact on customer
satisfaction level
Items having negative impact
on customer satisfaction level
Supplier manage inventory
(.038)
Use of Kanbans, squares, or
containers as signals (-.029)
Pull production system (.187) Production is "pulled" by the

Page | 142
shipment of finished goods
(-.004)
Production is pulled by the current demand of the
next station (.065)
Reduces lot sizes (-.104)
Reducing set up time (-.169)
Reducing inventory to expose
manufacturing and scheduling
problems (-.280)
Productivity of the organization
Items having positive impact on productivity of
the organization
Items having negative impact
on productivity of the
organization
Production is pulled by the current demand of the
next station (.021)
Supplier manage inventory
(-.048)
Use of Kanbans, squares, or containers as signals (-
.084)
Pull production system (-.079)
Production is "pulled" by the shipment of finished
goods
(.114)
Reduces lot sizes (.138)
Reducing set up time (.050)
Reducing inventory to expose manufacturing and
scheduling problems (.018)
EBIDTA
Items having positive impact on EBIDTA Items having negative impact
on EBIDTA
Supplier manage inventory
(.030)
Pull production system (-.022)
Use of Kanbans, squares, or containers as signals
(.183)
Production is pulled by the
current demand of the next
station (-.193)
Production is "pulled" by the shipment of finished
goods
(.191)
Reduces lot sizes (-.139)
Reducing set up time (-.015)
Reducing inventory to expose
manufacturing and scheduling
problems (-.225)

Page | 143
It can be concluded that JIT is an important construct for successful implementation of Lean
which helps in improvement of ROI, QPS, Defects management, Overstock management,
Management of movement of products and services, Employee turnover, Customer satisfaction
level , Productivity of the organization & EBIDTA .
Where; ROI = return on investment, QPS= quality of products and services, EBIDTA= Earnings
before Interest, Depreciation, Taxation and Amortization.
Hypothesis 1: There is a positive relationship between the JIT and successful lean manufacturing
implementation.
The Table 4.41 shows that the beta co-efficient of JIT is 0.053 which is positive and statistically
significant. However the magnitude of beta co-efficient is weak.
Hence the hypothesis is supported
Employee Involvement: It refers to empower members of an organization tomake
decisions and to solve problems related to their level in the organization. The logic is that the
people closest to a problem or opportunity are in the best position to make decisions for
improvement, if they have control of the improvement of the process. As the value of
Chronbach’s α =0.669 and in case of inter item values of Chronbach’s α > 0, from which we
concludes that scale and selected items are reliable.. After reliability analysis the validity of
employee involvement items is checked using exploratory factor analysis (EFA).The
exploratory factor analysis shows that items of the employee involvement construct explain the
structure.
Table 5.3: Summary of Employee involvement focus and 9 models beta co-efficient
Scale ROI
Items having positive impact
on ROI
Items having negative impact
on ROI
Employee Involvement Shop floor employees key to
problem solving team(-.219)
Shop floor employees drive
suggestion program(-.047)
Shop floor employees lead
product/process improvement
efforts(-.012)
Improving the Quality of the Product and Services
Items having positive impact
on improving the quality of
Items having negative impact
on improving the quality of

Page | 144
the product and services the product and services
Shop floor employees drive
suggestion program(.063)
Shop floor employees key to
problem solving team(-.247)
Shop floor employees lead
product/process improvement
efforts(.053)
Defects management
Items having positive impact
due to successful Defects
management
Items having negative impact
due to successful Defects
management
Shop floor employees key to
problem solving team(.063)
Shop floor employees drive
suggestion program(-.013)
Shop floor employees lead
product/process improvement
efforts(.292)
Overstock management
Items having positive impact
due to successful overstock
management
Items having negative impact
due to successful overstock
management
Shop floor employees key to
problem solving team(.043)
Shop floor employees lead
product/process improvement
efforts(-.005)
Shop floor employees drive
suggestion program(.239)
Management of movement of products and services
Items having positive impact
due to management of
movement of products and
services
Items having negative impact
due to management of
movement of products and
services
Shop floor employees key to
problem solving team(.150)
Shop floor employees drive
suggestion program(-.260)
Shop floor employees lead
product/process improvement
efforts(.395)
Employee turnover
Items having positive impact
on employee turnover
Items having negative impact
on employee turnover
Shop floor employees lead Shop floor employees key to

Page | 145
product/process improvement
efforts(.383)
problem solving team(-.132)
Shop floor employees drive
suggestion program(-.156)
Customer satisfaction level
Items having positive impact
on customer satisfaction level
Items having negative impact
on customer satisfaction level
Shop floor employees key to
problem solving team(.005)
Shop floor employees drive
suggestion program(.120)
Shop floor employees lead
product/process improvement
efforts(.205)
Productivity of the organization
Items having positive impact
on productivity of the
organization
Items having negative impact
on productivity of the
organization
Shop floor employees drive
suggestion program(.171)
Shop floor employees key to
problem solving team(-.127)
Shop floor employees lead
product/process improvement
efforts(-.053)
EBIDTA
Items having positive impact
on EBIDTA
Items having negative impact
on EBIDTA
Shop floor employees lead
product/process improvement
efforts(.227)
Shop floor employees key to
problem solving team(-.075)
Shop floor employees drive
suggestion program(-.071)
The above table indicates that the employee involvement is very important dimension. It is
therefore concluded that hypothesis 2 is supported.
Hypothesis 2: There is a positive relationship between the employee involvement and successful
lean manufacturing implementation

Page | 146
The Table 4.41 shows that the beta co-efficient of Employee involvement is 0.078 which is
positive and statistically significant. However the magnitude of beta co-efficient is weak.
Hence the hypothesis is supported.
Total Productive Maintenance (TPM): It refers that the machine operator is trained to perform
many of the day-to-day tasks of simple maintenance and fault-finding. Teams are created that
include a technical expert such as an engineer, maintenance technician as well as operators. In
this setting the operators are enabled to understand the machinery and identify potential
problems, righting them before they can impact production and by so doing, decrease
downtime and reduce costs of production As the value of Chronbach’s α =0.848 and in case of
inter item values of Chronbach’s α > 0, from which we concludes that scale and selected items
are reliable.. After reliability analysis the validity of employee involvement items is checked
using exploratory factor analysis (EFA).The exploratory factor analysis shows that items of the
total productive maintenance construct explain the structure.
Table 5.4: Summary of TPM focus and 9 models beta co-efficient
Scale ROI
Items having positive impact
on ROI
Items having negative impact
on ROI
Total Productive
Maintenance
Emphasis on good
maintenance for achieving
quality & schedule(.010)
Records of routine
maintenance are kept(-.012)
Emphasis to compliance(.150)
Preventive maintenance(.263)
Improving the Quality of the Product and Services
Items having positive impact
on improving the quality of
the product and services
Items having negative impact
on improving the quality of
the product and services
Emphasis on good
maintenance for achieving
quality & schedule(.069)
Records of routine
maintenance are kept(-.060)
Emphasis to compliance(.129) Preventive maintenance(-
.035)
Defects management
Items having positive impact
due to successful Defects
Items having negative impact
due to successful Defects

Page | 147
management management
Emphasis on good
maintenance for achieving
quality & schedule(.006)
Emphasis to compliance(.151)
Records of routine
maintenance are kept(.217)
Preventive maintenance(.066)
Overstock management
Items having positive impact
due to successful overstock
management
Items having negative impact
due to successful overstock
management
Emphasis on good
maintenance for achieving
quality & schedule(.128)
Emphasis to compliance(-
.266)
Preventive maintenance(.186) Records of routine
maintenance are kept(-.012)
Management of movement of products and services
Items having positive impact
due to management of
movement of products and
services
Items having negative impact
due to management of
movement of products and
services
Emphasis on good
maintenance for achieving
quality & schedule(.029)
Emphasis to compliance(.205)
Records of routine
maintenance are kept(.016)
Preventive maintenance(.118)
Employee turnover
Items having positive impact
on employee turnover
Items having negative impact
on employee turnover
Emphasis to compliance(.241) Emphasis on good
maintenance for achieving
quality & schedule(-.113)
Records of routine
maintenance are kept(.128)

Page | 148
Preventive maintenance (.005)
Customer satisfaction level
Items having positive impact
on customer satisfaction level
Items having negative impact
on customer satisfaction
level
Emphasis to compliance(.036) Emphasis on good
maintenance for achieving
quality & schedule(-.131)
Preventive maintenance (.193) Records of routine
maintenance are kept (.-.216)
Productivity of the organization
Items having positive impact
on productivity of the
organization
Items having negative impact
on productivity of the
organization
Emphasis on good
maintenance for achieving
quality & schedule(.238)
Emphasis to compliance(.119)
Records of routine
maintenance are kept (.055)
Preventive maintenance (.065)
EBIDTA
Items having positive impact
on EBIDTA
Items having negative impact
on EBIDTA
Records of routine
maintenance are kept (.452)
Emphasis on good
maintenance for achieving
quality & schedule(-.099)
Preventive maintenance (.212) Emphasis to compliance(-
.057)
The above table indicates that the total productive maintenance is very important dimension. It
is therefore concluded that hypothesis 3 is supported.
Hypothesis 3: There is a positive relationship between the Total Productive Maintenance and
successful lean manufacturing implementation
The Table 4.41 shows that the beta co-efficient of Total Productive Maintenance is 0.139 which
is positive and statistically significant.

Page | 149
Hence the hypothesis is supported.
Relationship with partners: It ishow the organization plans, manages and involves itsexternal as
well as internal partners, in order to support its Quality policy strategy and also in defining their
role for effective operation of the processes. As the values of Chronbach’s α =0.795 which is
more than 0.7 and in case of inter items the value of Chronbach’s α is more than 0.5 from
which we concludes that scale and selected items are reliable. The exploratory factor analysis
shows that items of the Relationship with partners construct explain the structure.
Table 5.5: Summary of Relationship with partners focus and 9 models beta co-efficient
Scale ROI
Items having positive impact
on ROI
Items having negative impact
on ROI
Relationship with partners Customers are involved in
current and future product
offerings(.235)
Customers share current &
future demand information
with marketing(-.210)
customers give feedback on
quality and delivery
performance (.135)
Improving the Quality of the Product and Services
Items having positive impact
on improving the quality of
the product and services
Items having negative impact
on improving the quality of
the product and services
Customers are involved in
current and future product
offerings(.007)
Customers share current &
future demand information
with marketing(-.030)
customers give feedback on
quality and delivery
performance (-.175)
Defects management
Items having positive impact
due to successful Defects
management
Items having negative impact
due to successful Defects
management
Customers are involved in
current and future product
offerings(.119)
Customers share current &
future demand information
with marketing(-.220)
customers give feedback on
Page | 150
quality and delivery
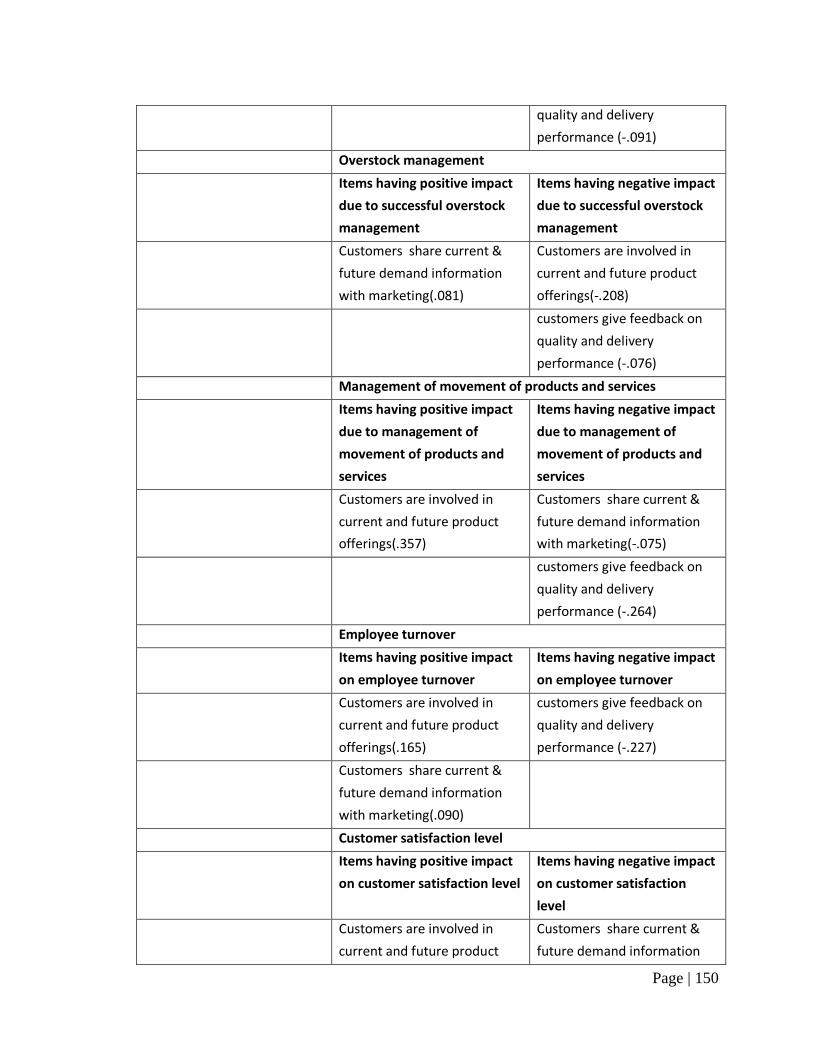
performance (-.091)
Overstock management
Items having positive impact
due to successful overstock
management
Items having negative impact
due to successful overstock
management
Customers share current &
future demand information
with marketing(.081)
Customers are involved in
current and future product
offerings(-.208)
customers give feedback on
quality and delivery
performance (-.076)
Management of movement of products and services
Items having positive impact
due to management of
movement of products and
services
Items having negative impact
due to management of
movement of products and
services
Customers are involved in
current and future product
offerings(.357)
Customers share current &
future demand information
with marketing(-.075)
customers give feedback on
quality and delivery
performance (-.264)
Employee turnover
Items having positive impact
on employee turnover
Items having negative impact
on employee turnover
Customers are involved in
current and future product
offerings(.165)
customers give feedback on
quality and delivery
performance (-.227)
Customers share current &
future demand information
with marketing(.090)
Customer satisfaction level
Items having positive impact
on customer satisfaction level
Items having negative impact
on customer satisfaction
level
Customers are involved in
current and future product
Customers share current &
future demand information
Page | 151
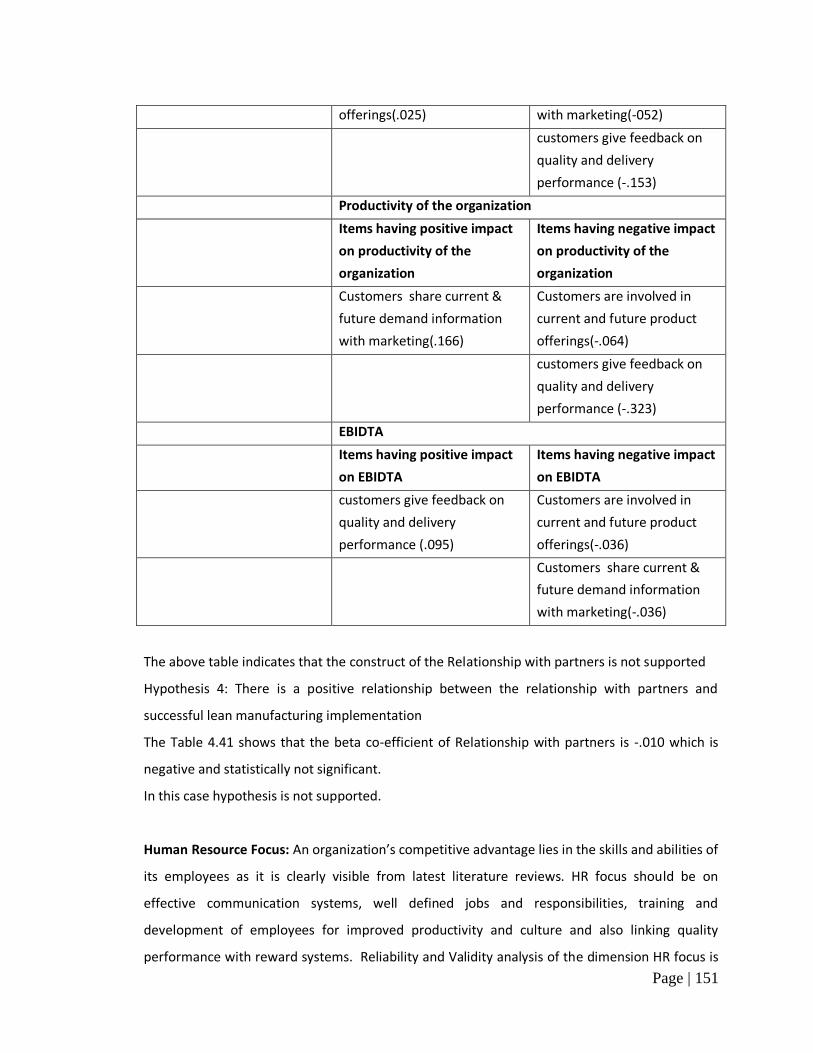
offerings(.025) with marketing(-052)
customers give feedback on
quality and delivery
performance (-.153)
Productivity of the organization
Items having positive impact
on productivity of the
organization
Items having negative impact
on productivity of the
organization
Customers share current &
future demand information
with marketing(.166)
Customers are involved in
current and future product
offerings(-.064)
customers give feedback on
quality and delivery
performance (-.323)
EBIDTA
Items having positive impact
on EBIDTA
Items having negative impact
on EBIDTA
customers give feedback on
quality and delivery
performance (.095)
Customers are involved in
current and future product
offerings(-.036)
Customers share current &
future demand information
with marketing(-.036)
The above table indicates that the construct of the Relationship with partners is not supported
Hypothesis 4: There is a positive relationship between the relationship with partners and
successful lean manufacturing implementation
The Table 4.41 shows that the beta co-efficient of Relationship with partners is -.010 which is
negative and statistically not significant.
In this case hypothesis is not supported.
Human Resource Focus: An organization’s competitive advantage lies in the skills and abilities of
its employees as it is clearly visible from latest literature reviews. HR focus should be on
effective communication systems, well defined jobs and responsibilities, training and
development of employees for improved productivity and culture and also linking quality
performance with reward systems. Reliability and Validity analysis of the dimension HR focus is

Page | 152
done. As the Chronbach’s α of Human Resource Focus is 0.822which is greater than 0.7 and
Chronbach’s α value of inter items is greater than 0.5, from which we can conclude that the
scale and selected items are reliable. The exploratory factor analysis shows that items of the
Human Resource Focus construct explain the structure.
Table 5.6: Summary of HR focus and 9 models beta co-efficient
Scale ROI
Items having positive impact
on ROI
Items having negative impact
on ROI
Human Resource Work and jobs are
designed, organized, and
managed to provide
opportunities for individual
initiative and self-directed
responsibility(.206)
Work and job are
designed to ensure
effective communications and
skill sharing (-.271)
Compensation and
recognition (.142)
Formal training programs
offered to employees for
promotability(-.080)
Education and training
activities structured to address
the knowledge and skills
employees need(.163)
Employees and their
manager give input in
designing education and
training activities(.141)
Education and training
activities are systematically
evaluated and
improved(.134)
Improving the Quality of the Product and Services
Items having positive impact
on improving the quality of
the product and services
Items having negative impact
on improving the quality of
the product and services
Work and jobs are
designed, organized, and
managed to provide
opportunities for individual
initiative and self-directed
Work and job are
designed to ensure
effective communications and
skill sharing (-.054)

Page | 153
responsibility(.559)
Compensation and
recognition (.006)
Employees and their
manager give input in
designing education and
training activities(-.048)
Education and training
activities structured to address
the knowledge and skills
employees need(.117)
Education and training
activities are systematically
evaluated and improved(-
.160)
Formal training programs
offered to employees for
promotability(.101)
Defects management
Items having positive impact
due to successful Defects
management
Items having negative impact
due to successful Defects
management
Work and jobs are
designed, organized, and
managed to provide
opportunities for individual
initiative and self-directed
responsibility(.038)
Compensation and
recognition (-.028)
Work and job are
designed to ensure
effective communications and
skill sharing (.140)
Education and training
activities are systematically
evaluated and improved(-
.316)
Education and training
activities structured to address
the knowledge and skills
employees need(.036)
Formal training programs
offered to employees for
promotability(-.121)
Employees and their
manager give input in
designing education and
training activities(.237)
Overstock management
Items having positive impact
due to successful overstock
management
Items having negative impact
due to successful overstock
management
Work and job are
designed to ensure
effective communications and
Work and jobs are
designed, organized, and
managed to provide

Page | 154
skill sharing (.407) opportunities for individual
initiative and self-directed
responsibility(-.091)
Education and training
activities structured to address
the knowledge and skills
employees need(.043)
Compensation and
recognition (-.077)
Formal training programs
offered to employees for
promotability(.306)
Employees and their
manager give input in
designing education and
training activities(-.206)
Education and training
activities are systematically
evaluated and improved(-
.240)
Management of movement of products and services
Items having positive impact
due to management of
movement of products and
services
Items having negative impact
due to management of
movement of products and
services
Work and jobs are
designed, organized, and
managed to provide
opportunities for individual
initiative and self-directed
responsibility(.265)
Work and job are
designed to ensure
effective communications and
skill sharing (-.072)
Employees and their
manager give input in
designing education and
training activities(.403)
Compensation and
recognition (-.052)
Education and training
activities are systematically
evaluated and
improved(.067)
Education and training
activities structured to
address the knowledge and
skills employees need(-.441)
Formal training programs
offered to employees for
promotability(-.036)
Employee turnover
Items having positive impact
on employee turnover
Items having negative impact
on employee turnover
Work and jobs are Work and job are

Page | 155
designed, organized, and
managed to provide
opportunities for individual
initiative and self-directed
responsibility(.412)
designed to ensure
effective communications and
skill sharing (-.390)
Compensation and
recognition (.002)
Education and training
activities structured to address
the knowledge and skills
employees need(.113)
Employees and their
manager give input in
designing education and
training activities(.054)
Education and training
activities are systematically
evaluated and
improved(.194)
Formal training programs
offered to employees for
promotability(.007)
Customer satisfaction level
Items having positive impact
on customer satisfaction level
Items having negative impact
on customer satisfaction level
Work and jobs are
designed, organized, and
managed to provide
opportunities for individual
initiative and self-directed
responsibility(.381)
Work and job are
designed to ensure
effective communications and
skill sharing (-.141)
Education and training
activities structured to address
the knowledge and skills
employees need(.305)
Compensation and
recognition (-.022)
Formal training programs
offered to employees for
promotability(.113)
Employees and their
manager give input in
designing education and
training activities(-.198)
Education and training
activities are systematically
Page | 156
evaluated and improved(-
.025)
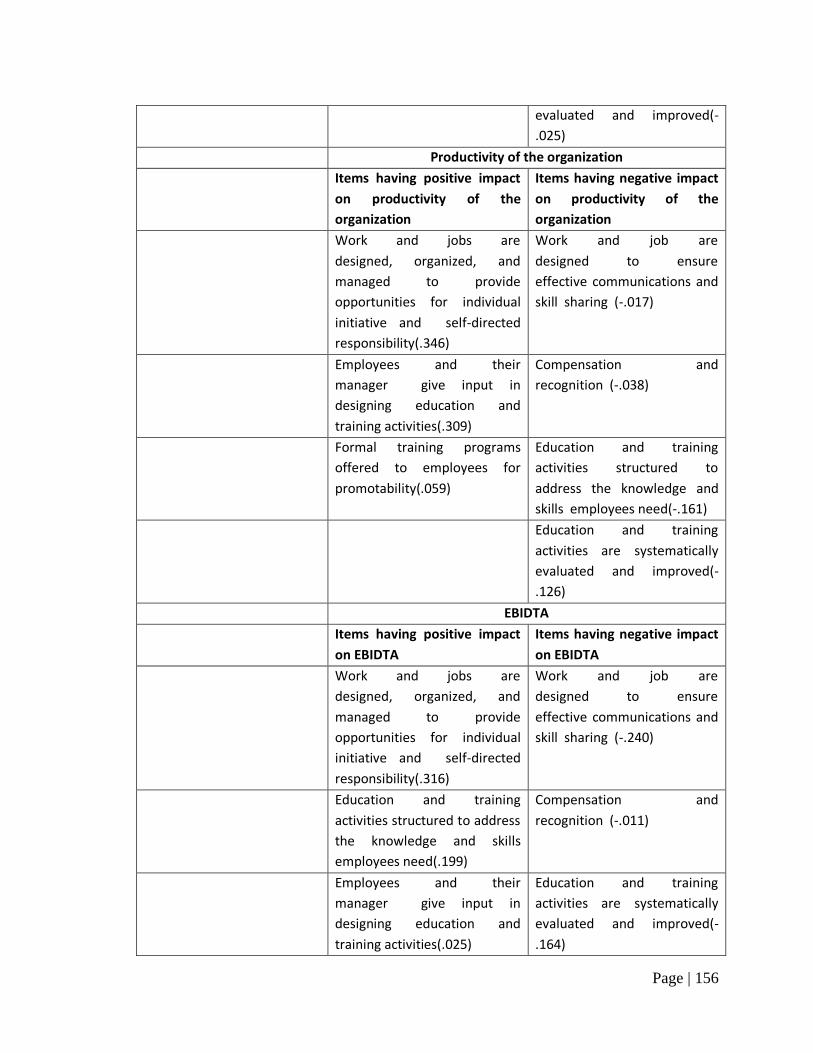
Productivity of the organization
Items having positive impact
on productivity of the
organization
Items having negative impact
on productivity of the
organization
Work and jobs are
designed, organized, and
managed to provide
opportunities for individual
initiative and self-directed
responsibility(.346)
Work and job are
designed to ensure
effective communications and
skill sharing (-.017)
Employees and their
manager give input in
designing education and
training activities(.309)
Compensation and
recognition (-.038)
Formal training programs
offered to employees for
promotability(.059)
Education and training
activities structured to
address the knowledge and
skills employees need(-.161)
Education and training
activities are systematically
evaluated and improved(-
.126)
EBIDTA
Items having positive impact
on EBIDTA
Items having negative impact
on EBIDTA
Work and jobs are
designed, organized, and
managed to provide
opportunities for individual
initiative and self-directed
responsibility(.316)
Work and job are
designed to ensure
effective communications and
skill sharing (-.240)
Education and training
activities structured to address
the knowledge and skills
employees need(.199)
Compensation and
recognition (-.011)
Employees and their
manager give input in
designing education and
training activities(.025)
Education and training
activities are systematically
evaluated and improved(-
.164)

Page | 157
Formal training programs
offered to employees for
promotability(-.036)
This clearly suggests that overall HR has positive impact on firm performance but most
of the HR aspects needed to be paid more attention. The recognition of employees and
compensations are important aspects that need to be focused upon. The Quality of Product &
Services and Successful Overstock Management are two important parameters which reflect the
level of motivation of employees engaged with CFAs and Wholesalers.
Hypothesis 5: There is a positive relationship between the Human Resource focus and
successful lean manufacturing implementation
The Table 4.41 shows that the beta co-efficient of Employee involvement is 0.128 which is
positive and statistically significant.
Hence the hypothesis is supported
Total Quality Management: It refers that the quality of products and processes is the
responsibility of everyone involved with the creation or consumption of the products or services
offered by an organization, requiring the involvement of management, workforce, suppliers, and
customers, to meet or exceed customer expectations. Cua, McKone, and Schroeder (2001)
identified nine common TQM practices as cross-functional product design, process
management, supplier quality management, customer involvement, information and feedback,
committed leadership, strategic planning, cross-functional training & employee involvement.
Reliability and Validity analysis of the dimension TQM focus is done. As the Chronbach’s α of
TQM Focus is 0.937which is greater than 0.7 and Chronbach’s α value of inter items is greater
than 0.5, from which we can conclude that the scale and selected items are reliable. The
exploratory factor analysis shows that items of the Total Quality Management construct explain
the structure. The regression analysis further shows that the human resource focus has positive
impact on ROI,EBIDTA,WR and has negative impact on QPS and OSM, as shown in the tabulated
form:
Table 5.7: Summary of TQM focus and 9 models beta co-efficient
Scale ROI
Items having positive impact on ROI Items having negative impact on
ROI

Page | 158
Total Quality
Management
TQM brings manufacturability and assembly in
product design(.225)
TQM helps in modular design of
component parts(-.505)
Inspection rate per lot increases(.003) TQM brings designing quality
into the product(-.094)
Focuses on benchmark data(.227) TQM helps in process
improvement(-.285)
Helps in Simplifying the product(.362) TQM helps in employee training
in quality management and
control
(-.132)
TQM uses standard components(.170) Top management
communication of quality goals
to the organization (-.123)
TQM Empower shop operators to correct quality
problems(.316)
TQM emphasizing quality instead
of price in supplier selection(-
.077)
TQM uses Quality Function Deployment(.416) TQM considers quality in
supplier evaluation(-.178)
TQM considers commitment to continuous
improvement in supplier selection(.261)
TQM considers commitment to
quality in supplier selection(-
.199)
TQM considers process
capability in supplier selection(-
.018)
Improving the Quality of the Product and Services
Items having positive impact on improving the
quality of the product and services
Items having negative impact on
improving the quality of the
product and services
Focuses on benchmark data(.249) TQM helps in modular design of
component parts(-.109)
Helps in Simplifying the product(.507) TQM brings designing quality
into the product(-.148)
TQM uses standard components(.066) TQM brings manufacturability
and assembly in product design
(-.044)
TQM Empower shop operators to correct quality
problems(.046)
Inspection rate per lot
increases(-.167)
TQM uses Quality Function Deployment(.352) TQM helps in process

Page | 159
improvement(-.128)
TQM considers quality in supplier evaluation(.106) TQM helps in employee training
in quality management and
control
(-.082)
TQM considers commitment to quality in supplier
selection(.025)
Top management
communication of quality goals
to the organization (-.080)
TQM considers commitment to continuous
improvement in supplier selection(.339)
TQM emphasizing quality instead
of price in supplier selection(-
.035)
TQM considers process
capability in supplier selection(-
.221)
Defects management
Items having positive impact due to successful
Defects management
Items having negative impact
due to successful Defects
management
TQM brings manufacturability and assembly in
product design (.198)
TQM helps in modular design of
component parts(-.244)
Focuses on benchmark data(.411) TQM brings designing quality
into the product(-.028)
TQM uses standard components(.090) Inspection rate per lot
increases(-.211)
TQM helps in employee training in quality
management and control
(.257)
Helps in Simplifying the
product(-.077)
TQM Empower shop operators to correct quality
problems(.029)
TQM helps in process
improvement(-.200)
Top management communication of quality goals
to the organization (.095)
TQM considers quality in
supplier evaluation(-.041)
TQM emphasizing quality instead of price in
supplier selection(271)
TQM considers commitment to
continuous improvement in
supplier selection(-.332)
TQM uses Quality Function Deployment(.059))
TQM considers commitment to quality in supplier
selection(.040)
TQM considers process capability in supplier
selection(.139)
Overstock management
Items having positive impact due to successful Items having negative impact
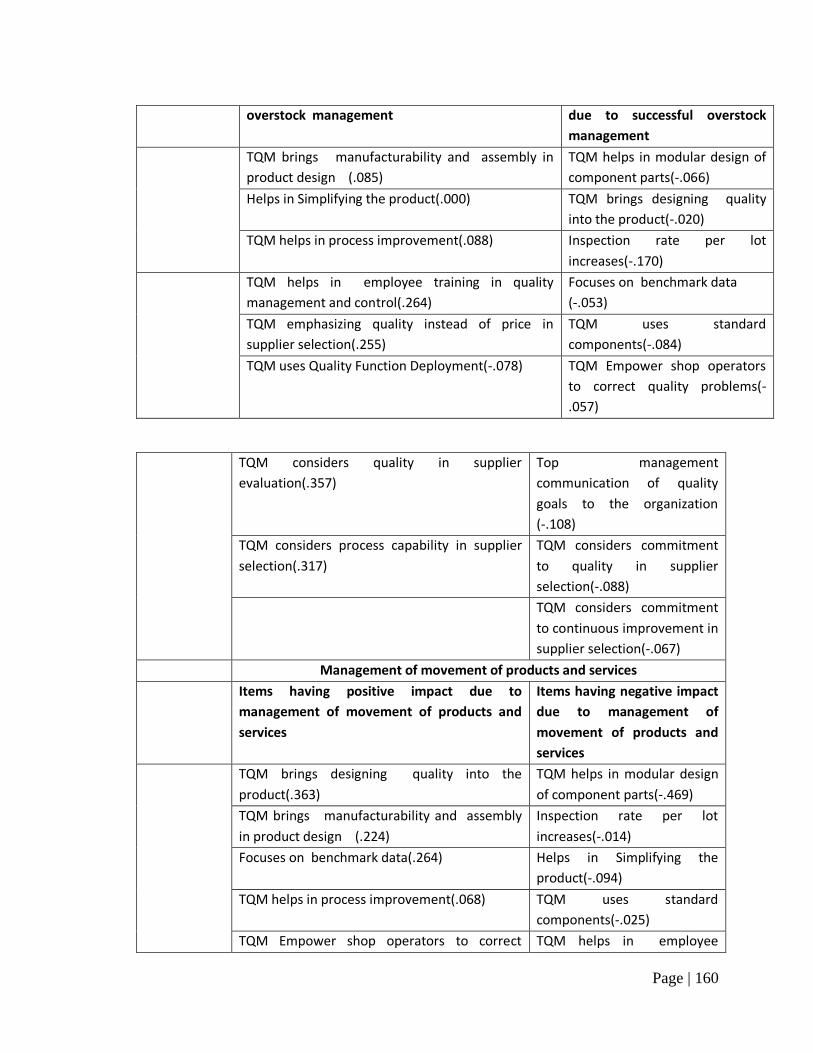
Page | 160
overstock management due to successful overstock
management
TQM brings manufacturability and assembly in
product design (.085)
TQM helps in modular design of
component parts(-.066)
Helps in Simplifying the product(.000) TQM brings designing quality
into the product(-.020)
TQM helps in process improvement(.088) Inspection rate per lot
increases(-.170)
TQM helps in employee training in quality
management and control(.264)
Focuses on benchmark data
(-.053)
TQM emphasizing quality instead of price in
supplier selection(.255)
TQM uses standard
components(-.084)
TQM uses Quality Function Deployment(-.078) TQM Empower shop operators
to correct quality problems(-
.057)
TQM considers quality in supplier
evaluation(.357)
Top management
communication of quality
goals to the organization
(-.108)
TQM considers process capability in supplier
selection(.317)
TQM considers commitment
to quality in supplier
selection(-.088)
TQM considers commitment
to continuous improvement in
supplier selection(-.067)
Management of movement of products and services
Items having positive impact due to
management of movement of products and
services
Items having negative impact
due to management of
movement of products and
services
TQM brings designing quality into the
product(.363)
TQM helps in modular design
of component parts(-.469)
TQM brings manufacturability and assembly
in product design (.224)
Inspection rate per lot
increases(-.014)
Focuses on benchmark data(.264) Helps in Simplifying the
product(-.094)
TQM helps in process improvement(.068) TQM uses standard
components(-.025)
TQM Empower shop operators to correct TQM helps in employee

Page | 161
quality problems(.130) training in quality
management and control
(-.145)
TQM considers commitment to quality in
supplier selection(.511)
Top management
communication of quality
goals to the organization
(-.064)
TQM considers process capability in supplier
selection(.238)
TQM emphasizing quality
instead of price in supplier
selection(-.093)
TQM uses Quality Function
Deployment(-.204)
TQM considers quality in
supplier evaluation(-.210)
TQM considers commitment
to continuous improvement in
supplier selection(-.451)
Employee Turnover
Items having positive impact on employee
turnover
Items having negative impact
on employee turnover
TQM helps in modular design of component
parts(.000)
Focuses on benchmark data
(-.102)
TQM brings designing quality into the
product(.222)
TQM uses standard
components(-.080)
TQM brings manufacturability and assembly
in product design (.292)
TQM helps in process
improvement(-.736)
Inspection rate per lot increases(.027) TQM helps in employee
training in quality
management and control
(-.079)
Helps in Simplifying the product(.356) TQM Empower shop
operators to correct quality
problems(-.186)
Top management communication of quality
goals to the organization .030)
TQM emphasizing quality
instead of price in supplier
selection(-.493)
TQM uses Quality Function Deployment(.187) TQM considers quality in
supplier evaluation(-.220)
TQM considers commitment to quality in
supplier selection(.398)
TQM considers process capability in supplier

Page | 162
selection(.037)
TQM considers commitment to continuous
improvement in supplier selection(.209)
Customer satisfaction level
Items having positive impact on customer
satisfaction level
Items having negative impact
on customer satisfaction level
TQM helps in modular design of component
parts(.087)
TQM brings designing quality
into the product(-.036)
Focuses on benchmark data
(.090)
TQM brings
manufacturability and
assembly in product design
(-.101)
Helps in Simplifying the product(.095) Inspection rate per lot
increases(-.039)
TQM uses standard components(.203) TQM helps in process
improvement(-.141)
TQM helps in employee training in quality
management and control
(.077)
TQM Empower shop
operators to correct quality
problems(-.185)
Top management communication of quality
goals to the organization .183)
TQM emphasizing quality
instead of price in supplier
selection(-.014)
TQM uses Quality Function Deployment(.489) TQM considers commitment
to quality in supplier
selection(-.447)
TQM considers quality in supplier
evaluation(.337)
TQM considers process
capability in supplier
selection(-.075)
TQM considers commitment to continuous
improvement in supplier selection(.356)
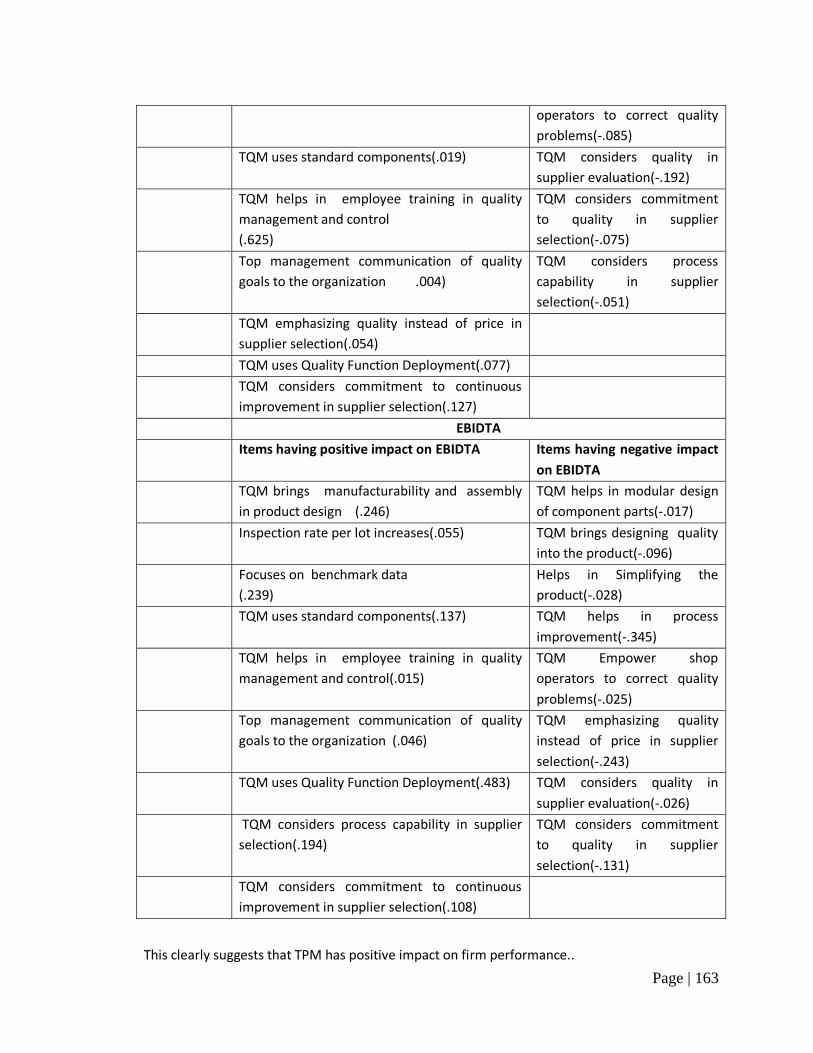
Productivity of the organization
Items having positive impact on productivity
of the organization
Items having negative impact
on productivity of the
organization
TQM brings designing quality into the
product(.060)
TQM helps in modular design
of component parts(-.172)
TQM brings manufacturability and assembly
in product design (.091)
Inspection rate per lot
increases(-.266)
Focuses on benchmark data
(.387)
TQM helps in process
improvement(-.248)
Helps in Simplifying the product(.006) TQM Empower shop
Page | 163
operators to correct quality
problems(-.085)
TQM uses standard components(.019) TQM considers quality in
supplier evaluation(-.192)
TQM helps in employee training in quality
management and control
(.625)
TQM considers commitment
to quality in supplier
selection(-.075)
Top management communication of quality
goals to the organization .004)
TQM considers process
capability in supplier
selection(-.051)
TQM emphasizing quality instead of price in
supplier selection(.054)
TQM uses Quality Function Deployment(.077)
TQM considers commitment to continuous
improvement in supplier selection(.127)
EBIDTA
Items having positive impact on EBIDTA Items having negative impact
on EBIDTA
TQM brings manufacturability and assembly
in product design (.246)
TQM helps in modular design
of component parts(-.017)
Inspection rate per lot increases(.055) TQM brings designing quality
into the product(-.096)
Focuses on benchmark data
(.239)
Helps in Simplifying the
product(-.028)
TQM uses standard components(.137) TQM helps in process
improvement(-.345)
TQM helps in employee training in quality
management and control(.015)
TQM Empower shop
operators to correct quality
problems(-.025)
Top management communication of quality
goals to the organization (.046)
TQM emphasizing quality
instead of price in supplier
selection(-.243)
TQM uses Quality Function Deployment(.483) TQM considers quality in
supplier evaluation(-.026)
TQM considers process capability in supplier
selection(.194)
TQM considers commitment
to quality in supplier
selection(-.131)
TQM considers commitment to continuous
improvement in supplier selection(.108)
This clearly suggests that TPM has positive impact on firm performance..

Page | 164
Hypothesis6: There is a positive relationship between TQM and successful lean manufacturing
implementation
The Table 4.41 shows that the beta co-efficient of Total quality management is 0.629 which is
positive and statistically significant.
Hence the hypothesis is supported
5.4 Improvement Plan and Recommendations for Indian Manufacturing Companies:
A number of recommendations can be made out of the present study. These
recommendations would be insightful for the Indian manufacturing industries, not only those
who have successfully implemented lean but also to those who are in the process of
implementation. These recommendations are as follows:
Manufacturing firms in India must advocate JIT philosophy which helps to
minimize wastages and aims for continuous improvement. However JIT has
its own limitations which must be considered while implementing JIT as what
we can infer from regression output (refer Table ), that use of SMED or VMI
is not supported though literature suggest that SMED and VMI approach has
helped firms to achieve high performance. In India except automotive sector,
others are yet to implement VMI or implement JIT2 which is critical for firm
to achieve superior performance.
Employee involvement is one of the pillar of world class manufacturing firms
(Schonberger, 1986).However though Indian manufacturing firms has adopted
these practices but the survey findings suggest that empowerment which is
one of the important dimension of employee involvement is misunderstood by
Indian corporate. The employees though encouraged providing their
suggestions for improvement but findings suggest that there is lack of
transparency in the system which discourages employee to provide their true
feedbacks. Most of the Indian firms follow bureaucratic structure.
TPM is key to lean implementation in Indian manufacturing firms which
promotes self discipline and aims to minimize equipment failures and improve

Page | 165
reliability of the system. Strict adherence to compliance and routine
maintenance activities help to improve performance.
Relationship with partners in present study is not supported which suggest that
Indian manufacturing firms has failed to recognize the importance of
customers in product offerings, product development or product design.
Human resource focus is an important function to lean implementation.
Training & development, compensation, communication & reward are
regarded to be most important dimensions of human resource focus in
successful implementation of lean. Manufacturing companies must invest on
training & development activities & duly reward champions who produce
excellence.
The findings of study suggest that firms who have implemented TQM have
successfully implemented JIT. It is a philosophy which aims to reduce defects
and improve product quality.TQM is achieved through involvement of all
stakeholders from sourcing to supplier’s selection to delivery of raw materials
to final conversion and distribution of finished goods to the customers or end
users.
5.5 Research contributions:
In an attempt to achieve the four research objectives, this study has made two specific
contributions that resulted from meeting these four objectives are discussed in the following
sections.
5.6.1 To understand the level of awareness of the lean manufacturing practices in Indian
manufacturing sector
The present study integrates several dimensions of lean manufacturing and impacts of these
dimensions on successful implementation of Lean tools in Indian Manufacturing Industry. On
the basis of the discussion in the literature review section and the synthesis of the existing
literature, conceptual framework is proposed (refer to Figure 3.3). The two main components
that constitute the conceptual framework include the dimensions of Lean manufacturing and
implementation of Lean which will be measured in terms of firm performance variables.
5.6.2 To identify the dimensions that constitute lean manufacturing practices;

Page | 166
Based on discussions in the literature review section researcher identified the
dimensions and the items for each dimension are selected so that the existing gap in the
available literature can be effectively reduced.
5.6.3 To propose and validate a research model testing dimensions of lean
manufacturing and firm performance;
.
A research model is proposed showing the relationship between identified dimensions
of Lean viz. JIT, Employee involvement, Total Productive Maintenance, HR focus, relationship
with partners and Total Quality Management with firm performance.
The model is statistically significant.
Figure 5.2: Conclusive Research Framework
Here variable Relationship with partners does not support the model.
5.6.4 To provide recommendations to provide a checklist to help firms to implement
lean manufacturing practices
The variables like Just in Time, employee involvement, total productive maintenance, total
quality management positively support outcome variable, while relationship with partners is
not supported in present study. The firm should focus on strengthening their relationship with
partners to leverage maximum benefit from lean implementation. It is recommended that
Just in Time
Employee
Involvement
Total Productive
Maintenance
Relationship with
partner
Human Resource
Focus
Total Quality
Management
Lean
Implementation
Firm
Performance

Page | 167
Indian manufacturing firms must involve customers in product design and development phase.
The findings of the study reveals that JIT is not strongly supporting which is due to incomplete
understandings of JIT among Indian manufacturing firms.JIT has strong impact when supply and
demand uncertainty is low, however when supply or demand uncertainty is high then JIT is not
applicable which is the serious limitations of JIT manufacturing.
5.6 Limitations of the present study:
In the area of social science, research is considered more complex in comparison to
research in other areas due to the presence of uncontrolled environment where high
interaction of overlapping and interrelated variables, exists (Srivastava & Singh, 2010).So in
spite of putting every possible efforts a social science research is subject to certain limitations
which certainly paves the ground for future research. The present research also has its own
limitations which are as follows:
Studies on samples are seldom conducted without any intention to generalize the
results to the whole population to which the samples belong (Cooper and
Schindler, 2001). Generally, not all sampling techniques allow this generalization.
The most known, comprehensive and pervasive technique is perhaps the simple
random sampling in which each possible sample of a given size is equally like to
be the one selected (Newbold, 1999). Thus inherent limitation of the sampling
design exists.
Here in the present survey perceptual performance was used in the study instead
of objective measure. Although previous studies showed a positive association
between objective and perceptual performance (Geringer and Hebert, 1991;
Powell, 1992), the latter is not able to fully reflect the real firm performance.
The data collection was done within Indian manufacturing industry. Though care
was taken to define values as specific to Indian manufacturing industry, the
extrapolation of conclusion drawn within the Indian manufacturing industry
The validity of the findings regarding the relationship between six dimensions of
lean and firm performance may be limited by the fact that data on six dimensions
of lean and firm performance were collected at a particular time. Consequently,
the direction of causality between the two cannot be specified definitely.
However, causality cannot be established without longitudinal data. Future

Page | 168
research effort is urged to collect longitudinal data to confirm the causal
relationship between six dimensions of lean and firm performance.
Firm performance may be affected by various other external variables not
accounted for in this study. It would be beneficial to examine firm performance
by taking external conditions like the economic and legal situation into account.
5.7 Managerial Implications:
The research provides an immense scope to Indian manufacturing industry to maximize
the benefit from lean implementation. Most of the time we find managers often complain that
company is wrongly investing without any return to the company, it is probably because
dimensions of lean which are primarily intangible components are ignored most of the time.
Lean will deliver result only when employees are given right direction, top authority takes deep
interest, employees are empowered, team members are recognized and rewarded for their
performance, culture of excellence and environment where every member are involved in
decision making process.
5.8 Future research directions:
While this study was able to provide additional insight into six dimensions of lean and its
relationship with firm performance, it also revealed areas that would benefit from further
research. First, this study focused only on six dimensions of lean in Indian manufacturing
industry. Future research could thus focus on the other dimensions such as ethics and values,
SCM..By doing so, a better and fuller understanding on the effects of lean on firm performance
may be achieved. Second, there is a strong need for longitudinal research. A longitudinal
analysis of companies over time would provide data to address at least two research questions:
(1) is there a time lag between investing in lean and achieving an expected performance, and (
2) is there a particular order in which these investments should be made. There is a need for
further study on the influence of different external variables on firm performance. It certainly
takes time to undertake any change from the past. So there is an important need to investigate
the differences in the future when managers had enough time to change their management
styles. Finally, to be able to generalize the results of this study future research might be
extended to other industries like service and to other countries both developing and
industrialized.
This chapter presented conclusion, recommendations and contributions of the research study.
Page | 169
Conclusions were drawn on the basis of findings derived with the analytical tools, and also in
reference to research questions concluded through literature review. The outcome framework is
presented. Observations and insight of the researcher were also duly included in the conclusion.
Subsequently recommendations were given and at the end research, contributions, limitations,
managerial implications and future scope of this study were elaborated.


![Index [assets.cambridge.org]assets.cambridge.org/97805218/38771/index/9780521838771_index.pdf · Index Abdullah, Emir, ... 0521838770 - Hitler, the Allies, and the Jews Shlomo Aronson](https://img.dokumen.tips/doc/110x75/5b0a2ccd7f8b9a604c8c0b8b/index-abdullah-emir-0521838770-hitler-the-allies-and-the-jews-shlomo.jpg)